Article

An Advanced Exergoeconomic Comparison of CO2-Based Transcritical Refrigeration Cycles

by
J. M. Belman-Flores
1,
V. H. Rangel-Hernández
1,2,*,
V. Pérez-García
1,
A. Zaleta-Aguilar
1,
Qingping Fang
2 and
D. Méndez-Méndez
1
1
Department of Mechanical Engineering, Engineering Division, Campus Irapuato-Salamanca, University of Guanajuato, Guanajuato 36885, Mexico
2
Institute of Energy and Climate Research, Forschungszentrum Jülich GmbH, 52425 Jülich, Germany
*
Author to whom correspondence should be addressed.
Energies 2020, 13(23), 6454; https://doi.org/10.3390/en13236454
Submission received: 4 November 2020 / Revised: 1 December 2020 / Accepted: 3 December 2020 / Published: 6 December 2020
(This article belongs to the Special Issue Global Progress on Exergetic Cost Analysis)

Abstract

:
CO2-based transcritical refrigeration cycles are currently gaining significant research attention, as they offer a viable solution to the use of natural refrigerants (e.g., CO2). However, there are almost no papers that offer an exergoeconomic comparison between the different configurations of these types of systems. Accordingly, the present work deals with a comparative exergoeconomic analysis of four different CO2-based transcritical refrigeration cycles. In addition, the work is complemented by an analysis of the CO2 abatement costs. The influences of the variation of the evaporating temperature, the gas cooler outlet temperature, and the pressure ratio on the exergy efficiency, product cost rate, exergy destruction cost rate, exergoeconomic factor, and CO2 penalty cost rate are compared in detail. The results show that the transcritical cycle with the ejector has the lowest exergetic product cost and a low environmental impact.

1. Introduction

Carbon dioxide (CO2) is a natural refrigerant that in past decades has been widely used in compression refrigeration systems due to its low cost, low global warming potential, zero ozone depletion potential, and non-flammability. Carbon dioxide can be used in refrigeration processes such as cascade systems and in transcritical systems. When transcritical CO2 is operated at high ambient temperatures, its energy performance is low by comparison to conventional hydrofluorocarbon refrigerants due to its thermodynamic properties. As a result, several researchers have conducted studies in an effort to improve the energy performance [1,2], considering that the throttling phase through which a refrigerant passes causes the greatest loss of work [3], amongst other factors. Therefore, in order to reduce the irreversibilities in the expansion of a refrigerant, a common modification is the use of a turbine or an ejector as a throttling device instead of a conventional valve. This has been shown to increase the energy performance in a cycle, either through an increase in the cooling capacity or by a decrease in the compressor’s power consumption. Elbel and Hrnjak [4] experimentally evaluated a transcritical CO2 refrigeration system with an ejector and achieved improvements in the coefficient of performance (COP) for a basic cycle with an expansion valve. The increase in the COP obtained in the study was 7%, which also reduced the irreversibilities in the throttling to about 14.5%. Kursad and Nagihan [5] evaluated the irreversibilities in a transcritical cycle with an ejector and compared them to the turbine cycle and expansion valve systems. The results showed that the irreversibilities of the ejector system were reduced to 39.1% and 5.46% in comparison to basic and turbine–expander systems, respectively. A variety of reviews in the literature summarize the use of ejectors as expansion devices in the transcritical cycle [6,7]. Therefore, various papers show that energy improvements are produced by an ejector when it is included in the transcritical refrigeration cycle.
The use of a turbine as an expansion device produces a reduction in the compressor’s energy consumption. For example, Yang et al. [8] found that when using a turbine, the respective COP and exergy efficiency were, on average, 33% and 30% superior to those obtained with an expansion valve. In this regard, most of the studies on transcritical CO2 refrigeration systems have used a turbine and have reported improvements in the COP of greater than 30% [9]. Another common modification to the refrigeration cycle is the integration of an internal heat exchanger (IHX), the purpose of which is to increase the energy performance of the cycle by improving its cooling capacity. For instance, Boewe et al. [10] conducted an experimental study consisting of 178 tests for a prototype transcritical refrigeration system and found a substantial improvement of 25% by incorporating an IHX into the cycle. Meanwhile, Wang et al. [11] used an IHX in the transcritical refrigeration cycle and concluded that the IHX produced relatively low power in the compressor when the high-pressure side was over 100 bar and the evaporation temperature was under 0 °C. Nilesh et al. [12] experimentally determined that through the use of an IHX in a transcritical cycle, the COP and exergy efficiency could be increased by 5.71% and 5.05%, respectively, at a room temperature of 45 °C and an evaporation temperature of −5 °C.
On the other hand, exergoeconomic analysis, based on thermodynamic analysis, is a tool intended to diagnose, improve, and optimize the design and operation of an energy system [13,14]. In the case of refrigeration systems, the exergoeconomics is used to estimate the total cost of cold production, and can also be used to optimize energy systems [15]. Various studies can be found in the literature on transcritical systems in which exergy and exergoeconomic analyses were conducted [16,17,18]. For example, Gullo and Cortella [19] conducted a comparative study of different configurations in supermarkets, with an emphasis on the use of an ejector as an expansion device. Their results showed that implementing an ejector reduced the final cost of the product by 22.7% in comparison to the basic cycle, which traditionally utilizes an expansion valve. This result was achieved for medium-temperature refrigeration in the range of 30–42 °C. Nilesh et al. [20] conducted a comparative study of five transcritical configurations and found that the highest annual energy saving was 22.16% for a parallel compression configuration when using an expander in the throttling stage.
On the basis of the above, several studies have proposed improvements in the COP of transcritical refrigeration systems and have carried out exergy and exergoeconomic analyses with certain configurations of the transcritical cycle. In this article, a broader and more representative exergy and exergoeconomic study are shown by including four transcritical cycle configurations. The objective is to define the exergy destruction cost, exergy efficiency, unit exergy cost of the product, CO2 cost rate, and exergoeconomic factor for a basic cycle, ejector cycle, turbine cycle and internal heat exchanger cycle. The analysis was performed by varying the parameters, namely the gas cooler outlet temperature, evaporating temperature and pressure ratio. An in-depth discussion of the results is then provided to support the conclusions of the study.

2. System Configurations and Assumptions

2.1. Description of the Configurations

As noted above, four different configurations of the CO2-based transcritical refrigeration cycles were analyzed, namely: (a) the basic cycle; (b) a cycle with an internal heat exchanger; (c) a cycle with a turbine; (d) a cycle with an ejector. Table 1 presents the operating conditions under which the four mentioned configurations were simulated. Most of the operating conditions were drawn from [1] and represent the conditions in refrigeration applications at medium temperatures.
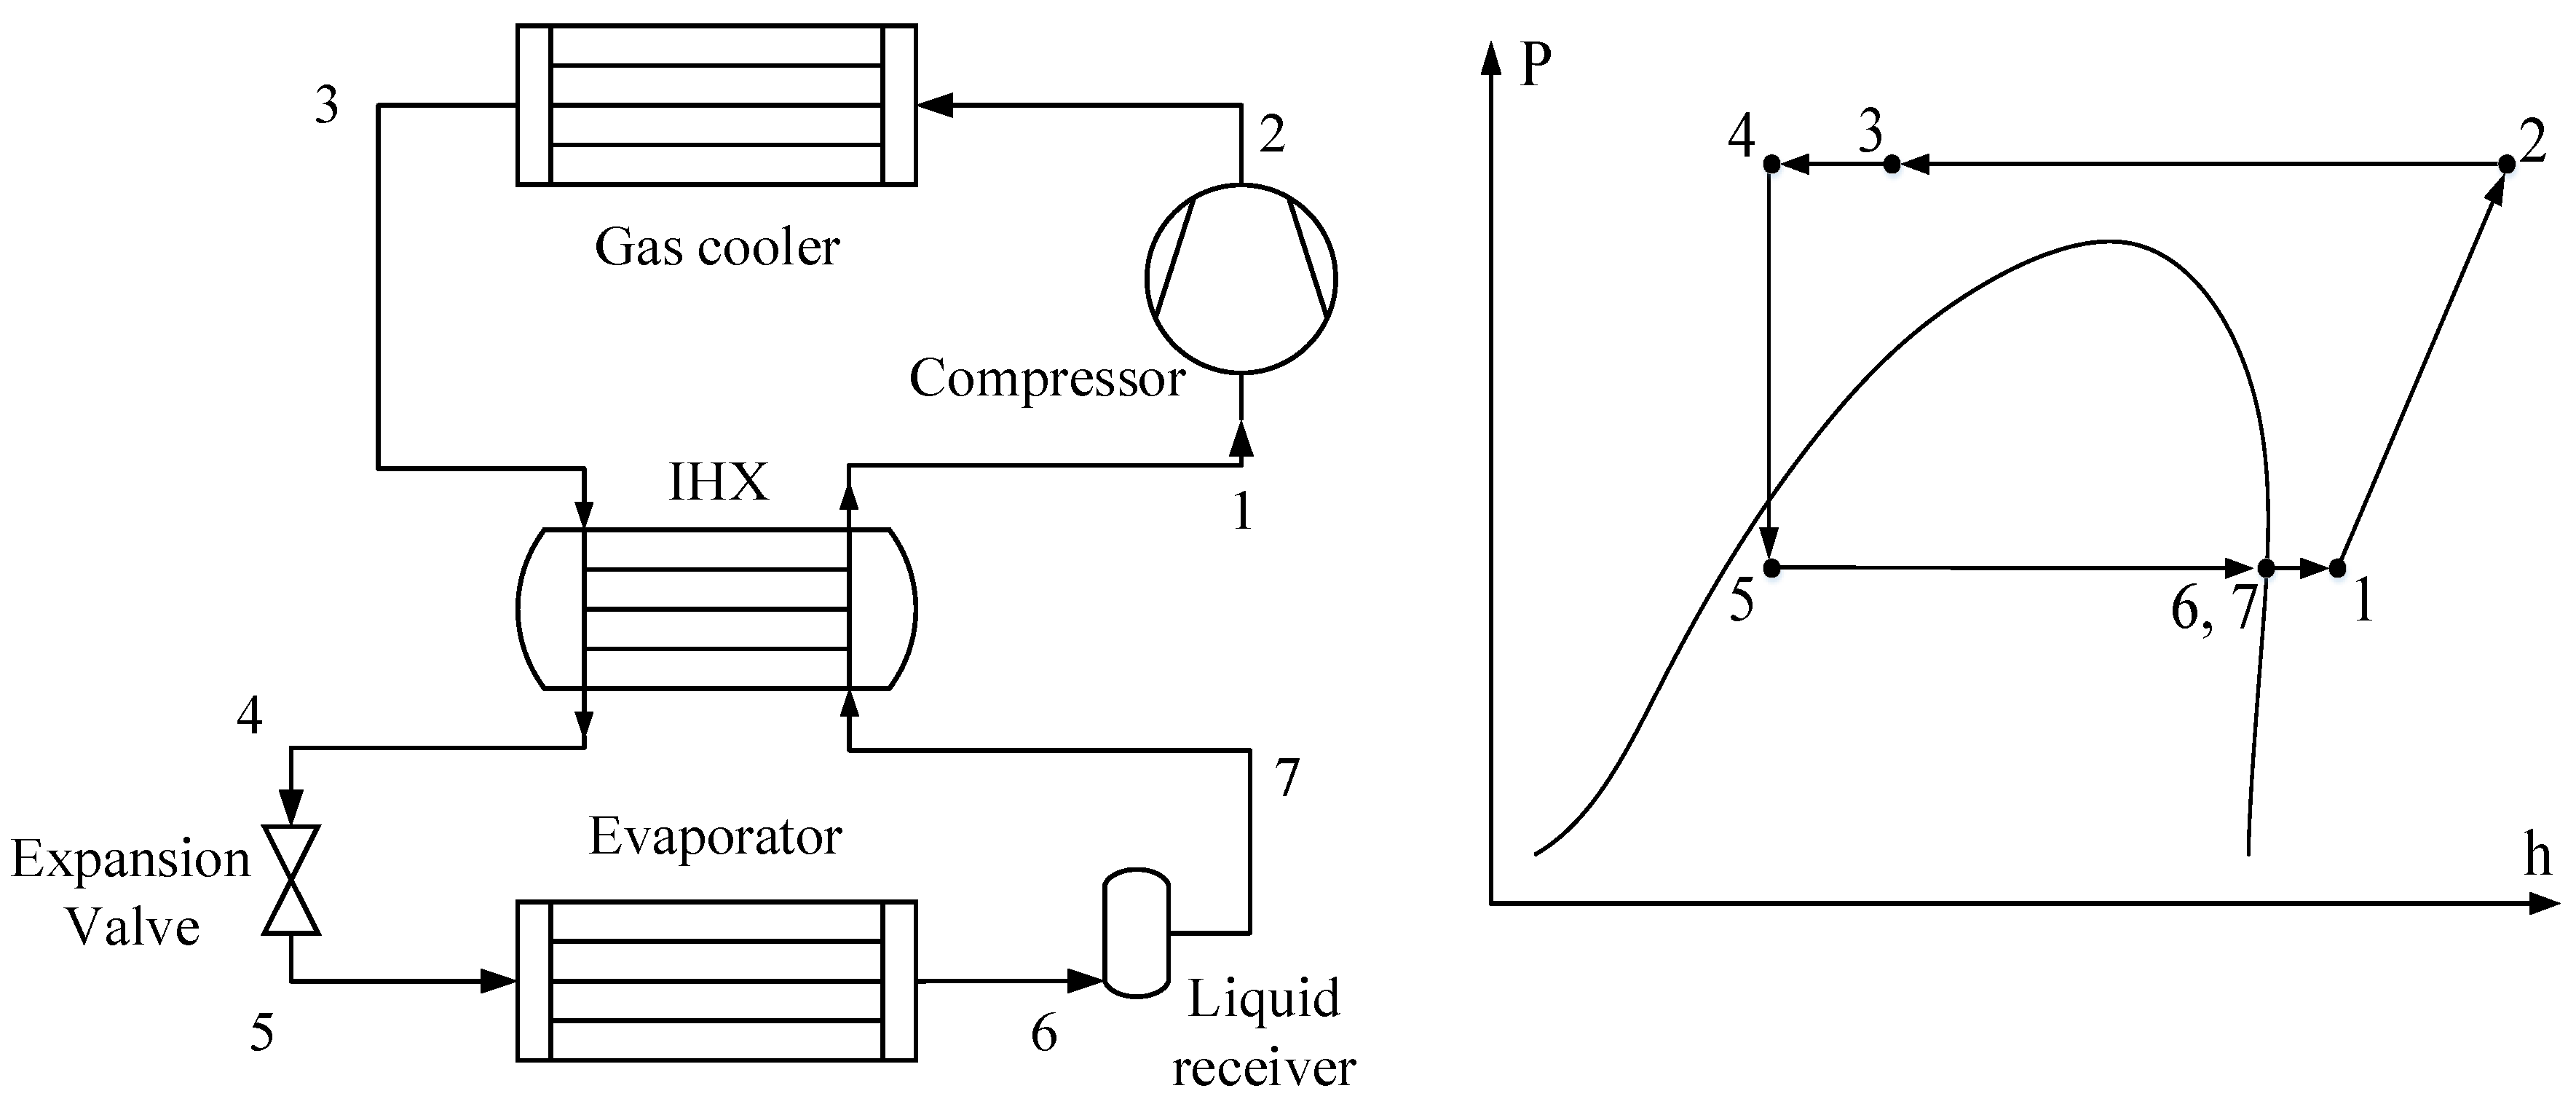
The basic transcritical refrigeration cycle layout is depicted in Figure 1. The Ph diagram shows the thermodynamic states through which the CO2 passes across the entire cycle. The components of the basic configuration are primarily the compressor, the gas cooler, the expansion valve, and the evaporator. In addition, a liquid container guarantees saturated vapor at the compressor’s inlet.
Amongst the most modern configurations used to improve the COP of a refrigeration cycle is a configuration using an IHX. This has a dual effect in the cycle, on the one hand increasing the degree of subcooling at the exit of the gas cooler, while on the other hand increasing the degree of superheating at the exit of the evaporator, as is shown in Figure 2. This results in an increase in the cooling capacity of the cycle, and therefore an improvement in its COP. In the current literature, some authors have shown the thermodynamic advantages of having an IHX in a transcritical cycle [23].
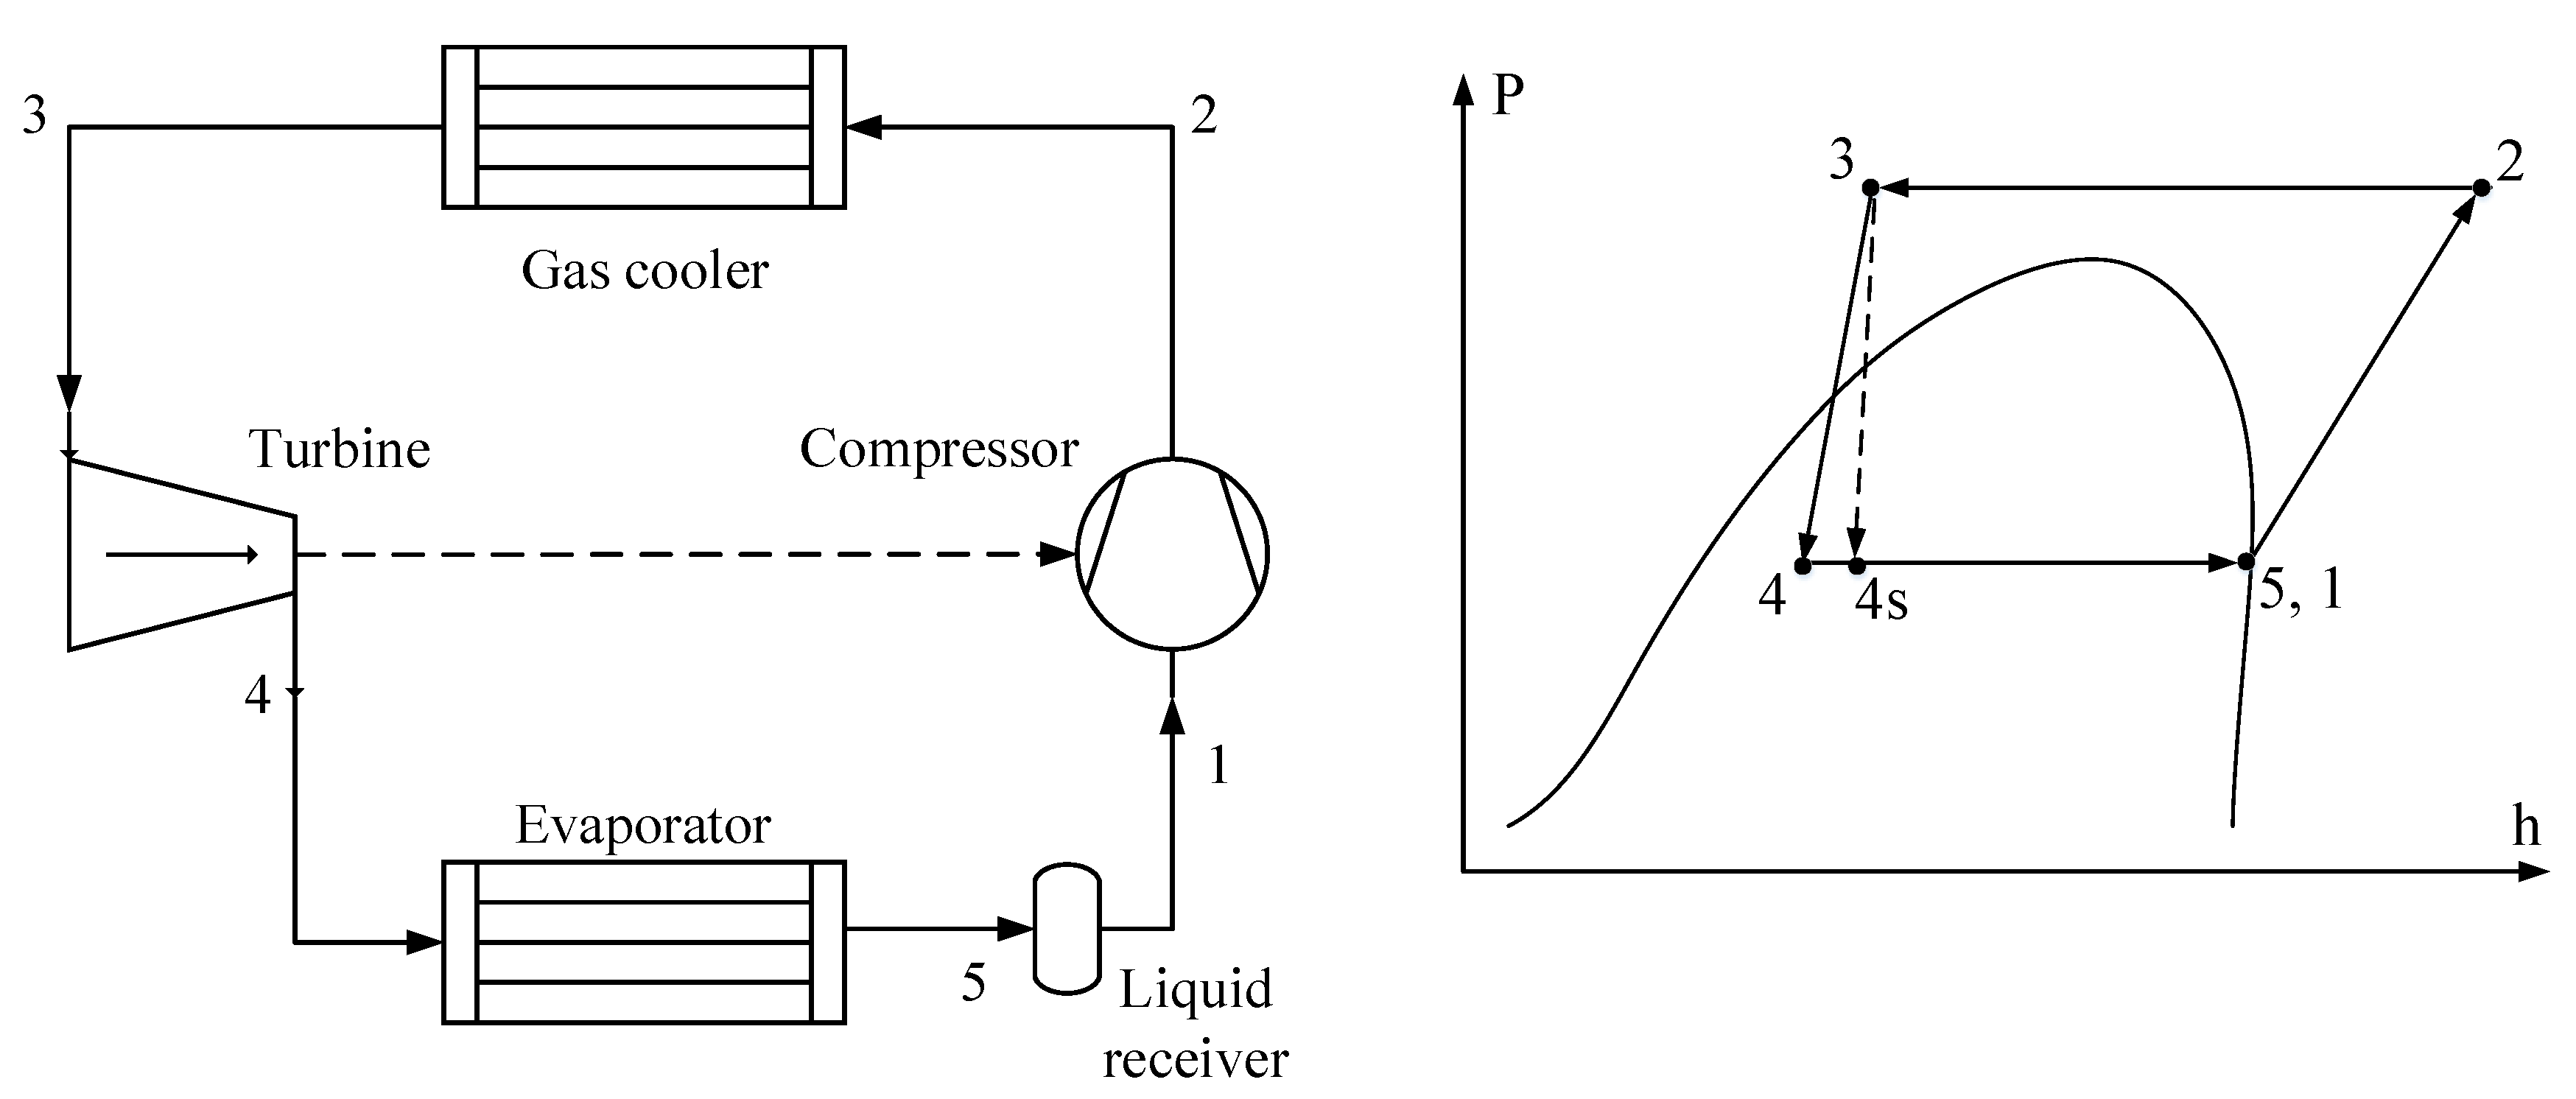
Another alternative that can be used to improve the COP of a refrigeration cycle is the replacement of the common expansion device with a turbine, which results in an increase in the COP by taking advantage of the work generated during the expansion of the working fluid, reducing the energy consumption of the compressor, as long as the system allows the turbine and compressor to be coupled to the same shaft. Another advantage of the use of a turbine is the reduction of the irreversibility enabled by the common expansion valve, which affects the COP. The main disadvantage of the inclusion of the turbine in the cycle relates to its high investment cost, as proportionally the cost is relatively high compared to expansion devices. The scheme for a cycle involving the incorporation of an expansion turbine is shown in Figure 3.
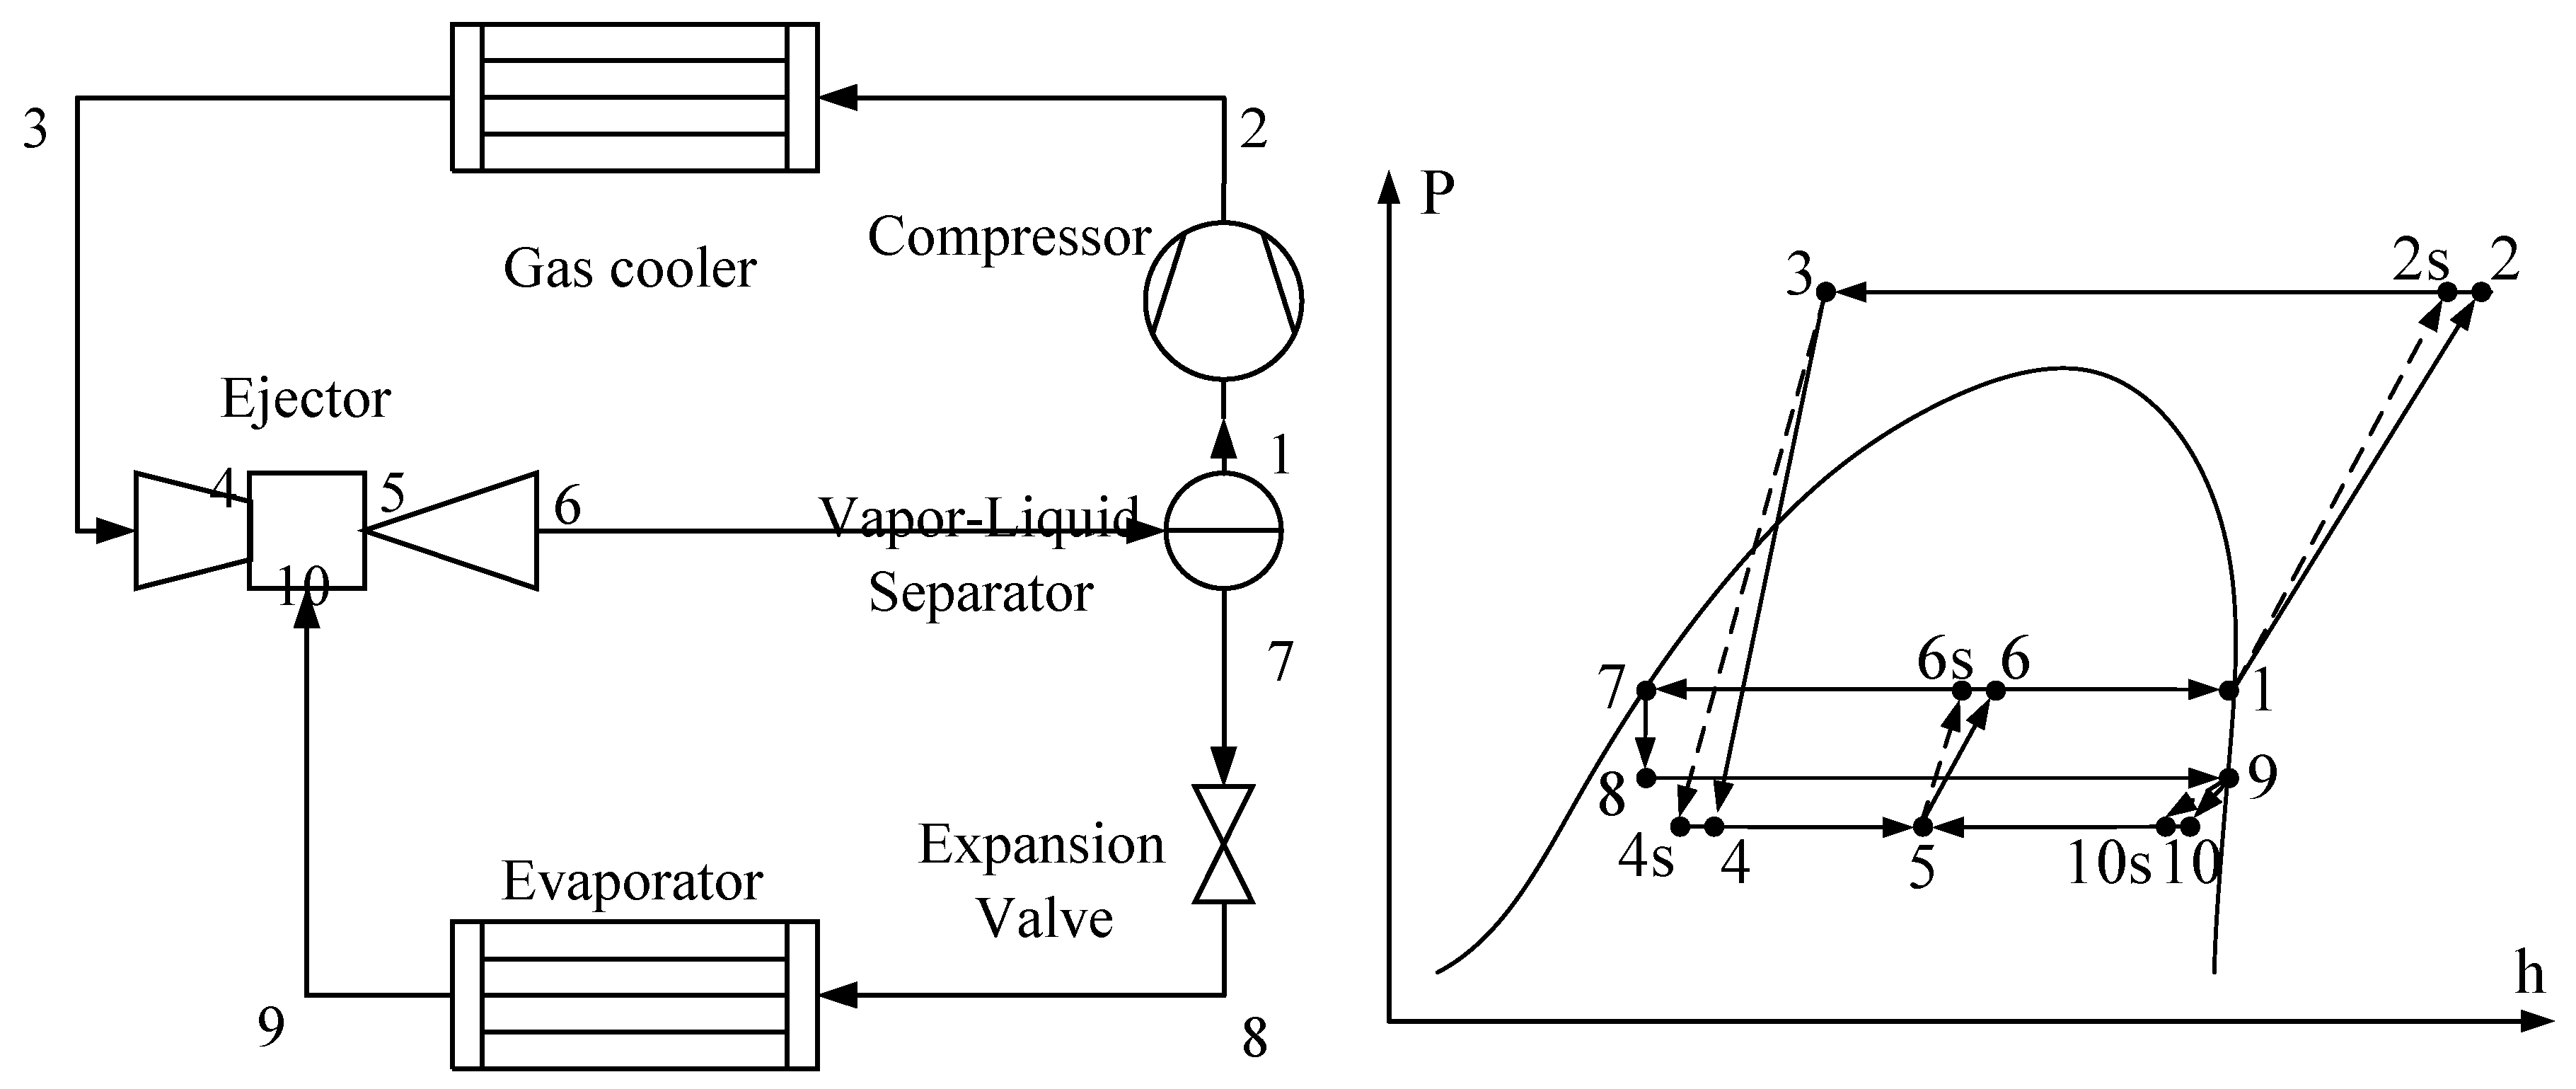
Figure 4 shows the schematic diagram of a transcritical refrigeration cycle with an ejector and its corresponding Ph diagram. Besides having the same components as the basic cycle, this configuration has a liquid–vapor separator and an ejector as the main expansion device. The ejector is a device comprising three fixed elements. A nozzle accelerates the mass flow rate from the gas cooler, creating a pressure drop below the evaporation pressure. In turn, a mixing chamber mixes the two streams at a constant pressure, whereas a diffuser decelerates the final mixture with increasing pressure [24].
The entrainment ratio is one of the most important parameters used to describe the ejector’s performance. In this study, the characterization of this parameter varied according to the operating conditions. Additionally, some considerations were considered to reduce the complexity of the model:
(1)
The compressor, ejector, and turbine have fixed isentropic efficiencies;
(2)
The refrigerant at the evaporator outlet is saturated vapor;
(3)
The pressure drops and heat losses in the gas cooler and evaporator, as well as in the piping systems, are negligible;
(4)
A constant cooling capacity for the system.

2.2. Mathematical Models

2.2.1. Exergy Model

Exergy (also called availability) is the maximum useful work that can be obtained in a specified state and environment condition. The total exergy of a system consists of four components: physical, chemical, kinetic, and potential exergy [25]:
E ˙ s y s = E ˙ P H + E ˙ C H + E ˙ K N + E ˙ P T
However, as there are no velocity or level changes in the system, only the physical and chemical components of exergy are considered:
E ˙ s y s = E ˙ P H + E ˙ C H
Therefore, the physical exergy can be calculated with the following equation:
E ˙ P H = m ˙ [ ( h h 0 ) T 0 ( s s 0 ) ]
Furthermore, assuming that the fluid’s chemistry does not change as it passes through the different equipment, it is also neglected. The exergy balance of the total system becomes:
E ˙ F , t o t = E ˙ P , t o t + k E ˙ D , k + E ˙ L , t o t
The exergy balance for each component is:
E ˙ F , k = E ˙ P , k + E ˙ D , k
The exergy efficiency is given by the following equation:
ε = E ˙ P , t o t E ˙ F , t o t

2.2.2. Exergoeconomic Model

According to the premise of thermoeconomics, all costs are associated with their corresponding exergy streams [16]. Therefore, the exergy-based cost balance equation for any component is given as:
C ˙ P , k = C ˙ F , k + Z ˙ k
where C ˙ P , k and C ˙ F , k stand for the cost rate associated with the product and fuel of the k-th component, respectively, or alternatively in terms of average costs per unit of exergy (cp and cF):
C ˙ P , k = c P , k E ˙ P , k
C ˙ F , k = c F , k E ˙ F , k
For the evaluation of the unit cost of the product, the following equation is used:
c P , k = c F , k E ˙ F , k + Z ˙ k E ˙ P , k
The levelized investment cost rate associated with the investment (CI), operation, and maintenance (OM) of the k-th component can be given as Z ˙ k :
Z ˙ k = Z ˙ k C I + Z ˙ k O M
where the levelized capital investment rate, Z ˙ k C I , is given by:
Z ˙ k C I = C R F · τ o p * I C C
where τop is the yearly operating time (7000 h), denotes the maintenance factor with a value of 1.06 [26], and ICC stands for the investment capital cost of the equipment. The capital recovery factor (CRF) can be calculated [27,28,29] as:
C R F = i r · ( 1 + i r ) n ( 1 + i r ) n 1
Here, ir stands for the interest rate (15%) and n is the expected lifetime of the plant (20 years) [27,28,29].
Table 2 provides the equations used for the calculation of the ICC values for each equipment setup.
Moreover, in order to identify the relative significance of non-exergy-related costs (i.e., capital investment, operational, and maintenance costs) and irreversibility costs (i.e., exergy destruction), the exergoeconomic factor for the k-th component can be calculated [30] as:
f k = Z ˙ k Z ˙ k + c F , k E ˙ D , k
where Z ˙ k is the total cost rate ($/h), c F , k the unit cost of fuel ($/kJ), and E ˙ D , k stands for the exergy destruction rate (kJ/h).
Additionally, it should be noted that the cost of the equipment is given for a reference year, and therefore it is necessary to update it to the considered year with the following equation:
O r i g i n a l   c o s t = r e f e r e n c e   c o s t · [ c o s t   i n d e x   o f   t h e   o r i g i n a l   y e a r c o s t   i n d e x   o f   t h e   r e f e r e n c e   y e a r ]
For this study, the reference year for the cost of the equipment was 2010, and so these values were updated to 2020. Finally, Table 3 summarizes the exergy and exergoeconomics equations for each piece of the equipment that was part of the different refrigeration cycles.

2.2.3. Environmental Model

To complement this study, an environmental analysis is included that considers a simple model to determine the CO2 penalty cost rate related to the electricity consumption of the compressor. Thus, the equation used is:
C ˙ e n v = m ˙ CO 2 · C CO 2
where Cco2 is the cost of avoided CO2, which takes the value of 0.09 $/kg of CO2 [33], and m ˙ C O 2 is the annual amount of emitted CO2, which can be calculated as:
m ˙ CO 2 = μ CO 2 · E ˙ a n n u a l
where μ CO 2 = 0.968   k g k W h and E ˙ a n n u a l is the annual electrical energy consumption of the system in kWh.

3. Results

This section analyzes the influences on the exergy and exergoeconomic parameters of three of the main operating variables in the refrigeration cycles, namely the evaporating temperature, gas cooler outlet temperature, and compressor pressure ratio. The particular conditions under which the results were obtained are indicated in the graphs. For the sake of comparison, the same cooling capacity (Qevap = 7 kW) was considered in each of the refrigeration cycles cases.

3.1. Exergy Analysis

Figure 5 illustrates the variation in the exergy efficiency with the evaporating temperature, the gas cooler outlet temperature, and the compressor pressure ratio for each of the transcritical refrigeration cycles selected herein. As per Figure 5a, the lowest exergy efficiency was revealed by the basic cycle, as expected. This was followed by the IHX cycle, then the turbine cycle, and finally by the ejector cycle with the highest exergy efficiency.
The maximum difference in exergy efficiency between the basic cycle and that with the ejector was approximately 59% at −10 °C. In all cases, decreasing the evaporating temperature had a slight positive effect on the system’s exergy efficiency. This effect was caused by the reduction in the evaporating temperature and the exergy in the cooling chamber increasing (although the work of the compressor increased), which caused the efficiency of the cycles to decrease.
On the contrary, Figure 5b reveals a significant effect of the gas cooler outlet temperature on the exergy efficiency. It can be observed that by increasing the temperature of the gas cooler outlet from 25 °C, the exergy efficiency of the basic cycle, as well as that of the cycles with IHX and the turbine, gradually decrease shortly before 35 °C, after which a more rapid decrease can be observed. An increase of 5 °C beyond this point represents a drop in exergy efficiency of about 40% for the basic cycle and the one with a turbine, and 36% for the cycle with the IHX. In the case of the cycle with the ejector, the impact is not as remarkable. For instance, prior to 35 °C, a 5 °C increase in temperature represents a negative impact of no more than 3% on the exergy efficiency. Beyond that point, the same difference in temperature has an influence of approximately 18% on the exergy efficiency.
Figure 5c shows the effect of the compressor pressure ratio on the exergy efficiency rates of the four cycles for evaporating and gas cooler outlet temperatures of −10 °C and 35 °C, respectively. It is interesting to note how the exergy efficiency curve of the ejector refrigeration cycle differs significantly from those of the other refrigeration cycles. It falls slowly over the entire range of pressure ratios considered herein, within which its maximum drop is approximately 9%. In the case of the other refrigeration cycles, the exergy efficiency increases substantially in the first range, going from 2.8 to the optimum pressure ratio of 3.3 (value with which the simulations are performed in this study). This increase is approximately 240% for the basic cycle, 150% for the refrigeration cycle with the IHX, and finally 125% for the refrigeration cycle with the turbine. Beyond this point, the exergy efficiency of the refrigeration cycles decreases.
This finding can be explained by the fact that by increasing the pressure ratio, the pressure at the compressor inlet is lower (at the constant outlet pressure), which causes an increase in the work of the compressor and in the exergy of the evaporator. Below the optimum pressure ratio, the increase in the evaporator’s exergy is greater than the increase in the compressor work, which causes the increase in exergy efficiency. Beyond the optimum point, the increase in compressor performance is greater, and therefore the exergy efficiency decreases.

3.2. Exergoeconomic Analysis

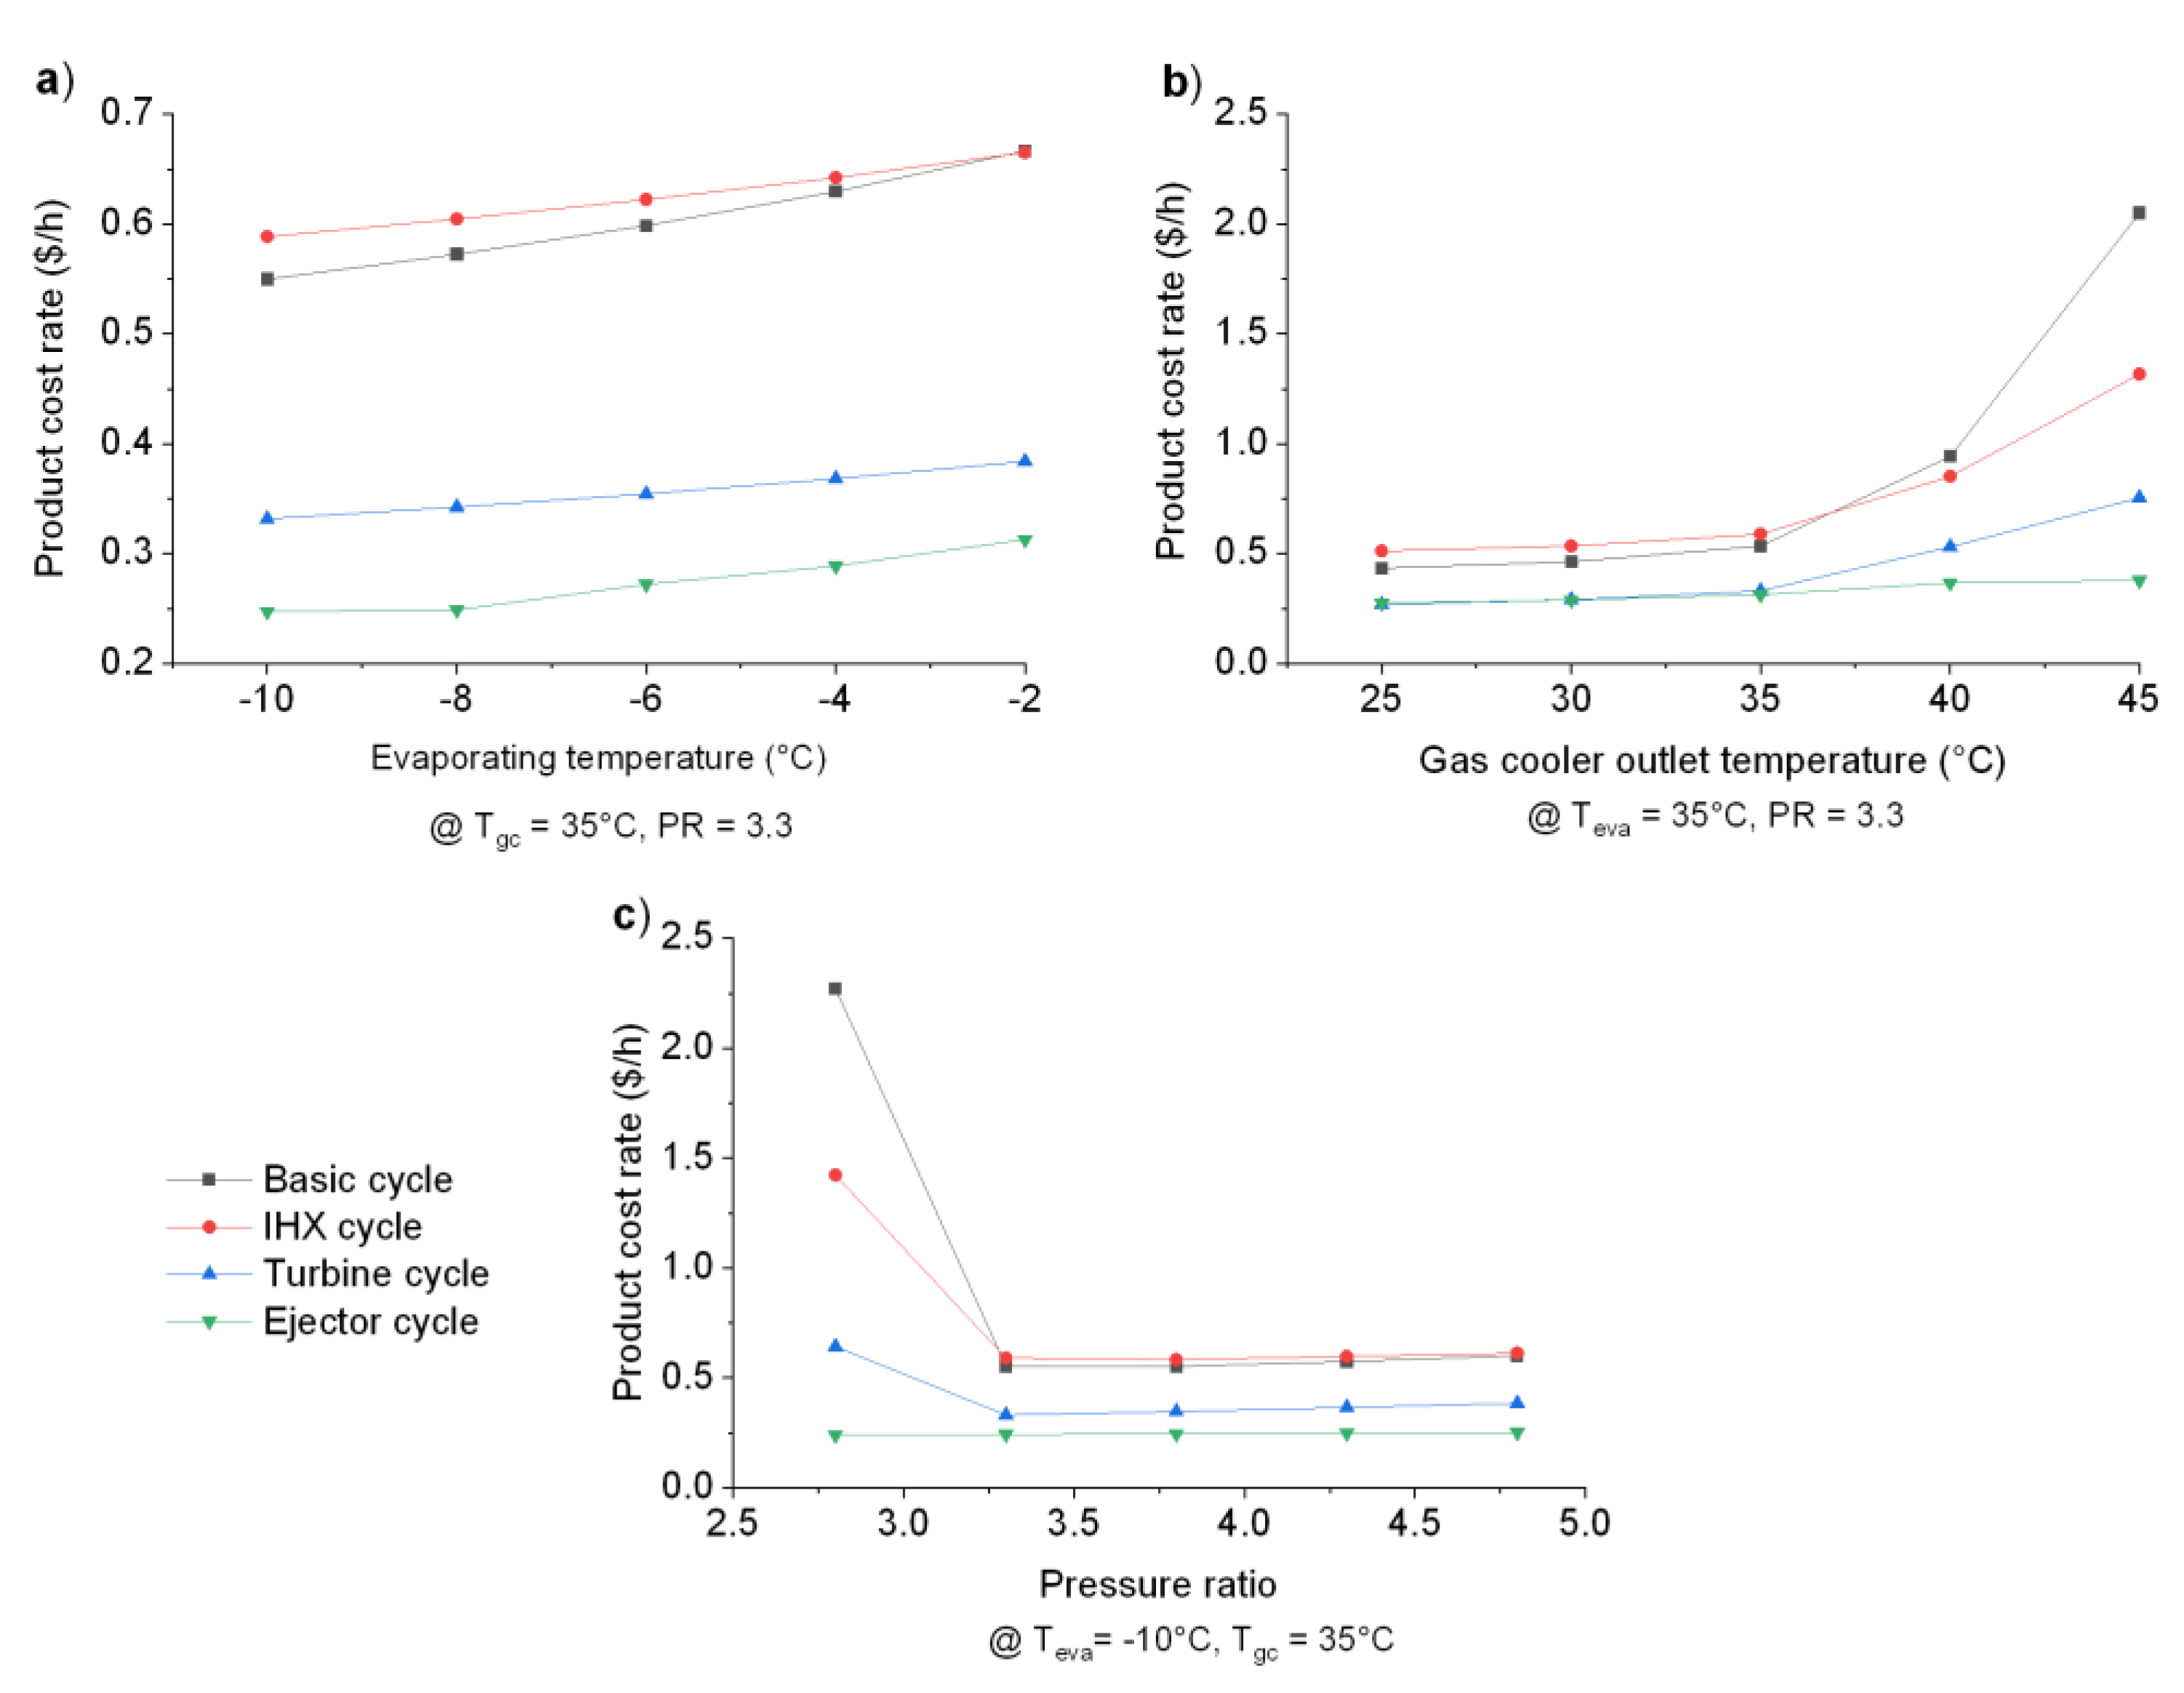
Figure 6 reveals the variations in the product cost rate as a function of (a) the evaporation temperature, (b) the cooler gas outlet temperature, and (c) the pressure ratio in the compressor. Referring to Figure 6a, the reduction in the evaporating temperature causes the product in the refrigeration system to be slightly more economical. When comparing this trend to that of the exergy efficiency (see Figure 5a), it can be seen that they are opposites. Increasing the exergy efficiency results in a reduction in the product cost. The maximum costs for the refrigeration cycles turn out to be 0.65 $/h for both the basic cycle and the cycle with IHX, 0.38 $/h for the cycle with the turbine, and finally 0.3 $/h for the cycle with the ejector.
Figure 6b illustrates a marked influence of the gas cooler outlet temperature on the product cost rate for the refrigeration cycles at 35 °C, with a constant evaporating temperature and a pressure ratio of 2.67. For all refrigeration cycles, except for that with the ejector, the reduction in the gas cooler outlet temperature leads to a fairly significant cost reduction. In the particular case of the basic cycle, lowering the temperature from 45 °C to 35 °C implies a cost reduction of at least 75%. This trend is primarily due to the reduction in the exergy efficiency of the cycle, as is shown above in Figure 5b. In addition, it can be seen that below 35 °C, the cost of the product virtually remains constant. In contrast, the product cost rate of the refrigeration cycle with the ejector is slightly reduced by increasing the temperature of the gas cooler outlet. This finding may be explained by the fact that the use of the ejector reduces the irreversibilities in the refrigeration cycle.
The effect of the pressure ratio is also important for the product cost rate, as is shown in Figure 6c. In the case of the basic cycle, the production cost rate falls by approximately 73%, whereas for the cycle with the IHX, the drop is only 60%. For the turbine, the impact of the pressure ratio is still important. In the case of the refrigeration cycle with the ejector, the change in the pressure ratio does not have a major effect; in fact, it remains fairly constant throughout the selected pressure ratio range. The same behavior can be observed for the subsequent refrigeration cycles after the optimal pressure ratio has been reached. At a pressure ratio of 4.8, the maximum cost difference between the basic or exchanger cycle and the ejector cycle is given, which is approximately 0.35 $/h.
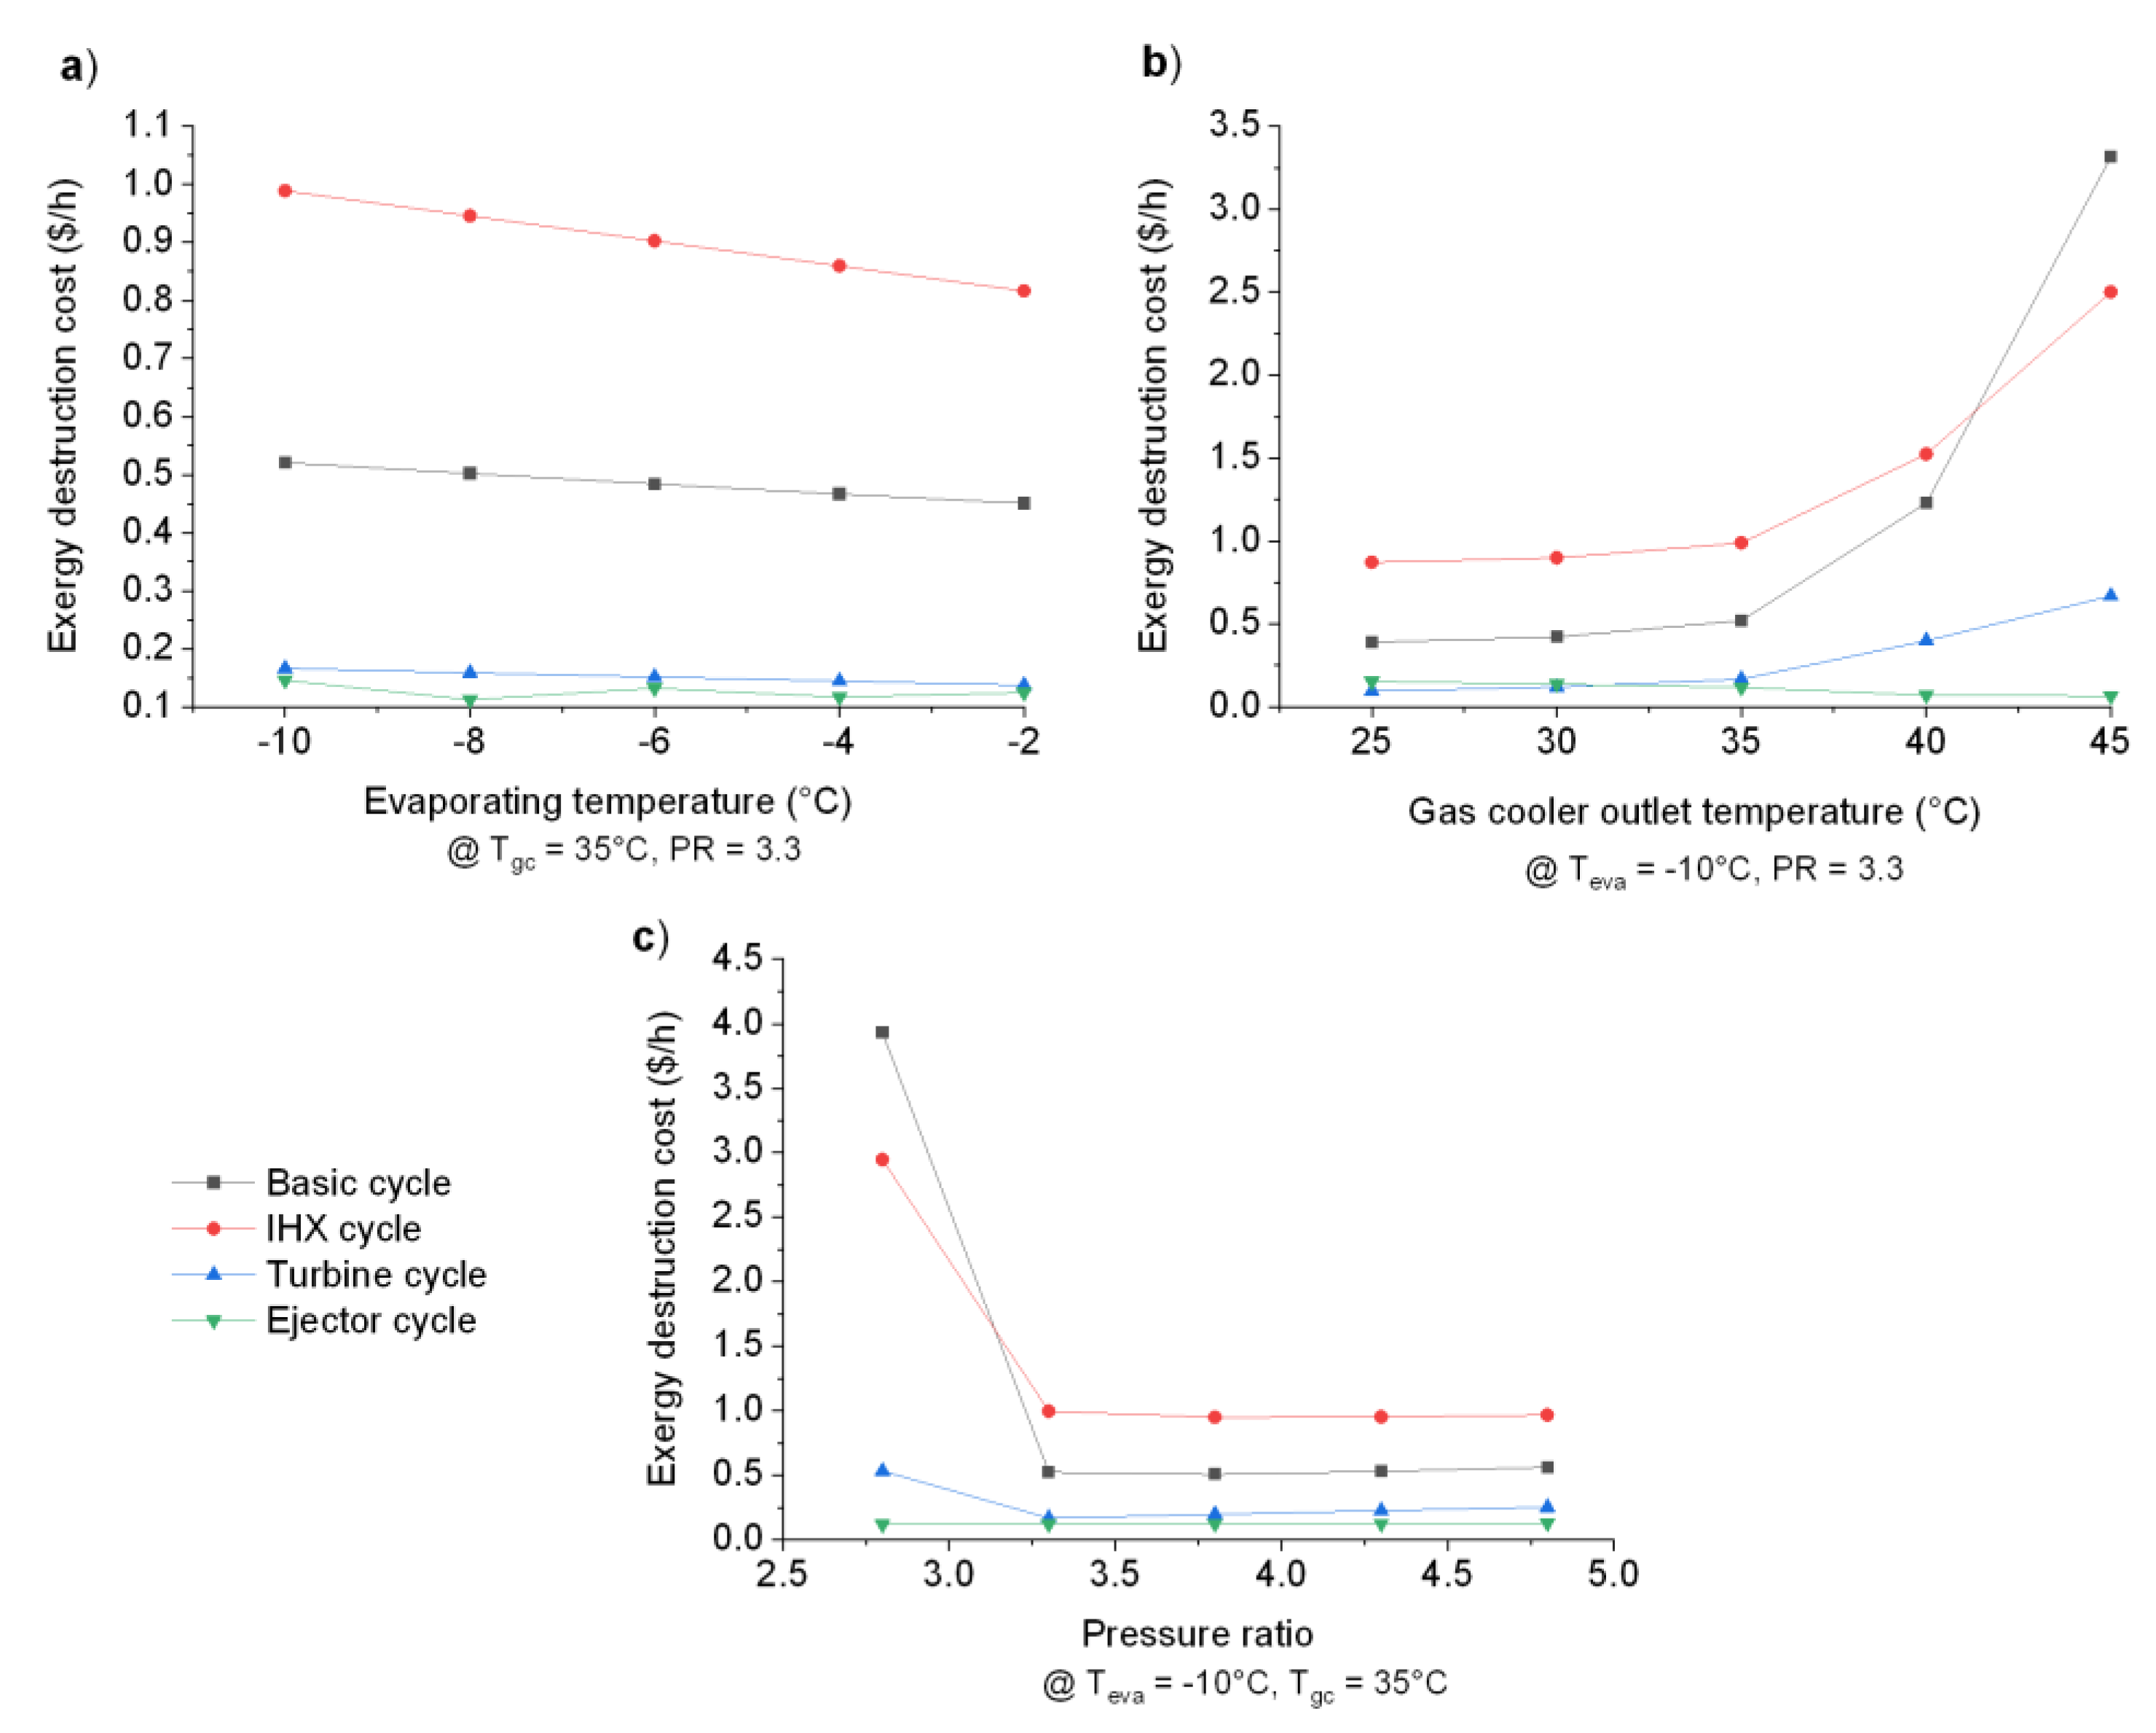
The destruction of the exergy also incurs a cost generated by internal or external irreversibilities in the system, which must be taken into account in any exergo-economic analysis, as it is part of the cost of the final product [28]. Figure 7a, for example, reveals a slight variation in the ratio of the cost of the exergy destruction. In this scenario, the refrigeration cycle with the IHX is the one that shows the highest exergy destruction cost out of all cycles within the considered evaporating temperature range. The maximum cost is 1 $/h at −10 °C and the minimum cost is 0.85 $/h at −2 °C. As expected, the minimum cost is revealed by the refrigeration cycle with an ejector, which is 0.13 $/h on average over the entire temperature range.
In contrast, the cost trend for the exergy destruction is to increase when the exit temperature of the cooler gas increases (see Figure 7b). However, it is noteworthy that the cost of exergy destruction decreases in the ejector cycle as the gas cooler outlet temperature increases. This is because the use of an ejector in the refrigeration cycle reduces the compression work as the temperature of the gas cooler outlet increases, and so the exergy destruction, and therefore its cost, is reduced. It is important to note that the change in the costs of the exergy destruction occurs at a gas cooler outlet temperature of 35 °C. The exergy destruction cost of the cycle with the IHX is about 89% higher than that of the refrigeration cycle with the ejector.
Moreover, the variation in the exergy destruction cost with respect to the compressor pressure ratio for each of the refrigeration cycles is shown in Figure 7c. The most remarkable result to emerge from this is that for the basic cycle at the lowest pressure ratio, the cost is as much as 4 $/h, which represents a fairly significant economic loss compared to either a turbine or an ejector cycle. The exergy destruction cost inflection occurs at the optimum pressure ratio, from which it remains virtually constant for all cycles at pressure ratios higher than this.
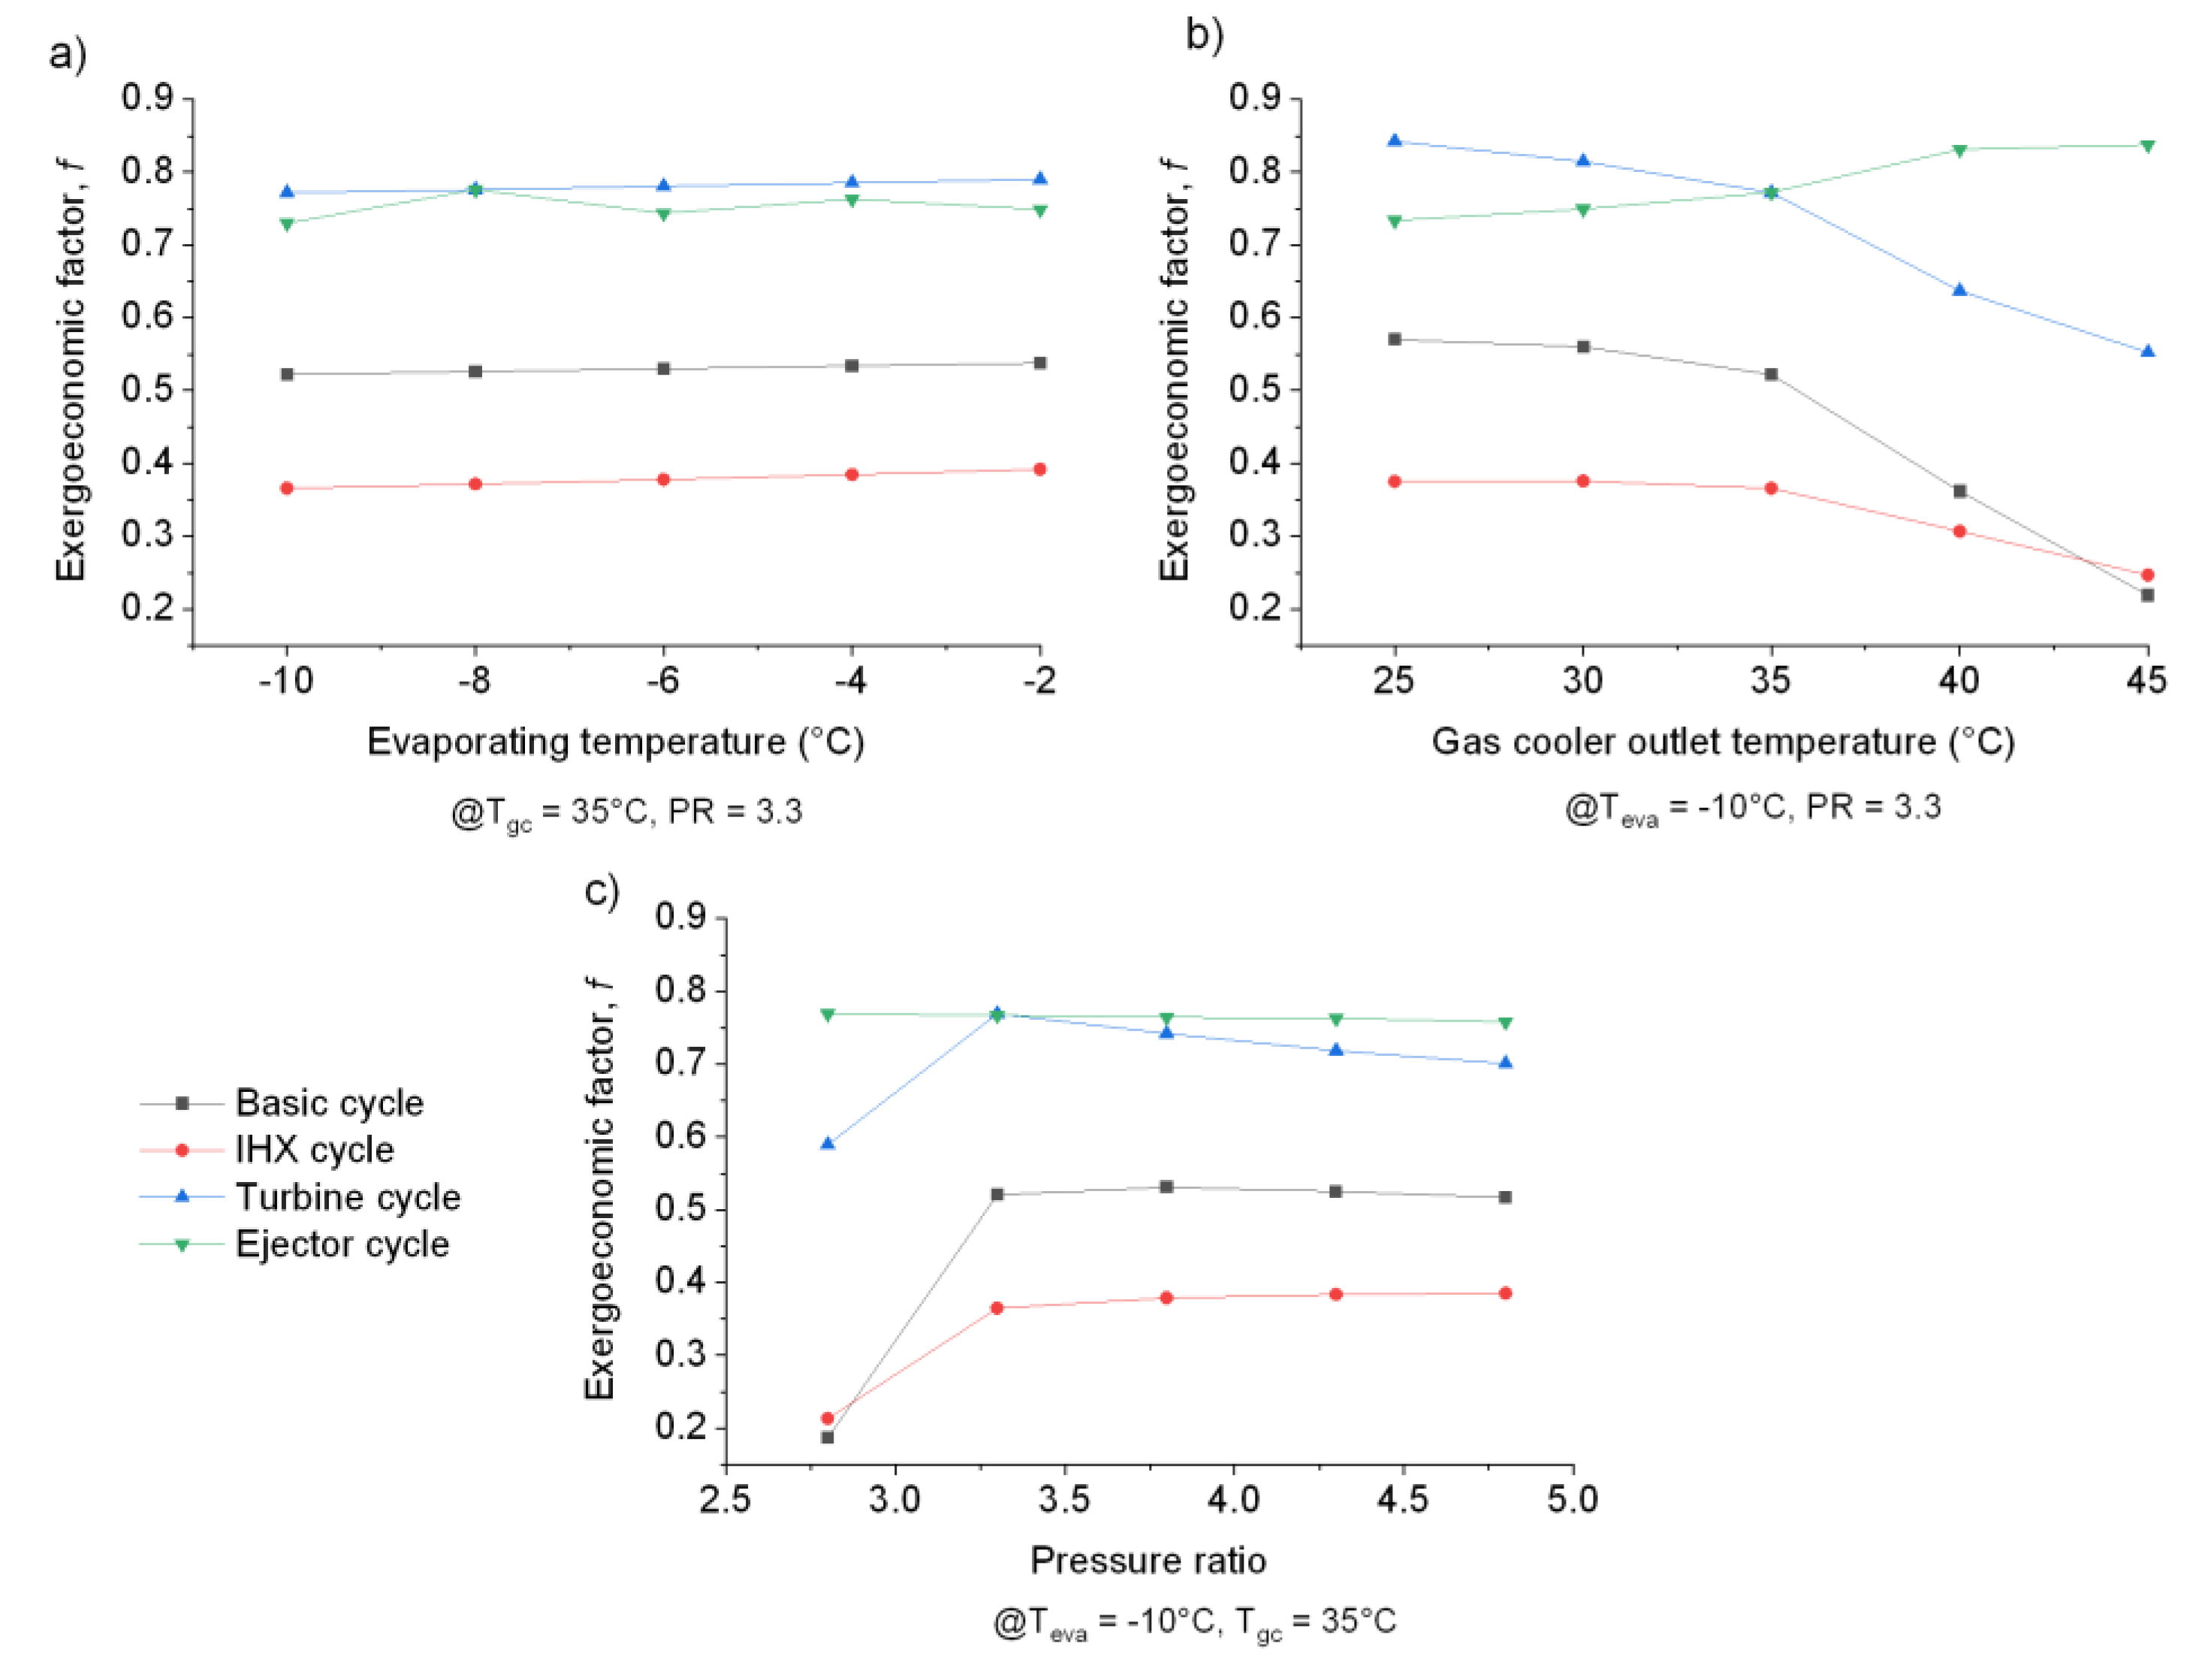
With respect to the exergoeconomic factor, Figure 8 reveals how the variations in (a) the evaporating temperature, (b) the gas cooler outlet temperature, and (c) the pressure ratio in the compressor influence its behavior according to the conditions considered in each particular case. In the first case, the variation in the evaporating temperature does not significantly affect the exergoeconomic factor of any of the refrigeration cycles. It is important to note the fact that the exergoeconomic factor of the cycle with the turbine is on average slightly higher than that of the cycle with the ejector. This is primarily due to the investment cost of the turbine, which is higher than that of the ejector. The exergoeconomic factor of the basic cycle is 0.3 units below the cycles mentioned above, whereas the cycle with the IHX is 0.45 units below. This implies that these two cycles are less efficient, as their exergy efficiency decreases, as is discussed in Figure 5a. A possible explanation is that by increasing the evaporation temperature, the irreversibilities increase, which makes the exergoeconomic factor decrease. Otherwise, to increase the exregoeconomic factor of the two cycles, internal or external irreversibilities would have to be reduced, which could possibly be achieved with more efficient equipment.
In the case of the variations in the gas cooler’s outlet temperature, as shown in Figure 8b, a greater effect on the exergoeconomic factor can be seen. The trend for the exergoeconomic factor values when increasing the temperature is downward, except for in the case of the cycle with the ejector. This trend is consistent with that observed previously in the exergy efficiency analysis. Above 35 °C, the drop in the factor is more noticeable. On the other hand, the exergoeconomic factor of the cycle with the ejector tends to increase as the exit temperature of the gas cooler does. Therefore, the thermodynamic gain of the refrigeration cycle is evident when the ejector is included.
Figure 8c shows that the exergoeconomic factor values of the cycles, except for the ejector, grow as the pressure ratio increases. This finding is associated with an increase in the exergy efficiency, i.e., the reduction of irreversibilities. At the optimum pressure ratio (3.3), the factor remains constant until the end of the considered range is reached; however, it can be seen that for the turbine cycle, the factor tends downwards. In the case of the cycle with the ejector, the exergoeconomic factor increases slightly as the pressure ratio does. For these two cases in particular, this finding is mostly due to the increased cost of the exergy destruction under these same conditions.
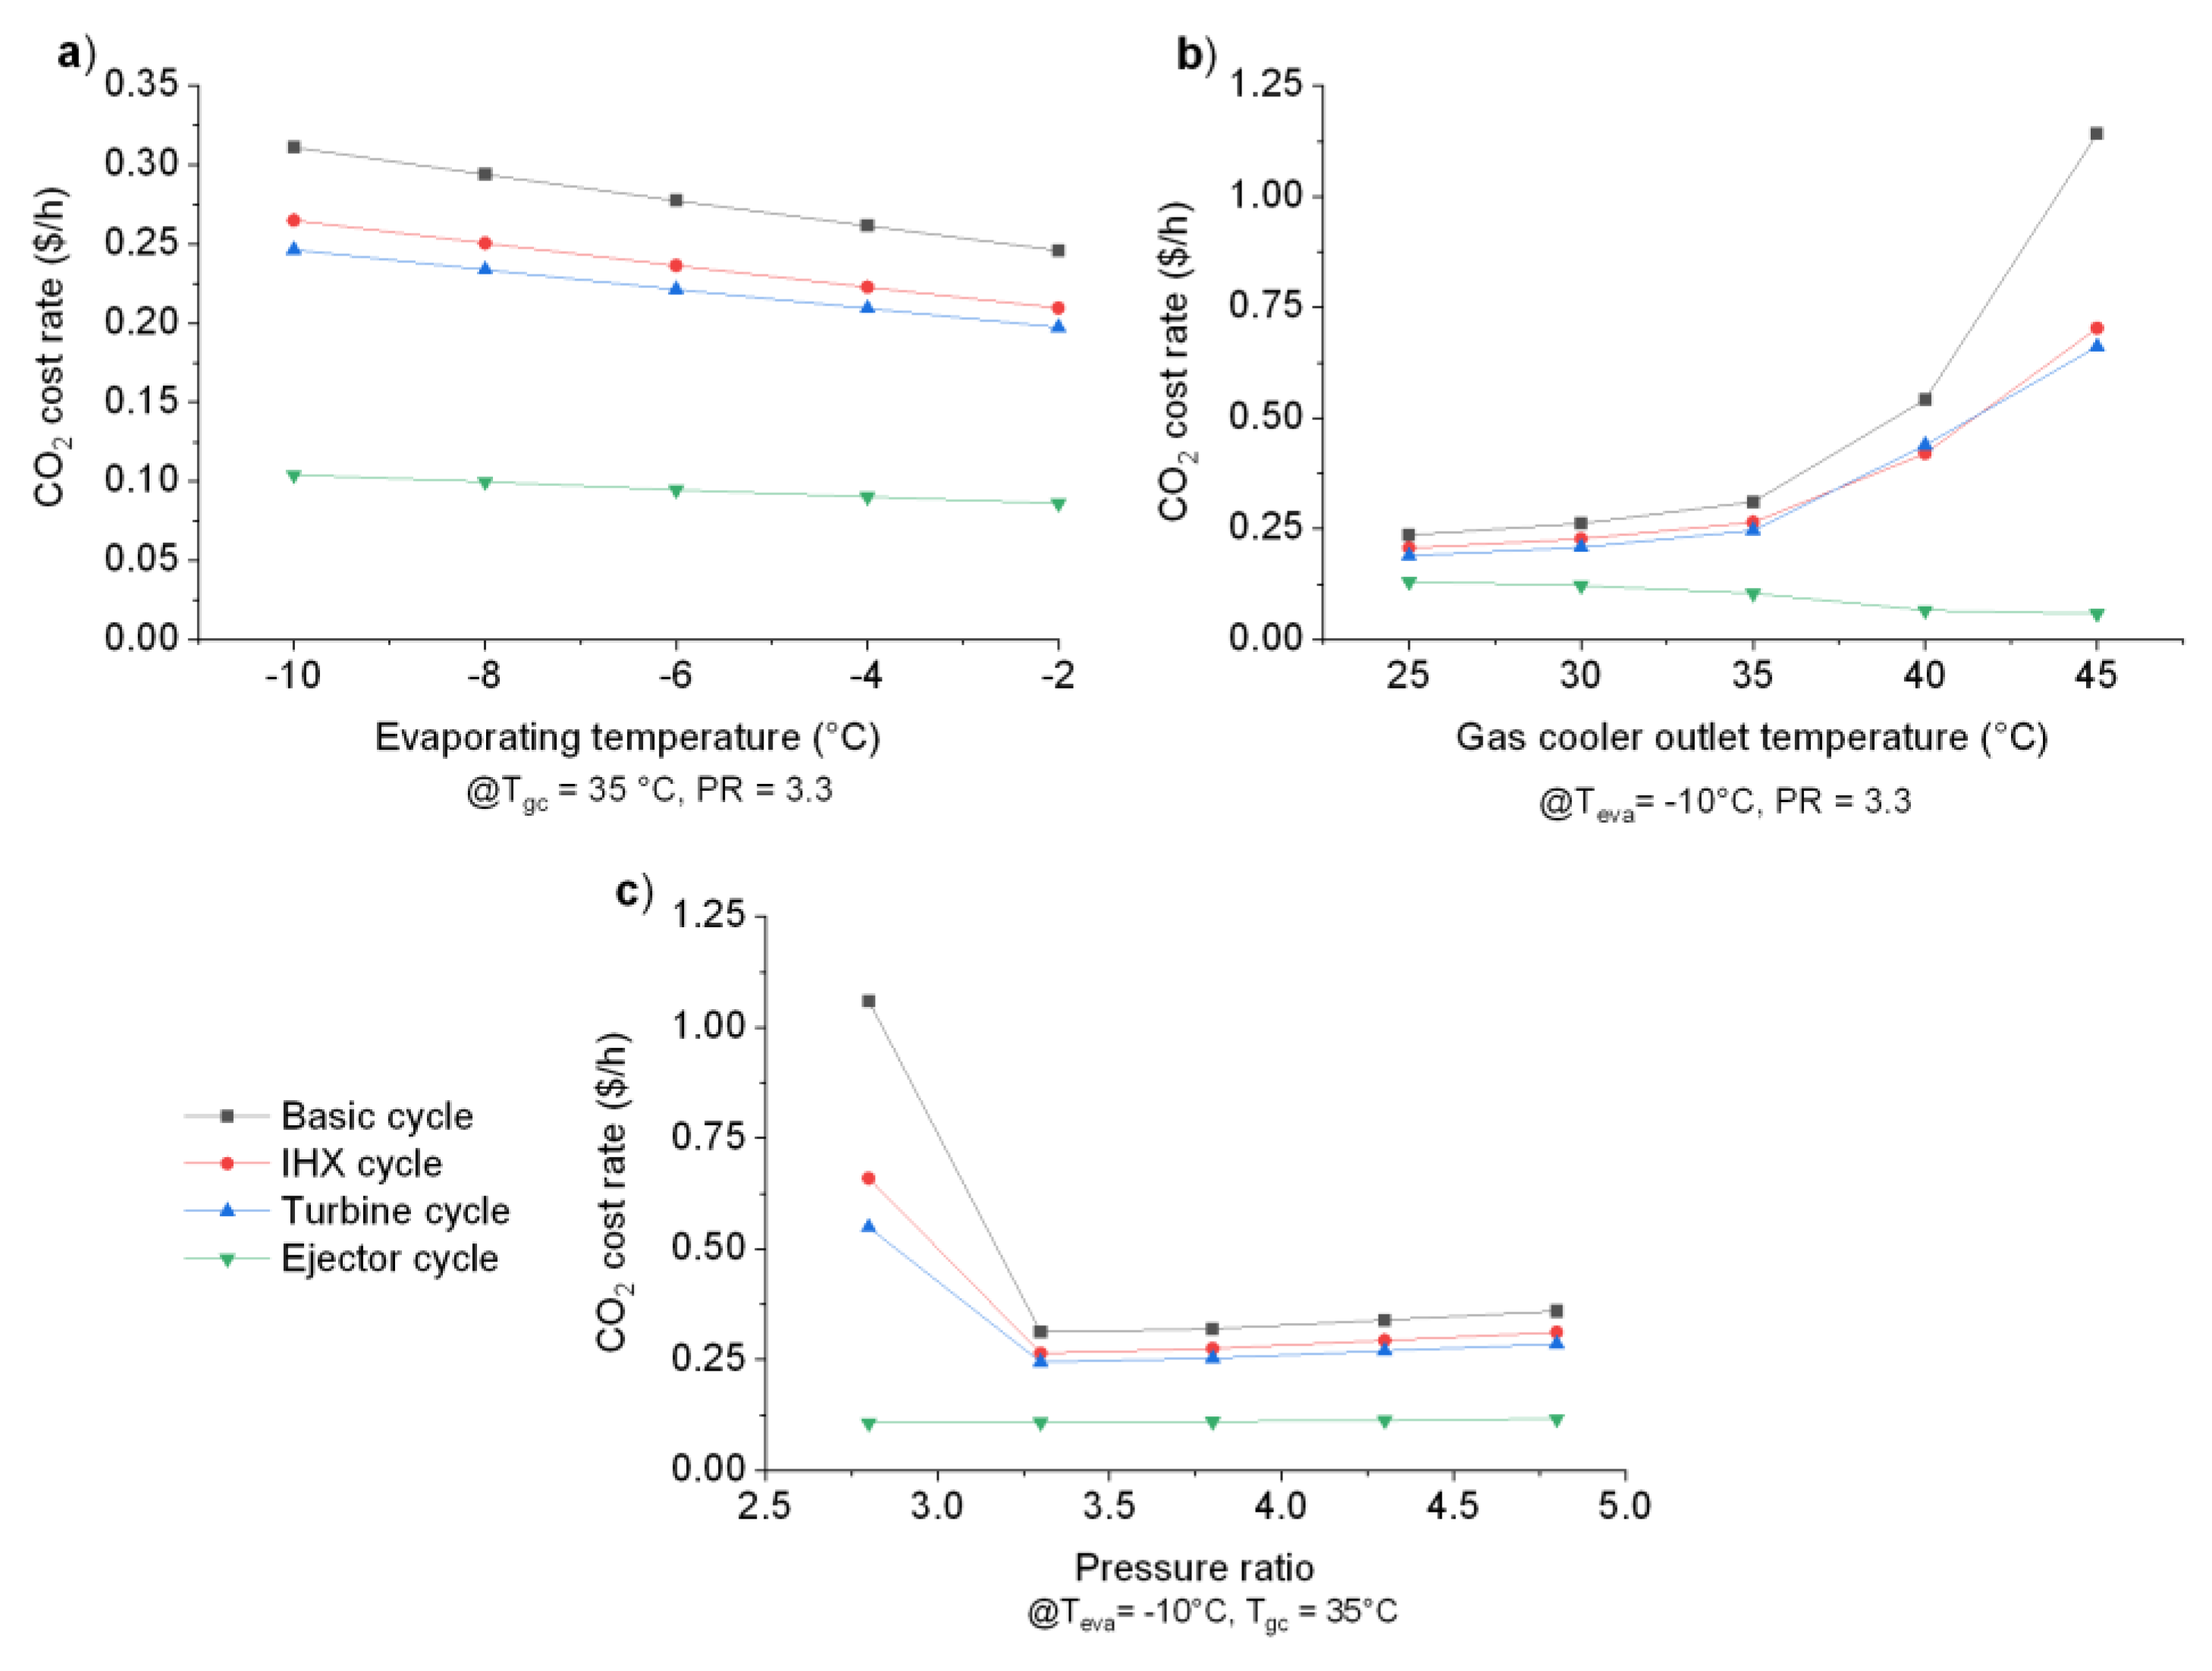
As far as the environmental analysis is concerned, Figure 9a shows a comparison of the CO2 cost rate (i.e., the penalty cost rate) calculated for each of the refrigeration cycles as a function of the evaporating temperature. This cost particularly considers the CO2 emissions emitted into the environment because of the consumption of electrical energy. Accordingly, the penalty cost rate is decreased by increasing the evaporating temperature. Moreover, the higher and lower penalty cost rates belong to the basic cycle (0.28 $/h on average) and that with the ejector (0.10 $/h), respectively. Note that these correspond to systems with lower and higher exergy efficiencies (see Figure 5a). Figure 9b illustrates the increase in the penalty cost rate as the outlet temperature of the gas cooler increases for the cases of the basic cycle with IHX and the turbine. In the particular case of the basic cycle, the penalty cost rate increases from 0.25 to 1.12 $/h at a temperature difference of 20 °C. In contrast, the penalty cost ratio in the ejector refrigeration cycle tends to be reduced within the same temperature difference.
Finally, the variations in the penalty cost rate due to changes in the compressor pressure ratio are shown in Figure 9c. It is interesting to note that as the pressure ratio increases until it reaches its optimum value, the penalty cost of the refrigeration cycle decreases, except for the cost of the ejector cycle. This last segment increases by only 2% in the selected range. Beyond the optimum pressure rate, the cost of the other cycles increases by about 2% as well. Hence, from an environmental point of view, the most preferable refrigeration cycle is that with the ejector.

4. Conclusions

In this study, an advanced exergoeconomic method was used to compare in detail the behavior of four transcritical refrigeration systems, namely: a basic cycle, a cycle with an internal heat exchanger, one with a turbine, and one with an ejector. Balance equations were developed for the exergy and exergoeconomics of each of the components in the different cycles. These equations were programmed using EES software (v9, Madison, WI, USA). Additionally, the abatement cost of CO2 was included to extend the analysis and was based on a comparison through a parametric analysis. The varied parameters were the evaporating temperature, the gas cooler outlet temperature, and the compressor pressure ratio. The performance indices were the exergy efficiency, the product cost rate, the exergy destruction cost rate, the exergoeconomic factor, and the CO2 penalty cost rate. The main conclusions of this study are summarized as follows:
  • The highest exergy efficiency was achieved for the ejector cycle, reaching an average value of 33%. As expected, the basic cycle had the lowest exergy efficiency. In the exergy efficiency behavior, it was observed that the evaporation temperature was the variable that least influenced the measurements;
  • Regarding the cost rate product variation, the basic and IHX cycles were the configurations that presented the highest cooling costs. For example, for an evaporation temperature of −2 °C, costs of 0.65 $/h were observed. This same behavior was reflected in the exergy destruction cost;
  • With respect to the exergoeconomic factor, the cycles with the ejector and turbine were those that showed the greatest factor values, ranging from 0.7 to 0.8. The lowest average value of 0.53 on was shown by the IHX cycle;
  • The variation in the penalty cost was another of the behaviors analyzed; in this case, the basic cycle was the configuration with the most CO2 emissions emitted due to energy consumption. For high gas cooler outlet temperature conditions (45 °C), a value of 1.12 $/h was obtained, whereas for the same conditions, the cycle with an ejector gave a value of 0.05 $/h;
  • Finally, it can be concluded that according to the results discussed here, the transcritical cooling cycle with the ejector turned out to be the most efficient method from an exergo-economic point of view. However, it still requires further technological development to decrease its production cost.

Author Contributions

Conceptualization, methodology, investigation, V.H.R.-H. and J.M.B.-F.; refrigeration, model validation, data curation, V.P.-G. and D.M.-M.; writing of first draft, V.H.R.-H., J.M.B.-F., and V.P.-G.; review and editing, A.Z.-A. and Q.F. All authors have read and agreed to the published version of the manuscript.

Funding

This research received no external funding.

Conflicts of Interest

The authors declare no conflict of interest.

References

  1. Pérez-García, V.; Rodríguez-Muñoz, J.L.; Ramírez-Minguela, J.J.; Belman-Flores, J.M.; Méndez-Díaz, S. Comparative analysis of energy improvements in single transcritical cycle in refrigeration mode. Appl. Therm. Eng. 2016, 99, 866–872. [Google Scholar] [CrossRef]
  2. Llopis, R.; Cabello, R.; Sánchez, D.; Torrella, E. Energy improvements of CO2 transcritical refrigeration cycles using dedicated mechanical subcooling. Int. J. Refrig. 2015, 55, 129–141. [Google Scholar] [CrossRef] [Green Version]
  3. Fazelpour, F. Energetic and exergetic analysis of carbon dioxide transcritical refrigeration systems for hot climates. Thermal Science 2015, 19, 905–914. [Google Scholar] [CrossRef]
  4. Elbel, S.; Hrnjak, P. Experimental validation of a prototype ejector designed to reduce throttling losses encountered in transcritical R744 system operation. Int. J. Refrig. 2008, 31, 411–422. [Google Scholar] [CrossRef]
  5. Kursad, E.H.; Nagihan, B. Performance characteristics of ejector expander transcritical CO2 refrigeration cycle. Proc. Inst. Mech. Eng. Part A J. Power Energy 2014, 226, 623–635. [Google Scholar]
  6. Brian, T.A.; Sumathy, K. Transcritical carbon dioxide heat pump systems: A Review. Renew. Sustain. Energy Rev. 2011, 15, 4013–4029. [Google Scholar]
  7. Elbel, S.; Lawrence, N. Review of recent developments in advanced ejector technology. Int. J. Refrig. 2016, 62, 1–18. [Google Scholar] [CrossRef]
  8. Yang, J.L.; Ma, Y.T.; Li, M.X.; Guan, H.Q. Exergy analysis of transcritical carbon dioxide refrigeration cycle with an expander. Energy 2005, 30, 1162–1175. [Google Scholar] [CrossRef]
  9. Murthy, A.A.; Subiantoro, A.; Norris, S.; Fukuta, M. A review of expanders and their performance in vapour compression refrigeration systems. Int. J. Refrig. 2019, 106, 427–446. [Google Scholar] [CrossRef]
  10. Boewe, D.E.; Bullard, C.W.; Yin, J.M.; Hrnjak, H.S. Contribution of Internal Heat Exchanger to Transcritical R-744 Cycle Performance. HVAC&R Res. 2011, 7, 155–168. [Google Scholar]
  11. Wang, Z.; Gong, Y.; Wu, X.H.; Zhang, W.H.; Lu, Y.L. Thermodynamic analysis and experimental research of transcritical CO2 cycle with internal heat exchanger and dual expansion. Int. Air Cond. Refrig. 2013, 21, 1350005. [Google Scholar] [CrossRef]
  12. Nilesh, P.; Dileep, K.G.; Mani, S.D. Experimental investigation of a CO2 trans-critical cycle with IHX for chiller application and its energetic and exergetic evaluation in warm climate. Appl. Therm. Eng. 2018, 136, 617–632. [Google Scholar]
  13. Mehrdad, S.; Dadsetani, R.; Amiriyoon, A.; Leon, A.S.; Safaei, M.R.; Goodarzi, M. Exergo-economic optimization of organic rankine cycle for saving of thermal energy in a sample power plant by using of strength pareto evolutionary algorithm II. Processes 2020, 8, 264. [Google Scholar] [CrossRef] [Green Version]
  14. Dadsetani, R.; Sheikhzadeh, G.A.; Safaei, M.R.; Alnaqi, A.A.; Amiriyoon, A. Exergoeconomic optimization of liquefying cycle for noble gas argon. Heat Mass Transf. 2019, 55, 1995–2007. [Google Scholar] [CrossRef]
  15. Rangel-Hernández, V.H.; Belman-Flores, J.M.; Rodríguez-Valderrama, D.A.; Pardo-Cely, D.; Rodríguez-Muñoz, A.P.; Ramírez-Minguela, J.J. Exergoeconomic performance comparison of R1234yf as a drop-in replacement for R134a in a domestic refrigerator. Int. J. Refrig. 2019, 100, 113–123. [Google Scholar] [CrossRef]
  16. Fazelpour, F.; Morosuk, T. Exergoeconomic analysis of carbon dioxide transcritical refrigeration machines. Int. J. Refrig. 2014, 38, 128–139. [Google Scholar] [CrossRef]
  17. Nemati, A.; Nami, H.; Yari, M. A comparison of refrigerants in a two-stage ejector-expansion transcritical refrigeration cycle based on exergoeconomic and environmental analysis. Int. J. Refrig. 2017, 84, 139–150. [Google Scholar] [CrossRef]
  18. Megdouli, K.; Sahli, H.; Tashtoush, B.M.; Nahdi, E.; Kairouani, L. Theoretical research of the performance of a novel enhanced transcritical CO2 refrigeration cycle for power and cold generation. Energy Convers. Manag. 2019, 201, 112139. [Google Scholar] [CrossRef]
  19. Gullo, P.; Cortella, G. Comparative exergoeconomic analysis of various transcritical R744 commercial refrigeration systems. In Proceedings of the ECOS 2016, Portorož, Slovenia, 19–23 June 2016. [Google Scholar]
  20. Nilesh, P.; Dileep, K.G.; Mani, S.D. Energetic and economic analysis of trans-critical CO2 booster system for refrigeration in warm climatic condition. Int. J. Refrig. 2017, 80, 182–196. [Google Scholar]
  21. Liao, S.M.; Zhao, T.S.; Jakobsen, A. A correlation of optimal rejection pressures in transcritical carbon dioxide cycles. Appl. Therm. Eng. 2000, 20, 831–841. [Google Scholar] [CrossRef]
  22. Li, D.; Groll, E.A. Transcritical CO2 refrigeration cycle with ejector expansion device. Int. J. Refrig. 2005, 28, 766–773. [Google Scholar] [CrossRef] [Green Version]
  23. Sarkar, J.; Bhattacharyya, S.; Ram Gopal, M. Optimization of a transcritical CO2 heat pump cycle for simultaneous cooling and heating applications. Int. J. Refrig. 2004, 27, 830–838. [Google Scholar] [CrossRef]
  24. Huashan, L.; Fei, C.; Xianbiao, B.; Lingbao, W.; Xianlong, W. Performance characteristics of R1234yf ejector-expansion refrigeration cycle. Appl. Energy 2014, 121, 96–103. [Google Scholar]
  25. Bejan, A.; Tsatsaronis, G.; Moran, M. Thermal Design and Optimization; John Wiley and Sons: New York, NY, USA, 1996. [Google Scholar]
  26. Nemati, A.; Nami, H.; Yari, M.; Ranjbar, F.; Kolvir, H.R. Development of an exergoeconomic model for analysis and multi-objective optimization of a thermoelectric heat-pump. Energy Convers. Manag. 2016, 130, 1–3. [Google Scholar] [CrossRef]
  27. Ghaebi, H.; Parikhani, T.; Rostamzadeh, H. A novel trigeneration system using geothermal heat source and liquiefied natural gas cold energy recovery: Energy, exergy and exergoeconomic analysis. Renew. Energy 2018, 119, 513–527. [Google Scholar] [CrossRef]
  28. Ghaebi, H.; Parikhani, T.; Rostamzadeh, H. Energy, exergy and thermoeconomic analysis of a novel combined cooling and power system using low-temperature heat source and LNG cold energy recovery. Energy Convers. Manag. 2017, 50, 678–692. [Google Scholar] [CrossRef]
  29. Parikhani, T.; Gholizadeh, T.; Ghaebi, H.; Sadat, S.M.S.; Sarabi, M. Exergoeconomic optimization of a novel multigeneration system driven by geothermal heat source and liquefied natural gas cold energy recovery. J. Clean. Prod. 2019, 209, 550–571. [Google Scholar] [CrossRef]
  30. Tsatsaronis, G. Thermoeconomic analysis and optimization of energy systems. Prog. Energy Combust. Sci. 1993, 19, 227–257. [Google Scholar] [CrossRef]
  31. Misra, R.D.; Sahoo, P.K.; Sahoo, S.; Gupta, A. Thermoeconomic optimization of a single effect water/LiBr vapour absorption refrigeration system. Int. J. Refrig. 2003, 26, 158–169. [Google Scholar] [CrossRef]
  32. Farschi, L.G.; Mahmoudi, S.S.; Rosen, M.A. Exergoeconomic comparison of double effect and combined ejector-double effect absorption refrigeration systems. Appl. Energy 2013, 103, 700–711. [Google Scholar] [CrossRef]
  33. Mosafia, A.H.; Farschi, L.G.; Ferreira, C.I.; Rosen, M.A. Exergoeconomic and environmental analysis of CO2/NH3 cascade refrigeration systems equipped with different types of flash tank intercoolers. Energy Convers. Manag. 2017, 117, 442–453. [Google Scholar] [CrossRef] [Green Version]
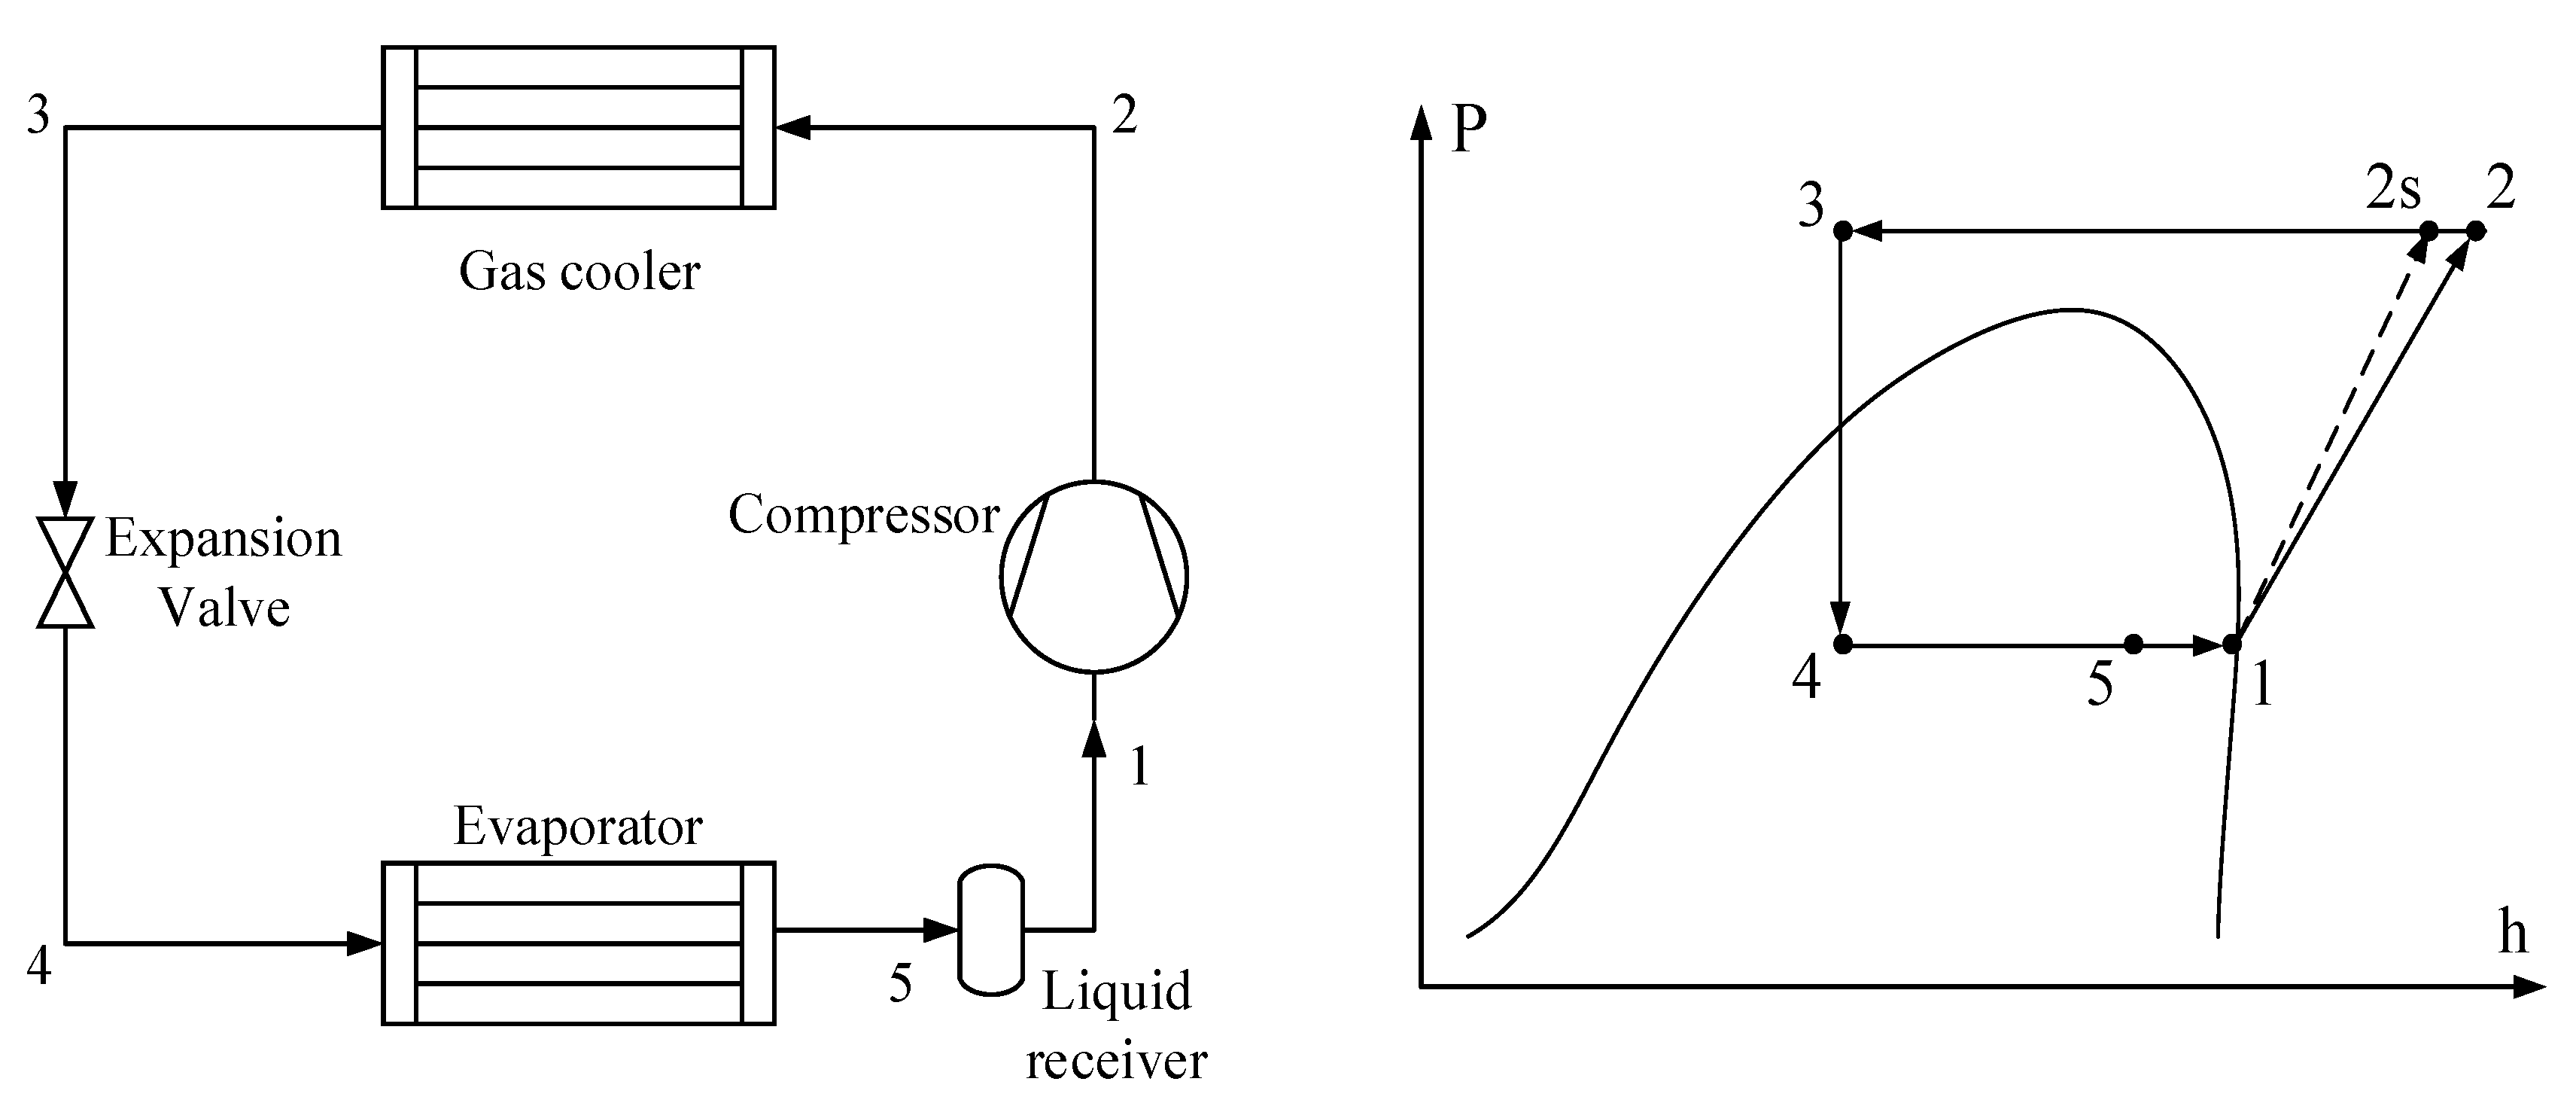
Figure 1. Schematic diagram of a basic transcritical CO2 refrigeration cycle (model 1: base cycle).
Energies 13 06454 g001
Figure 2. Schematic diagram of a transcritical CO2 cycle with an internal heat exchanger (model 2: internal heat exchanger (IHX) cycle).
Energies 13 06454 g002
Figure 3. Schematic diagram of the transcritical CO2 cycle with a turbine (model 3: turbine cycle).
Energies 13 06454 g003
Figure 4. Schematic diagram of the transcritical CO2 cycle with an ejector (model 4: ejector cycle).
Energies 13 06454 g004
Figure 5. Variations in exergy efficiency due to the: (a) evaporating temperature; (b) gas cooler outlet temperature; (c) pressure ratio.
Energies 13 06454 g005
Figure 6. Variations in the product cost rate due to the: (a) evaporating temperature; (b) gas cooler outlet temperature; (c) pressure ratio.
Energies 13 06454 g006
Figure 7. Variations in the exergy destruction cost due to the: (a) evaporating temperature; (b) gas cooler outlet temperature; (c) pressure ratio.
Energies 13 06454 g007
Figure 8. Variations of the exergoeconomic factor, f, due to: (a) the evaporating temperature; (b) the gas cooler outlet temperature; (c) the pressure ratio.
Energies 13 06454 g008
Figure 9. Variations of the CO2 penalty cost rate due to the: (a) evaporating temperature; (b) gas cooler outlet temperature; (c) pressure ratio.
Energies 13 06454 g009
Table 1. Proposed operating conditions for the transcritical cycle in the simulation.
ParameterValue
Evaporating temperature263 K
Gas cooler temperature308 K
Isentropic efficiency of the compressor η c = 1.003 0.121 ( P 2 P 1 ) [21]
Isentropic efficiency of the turbine0.75
Internal heat exchanger effectiveness 0.5
Nozzle efficiency0.85
Diffuser efficiency0.85
Cooling capacity7 kW
Pressure drop in the suction nozzle0.03 MPa [22]
Environmental state298 K
1.01 MPa
Table 2. Cost function equations of the equipment considered in the refrigeration cycles.
EquipmentCost Function EquationsReference ValuesRef.
Compressor I C C = 10167.5 · W ˙ 0.46 [31]
Evaporator I C C = I C C r e f ( A A r e f ) 0.6 ICCref = 16000
Aref = 100 m2
[32]
Gas cooler I C C = I C C r e f ( A A r e f ) 0.6 ICCref = 8000
Aref = 100 m2
[32]
Internal heat exchanger I C C = I C C r e f ( A A r e f ) 0.6 ICCref = 12000
Aref = 100 m2
[32]
Ejector I C C = 0
Expansion valve I C C = 133
Table 3. Summary of the exergy and exergoeconomic equations for all refrigeration cycles.
ComponentExergy AnalysisExergoeconomic Analysis
Compressor E ˙ F , c o m p = W ˙ c o m p C ˙ o C ˙ i = C ˙ c o m p + Z ˙ c o m p
E ˙ P , c o m p = E ˙ o E ˙ i C ˙ c o m p = W ˙ c o m p * C e l e c
Gas cooler E ˙ F , g a s c = E ˙ i E ˙ o C ˙ P , g a s c = C ˙ i C ˙ o + Z ˙ g a s c
E ˙ P , g a s c = ( 1 T 0 T g a s c ) Q ˙ g a s c C ˙ P , g a s c = E ˙ P , g a s c * C P , g a s c
Expansion valve E ˙ F , e x p v a l = E ˙ i , E ˙ P , e x p v a l = E ˙ o C ˙ o = C ˙ i + Z ˙ e x p v a l
Evaporator E ˙ F , e v a p = E ˙ i E ˙ o C ˙ P , e v a p = C ˙ i C ˙ o + Z ˙ e v a p
E ˙ P , e v a p = ( 1 T 0 T e v a p ) Q ˙ e v a p C ˙ P , e v a p = E ˙ P , e v a p * C P , e v a p
C o = C i
Ejector E ˙ F , e j e c = E ˙ i
E ˙ P , e j e c = E ˙ o C ˙ p ,   e j e c = C ˙ i + Z ˙ e j e c
aTurbine E ˙ F , t u r b = E ˙ i E ˙ o C ˙ P , t u r b = C ˙ i C ˙ o + Z ˙ t u r b
E ˙ P , t u r b = W ˙ t u r b C ˙ P , t u r b = E ˙ P , t u r b * C p , t u r b
C o = C i
Internal heat
exchanger
C ˙ P , I H X = C ˙ F , I H X + Z ˙ I H X
E ˙ P , I H X = E ˙ c , o E ˙ c , i C ˙ P , I H X = E ˙ P , I H X * C P , I H X
E ˙ F , I H X = E ˙ h , i E ˙ h , o C ˙ F , I H X = E ˙ F , I H X * C F , I H X
C h , o = C h , i
Publisher’s Note: MDPI stays neutral with regard to jurisdictional claims in published maps and institutional affiliations.