Article

Experimental and Numerical Investigation of the Behavior of Automotive Battery Busbars under Varying Mechanical Loads

by
Tobias Werling
1,*,†,
Marvin Sprenger
1,†,
Christian Ellersdorfer
2 and
Wolfgang Sinz
2
1
Mercedes-Benz AG, HPC X631, 71059 Sindelfingen, Germany
2
VSI—Institute of Vehicle Safety, University of Technology Graz, Inffeldgasse 23/I, 8010 Graz, Austria
*
Author to whom correspondence should be addressed.
These authors contributed equally to this work.
Energies 2020, 13(24), 6572; https://doi.org/10.3390/en13246572
Submission received: 10 November 2020 / Revised: 3 December 2020 / Accepted: 11 December 2020 / Published: 13 December 2020
(This article belongs to the Special Issue Crash Safety of Lithium-Ion Batteries)

Abstract

:
Automotive high-voltage busbars are critical electrical components in electric vehicle battery systems as they connect individual battery modules and form the connection to the vehicle’s powertrain. Therefore, a vehicle crash can pose a significant risk to safety by compromising busbar insulation, leading to electrical short circuits inside the battery. In turn, these can trigger thermal chain reactions in the cell modules of the battery pack. In order to ensure a safe design in future applications of busbars, this study investigated the mechanical behavior of busbars and their insulation. Our results indicated that crashlike compressive and bending loads lead to complex stress states resulting in failure of busbar insulation. To estimate the safety of busbars in the early development process using finite element simulations, suitable material models were evaluated. Failure of the insulation was included in the simulation using an optimized generalized incremental stress state dependent model (GISSMO). It was shown that sophisticated polymer models do not significantly improve the simulation quality. Finally, on the basis of the experimental and numerical results, we outline some putative approaches for increasing the safety of high-voltage busbars in electric vehicles, such as choosing the insulating layer material according to the range of expected mechanical loads.

1. Introduction

Current climate and CO 2 targets are accelerating the trend towards electric mobility. In recent years, an increasing number of car manufactures have introduced electric vehicle (EV) programs that have led to a strong increase in the share of EVs in the overall market [1]. The most commonly used battery technology in electric vehicles is the lithium-ion battery. However, as a result of their chemical properties and high energy density, they pose a safety risk in the event of a vehicle crash [2,3]. Large mechanical deformations during a crash can lead to severe mechanical, electrical, or thermal faults within the battery system that can end in a thermal runaway (TR) of the battery cells [4,5]. Thereafter, an irreversible process within the cells takes place, during which excessive heat development, gas leakage, or a fire can occur that can, in the worst case, spread throughout the battery [6]. In addition to damage to the cell itself, the origin of a TR can be caused by, among other things, damage to electrical components creating electrical short circuits [7].
High-voltage (HV) busbars are electrical components that are found in almost all batteries and carry a high safety risk due to their current-carrying properties. Automobile HV busbars are used to connect individual battery modules inside the battery pack. They are preferably used over of cables and connect the modules in series or parallel depending on the configuration. Busbars offer advantages over cables in terms of space, manufacturing costs, electrical performance, and reliability [8,9]. A conducting core of copper in combination with thermoplastic insulation is frequently used.
As a result of their placement between the battery housing and the cell modules, they have a high probability of deformation during a severe vehicle crash. The displacement of modules or the intrusion of the battery housing can lead to mechanical loads on the busbars and damage to their insulation. However, current battery research regarding crash safety mainly deals with the analysis of battery cells and their components being subjected to mechanical abuse [3,10,11], although these undergo mechanical deformation after the surrounding electrical components. To date, few studies have investigated the safety of electrical battery components under mechanical loads. Recently, it was shown that compressive loads using different impactor shapes on high-voltage busbars can lead to electrical short circuits [12]. Such short circuits are particularly severe if busbars are used to connect the individual battery modules; at worst, they can cause a short circuit of a cell, leading to TR that propagates through the entire battery pack.
To predict and avoid these risks as early as possible, it is essential to gain knowledge about the mechanical behavior of battery components, including via modeling and simulation. However, models of battery modules or battery packs are often simplified to minimize the degree of complexity and computing time. Xia et al. [13] simulated the recent Tesla incident of ground impact on the battery module, which only consisted of cells and housing. Existing cooling or cell connections were neglected. Kukreja et al. [14] showed the effect of a vehicle crash on individual battery modules, which were homogenized macrofinite element models without any other battery components. In addition, Xia et al. [15] conducted dynamic tests of battery modules in a drop tower to simulate mechanical crash conditions. Extreme damage to the entire module occurred, resulting in the module catching fire. In such a scenario, it can be assumed that all components within the load path would suffer severe damage. Precise characterization of the involved materials and the failure of these components is required in advance.
Therefore, the primary aim of this study was to develop efficient experimental and numerical methods in order to predict the safety risk of high-voltage automotive busbars under varying mechanical loads. A secondary aim was to use any results derived thereof in order to inform recommendations for the optimal design of busbars as well as their safety-related placement within the EV battery pack. This work aimed to establish the foundations for future modeling of electrical components during the early development process of electric vehicles so as to reduce the risk of electrical short-circuiting inside the battery. In order to achieve this goal, both the individual materials and the busbars were subjected to intensive mechanical tests to extract material parameters for the calibration of suitable material models. In particular, the suitability of commercially available material models for plastics was investigated regarding relevant load cases. The models were judged based on the validation with component tests and their computational cost since both are of great importance for subsequent crash simulations. The modeling of material failure was included to guarantee the best possible results.

2. Materials and Methods

Figure 1 shows a schematic diagram of the concept and tests used in order to achieve the aim of this paper. As a first step, the boundary conditions of the busbars that can be derived from a battery pole crush simulation as well as environmental conditions were analyzed. HV busbars are usually attached to the outer housing of the individual battery modules, whereby they are exposed to penetrations with other components due to the compact design of the battery modules. A detailed benchmark analysis was carried out in earlier work, in which the positions and risks of busbars in 47 benchmark vehicles were analyzed [12]. The analysis showed the particularly dangerous conditions for busbars during a side crash. Bending and compressive loads due to intruding objects like sheet metal edges or screw heads especially affect busbars and need to be considered for experiments. Another important factor influencing the mechanical behavior of the busbars is the thermal load during operation. As a result of short-term high currents within the battery system during charging and discharging, as well as during strong acceleration processes, busbars can reach temperatures of up to 80 °C in operation. This particularly influences the mechanical behavior of the insulating materials, of which the glass transition temperature is below the prevailing operating temperature. According to these boundary conditions, a material characterization was carried out using specified mechanical tests which are explained in detail in the following section. After extracting material parameters from the test results describing the elastic and plastic properties, suitable material models were calibrated in LS-DYNA R12. By varying the parameters that could not be directly extracted from the experimental results, the material models were further optimized using a reverse-engineering process. Three-point-bending tests of each material were used as prevalidation to check the accuracy of the optimized material models. The completion of the study consisted of the execution and simulation of validation tests of the overall component HV busbar. Additionally, the interface modeling between the insulation layer and the copper core was investigated as well as the failure modeling of the insulation.

2.1. Busbar Materials

HV busbars used for electrical module connection usually consist of a conducting copper core and thermoplastic insulation that envelops the copper [9]. According to manufacturers, the copper cross-sectional area typically ranges between 70 mm 2 and 90 mm 2 due to the possibility of high electrical currents. The conductor material examined in the study is an electrolytic tough pitch (ETP) copper Cu-OFE R200 commonly used in automotive electrical components. Two of the most widely used thermoplastic insulating materials are the semi-crystalline polyamide PA12 and the glass fiber-reinforced polyamide PA6GF30. Due to the different insulating materials used, the manufacturing processes of the busbar types also differ. In the production of the PA12 busbar, the unreinforced material is applied by an extrusion process. As a result of thermal shrinkage of the insulation during the cooling process, a strong mechanical connection between the two materials originates. In contrast, the insulation made of PA6GF30 is applied by injection molding, resulting in a weaker bond between the insulation and the copper. Table 1 shows the nominal mechanical properties of the investigated materials.

2.2. Experimental Setup

In order to adequately describe the material behavior in the simulation models, a detailed experimental test program is necessary, which takes into account the characteristic factors that influence the mechanical behavior of plastics. The influence of the strain rate was considered to be particularly important, as it has a great influence on the mechanical behavior of plastics. The temperature dependency was also investigated to determine the influence of the glass transition on the mechanical behavior of the plastics. As complex stress states can act on the insulation during a vehicle crash, the material was investigated regarding tension, compression, and shear loads. For the prevalidation of the derived material models, three-point-bending (3PB) tests were carried out as well, because they represent an important load case of busbars combining tensile and compression loads. In all tests using the thermoplastics, the load was applied in the flow direction of the extrusion process for PA12 and parallel to the fiber direction for PA6GF30. This is the most probable loading direction of the busbars. An overview of the conducted tests is shown in Table 2.
The temperature-dependent tests were conducted at 60 °C and at the maximum busbar operating temperature of 80 °C. The samples were heated in an integrated climate chamber of the test machine Zwick Z250 with a load cell of 250 kN. The specimen temperature was monitored by thermocouples of type K with an accuracy of ±0.75%. To determine the influence of the strain rate, high-speed tests with strain rates of 100 1/s and 200 1/s were performed for both PA12 and PA6GF30 using the Instron VHS J4185 testing machine. Quasi-static strain rates were tested on the testing machine Zwick Z050, which measures nominal loads of 50 kN. Additionally, high-speed 3PB tests were conducted with a 4a Impetus testing machine. All tests were performed displacement-controlled with the termination criteria of a 80% force reduction. To determine the local strains and stresses during the tests, the digital image correlation method was used, which uses digital imagery of the surface of the test specimens to determine material strains. Local deformations could be determined by this method using the software GOM ARAMIS, which analyzes a stochastic pattern applied on the specimen surface. To calculate the strains, a local point method was used. In order to ensure statistical significance of the results, each plastics test was conducted five times in accordance with the ISO 527-1 standard [24]. The copper material was tested three times per setting according to the standard ISO 6892-1 [19]. In the 3PB component test, the busbars were bent between two mountings of 5-mm radius by a pressure fin with a radius of 5 mm. As a result of the different sample geometries of the PA12 and PA6GF30 busbar, the mounting distances were set to 120 mm or 70 mm. In the compression test of the busbars, a cylindrical impactor with a radius of 25 mm and a triangle shaped sharp impactor with 90° flank angle was used. These tests were also conducted displacement-controlled with a speed of 0.1 mm/s until electrical failure (short circuit) occurred or the load limits of the load cell were reached. A hydraulic press with an accuracy of 1 mm and a load cell of the type GMT series K 63 kN (accuracy 0.02%) was used.

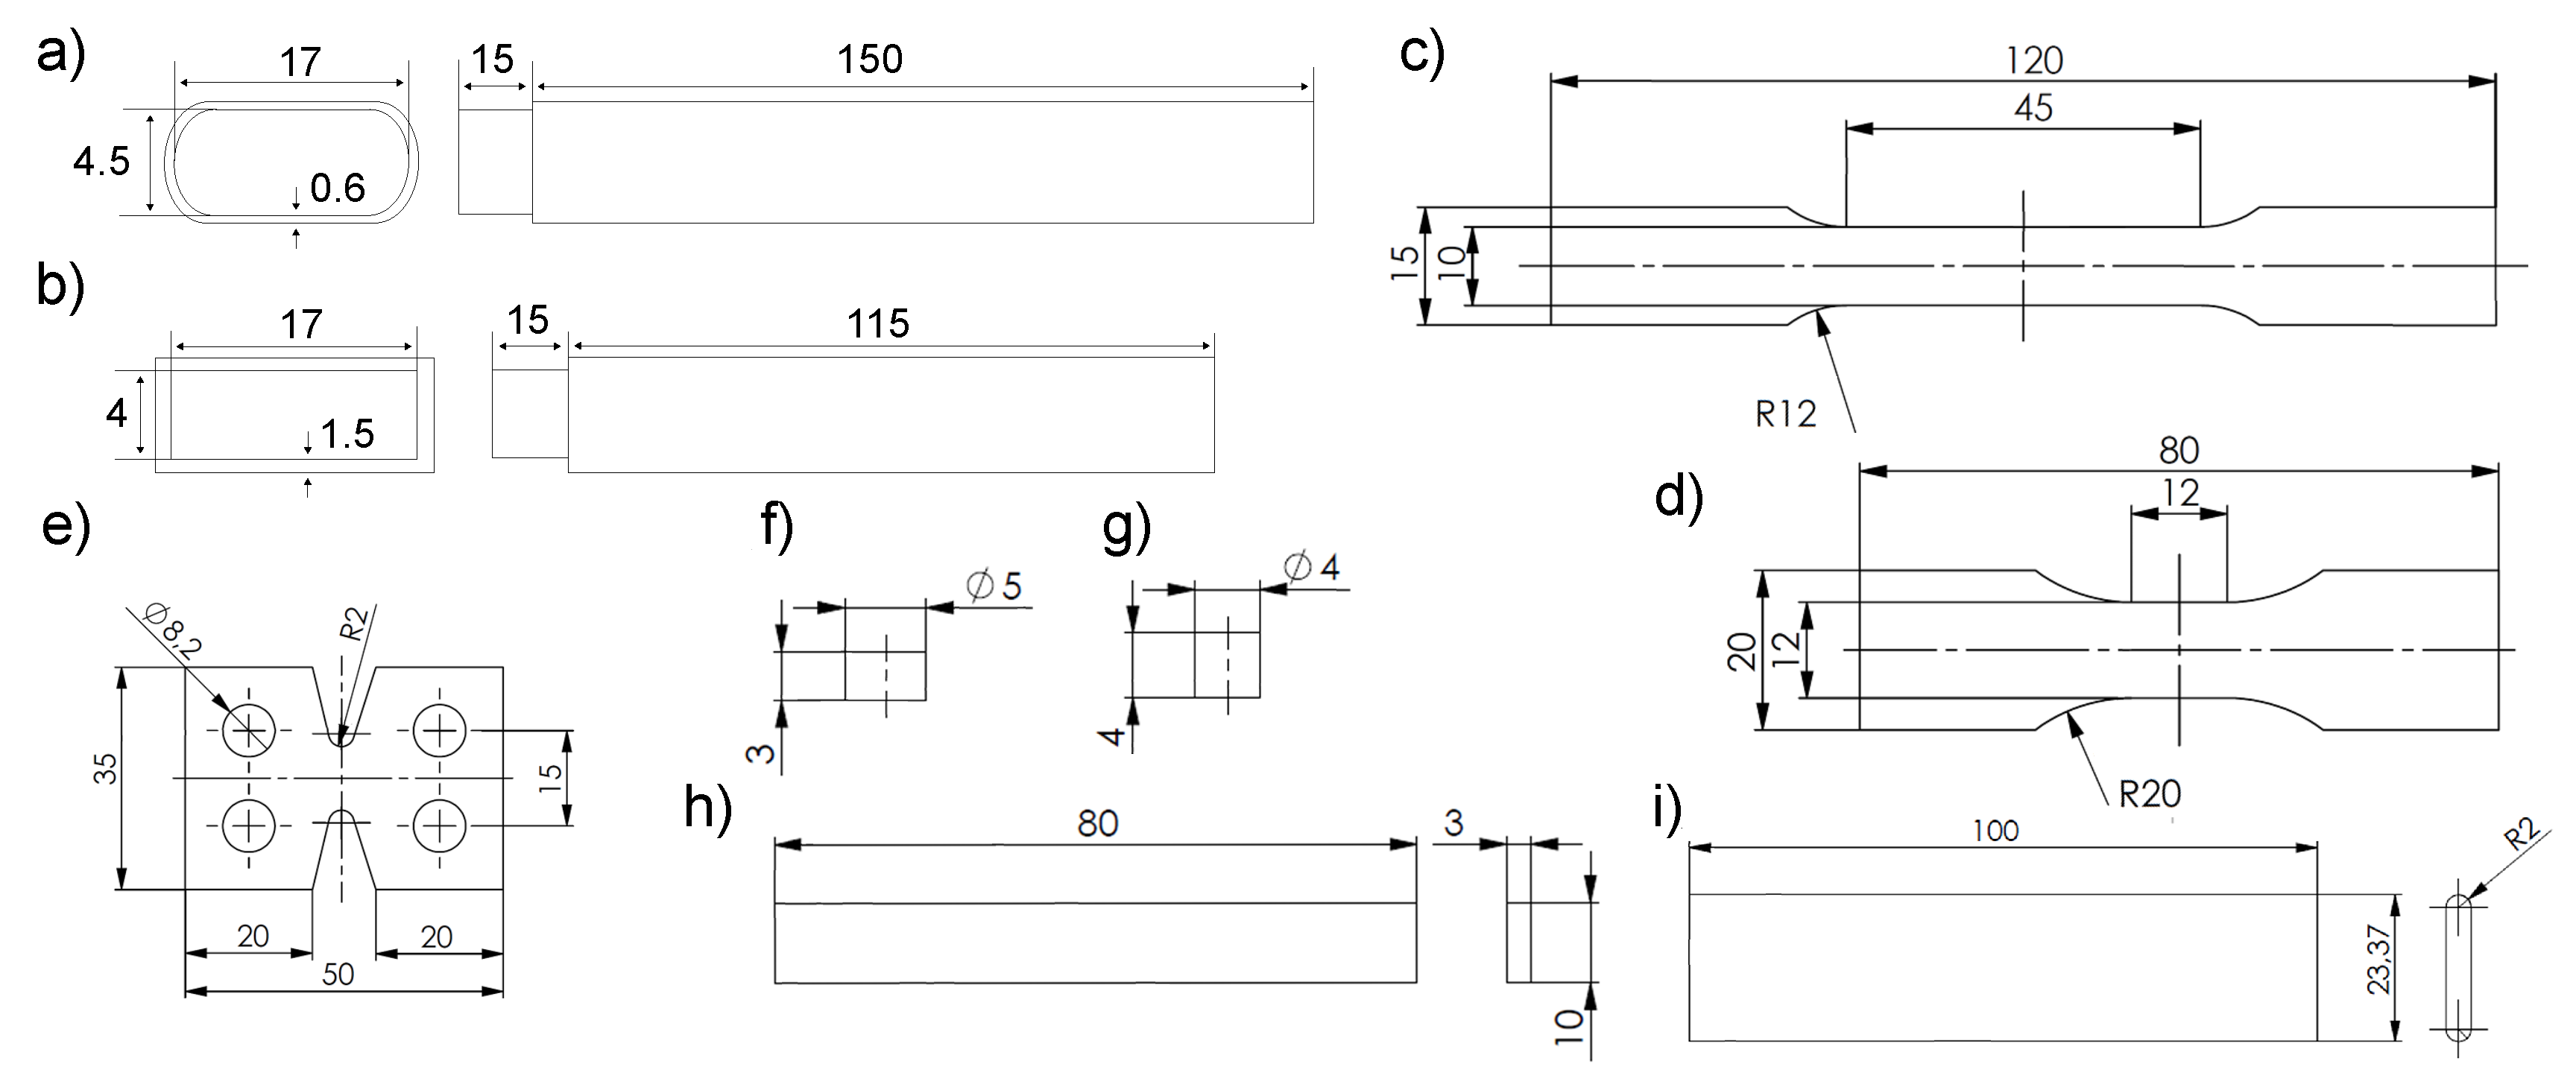
2.3. Specimen Geometry

The specimen geometries used for the material characterization are shown in Figure 2. The insulation thickness of the busbars varied as a result of the manufacturing processes between PA12 and PA6GF30. The specimen used for the tests of the Cu-OFE R200 copper material was designed in accordance with ISO 6892-1 [19] standards for tension and EN 50106 [20] for compression. For the copper bending specimen, real busbar geometry was used to allow the most accurate reproduction of the deformation behavior. Furthermore, it enables the modeling of the real cross section of the copper material in the prevalidation model. Thus, the same mesh could be used for the copper material in the later busbar simulation. When selecting the plastic tensile samples, certain important influential factors must be taken into account. These include, among other factors, the manufacturing process, which was carried out in accordance with ISO 527-2 [21] by injection molding with subsequent water jet cutting of the samples. Furthermore, the observance of a clearly defined stress state in the parallel specimen section, a homogeneous strain rate over the entire test, and the usability of optical strain measurements are of high importance [25]. For this purpose, a tensile specimen described in a study by Becker et al. [26] was used. For the compression samples of the plastics, rotationally symmetric samples according to ISO 604 [22] were used to prevent buckling of samples that were too long. As a result of the limited thickness of the provided injection molding plates, the plastic pressure samples with a height of 3 mm did not reach the exact standard height. The sample selection for the three-point-bending tests was made in accordance with ISO 178 [23]. A sample geometry developed according to Arcan [27] was used for the testing of shear loads. Here, the shear load was applied in the middle sample area by fixed clamping on one side and movable clamping on the other. Since the polyamides used are subject to a significant influence of moisture, the moisture level was conditioned to a saturated state prior to the tests. The standard ISO 1110 [28] for the accelerated conditioning of polyamide specimens was used. Here, the samples were conditioned at 70 °C and with a humidity of 62% in a climatic chamber until the percentage increase of the mass due to water absorption in two consecutive measurements was less than 0.1%.

3. Experimental Material Characterization

The focus of this section is the results of the tensile and pressure tests of the plastics, as they are of the highest relevance and best reflect the factors influencing the mechanical behavior. Since the high-speed test under tensile load produced strong vibrations due to the impactlike load, curves were smoothed in advance using the moving average method with five data points (strain increment 0.005 each).
Figure 3 is used to illustrate the results of the tensile and compression tests. As suspected, for both materials under uniaxial tensile load, the yield stress increases with the strain rate compared to the quasi-static test (0.001 1/s). It is particularly noticeable that the hardening behavior of the thermoplastics occurs at higher strain for increasing strain rate, which can be justified by the increasingly limited mobility of the polymer chains. This effect originates in the reduced reaction time for deformation [29]. A comparison of the materials PA12 and PA6GF30 shows that both can be particularly distinguished by failure strain. The glass fiber-reinforced plastic PA6GF30 has a much higher strength and exhibits brittle fracture at a strain of around ϵ b = 0.15 due to the failure of the glass fibers. The unreinforced thermoplastic PA12 results in a highly ductile material behavior with an averaged failure strain for all strain rates between 0.8 and 1.05 for the conducted repetitions. A continuous failure occurs due to forming shear bands in the necking area of the sample. PA6GF30, on the other hand, exhibits fracture with small plastic deformations.
The dependence of the mechanical behavior on the temperature in Figure 3b illustrates a behavior that is opposite to the strain rate dependency. The stress values decrease with an increase in temperature, whereby the effect of Brown’s molecular movement above the glass transition temperature shows its effect. The result is an increasing oscillation of the molecular chains which gain mobility and thus allow for a better deformation of the material [29]. As a result, the forces needed for deformation of the material decrease. Due to the larger plastification of the materials, failure strain increases, which is less distinct due to the influence of the glass fibers in PA6GF30. Nevertheless, the matrix material softens, resulting in a reduction in the stress values. For the PA12 material, no failure can be observed at a sample temperature of 80 °C up to a total strain of ϵ = 1.3 .
The evaluation of the compression tests in Figure 3c,d shows similar dependencies on the strain rate and temperature as compared with those in tensile tests. For both materials, significant increases in stress are observed at increased strain rates, with stress approaching quasi-static values at true strains higher than ϵ = 0.3 . As a result of the unavoidable barrel-shaped behavior of the specimen due to friction, the stress-strain curves are only considered up to a strain of ϵ = 0.3 . The approach is based on that in [30]. Overall, the glass fibers in PA6GF30 lead to significantly higher stresses compared with those in PA12. Under temperature influence, Figure 3d shows a relieved deformation of the materials as already observed in the tensile tests. This can be explained by the softening of the amorphous structures and results in reduced stress gradients at T= 60 °C, which is above the glass transition temperature.
The evaluation of the yield strength and Young’s moduli in Figure 4 reveals the plastic-specific influences of the strain rate which are of great importance in the course of subsequent material modeling. A linear relationship between the two Young’s moduli and the yield strength can be observed on a logarithmic plot of the strain rate. Under compressive load, the values of the yield strength are higher than those under tension. For a strain rate of 1.0 1/s, it increases about 20%. With PA12, no difference is visible at a strain rate of 1.0 1/s depending on the stress state. The analysis of the Young’s moduli versus the strain rate dependency also shows a linear relationship between the material PA6GF30 under tension and compression on a logarithmic x-axis. In the quasi-static range, the compression of the glass fibers results in a reduced Young’s modulus of up to 25% compared to tension. The material PA12 also shows a difference between the Young’s modulus in tension and compression modules of 22%, whereby the Young’s modulus increases under compressive load. This behavior can be explained by the increasing compression of the polymer chains and the resulting stiffening due to reduced freedom of movement.

4. Material Modeling

4.1. Selection of Material Models

In order to describe the material behavior of the components as precisely as possible, selected material models available in the commercial finite element (FE)-solver LS-DYNA R12 are presented in this section. The commonly used models Mat-24, Mat-124, and Samp-1, which are suitable for the description of plastics and metals, have already been presented for this purpose in [31]. It is of great importance to predict the material behavior of the insulating layer. Thus, this study focuses on the modeling of the insulation’s viscoplastic material behavior and the tension–compression anisotropy in the simulation. Furthermore, the consideration of viscoelastic behavior, which describes the influence of strain rate on the yield strength and the Young’s modulus, is of interest. As the temperatures investigated in the experiments only represent a small amount of the thermal load spectrum, the description of a temperature dependence is neglected. An overview of the selected models and their properties is displayed in Table 3.
Mat-24 (piecewise linear plasticity) is one of the most commonly used material models in crash simulations [32]. It is an elasto-viscoplastic material model and was originally developed for the description of metals. It is based on the von Mises flow condition as defined by Equation (1) [31], where I I σ describes the invariant stress tensor and σ 0 the initial yield strength. σ y represents the current yield strength and thus the radius of the yield cylinder [33].
f ( I I σ ) = I I σ σ y 2 3 < = 0 where σ y = β [ σ 0 + f h ( ϵ p l ) ]
No differentiation between tension and compression properties is possible in this model. Nevertheless, the model was used in previous works [34,35] to describe the mechanical behavior of thermoplastics. In this paper, the material model was used in particular due to its computational performance, simple calibration, and for benchmarking purposes. The material model Mat-124 (tension–compression plasticity) provides the necessary description of the compressive stress state. In this material model, the compressive properties are taken into account by a second von Mises yield cylinder along the hydrostatic axis in the compression range. This results in two different flow surfaces for tension and compression, which can each be calibrated by a separate yield curve. In the case of overlaps of tensile and compression loads, interpolation between the two curves is carried out using a Drucker–Prager cone [31,32].
The last material model under consideration for the thermoplastic insulation layer is the Samp-1 model developed for unreinforced plastics according to [36]. It is one of the most complex phenomenological models for thermoplastics available in LS-DYNA and enables the representation of plastic-specific deformation properties such as viscoelasticity and viscoplasticity. A distinction can be made between tensile, compression, and shear loads as well as biaxial tensile and compression loads [31,36]. To achieve this, the Samp-1 model varies the yield surface according to the types of load introduced in the model in the form of yield curves. When fully calibrated using at least three yield curves, e.g., for tension, compression, and shear, the yield surface is represented through a second degree polynomial [37]. The flow rule is shown in Equation (2). Here, the internal coefficients of the algorithm D i introduce the dependencies of tensile, pressure, and shear loads, σ v m describes the von Mises stress, and p describes the hydrostatic pressure [32].
f = σ v m D 0 D 1 p D 2 p 2 < = 0 where D 0 = 3 σ s 2 D 1 = 9 σ s 2 ( σ c σ t σ c σ t ) D 2 = 9 ( σ c σ t 3 σ s 2 σ c σ t )
Another important aspect of the model is the adoption of compressible material behavior. Thus, the definition of the plastic Poisson’s ratio ν p l rejects the assumption of constant volume [33]. The plastic Poisson’s ratio is taken into account in the plastic potential g according to Equation (3) [36].
g = σ v m 2 + ω p 2 where ω = 9 ( 1 2 ν p l ) 2 ( 1 + ν p l )

4.2. Material Model Optimization Procedure

The presented material models were calibrated by the determined test data in the form of yield curves and material parameters. In order to calibrate the material models, the elementary tensile and compression tests were simulated under quasi-static and dynamic conditions. The material models Mat-24 and Mat-124 were optimized based on the comparison of the force-displacement curves between the experimental work and simulation. To optimize the models, an iterative adjustment of the hardening curves with an analytic approach according to Ludwik [38] was used. Here, the σ y describes the yield strength, ϵ w the true elongation, n the hardening exponent, R m the tensile strength of the material, and e Euler’s number [38,39].
σ y ( ϵ w ) = σ 0 + a ϵ w n where a = R m ( e n ) 2
The yield curves determined by the tests were also implemented in the material model Samp-1. The optimization of Samp-1 was carried out by an iterative adjustment of the evolution of the plastic Poisson’s ratio ν p l according to Equation (5) by the addition of the increment h ( j ) per data point i of the implemented curve. The specified increment h ( j ) was added up until a deviation of the simulation and test curves occurs whereupon the value was adjusted. Thus, several adjustment areas j were created which indicate the optimization of the increment h ( j ) .
ν p l , i + 1 = ν p l , i + h ( j )
After the individual strain rates were calibrated, the individual material cards per strain rate were transferred to a strain-rate-dependent material model. In all simulations, a preperformed convergence analysis determined a feature element size of 0.5 mm. The element type was hexagonal fully integrated solid element. For further details, the reader is referred to [33]. In the compression simulation, rigid bodies represent the hardened steel plates used in the experiment. Frictional parameters for the contact between steel and polyamide were set to μ = 0.3 as per Gomeringer [40].

4.3. Generalized Incremental Stress State Dependent Model (GISSMO)—Damage Modeling

In order to describe the failure and damage of the insulation layer caused by the penetration of an impactor geometry, the generalized incremental stress state dependent model (GISSMO) was used. The phenomenological model was first developed by Neukamm et al. [41] and, although initially developed for metallic materials, has since also been used for the modeling of failure in thermoplastic materials [42,43]. Using the GISSMO model, it is possible to include a sophisticated description of failure with an incremental path-dependent treatment of material instability [44]. This is especially appealing for complex stress states or materials that show an unusual failure behavior. The damage variable D within the GISSMO model is defined by
D = ϵ p ϵ f ( η ) n with η = p σ v m
where ϵ p describes the accumulated plastic strain, ϵ f ( η ) the fracture strain as a function of the stress triaxiality η , and n is the damage exponent allowing nonlinear damage accumulation until failure. The incremental form of the damage accumulation can be written as
D ˙ = n ϵ f ( η ) D 1 1 / n ) ϵ p ˙
Additionally, an instability measure F, which denotes the onset of material instability when reaching unity, is defined. From this point, accelerated and localized straining behavior takes place until fracture [45].
F = ϵ p ϵ c r i t ( η ) n
The critical strain ϵ c r i t ( η ) again depends on the stress triaxiality η and defines the coupling of damage and stress through
σ = ( 1 D ^ ) σ ^ ,
where σ ^ is the undamaged stress tensor and D ^ is represented by
D ^ = 0 , if F < 1 D D c r i t 1 D c r i t m , if F = 1 .
The variable m is the fading exponent that describes the evolution of D ^ , and D c r i t is the damage value when F reaches unity.

4.4. Results

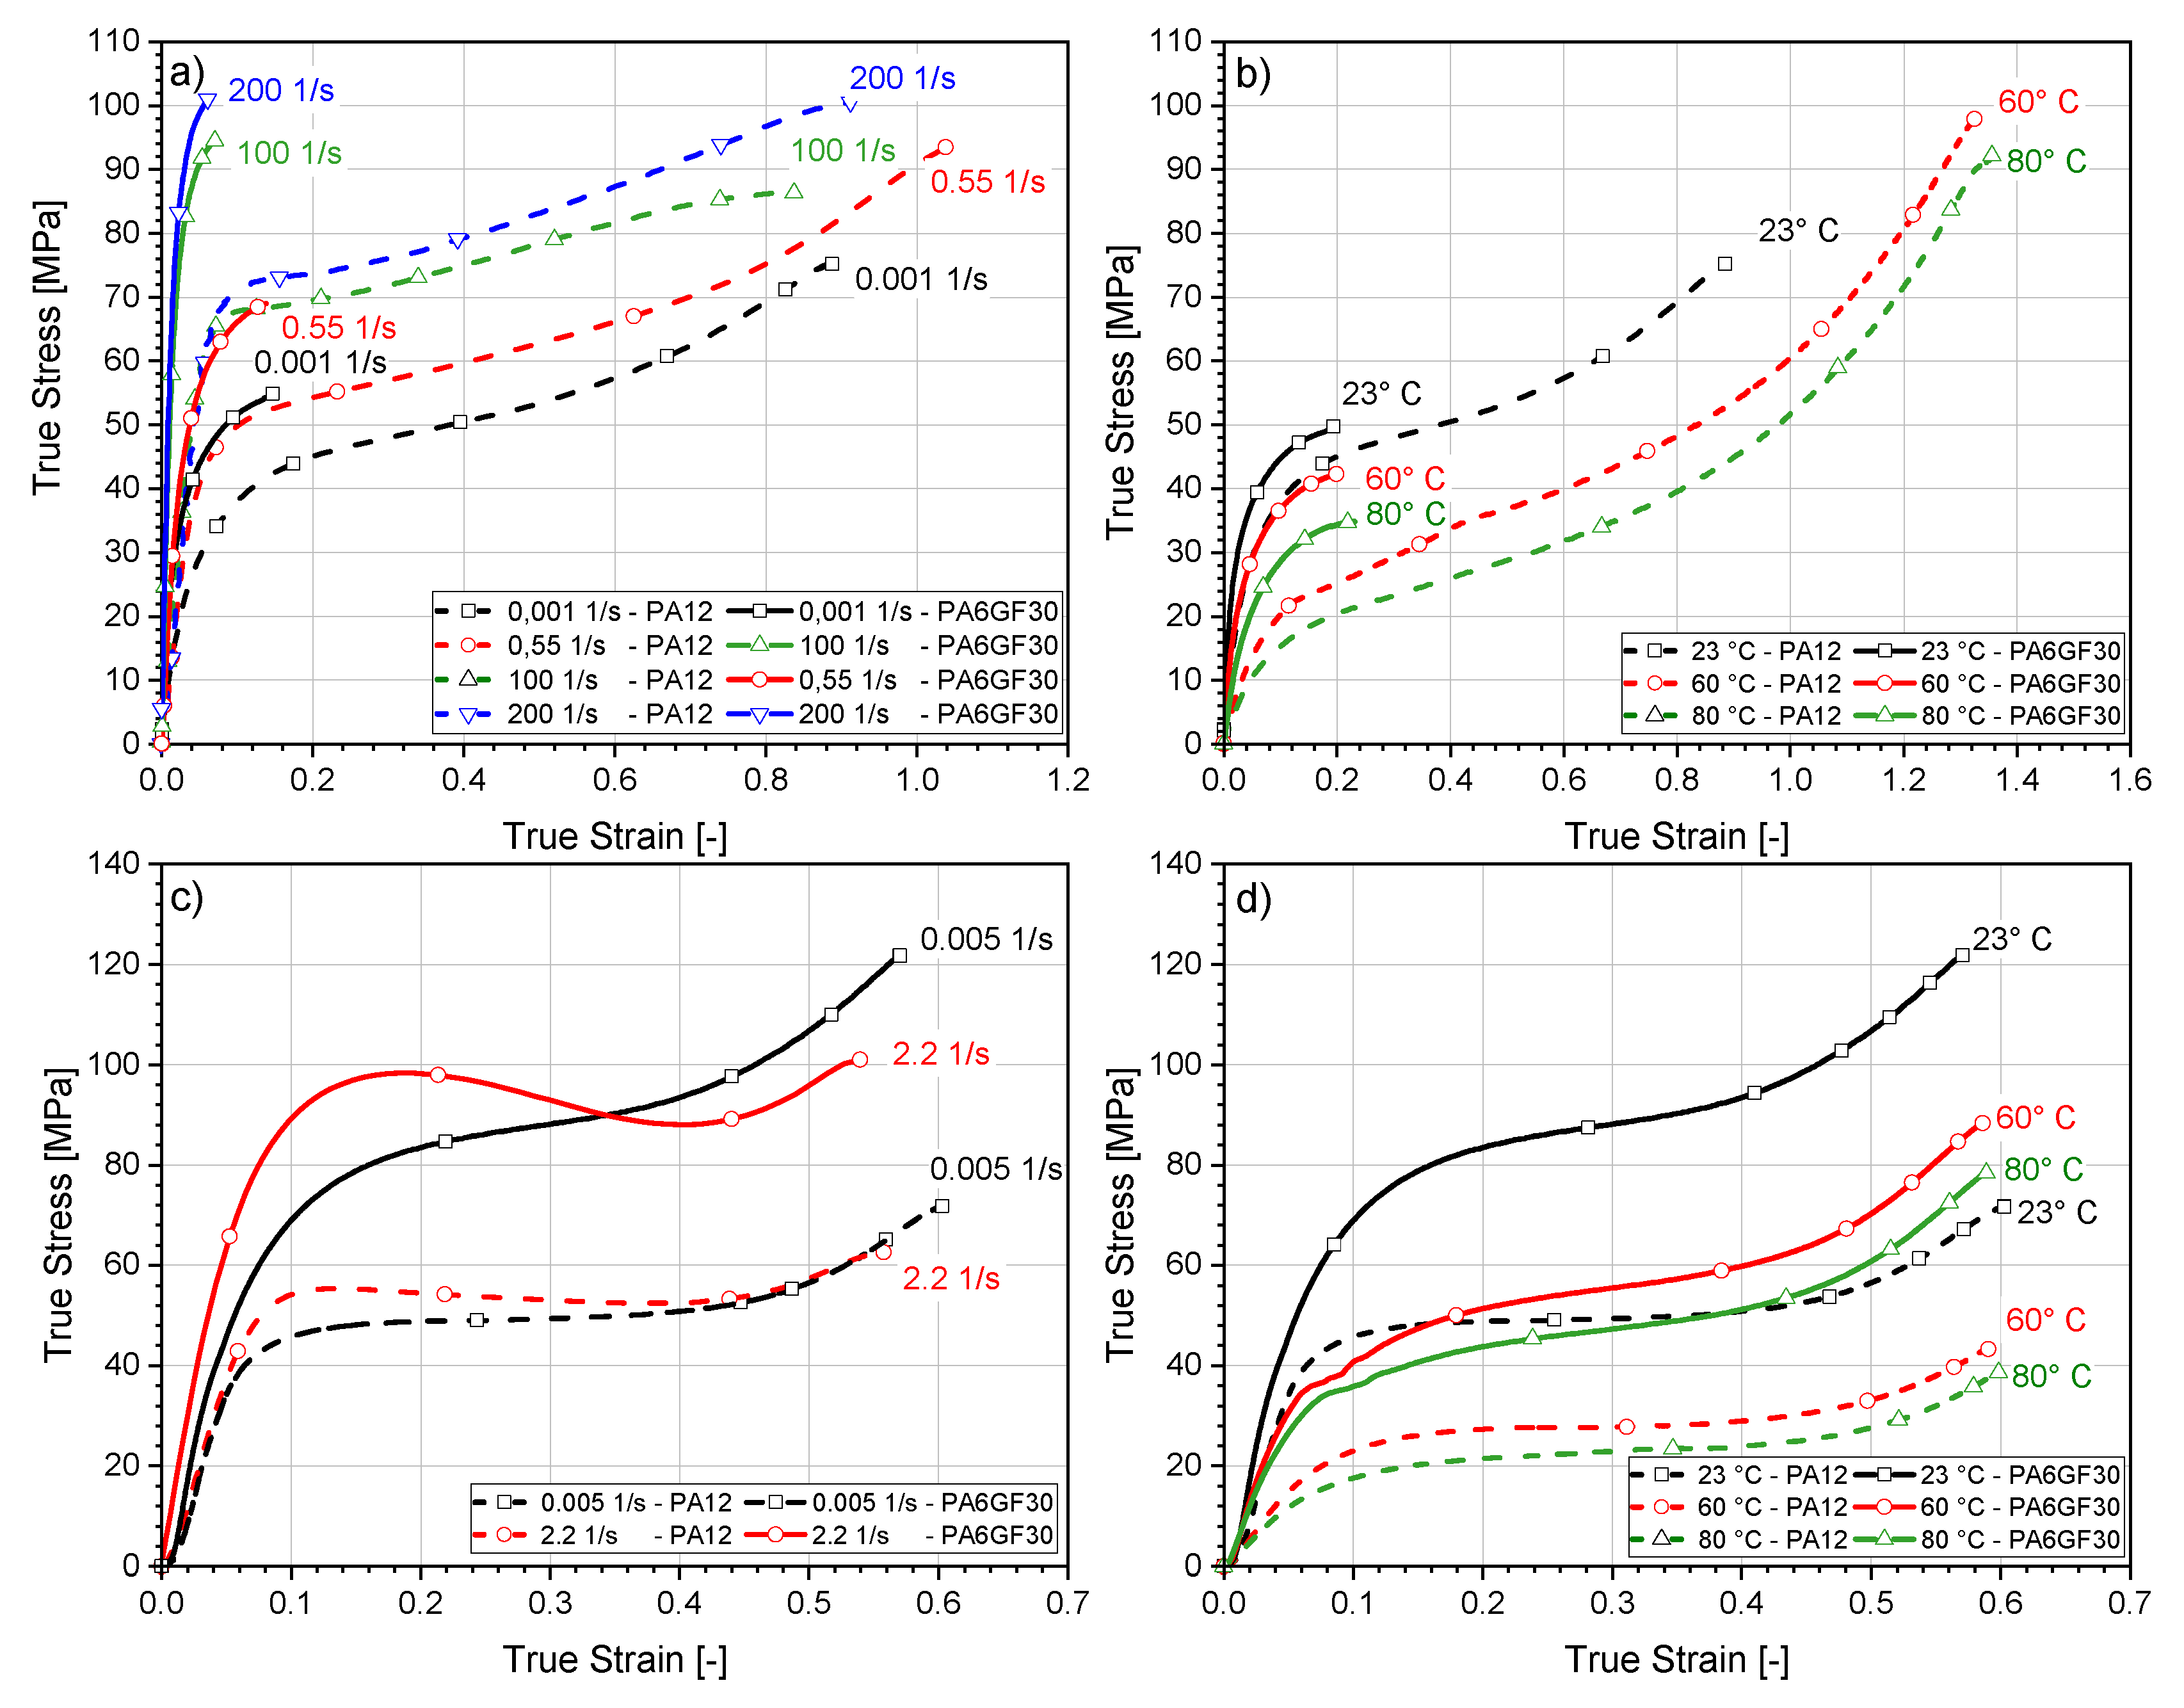
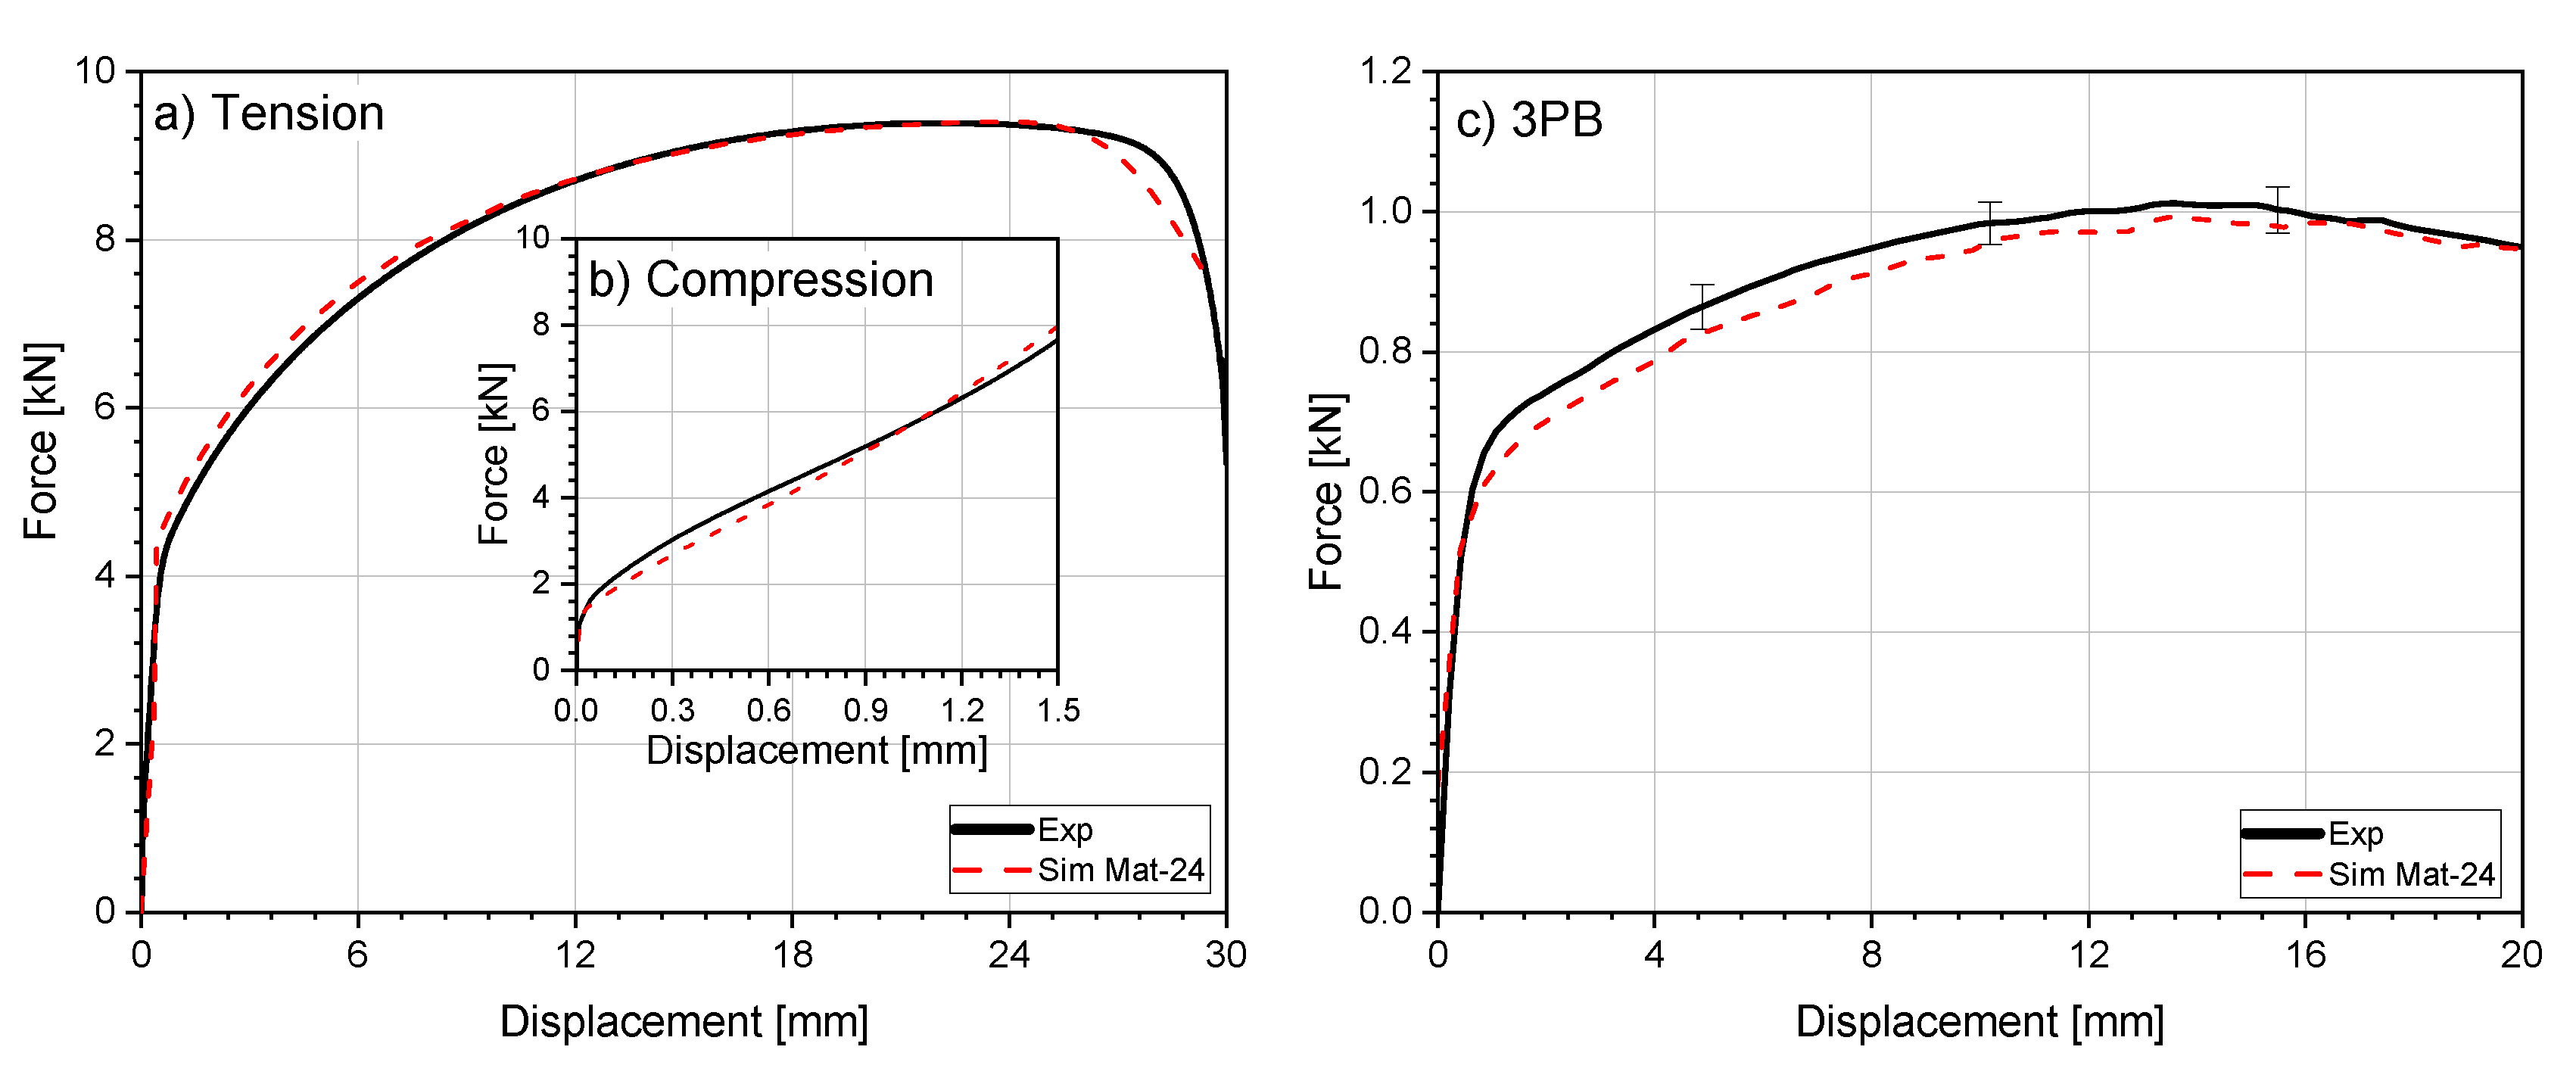
4.4.1. Tensile and Compression Test

This section presents the results of the thermoplastic material modeling. The results for the copper model are only used for the validation and therefore shown in a later section. The simulation results of the tensile test of the strain rate-dependent material models can be seen in Figure 5. To ensure a good overview of the results, the experimental scatter in this diagram is not visualized. In Figure 5a, Samp-1 shows the best agreement with the experimental results. It shows a good representation for all strain rates tested. The optimized course of the plastic Poisson’s ratio, which can be seen in Table 4, provides a high-quality description. A constant plastic Poisson’s ration of ν p l = 0.26 is used until the force maximum occurs. In the further course, the plastic Poisson’s ration is adjusted by changing the increment h ( j ) according to Equation (5) until the maximum value of ν p l = 0.5 .
Compared to Mat-24, the quasi-static softening behavior can be mapped particularly well at a strain rate of 1.0 1/s. Another advantage of the Samp-1 model is the representation of the elastic range of the curves. The Young’s modulus averaged over the applied strain rates at Mat-24 differs especially in the highly dynamic range of 200 1/s. Samp-1 provides a more precise description due to a viscoelastic description of the elasticity modulus. This can also be seen in Figure 5b for material PA6GF30. However, an optimization of the PA6GF30 material model with the help of the plastic Poisson’s ratio does not provide satisfactory results due to the low ductile behavior of the material. It is evident that the method provides good results especially with highly deformable plastics such as PA12. As a result, an adjustment of the flow curve by means of Equation (4) for the glass fiber-reinforced material is more efficient. In the model, a constant plastic Poisson’s ratio of ν p l = 0.44 is used. In the plastic range, Samp-1 can satisfactorily map any strain rate through the flow curve adaptation with errors only occurring at higher strain rates where the force drops due to damage to the material. This can be explained by the lack of damage modeling in the simulation. Mat-24 also results in a good agreement with the test except for a strain rate of 200 1/s.
The simulation of the compression tests in Figure 6 shows the existing tension–compression anisotropy of the plastics. Mat-24, which only considers tensile properties, does not deliver satisfactory results for either PA12 or PA6GF30. Deviations of Young’s modulus and yield strength result in differences in the transition to the plastic area of the material. The optimization of compressive hardening curves at Mat-124 and Samp-1 enables satisfactory results compared to Mat-24. Both material models can deliver a good approximation up to a total strain of about 33% (equivalent to a displacement of 1 mm) for PA12 and PA6GF30. Both models also show a good representation of the elastic regime governed by Young’s modulus and yield point. The tension–compression anisotropy of the materials can therefore be considered to be well represented in both models.

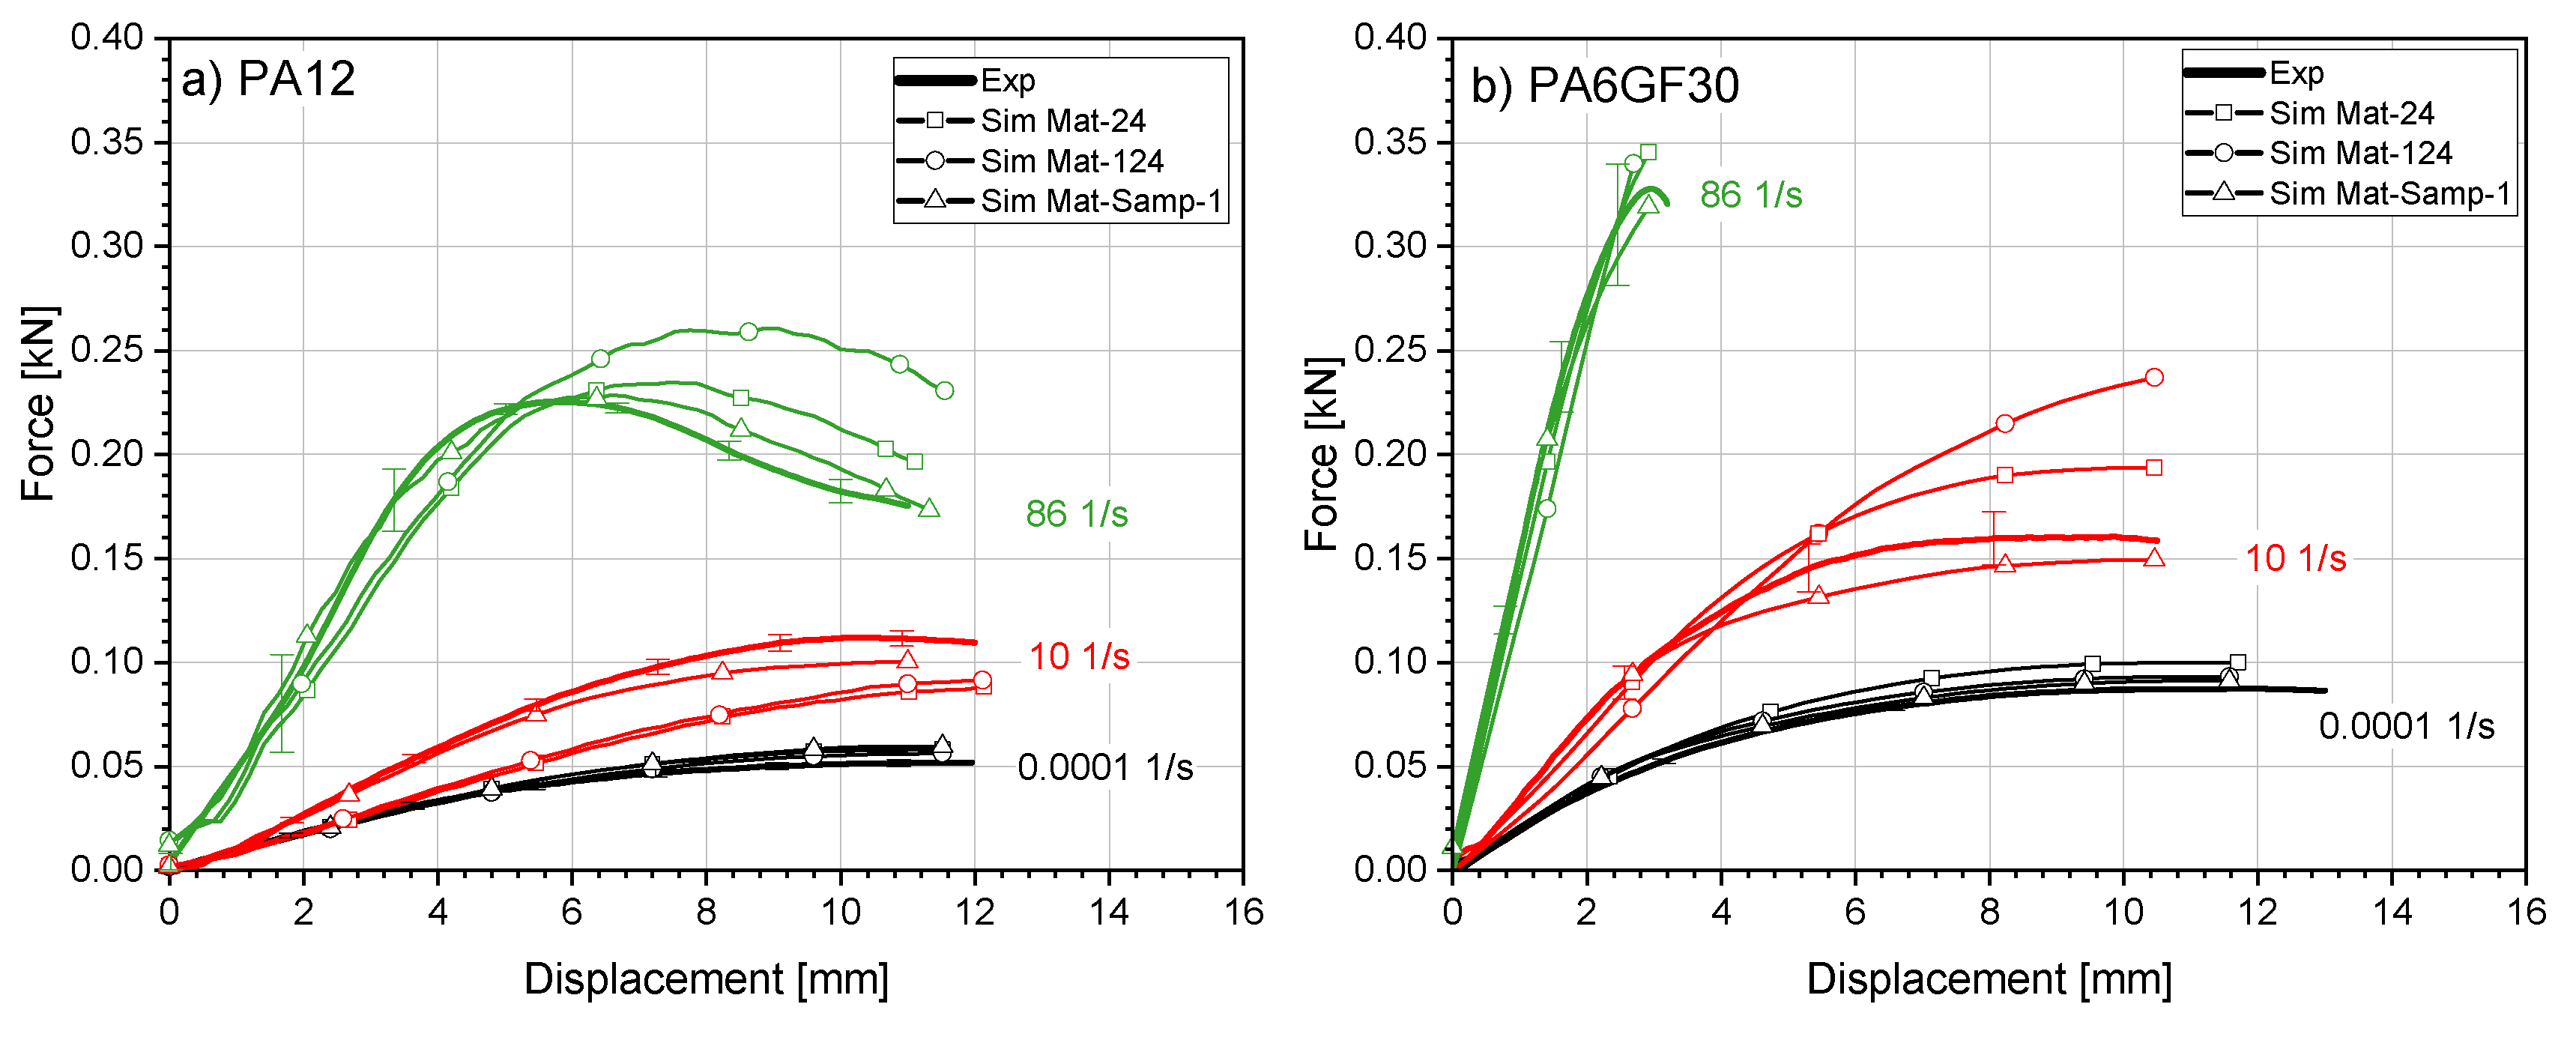
4.4.2. Prevalidation—Three-Point-Bending of Polyamides and Copper

After the material models were calibrated by the simulation of tensile and compression tests, the models were subjected to the first validation using 3PB tests. The results of the insulation materials PA12 and PA6GF30 are shown in Figure 7. Similar to the results for tension and compression, a strong correlation of the stress on the strain rate can be found. In the case of PA6GF30, a failure of the material occurs due to the brittle behavior of the material under higher strain rates of 10 1/s or 86 1/s.
In the simulation, the quasi-static material behavior of all materials can be reproduced satisfactorily. Only Mat-24 at PA6GF30 has more than a 10% force deviation. The simulation of the highly dynamic tests provides the best results using Samp-1, which can be justified by the rate-dependent formulation of the Young’s modulus. Mat-24 and Mat-124, on the other hand, exhibit larger deviations, which are particularly dominant at the strain rate of 10 1/s. In this case, the force values show a 34% deviation for PA12 and 18% (Mat-24) and 38% (Mat-124) for PA6GF30, which are larger than the test deviations displayed in Figure 7.
Figure 8a,b illustrate the results of the optimized material model of the copper material Cu-OFE R200 under quasi-static uniaxial tensile and compressive loads. As the experimental scatter in tension and compression was small, it is not visualized in this diagram. The simulation of the tensile test shows a good representation using Mat-24. In the uniaxial compression test, a deviation of the force values is particularly evident in the initial area which points towards a slight tension–compression anisotropy as well. This is confirmed in the results of the three-point-bending simulation shown in Figure 8c. Mat-24 can accurately map the characteristic forces from the experiment. However, deviations in the level of force are the result of the lack of calibration of the compression range. In spite of the standard deviation of the test results, there is nevertheless a satisfactory description quality in terms of the material behavior. Only the transition from the elastic to the plastic regime of deformation is inaccurate. The deviation of the yield point is approximately 7%.

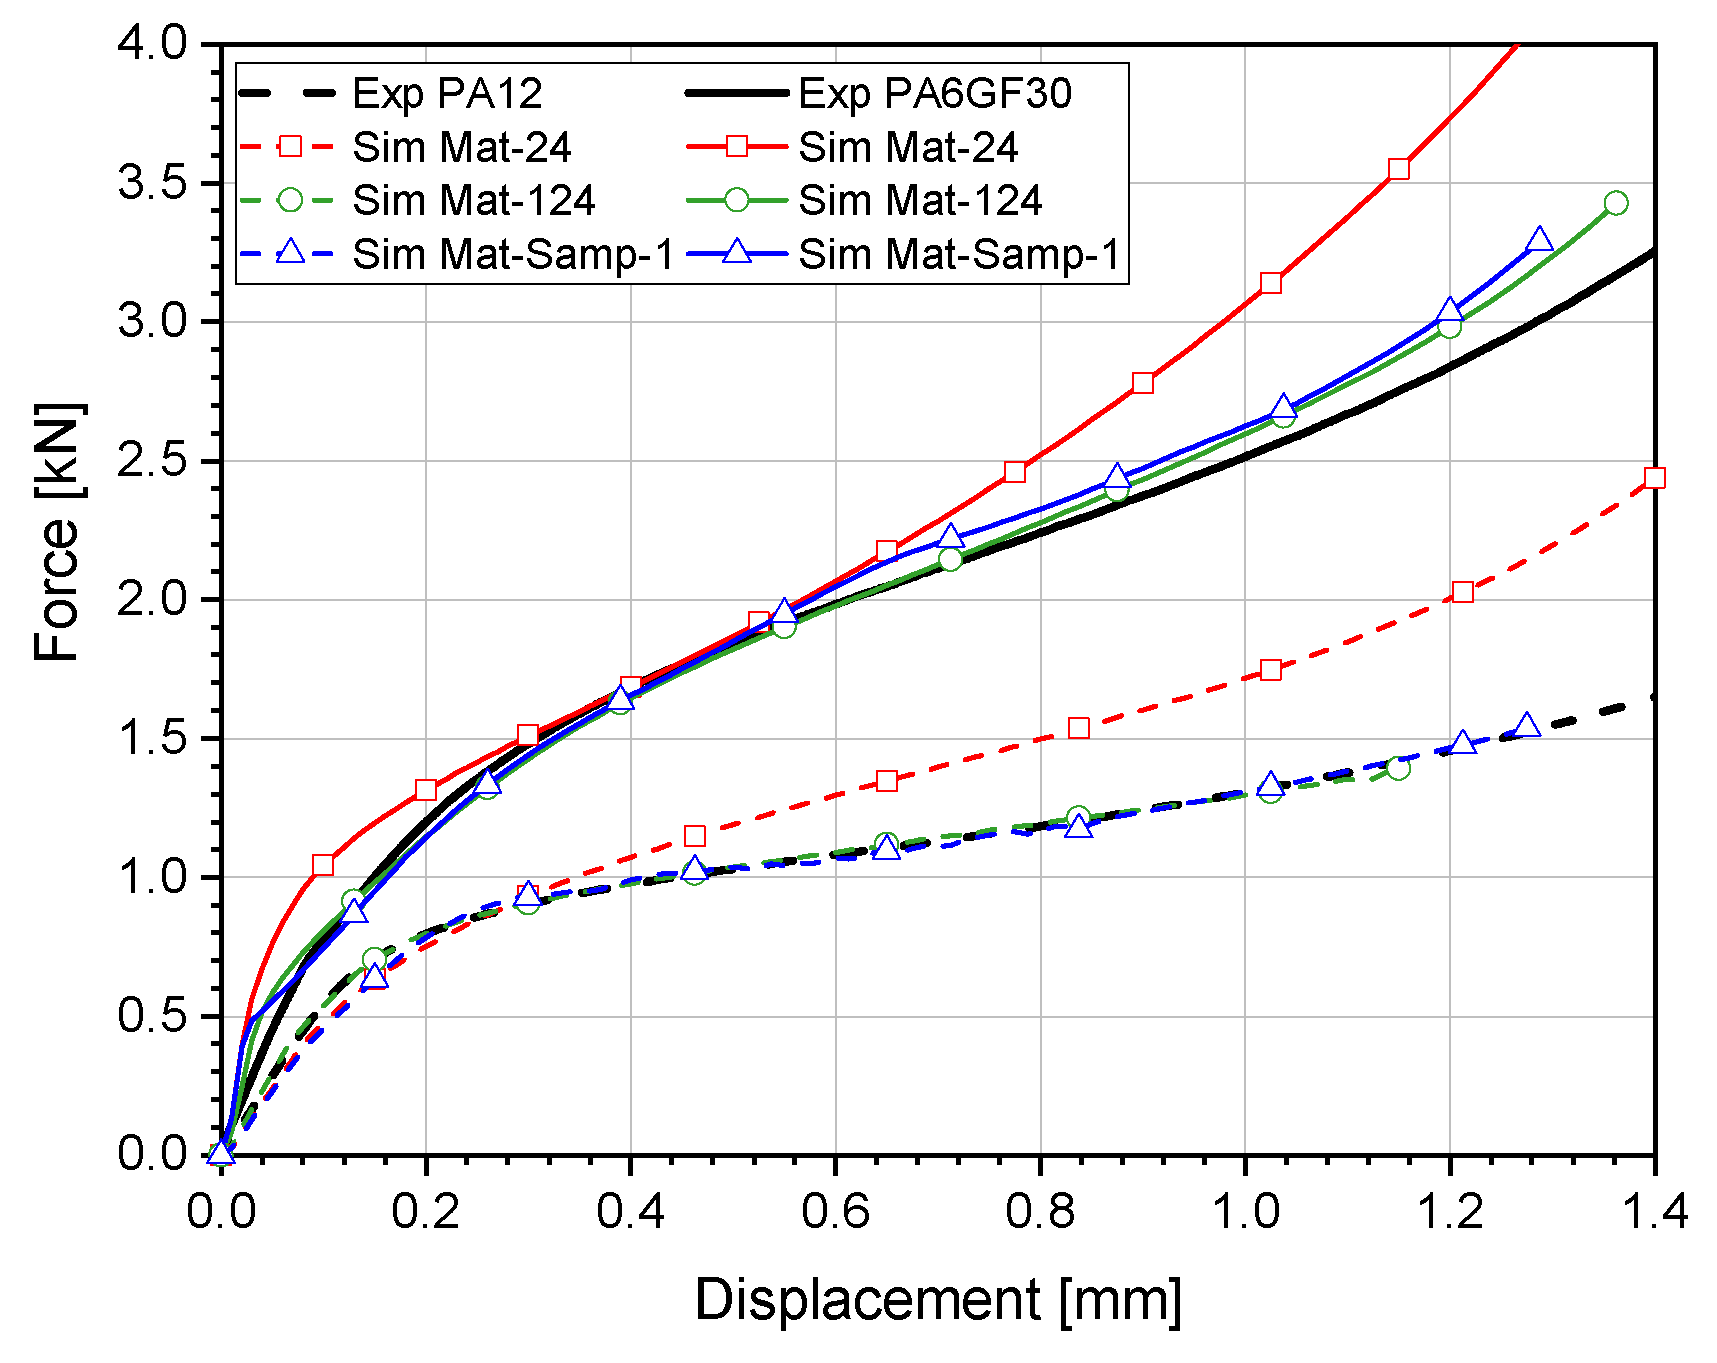
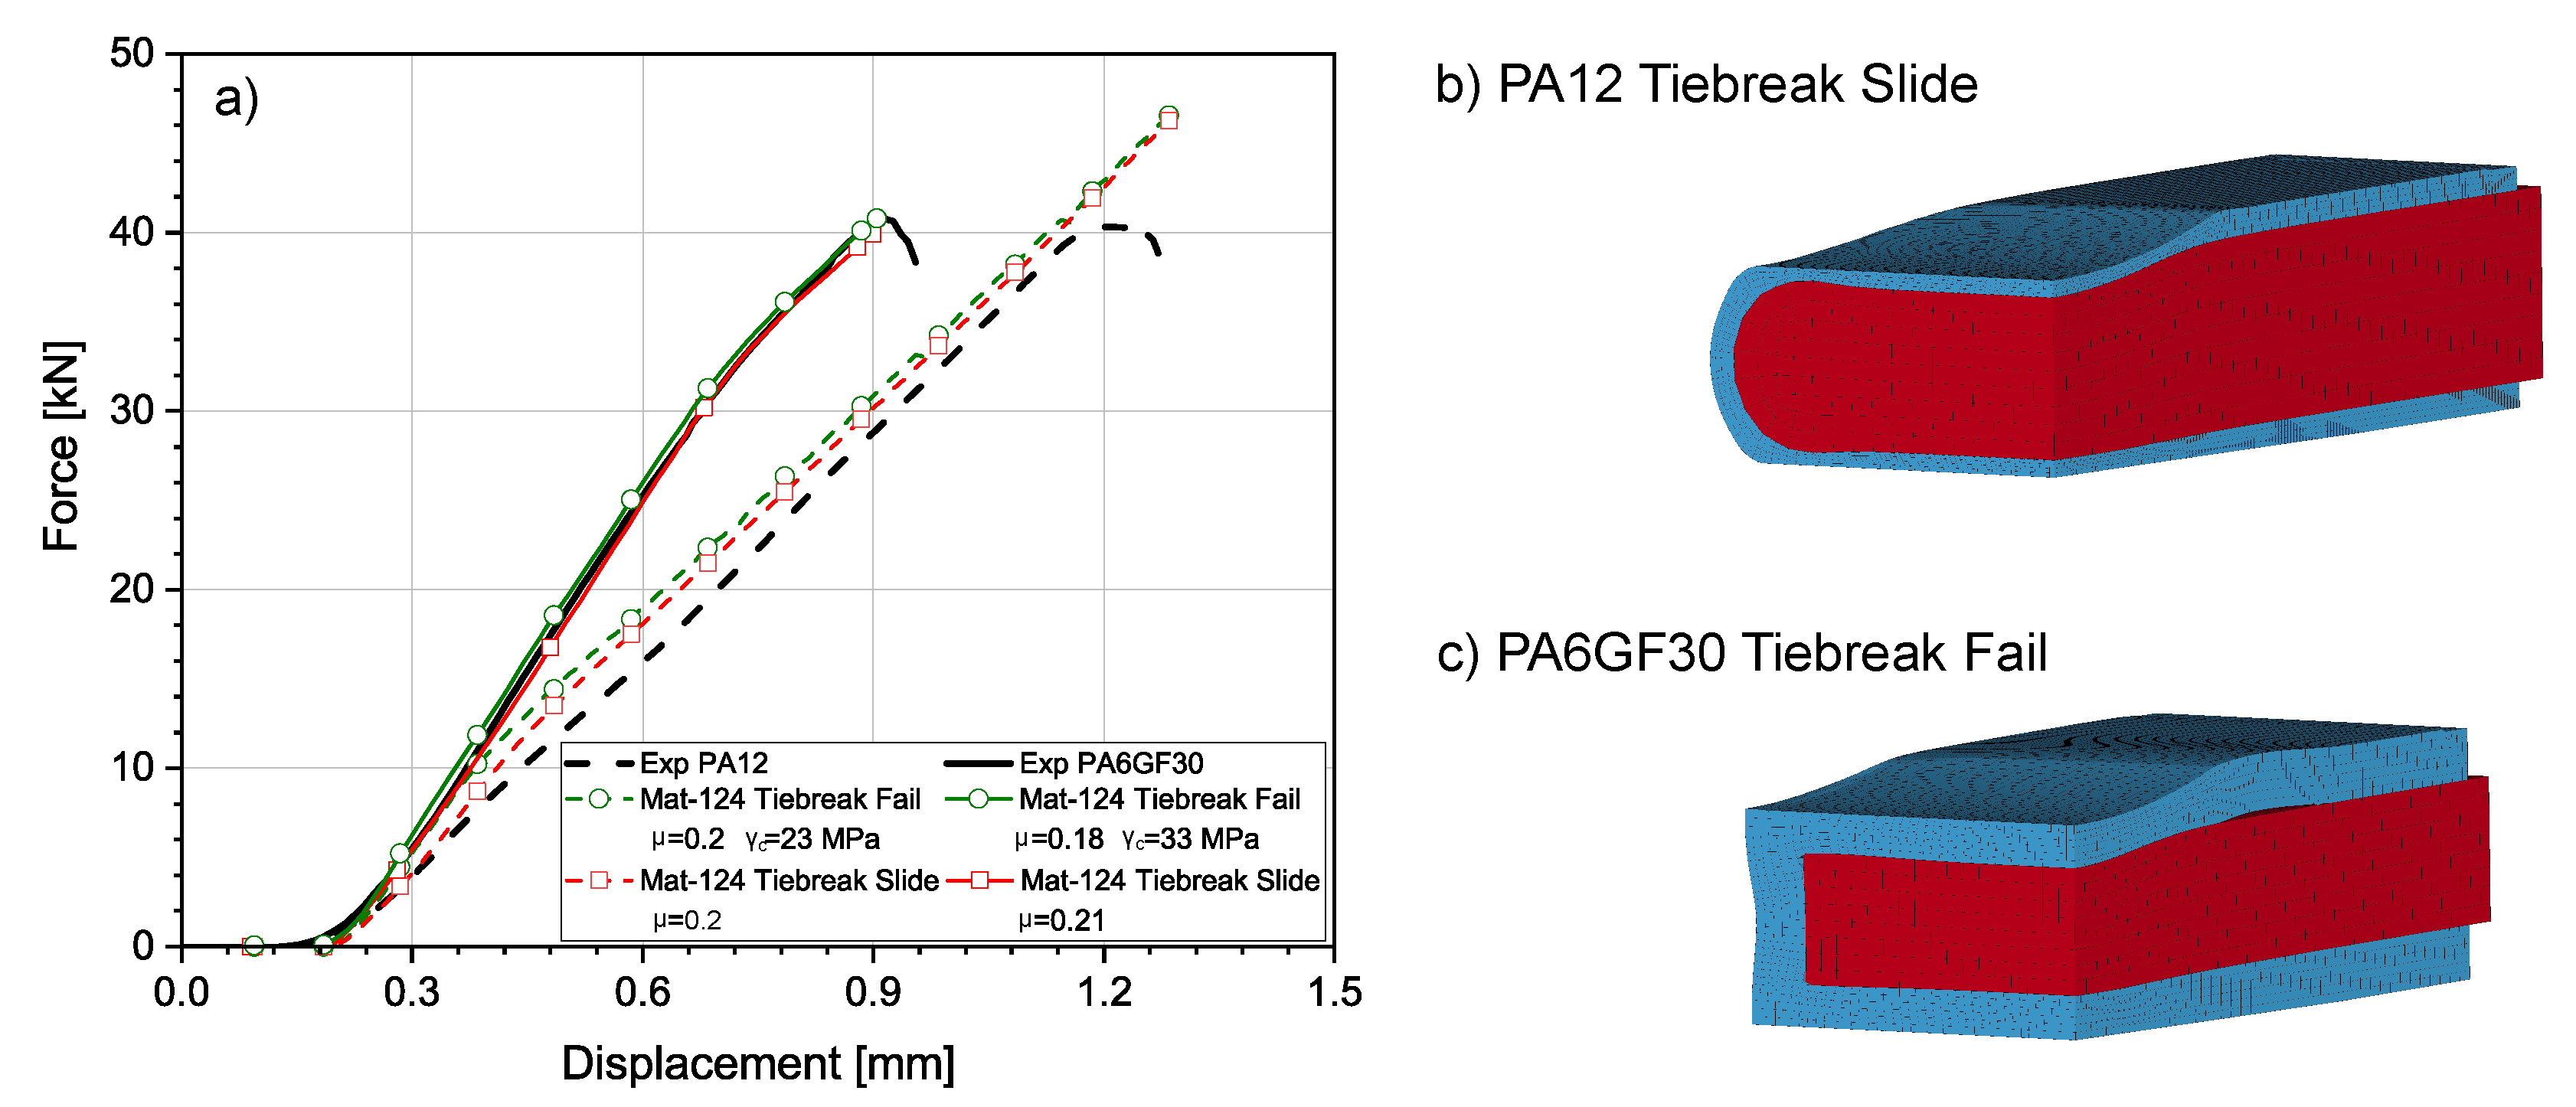
4.4.3. Component Validation

The final validation of the material models was carried out by simulating a three-point-bending test of the HV busbars and a compression test of the busbars for determining possible insulation faults (see [12]). The modeled test setups are shown in Figure 9a,b and the sections of the busbars and their mesh are shown in Figure 9c,d. Here, 8-node hexahedral elements with a minimum element size of 0.5 mm were used. In the initial simulation, the interface between copper and insulating material was modeled using a tied connection between the nodes of the different materials.
The results of the 3PB validation tests can be seen in Figure 10a. During the experimental three-point-bending test, no failure of the PA12 insulation occurred until a total displacement of 28 mm. In addition, a complete adhesion of the extruded PA12 on the copper busbar could be observed in a way that no separation of the multimaterial interface could be found. The encapsulated PA6GF30 busbar showed different behavior. The brittle behavior of the insulation, which was already determined under tensile and three-point-bending load, triggered a failure of the insulation in the experimental test. This is characterized by the significant drop in force shown in Figure 10a. It is worth noting the straight-line crack in the direction of the load which arises at the seam of the injection mold. Furthermore, a lower adhesion of the insulation on the copper material could be observed compared to the PA12 busbar.
The results of the bending simulation show that the copper material has a significant influence on the mechanical behavior of the busbars. As a result of the thin insulation layer and the resulting small influence of the insulation on the overall component’s behavior, all PA12 material models (Mat-24, Mat-124, and Samp-1) show a good representation of the characteristic force curve. However, as already noted in the prevalidation, deviations in the area close to the yield point come from the material model used for the copper. The simulation of the PA6GF30 busbar reveals more significant differences between the plastic material models. This could be the result of the thicker insulation of PA6GF30 compared to PA12. However, a satisfactory description of the component behavior results up to the maximum force. At larger displacements and with the onset of material damage, the force values decrease. Here, an implementation of material degradation would be needed to model the material behavior at displacements that are larger than 12 mm more accurately.
The results of the cylindrical compression test are displayed in Figure 10b. For both material combinations, the force-displacement curves show almost linear behavior until forces of 40 kN. It can be seen that the overall stiffness between the two busbar types varies. All material models except Samp-1 for PA12 capture the overall mechanical behavior with only small deviations. The largest error compared to the experimental results occurs in the displacement range of 0.3 mm to 0.6 mm. Here, all material models overestimate the materials strength and stiffness. With ongoing plastic deformation of the copper core, the simulation results converge to the test results. The insufficient quality of Samp-1 for PA12 may be the result of the model’s compressibility combined with large plastic deformations leading to numerical instabilities.
In addition to the quality of the material models, the computational time also plays an important role for use in crash simulations. A trade-off between accurate material modeling and necessary CPU time needs to be made. In order to illustrate the effects of the model choice on the calculation times, Table 5 shows the CPU time of each material model related to the benchmark using Mat-24. The simulations were carried out on a high performance computing cluster with 96 CPUs. In the 3PB test with PA12, an increase in computing time of 5% is shown for Mat-124. The significantly more complex Samp-1 model causes an increase of 45% for 3PB and 101% for the compression test of PA12. The insulation thickness of the polyamides is a very important factor. This results in increases in the calculation times of the PA6GF30 insulated busbar. The material model Mat-124 shows justifiable increases of 8% in the 3PB and 15% in the compression test, whereas Samp-1 is economically less favorable by up to 151%. In addition, numerical instabilities can be observed in both Samp-1 models which must be taken into account for model selection.

4.4.4. Interface Optimization

Besides the material modeling, the representation of the interface behavior between the insulation and copper core shows significant impact on the simulation results. In the previously discussed results, where the focus was on material modeling, a fixed interfacial behavior was assumed where no relative displacement between insulation and copper is allowed. However, this does not give an ideal representation of the experimentally observed behavior during the compression test. Figure 11 shows the cross section of the two different busbars after the compression test with the cylindrical impactor.
It can be seen that the PA6GF30 insulation separated from the copper after large deformations, whereas PA12 did not separate itself from the copper but showed plastic flow below the impactor. In order to model the interface more accurately, two different interface behaviors were analyzed. For each busbar, simulations with an interfacial sliding contact (tiebreak slide) and a contact that is fixed initially and fails at a defined critical interface shear stress (tiebreak fail) were performed. Figure 12a shows the simulation results with optimized parameter settings using Mat-124. The material models were not changed. The optimized contact parameters are displayed in the caption. It can be seen that the simulation results compared to Figure 10 could be improved for both materials.
For PA12, the phenomenologically accurate representation of a sliding contact improves the initial approximation of the busbar stiffness. Both contacts improve the PA6GF30 model significantly. The failing contact displays more realistic deformation behavior according to Figure 11 as seen in Figure 12b,c.

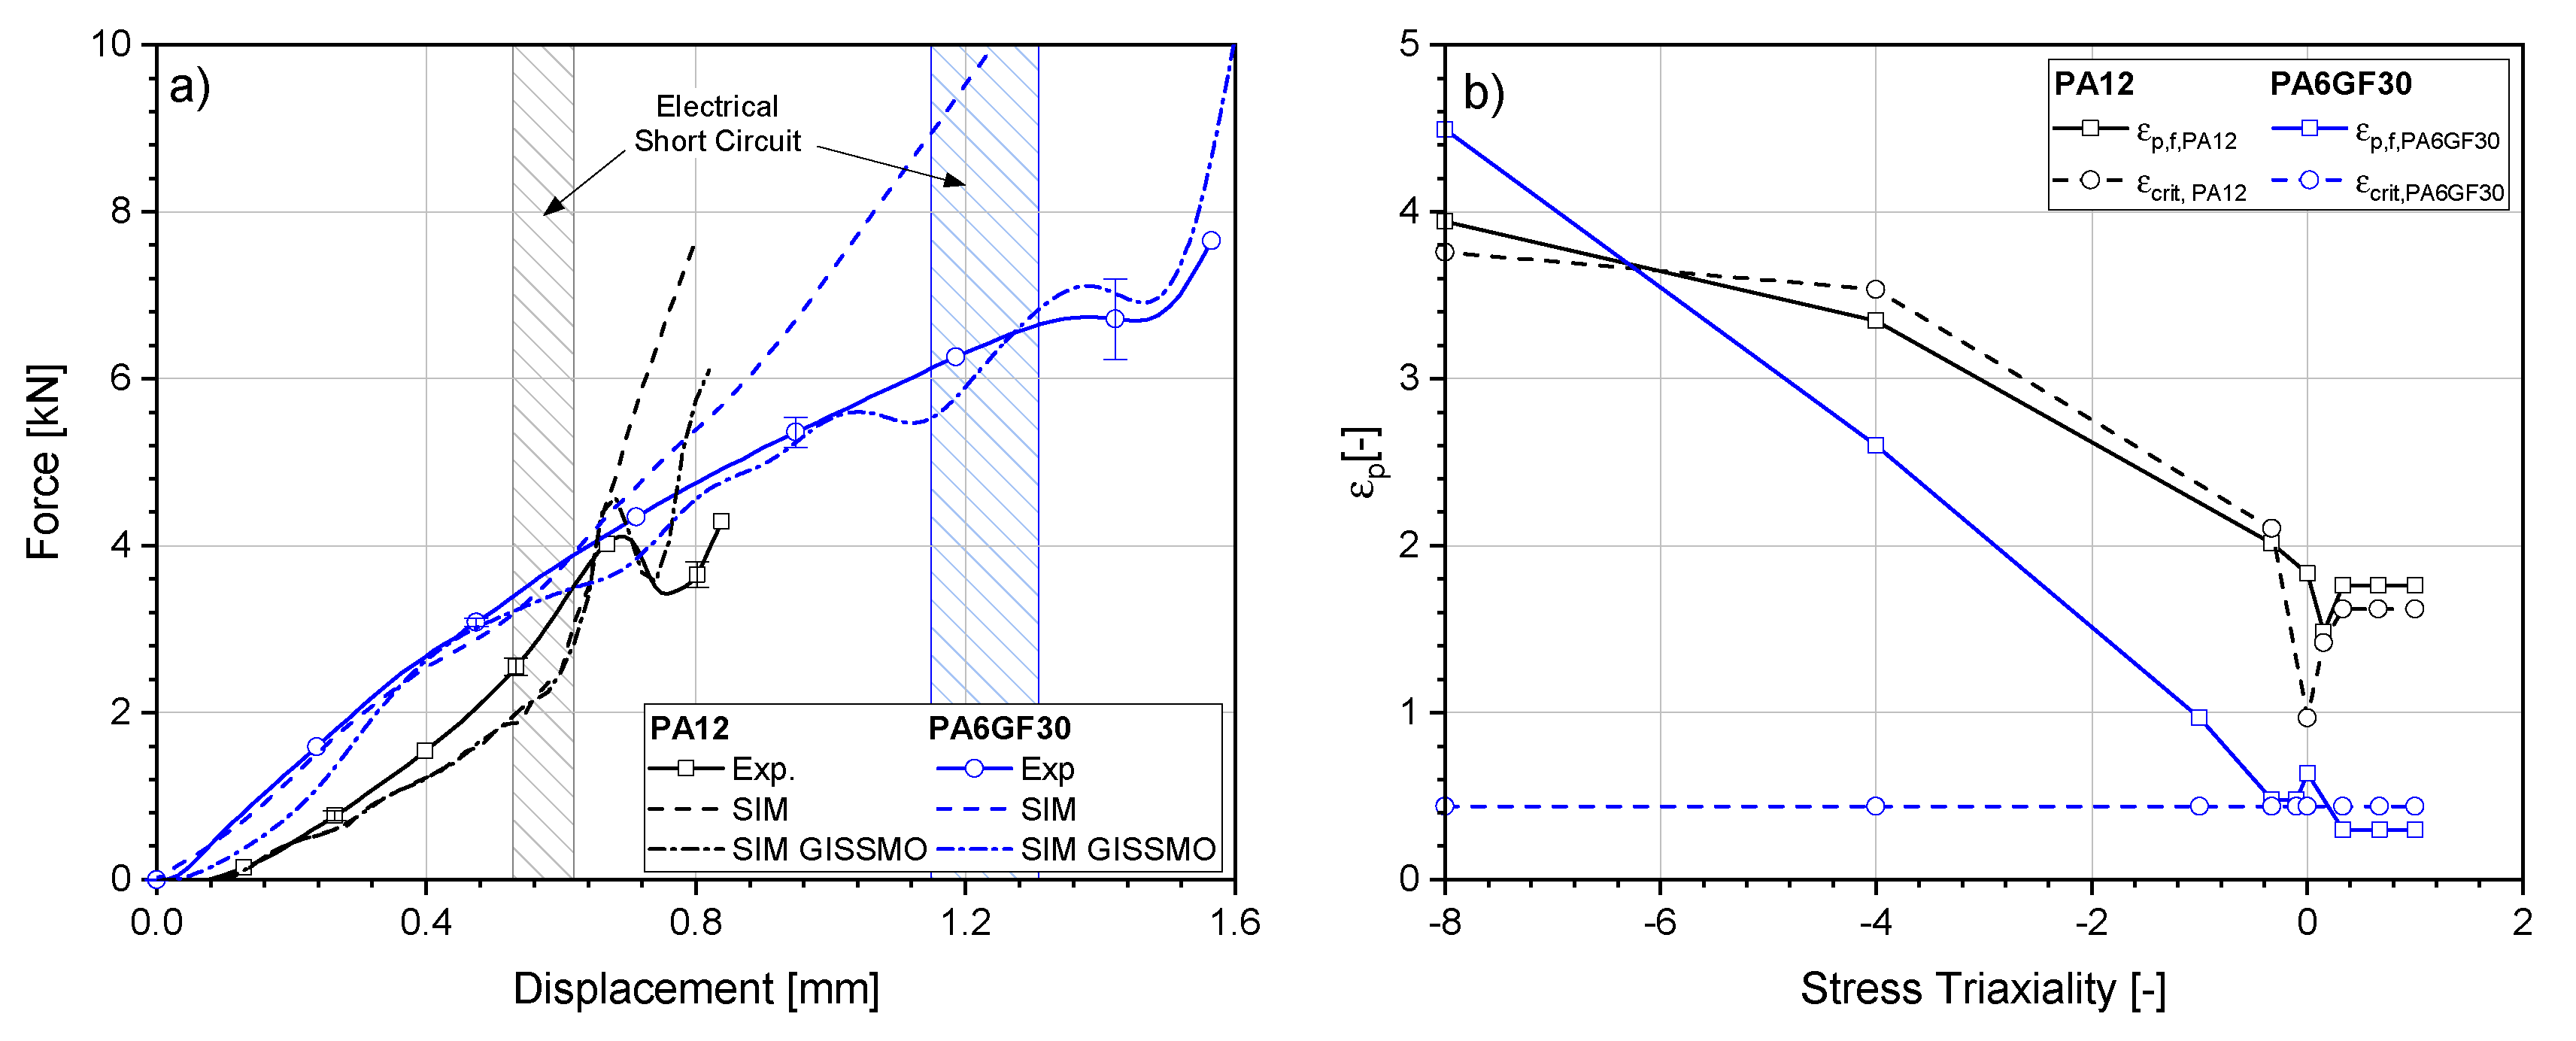
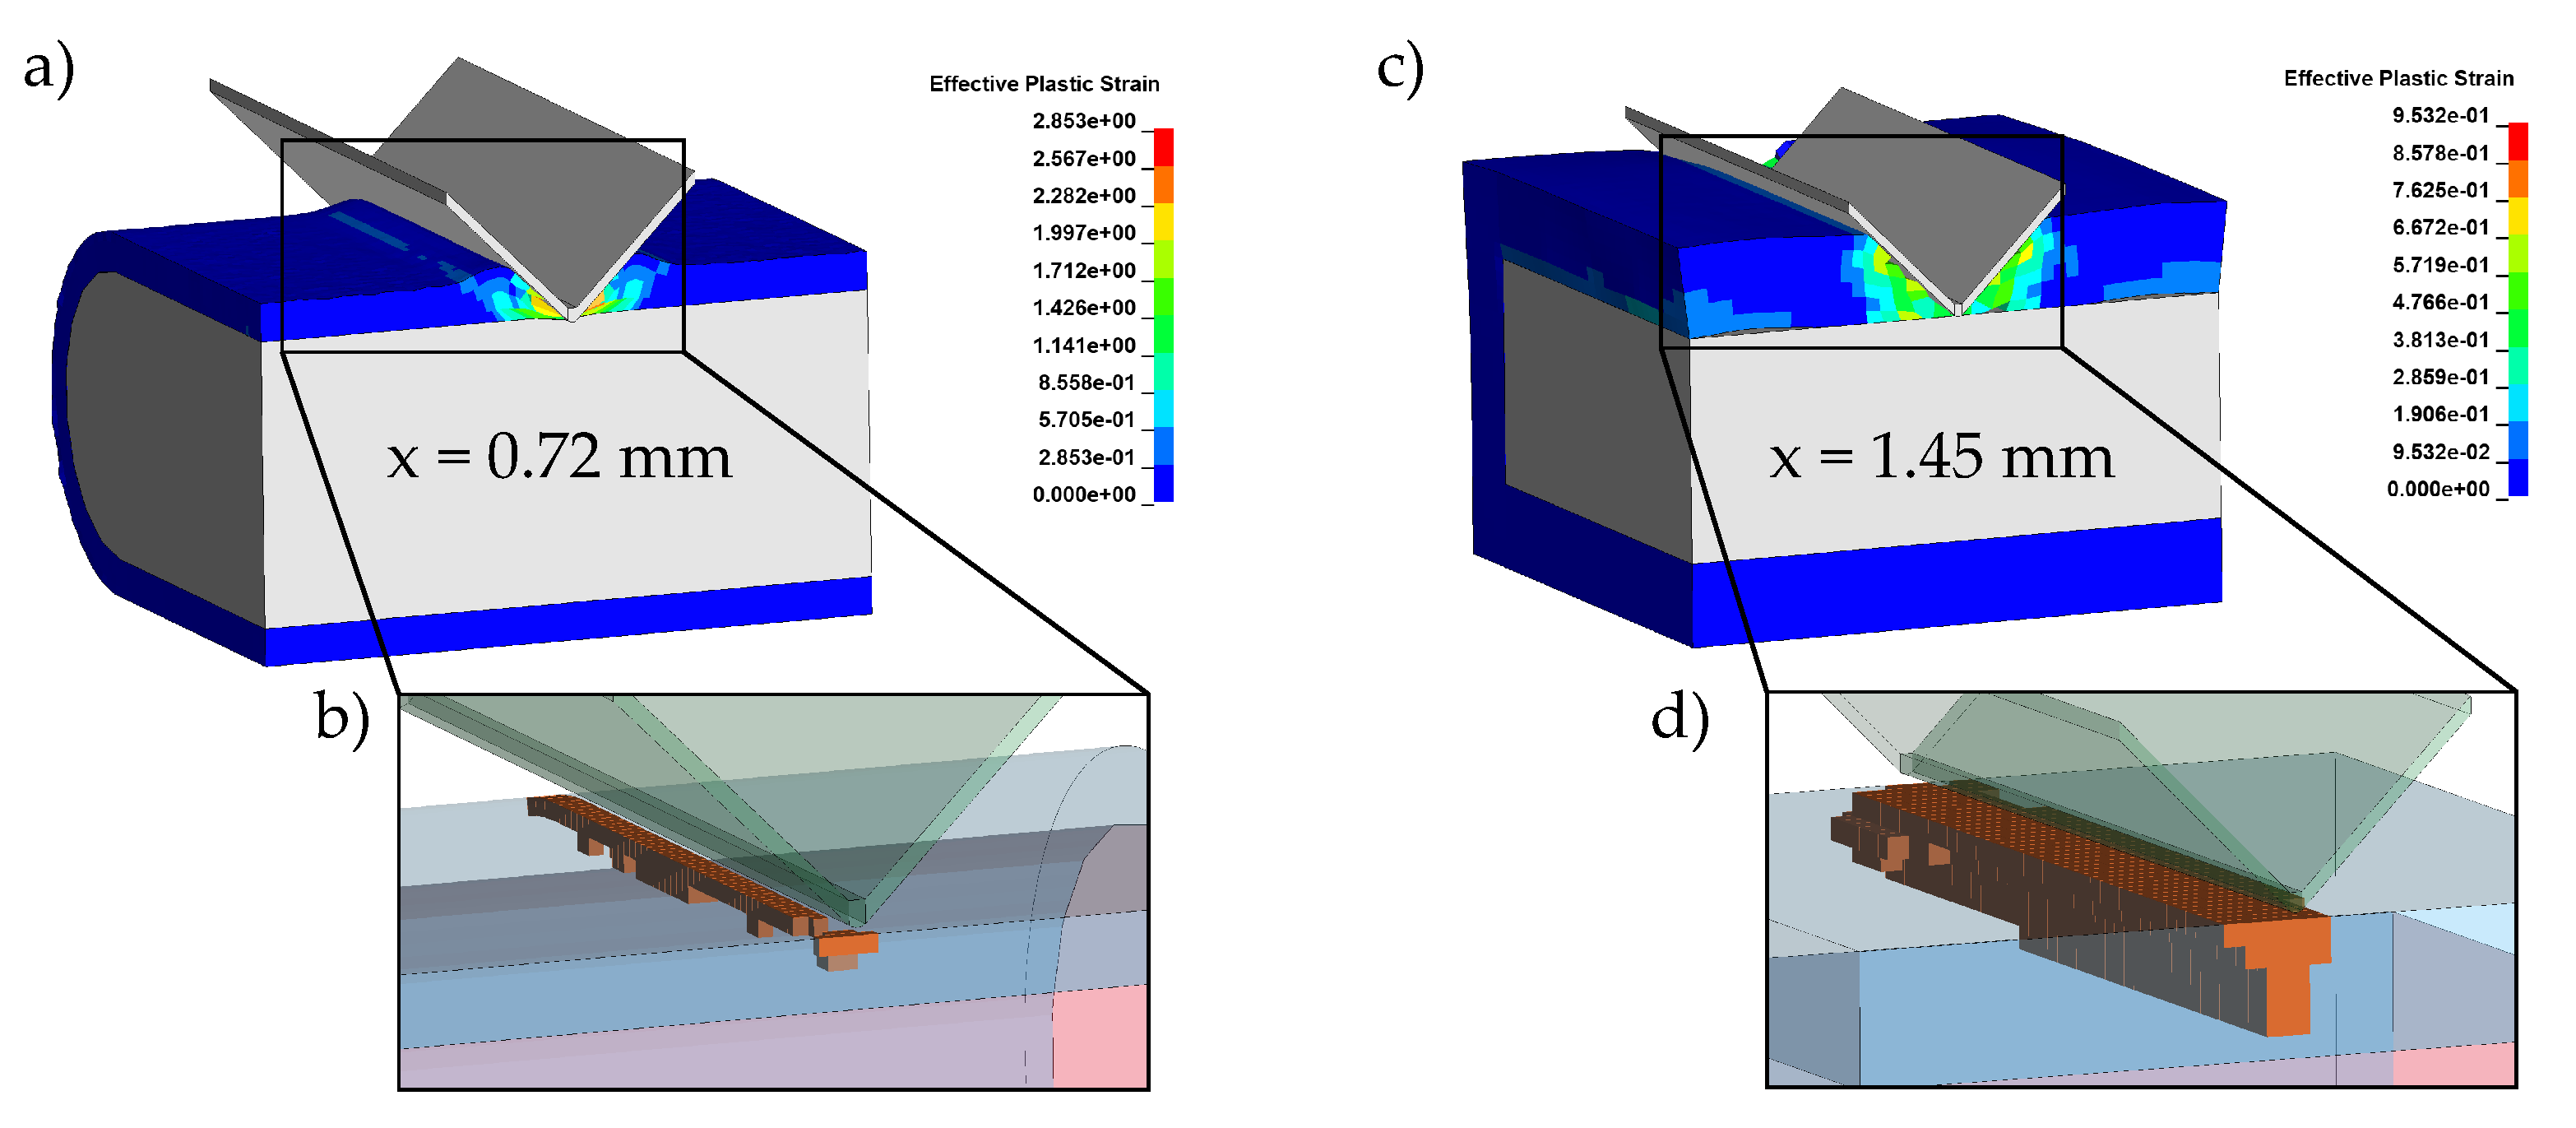
4.4.5. GISSMO—Parameter Identification

In order to describe the insulation behavior regarding material failure for the compression tests using a sharp triangle shaped impactor, damage and failure have to be included in the derived material model Mat-124 for PA12 and PA6GF30. The FE-models’ mesh size from the previous section was changed in order to allow more elements through the insulation thickness. Mesh sizes of 0.15 mm (PA12) and 0.25 mm (PA6GF30) were used to have four and six elements through the insulation thickness, respectively. This was necessary to enable a good representation of the insulation failure. The element form, contact parameters, and boundaries were not changed.
The main input parameters for the GISSMO damage model are represented by the path-dependent failure and instability curves. These determine the plastic strain at failure as well as the onset of material instability and degradation. Both can be implemented as a function of stress triaxiality in order to take the strain evolution into account. Figure 13 shows the plastic strain evolution versus the stress triaxiality during the impactor test for the elements below the impactor. In this comparison, no failure has been integrated in the material models. Therefore, the obtained values have to be treated with caution as high plastic deformations occur. However, it can be seen that the elements are subjected to a multiaxial compressive stress state. The soft and more ductile material PA12 demonstrates plastic strains up to ϵ p = 3.1 and triaxialities up to η = −7, whereas PA6GF30 is limited to plastic strains of 200% and η = 1.9 . In both cases, the elements on the bottom of the insulation undergo the most compressive stress states.
As the elements considered as potential candidates for failure show plastic deformation exclusively under negative stress triaxialities, the parameters of the GISSMO model were calibrated separately for positive and negative stress triaxialities. Therefore, the parameters were initially optimized using the uniaxial tensile and shear tests for triaxialities between 0.0 and 0.67. Then, a second optimization was performed determining the parameters for negative triaxialities using the sharp impactor test. The optimization was performed using LS-OPT. The results of the GISSMO model using an optimized parameter setting are shown in Figure 14a,b. The simulation results including failure were smoothed using a five point average to allow for a curve comparison and reduce the noise generated by the element deletion. Additionally, the critical penetration ranges for electrical short circuits during the experiments are displayed. These were determined by measuring the insulation resistance during the penetration [12]. It can be seen in Figure 14a that, for both materials, the implementation of the damage model leads to a significant improvement in the results. The force drop, which indicates the mechanical failure of the insulation and the contact between impactor and copper, is well represented in both models. The PA6GF30 model predicts the critical forces at the electrical short circuit range with a maximum deviation of 10%. The PA12 model shows a slightly higher deviation of up to 30%. Regardless of the damage model, the simulation results for PA12 show a lower stiffness compared to the experiment until a displacement of 0.72 mm.
In Figure 15, the deformed busbar is displayed when the impactor contacts the copper. At this time during deformation, the insulation has been thinned out or the elements between impactor and copper have failed. It can be seen that the elements remaining still show large effective plastic strains up to ϵ p = 2.85 for PA12 and ϵ p = 0.95 for PA6GF30. The deformed geometry matches with the observed phenomenological behavior as the insulation pile-up at the impactor edges is visible for PA12 and a crack evolution starting from the impactor tip is visible for PA6GF30. Most of the PA12 elements underneath the impactor are displaced and only the two upper layers of insulation elements fail at the shown displacement leading to a relative large force drop. In contrast, cracklike element failure observed for PA6GF30 leads to a continuous reduction in the impactor force.

5. Discussion and Conclusions

The objectives of this present study were the development of an efficient method to predict the safety risk of high-voltage busbars under mechanical loads as well as the proposal of busbar design and modeling guidelines in order to contribute to the crash safety of electric vehicles. For this purpose, the mechanical behavior of the busbars and their base materials subjected to tension, compression, and bending loads were investigated experimentally to calibrate commercially available material models and allow accurate numerical predictions. The mechanical load cases were derived from the common placement of busbars within the battery pack of an electric vehicle.
In our investigations, we showed that the component behavior under compression and bending is strongly dominated by the copper material until failure of the insulation occurs. The mechanical failure of the busbars’ insulation depends on the load case, the material used as insulation, and the impactor geometry. During three-point-bending tests using the PA12 busbar, large deformations could be achieved with no sign of material failure. The PA6GF30 busbar showed higher mechanical strength but also brittle behavior leading to material failure. This could result in electrical short circuits when placed inside a battery and hence a safety risk during a vehicle crash. Under compression load using a sharp impactor geometry, both insulation materials failed, although the PA6GF30 insulated busbar achieved higher critical forces and an electrical short circuit at larger displacements compared to PA12.
For use in crash simulations, it is important to assess the quality of the defined material models whilst taking the computation time into account. The simpler models Mat-24 and Mat-124 showed an equal or even better representation of the busbar on a component level, while being more computationally efficient than the more sophisticated model Samp-1. This is particularly important as the full utilization of the material model Samp-1’s potential required higher experimental effort. It was also shown that the mechanical failure of the insulation, which can lead to an electrical short circuit can be described using the GISSMO damage model. The optimization of the failure strains for large negative stress triaxialities was necessary to model the insulation’s failure behavior under complex compressive loads. The knowledge generated in this study led to the following recommendations concerning practical design applications and the modeling of high-voltage busbars:
  • Busbars should be designed with vehicle safety and possible deformations of the battery pack in mind;
  • Possible mechanical loads should be analyzed in the early development, using a material model that allows for tension–compression anisotropy;
  • The contact modeling of the busbar has a great influence on the simulation results;
  • The insulation material and its thickness should be chosen in accordance with possible mechanical loads and electrical properties;
  • A ductile unreinforced insulation material is recommended for possible bending loads;
  • A fiber reinforced insulation material should be used if compressive loads or penetrating objects can occur.

Author Contributions

Conceptualization, Methodology, Validation, Formal Analysis, Investigation, Writing—Original Draft Preparation, Visualization: T.W. and M.S.; Writing—Review and Editing, Supervision: C.E. and W.S.; Project Administration: T.W. All authors have read and agreed to the published version of the manuscript.

Funding

This work was conducted as part of the research project SafeBattery. The K-project SafeBattery is funded by the Federal Ministry for Transport, Innovation and Technology (BMVIT), Federal Ministry of Digital and Economic Affairs (BMDW), Austria and Land Steiermark within the framework of the COMET Competence Centers for Excellent Technologies program. The COMET program is administered by the FFG (project number 863073).

Conflicts of Interest

The authors declare no conflict of interest.

Abbreviations

The following abbreviations are used in this manuscript:
GISSMOGeneralized Incremental Stress State dependent MOdel
ETPElectrolytic-Tough-Pitch
HVHigh-voltage
TRThermal Runaway
FEFinite Element
3PBThree-Point-Bending

References

  1. IEA, Global EV Outlook 2019. Available online: https://www.iea.org/reports/global-ev-outlook-2019 (accessed on 12 October 2019).
  2. Hendricks, C.; Williard, N.; Mathew, S.; Pecht, M. A failure modes, mechanisms, and effects analysis (FMMEA) of lithium-ion batteries. J. Power Sources 2015, 297, 113–120. [Google Scholar] [CrossRef] [Green Version]
  3. Liu, B.; Jia, Y.; Yuan, C.; Wang, L.; Gao, X.; Yin, S.; Xu, J. Safety issues and mechanisms of lithium-ion battery cell upon mechanical abusive loading: A review. Energy Storage Mater. 2020, 24, 85–112. [Google Scholar] [CrossRef]
  4. Wang, Q.; Mao, B.; Stoliarov, S.I.; Sun, J. A review of lithium ion battery failure mechanisms and fire prevention strategies. Prog. Energy Combust. Sci. 2019, 73, 95–131. [Google Scholar] [CrossRef]
  5. Bubbico, R.; Greco, V.; Menale, C. Hazardous scenarios identification for Li-ion secondary batteries. Saf. Sci. 2018, 108, 72–88. [Google Scholar] [CrossRef]
  6. Feng, X.; Ouyang, M.; Liu, X.; Lu, L.; Xia, Y.; He, X. Thermal runaway mechanism of lithium ion battery for electric vehicles: A review. Energy Storage Mater. 2018, 10, 246–267. [Google Scholar] [CrossRef]
  7. Abaza, A.; Ferrari, S.; Wong, H.K.; Lyness, C.; Moore, A.; Weaving, J.; Blanco-Martin, M.; Dashwood, R.; Bhagat, R. Experimental study of internal and external short circuits of commercial automotive pouch lithium-ion cells. J. Energy Storage 2018, 16, 211–217. [Google Scholar] [CrossRef]
  8. Khan, M.; Magne, P.; Bilgin, B.; Wirasingha, S.; Emadi, A. Laminated busbar design criteria in power converters for electrified powertrain applications. In Proceedings of the IEEE Transportation Electrification Conference and Expo (ITEC), Detroit, MI, USA, 15–18 June 2014. [Google Scholar]
  9. Bao, Y.J.; Cheng, K.W.E.; Ding, K.; Wang, D.H. The study on the busbar system and its fault analysis. In Proceedings of the 5th International Conference on Power Electronics Systems and Applications (PESA), Hong Kong, China, 11–13 December 2013. [Google Scholar]
  10. Yang, S.; Wang, W.; Lin, C.; Shen, W.; Li, Y. Investigation of Internal Short Circuits of Lithium-Ion Batteries under Mechanical Abusive Conditions. Energies 2019, 10, 1885. [Google Scholar] [CrossRef] [Green Version]
  11. Sahraei, E.; Campbell, J.; Wierzbicki, T. Modeling and short circuit detection of 18650 Li-ion cells under mechanical abuse conditions. J. Power Sources 2012, 220, 360–372. [Google Scholar] [CrossRef]
  12. Werling, T.; Geuting, P.; Höschele, P.; Ellersdorfer, C.; Sinz, W. Investigation of the electro-mechanical behavior of automotive high voltage busbars under combined electrical load with varying indenter geometry and environmental conditions. J. Energy Storage 2020, 32, 101861. [Google Scholar] [CrossRef]
  13. Xia, Y.; Wierzbicki, T.; Sahraei, E.; Zhang, X. Damage of cells and battery packs due to ground impact. J. Power Sources 2014, 267, 78–97. [Google Scholar] [CrossRef]
  14. Kukreja, J.; Nguyen, T.; Siegmund, T.; Chen, W.; Tsutsui, W.; Balakrishnan, K.; Liao, H.; Parab, N. Crash analysis of a conceptual electric vehicle with a damage tolerant battery pack. Extrem. Mech. Lett. 2016, 9, 371–378. [Google Scholar] [CrossRef] [Green Version]
  15. Xia, Y.; Chen, G.; Zhou, Q.; Shi, X.; Shi, F. Failure behaviours of 100% SOC lithium-ion battery modules under different impact loading conditions. Eng. Fail. Anal. 2017, 82, 149–160. [Google Scholar] [CrossRef]
  16. Cu-OFE. Available online: https://www.matthey.ch/fileadmin/user_upload/downloads/fichetechnique/DE/Cu-OFE_C.pdf (accessed on 28 October 2020).
  17. Grilamid XE 3817. Available online: https://www.campusplastics.com/campus/de/datasheet/Grilamid+XE+3817 (accessed on 28 October 2020).
  18. Grilon BG-30 FR. Available online: https://www.campusplastics.com/campus/de/datasheet/Grilon+BG-30+FR (accessed on 28 October 2020).
  19. ISO 6892–1:2019. Metallic Materials—Tensile Testing—Part 1: Method of Test at Room Temperature; ISO: Geneva, Switzerland, 2020. [Google Scholar]
  20. DIN EN 50106:2016-11. Testing of Metallic Materials—Compression Test at Room Temperature; DIN: Berlin, Germany, 2016. [Google Scholar]
  21. ISO 527–2:2012. Plastics—Determination of Tensile Properties—Part 1: Test Conditions for Moulding and Extrsion Plastics; ISO: Geneva, Switzerland, 2012. [Google Scholar]
  22. ISO 604:2002. Plastics—Determination of Compressive Properties; ISO: Geneva, Switzerland, 2002. [Google Scholar]
  23. ISO 178:2010. Plastics—Determination of Flexural Properties; ISO: Geneva, Switzerland, 2010. [Google Scholar]
  24. ISO 527–1:2019. Plastics—Determination of Tensile Properties—Part 1: General Principles; ISO: Geneva, Switzerland, 2019. [Google Scholar]
  25. Becker, F. Entwicklung einer Beschreibungsmethodik für das mechanische Verhalten unverstärkter Thermoplaste bei hohen Deformationsgeschindigkeiten. Ph.D. Thesis, Universisty Halle-Wittenberg, Halle-Wittenberg, Germany, 2009. [Google Scholar]
  26. Becker, F.; Kraatz, A.; Moneke, M. Determination of the mechanical properties of oriented short fibre reinforced thermoplastics under different stress states. In Proceedings of the 6th LS-DYNA Users Conference, Gothenburg, Germany, 28–30 May 2007. [Google Scholar]
  27. Goldberg, N.; Arcan, A.; Nicolau, N.; Goldenberg, N. On the most suitable specimen shape for testing shear strength of plastics. ASTM Spec. Techn. Publ. 1959, 247, 115–121. [Google Scholar]
  28. ISO 1110:2019. Plastics–Polyamides–Accelerated Conditioning of Test Specimens; ISO: Geneva, Switzerland, 2019. [Google Scholar]
  29. Bonten, C. Plastics Technology: Introduction and Fundamentals; Hanser Publishers: Munich, Germany, 2019; pp. 48–60. [Google Scholar]
  30. Junginger, M. Charakterisierung und Modellierung unverstärkter thermoplastischer Kunststoffe zur numerischen Simulation von Crashvorgängen. Ph.D. Thesis, Technical University Munich, Munich, Germany, 2004. [Google Scholar]
  31. Reithofer, P.; Fertschej, A.; Hirschmann, B. Material Models for Thermoplastics in LS-DYNA: From Deformation To Failure. In Proceedings of the 15th International LS-DYNA Users Conference, Dearborn, MI, USA, 13–14 June 2018. [Google Scholar]
  32. Hallquist, J. LS-DYNA Keyword User’s Manual: Volume II - Material Models; Livermore Software Technology Corporation (LSTC): Livermore, CA, USA, 2020. [Google Scholar]
  33. Hallquist, J. LS-DYNA Theory Manual; Livermore Software Technology Corporation (LSTC): Livermore, CA, USA, 2019. [Google Scholar]
  34. Arriaga, A.; Pagaldai, R.; Zaldua, A.M.; Chrysostomou, A.; O’Brien, M. Impact testing and simulation of a polypropylene component. Correlation with strain rate sensitive constitutive models in ANSYS and LS-DYNA. Polym. Test. 2010, 29, 170–180. [Google Scholar] [CrossRef]
  35. Myers, E.C.; Shanmugam, M. Evaluation of Thermoplastic SMA Material Models for Predicting Crashworthiness for Automotive Applications. In SAE Technical Paper Series; SAE: Warrendale, PA, USA, 2002. [Google Scholar]
  36. Kolling, S.; Haufe, A.; Feucht, M.; Du Bois, P.A. SAMP-1: A Semi-Analytical Model for the Simulation of Polymers. In Proceedings of the 4th LS-DYNA User Conference, Bamberg, Germany, 20–21 October 2005. [Google Scholar]
  37. Koukal, A. Crash- und Bruchverhalten von Kunststoffen im Fußgängerschutz von Fahrzeugen. Ph.D. Thesis, Technical University Munich, Munich, Germany, 2014. [Google Scholar]
  38. Ludwik, P. Elemente der Technologischen Mechanik; Springer: Berlin, Germany, 1909. [Google Scholar]
  39. Hollomon, J.H. Tensile Deformation. AIME 1945, 162, 268–290. [Google Scholar]
  40. Gomeringer, R. Mechanical and Metal Trades Handbook; Europa-Technical Book Series for the Metalworking Trades, 4th ed.; Verlag Europa-Lehrmittel: Haan-Gruiten, Germany, 2018. [Google Scholar]
  41. Neukamm, F.; Feucht, M.; Haufe, A. Considering damage history in crashworthiness simulations. In Proceedings of the 7th European LS-DYNA Conference, Salzburg, Austria, 14–15 May 2009. [Google Scholar]
  42. Althammer, F.; Moncayo, D.; Mittendorf, P. Approach for modeling of thermoplastic generative designed parts. In Proceedings of the 12th European LS-DYNA Conference, Koblenz, Germany, 14-16 May 2019. [Google Scholar]
  43. Tabacu, S.; Ducu, C. Numerical investigations of 3D printed structures under compressive loads using damage and fracture criterion: Experiments, parameter identification, and validation. Extr. Mech. Lett. 2020, 39, 100775. [Google Scholar] [CrossRef]
  44. Effelsberg, J.; Haufe, A.; Feucht, M.; Neukamm, F.; Du Bois, P. On parameter identification for the GISSMO damage model. In Proceedings of the 12th International LS-DYNA User Conference, Dearborn, MI, USA, 3–5 June 2012. [Google Scholar]
  45. Andrade, F.X.C.; Feucht, M.; Haufe, A.; Neukamm, F. An incremental stress state dependent damage model for ductile failure prediction. Int. J. Fract. 2016, 200, 127. [Google Scholar] [CrossRef]
Figure 1. Methodology used for the experimental characterization and modeling of automotive busbars.
Energies 13 06572 g001
Figure 2. Overview of the used specimens for the material characterization: (a) shows the PA12 busbar; (b) the PA6GF30 busbar; (c) the copper specimen for tensile testing; (d) the thermoplastics tensile specimen; (e) the shear test specimen; (f) the thermoplastic compression specimen; (g) the copper compression specimen; (h) the bending specimen for thermoplastics; and (i) shows the copper bending specimen.
Energies 13 06572 g002
Figure 3. Experimental results of the tensile test for both thermoplastics PA12 and PA6GF30: (a,b) show the results of different strain rates and temperatures in uniaxial tension; (c,d) show the results of the uniaxial compression tests.
Energies 13 06572 g003
Figure 4. Comparison of Young’s modulus and yield strength of PA12 and PA6GF30 for the different tension, compression, and shear tests.
Energies 13 06572 g004
Figure 5. Comparison of uniaxial tensile test results with fitted material models (Mat-24 and Samp-1) for the strain rates 0.001 1/s, 0.55 1/s, 100 1/s, and 200 1/s: (a) shows the force vs. displacement for PA12 and (b) for PA6GF30.
Energies 13 06572 g005
Figure 6. Comparison of quasi-static uniaxial compression test results with fitted material models Mat-24, Mat-124, and Samp-1 for both PA12 and PA6GF30.
Energies 13 06572 g006
Figure 7. Comparison of three-point-bending (3PB) test results with the calibrated material models Mat-24, Mat-124, and Samp-1 for the strain rates 0.0001 1/s, 10 1/s, and 86 1/s: (a) shows the results for PA12 and (b) for PA6GF30.
Energies 13 06572 g007
Figure 8. Material characterization and modeling of copper Cu-OFE R200 using Mat-24: (a) shows the tensile test and simulation; (b) the compression test; and (c) the prevalidation 3PB test.
Energies 13 06572 g008
Figure 9. Finite element (FE) models used for component validation: (a) shows the compression model; (b) the 3PB model; (c) a close-up of the PA6GF30 cross section; and (d) shows the PA12 model cross section. Here, R 1 = 25 mm, R 2 = R 3 = 5 mm, D 1 = 90 mm and D 2 = 70 mm (PA6GF30) or D 2 = 120 mm (PA12).
Energies 13 06572 g009
Figure 10. Validation results for the quasi-static tested high-voltage busbar: (a) shows the 3PB of the component and (b) the compression test using a cylindrical impactor.
Energies 13 06572 g010
Figure 11. Microsection images of the PA12 and PA6GF30 busbars after the compression test using a cylindrical impactor.
Energies 13 06572 g011
Figure 12. Contact optimization of the interface between copper and insulation: (a) shows the force vs. displacement curves for the optimized model compared to test results; (b) shows the PA12 busbar model at the final timestep with a sliding contact using an interface friction of μ = 0.2 ; and (c) shows the PA6GF30 busbar model with a tiebreak contact modeling with critical interface shear stress of 33 MPa.
Energies 13 06572 g012
Figure 13. Plastic strain vs. stress triaxiality for the simulation of compression using a sharp impactor without failure: (a) shows the four elements directly beneath the impactor for PA12 and (b) shows the six elements for PA6GF30. Elements labeled with 1st are on the surface of the insulation and 4th and 6th are nearer to the copper, respectively.
Energies 13 06572 g013
Figure 14. Simulation results using the optimized generalized incremental stress state dependent model (GISSMO): (a) shows the force vs. displacement relation of the simulation with and without GISSMO compared to the experiments (mean value) and the electric short circuit range, and (b) shows the optimized failure and instability strain curves of the GISSMO model. Experimental data from [12].
Energies 13 06572 g014
Figure 15. Cross sections of the FE-model at the observed force drop where the majority of elements fail showing the plastic strain for PA12 and PA6GF30 in (a,c) and the associated failed elements in (b,d).
Energies 13 06572 g015
Table 1. Material properties of the investigated copper Cu-OFE R200 and the thermoplastics PA12 and PA6GF30 [16,17,18].
PropertiesCu-OFE R200PA12PA6GF30
Density [g/cm 3 ]8.941.011.39
E-Modulus [GPa]1271.24.5
Yield Strength [MPa]1404060
Water Absorption [%]-1.57
Table 2. Experimental test program for the characterization of high-voltage busbars. Tests were conducted according to norms [19,20,21,22,23].
MaterialTestStrain Rate [1/s]Temp. [°C]Repetitions
PA12
/ PA6GF30
Tension0.00123, 60, 805
0.55, 100, 200235
Compression0.00523, 60, 805
2.2235
3PB0.000123, 60, 805
10, 86235
Cu-OFE R200Tension0.0002233
Compression0.0002233
3PB0.0008233
Busbar3PB0.0001235
Compression0.001235
Table 3. Overview of selected material models available in LS-DYNA, as described in [31], that are investigated in this study to describe the mechanical material behavior of high-voltage (HV) busbars.
ModelYield
Surface
Visco
Elasticity
Visco
Plasticity
Stress
State
Volume
Mat-24von Mises×Tensionconstant
Mat-124von Mises
Drucker-Prager
Tension
Compression
constant
Samp-1von Mises
Drucker-Prager
Parabolic
Tension
Compression
Shear
compressible
Table 4. Plastic Poisson’s ratio vs. plastic strain curve for Samp-1 material model PA12.
ϵ p l 0.0–0.140.160.180.200.220.240.260.280.300.320.340.360.38–0.8
ν p l 0.260.270.280.290.30.320.340.360.380.400.440.480.5
Table 5. Comparison of the CPU times for the validation simulation showing the factor of additional time needed in relation to the benchmark with Mat-24.
ModelPA12PA6GF30
3PBCompression3PBCompression
Mat-24----
Mat-124+ 5%+ 12%+ 8%+ 15%
Samp-1+ 45%+ 101%+ 151%+ 139%
Publisher’s Note: MDPI stays neutral with regard to jurisdictional claims in published maps and institutional affiliations.

