Abstract
Improving energy recycle is an important way to save energy resources and preserve the global environment. Chemical heat pump (CHP) is a technology for saving energy, which utilizes chemical reactions to store thermal energy such as waste heat and solar heat, then release it to provide heat for heating/cooling/refrigeration. For a practical CHP, it is necessary to find cheaper and more stable supply materials. In order to evaluate the possibility of calcium oxide from natural Ofunato natural limestone including impurities, we compare Ofunato limestone with Kawara natural limestone and Garou natural limestone from Japan. These calcium oxides worked as a reactant for CaO/H2O/Ca(OH)2 CHP by repeated hydration/dehydration reaction cycle experiments in a thermogravimetric analyzer. As a result, Ofunato CaO exhibits a high hydration reaction rate after decarbonization at 1223 K for 5 h. The reactivity increased by the repeated hydration reaction although the first hydration rate was low. Furthermore, the sintering of impurities in Ofunato limestone occur easier than that in Kawara limestone with lower impurities. The impurities adhered to the surface of the CaO particle to make specific surface area of CaO particle smaller, which could inhibit hydration reaction of CaO particle. Even if Ofunato limestone contains some impurities, it can be utilized as a raw material for chemical heat pumps.
1. Introduction
With the increasing development of the global economy, the utilization of fossil fuels is increasing. Improving energy recycling is an important way to save energy resources and preserve the global environment. Chemical heat pumps (CHPs) are one of such technologies for saving and reusing thermal energy [1]. They can use chemical reactions to store thermal energy such as unused industrial waste heat from factories and solar heat, and release it when needed to provide heat for heating/cooling/refrigerating.
In the past, chemical heat pump dryer (CHPD) systems for ecologically effective utilization of thermal energy in drying were proposed by Ogura et al. [2]. Further, Ogura et al. proposed a stand-alone high-efficiency heating and cooling system using a CHP driven only by solar energy [3,4]. In order to improve the fuel efficiency of vehicles by recycling the engine waste heat, Ogura et al. investigated the possibility of waste heat recycle utilization for automobiles by CHP [5].
For chemical heat storage materials, CaCl2 and H2O were selected as the reactant and working medium, assuming the utilization of low-grade waste heat [6]. Li et al. investigated the hydration and dehydration reaction of lithium hydroxide (LiOH) for low temperature heat sources [7]. Ryu et al. investigated how LiOH-modified Mg(OH)2 (LiOH/Mg(OH)2) could be a potential chemical heat storage material [8].
A CHP is a closed unit and can be one of the next generation heat pump technologies for thermal recycling using chemical heat storage. Chemical heat storage materials have a great influence on the practical use of the CHP. The selection of heat storage material for a CHP depends on the application, temperature range of heat storage unit and whether it can reach the equilibrium line by considering the operation of the CHP. For low temperature heat sources, Ogura et al. studied the CHP using he CaSO4/CaSO4⋅1/2H2O reversible reaction that stores under 373 K level thermal energy, and releases the same level of hot heat and 273 K level cooling heat [9]. Furthermore, Esaki et al. proposed a chemical heat pump chiller with a SrBr2 hydration reaction system for utilization of waste heat (353–373 K) [10,11]. Kato et al. studied the kinetics of the hydration of magnesium oxide under 373–423 K [12]. It was shown that magnesium oxide can be one of materials to store low-medium temperature heat for CHPs. For high temperature heat sources, Tomari et al. showed that steam reforming and methanation could be used for storing steel manufacturing heat (873–1173 K) by CHP [13].
Although various heat storage materials can be used in CHP, for the high temperature range we use calcium oxide (CaO) made from natural limestone (CaCO3), which is widely distributed in Japan [14]. This is because CaO from limestone is low cost, safe to use and it has a high storage density (1.86 MJ/kg). For a practical CHP, it is necessary to find cheap and more stable supply materials. Therefore, in our laboratory, Zhang et al. studied the hydration reaction rates model of various sized CaO samples from natural Hiroshima limestone produced in Hiroshima/Okayama Prefecture, Japan, and considered the effects of the particle size and the heat/mass transfer resistance [15]. Due to the low durability of Hiroshima limestone, Ogura et al. examined CaO from other limestones (Kawara CaO and Garou CaO) and compared the hydration reaction characteristics [16]. They showed that CaO from Garou limestone can be used as a practical material for CHP due to its relatively high strength and reactivity. Kikuchi et al. showed that CHP unit with low-purity Garou CaO, which has more impurities than Ofunato CaO, had a better performance than CHP units with high-purity Kawra CaO [17]. The reaction rates of low-purity Garou CaO in repeated experiments became higher than those of the high-purity Kawara CaO reaction.
In previous studies [18], we demosntrated that Kawara CaO limestone with high purity had high hydration reaction characteristic. However, common limestone, which is widely distributed throughout Japan, contains impurities such as quartz, clay minerals, etc. The effects of these impurities on CaO reactivity for CHP are not clear. Therefore, we chose a new sample CaO from Ofunato limestone, which has relatively high levels of impurities. The objectives of this study were thus to evaluate the practicability of Ofunato limestone as a chemical heat pump material by comparing Ofunato limestone with Kawara limestone and Garou limestone, and to examine the effects of the impurities in Ofunato CaO on the hydration reaction.
2. Operating Principle of CaO/H2O/Ca(OH)2 Chemical Heat Pump
A CaO/H2O/Ca(OH)2 chemical heat pump is theoretically based on the following equations:
CaO(s) + H2O(g) ⇄ Ca(OH)2(s) + 104.2 kJ/mol
H2O(g) ⇄ H2O(l) + 43.9 kJ/mol
Figure 1 shows the operating principle of a CaO/H2O/Ca(OH)2 chemical heat pump. In the heat storing step, when heat QH is supplied to the high temperature reactor, the heat QH is stored in the form of CaO(s) as thermochemical energy by decomposition of Ca(OH)2(s). The released water vapor flows into condenser under low temperature due to the pressure difference between the reactor and condenser. The water vapor condenses and releases the low temperature heat QL.
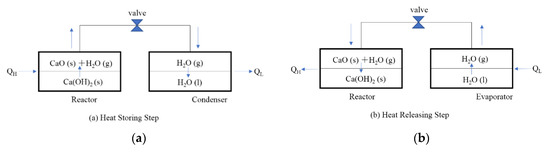
Figure 1.
Operating principle of chemical heat pump. (a) Heat Storing Step (b) Heat Releasing Step.
In the heat releasing step, the water vapor flows from evaporator into the reactor by opening a valve due to the pressure difference between reactor and evaporator. The exothermic hydration reaction of the reactant CaO(s) takes place and releases QH in the reactor. In the evaporator, the temperature is cooled down due to the latent heat of water evaporation.
In this study, a thermogravimetric analyzer (TGA-51) was used as a reactor connected to the temperature control bath used as an evaporator/a condenser. The experimental unit is a model of CHP, which can store the thermal energy in TGA-51 by dehydration reaction, and release it to provide heat for heating in TGA-51 by hydration reaction.
3. Sample Materials
Kawara limestone produced in Fukuoka Prefecture, Japan, Garou limestone produced in Hokkaido Prefecture, Japan, Ofunato limestone produced in Iwate Prefecture, Japan were obtained from the aggregate plants nearby each quarry as raw materials. Thirty kg of natural limestone were crushed into particles of less than 5 mm in size by a jaw crusher and mixed homogeneously. To get smaller particles (less than 2 mm), pulverization by a steel mortar was repeated. The samples are classified into 710–1000 µmφ by a sieve, according to the previous studies [15,16]. 10 mg/10 g/100 g limestone were used for the repeated hydration experiments.
Table 1 presents the chemical compositions (mass%) of the natural limestone samples. It shows that the purity of Kawara limestone is 99.66% and that of Ofunato limestone is 96.96%. However, the purity of Garou limestone is 95.01%. The amount of SiO2 in Ofunato limestone is higher (1.26%) compared to Kawara limestone. The amount of Fe2O3 and Al2O3 in Ofunato limestone are also higher than that in Kawara limestone and Garou limestone. The amount of MgO in Garou limestone is the highest (2.38%) of all them.

Table 1.
Chemical compositions (mass%) of different natural limestone samples. (measured by a ZSX Primus II Scanning X-ray fluorescence analyzer, Rigaku, Japan).
In Japan, limestone with white color and high purity like Kawara limestone is called “kansuiseki” [19]. MgO, SiO2, Al2O3 etc. are found in limestone as impurities, and result from quartz, clay mineral, iron oxide mineral, hydroxide mineral, dolomite, etc. [20]. Because of these impurities, limestone presents various colors such as white, light gray, gray, gray black, light brown, etc. [21]. Figure 2 shows samples of natural limestones with different colors.
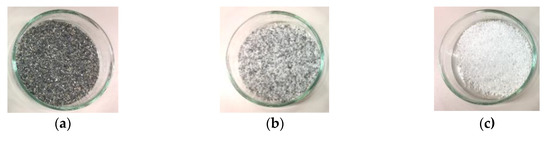
Figure 2.
Samples of (a) Kawara limestone, (b) Ofunato limestone and (c) Garou limestone.
4. Experimental Analysis
4.1. Repeated Hydration Reaction Cycle (Muffle Furnace and TGA-51)
Figure 3 shows a schematic diagram of the lab-scale experimental unit in an open system. The thermogravimetric analyzer (TGA-51, Shimadzu Corporation, Kyoto, Japan) was used as a reactor, which is connected to an evaporator/condenser with joint valves.
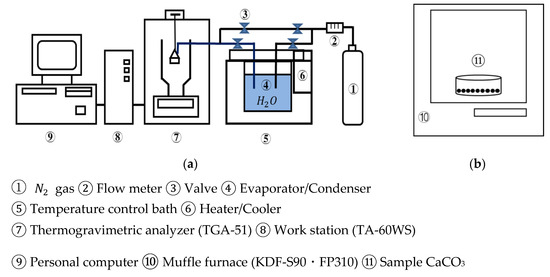
Figure 3.
Schematic diagram of experimental unit. (a) TGA-51 (b) muffle furnace. ①.
Ofunato and Kawara limestone samples of 10 g/100 g (710–1000 µmφ) are heated at a rate of 10 K/min to 1223 K, 1273 K, 1373 K, 1473 K, 1573 K and kept at that temperature for different periods in a muffle furnace to be decarbonized. After the decarbonization, 10 mg/710–1000 µmφ CaO particles are placed into the platinum cell of the thermogravimetric analyzer. N2 gas is flowed into the TGA-51 at 70 mL/min. The temperature is raised to 783 K at a rate of 10 K/min. When the temperature reached 783 K, the evaporated water vapor is introduced into TGA-51 at 298 K with a N2 gas flow (70 mL/min). The hydration of CaO and the dehydration of Ca(OH)2 are repeated at a rate of 2 K/min for three cycles between 373 K and 783 K. The water vapor is consistently maintained under self-pressure at 298 K.
4.2. Repeated Hydration Reaction Cycle (TGA-51)
Ten mg (710–1000 µmφ) of Ofunato limestone, Kawara limestone and Garou limestone samples are decarbonized under the different conditions without holding time in the TGA-51. Table 2 shows the different decarbonization, hydration and dehydration conditions according to the operation of TGA-51 described in Section 4.1. After decarbonization, N2 gas and water vapor at 298 K are flowed into the TGA-51 at 70 mL/min.
Table 2.
Different decarbonization, hydration and dehydration temperature conditions in TGA-51.
5. Results and Discussion
5.1. Repeated Hydration Experiments of 3 Different Kinds of CaO
First of all, in order to compare the conversion and the heat output of three different kinds of CaO, three hydration reaction experiment cycles are performed in the TGA-51 system. Three different kinds of CaO are decarbonized in the TGA-51 (Section 4.2). Figure 4 shows hydration conversion vs. time and the heat output per 1kg of Kawara CaO, Ofunato CaO and Garou CaO. The heat output is calculated by the reaction rate. From Figure 4, the reaction rates of Kawara CaO are the highest, and the conversion ratios are over 100%. This is because the conversion ratio is calculated based on the lightest weight of CaO after decarbonation. When the water vapor is flowed to the thermogravimetry (TGA-51), the weight of Ca(OH)2 become heavier than usual, because of the water vapor adsorbed on Kawara CaO. The reaction rate of Garou CaO is the lowest among the three different kinds of CaO. It is because that magnesium in Garou CaO forms a kind of columnar joint texture and inhibit water vapor transferring into CaO particle [22]. The conversion ratios of Ofunato CaO are over 94%. It shows that the reactivity of Ofunato CaO is relatively high, even if there are 3.04% impurities in Ofunato limestone. In addition, the highest heat output of Kawara CaO (red circle) is 2.12 kW/kg-CaO at 690 s and 990 s. Although the heat output of Ofunato CaO (blue square) is lower than that of Kawara CaO, it is still 1.95 kW/kg-CaO at 510 s. And it is almost constant from 630 s to 1110 s (1.56 kW/kg-CaO). The heat output of Garou CaO (green triangle) is the lowest (1.51 kW/kg-CaO).
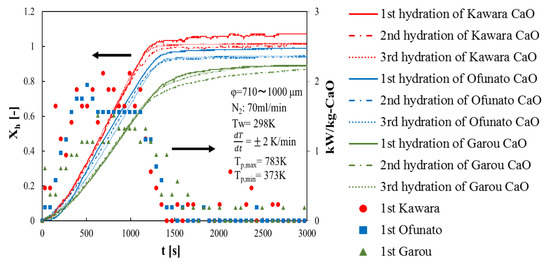
Figure 4.
Hydration conversion and the heat output of Kawara CaO, Ofunato CaO and Garou CaO.
5.2. Effects of Different Decarbonization Temperature
Repeated hydration experiments are performed on Ofunato CaO and Kawara CaO in the TGA-51 system. Ofunato CaO and Kawara CaO are made from 10 g Ofunato limestone and Kawara limestone decarbonized at 1223 K, 1273 K, 1373 K, 1473 K, 1573 K and kept at that temperature for one hour in a muffle funace (see Section 4.1). Figure 5 shows the 1st hydration conversion (dotted line) and 3rd hydration conversion (full line) of Ofunato CaO and Kawara CaO in TGA-51. The reaction rates of Ofunato CaO and Kawara CaO decarbonized at 1223 K and 1273 K have higher reaction characteristics. The temperature dependence of hydration behavior of Ofuanto CaO is higher than that of Kawara CaO. The conversion ratios of Ofunato CaO decarbonized at 1573 K lowed to 10% drastically. It seems that Ofunato CaO decarbonized at 1573 K loses its hydration reactivity.
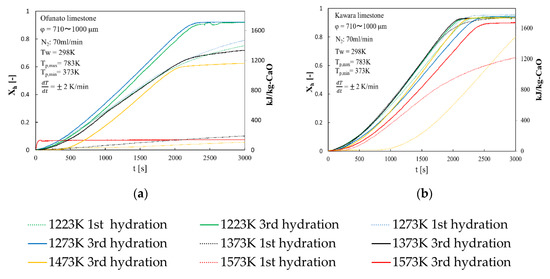
Figure 5.
Hydration conversion after decarbonization in muffle furnace. (a) Ofunato CaO (b) Kawara CaO.
Figure 6 shows the XRD pattern of Ofunato CaO after decarbonization at 1223 K, 1273 K and 1573 K (dT/dt = 10 K/min) for one hour in a muffle furnace. During the decarbonization stage, the impurities of Si, Fe and Al react with CaO to form new compounds, such as Ca2Al2SiO7 (gehlenite), Ca2Fe1.28Al0.72O5 (calcium aluminoferrite), C2S [23], etc. It is considered that the sintering of impurities in Ofunato limestone occurs easier than in Kawara limestone with lower impurities. As shown in the XRD pattern, Ca2Al2SiO7 (gehlenite) is produced by the reaction of CaO⋅Al2O3⋅2SiO2 (anorthite), Al2O3 and CaO during the decarbonization at 1573 K [24]. It can be presumed that the reaction starts from the surface of CaO particle [25,26] and then the gehlenite covers the surface of CaO particle to make it lose hydration reactivity. From the repeated hydration experiments, it is assumed that the negative effects of impurities on Ofunato CaO reactivity could be minimized by controlling the decarbonization temperature and time and the desirable decarbonization conditions can provide the high hydration reaction characteristics even if natural limestone such as Ofunato CaO containing some impurities.
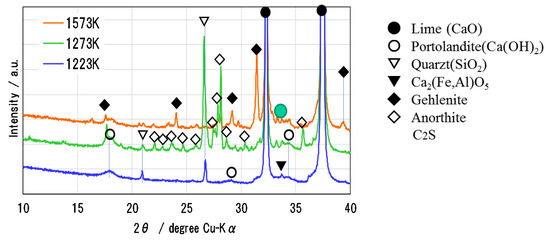
Figure 6.
XRD pattern of Ofunato CaO after decarbonization at 1223 K, 1273 K and 1573 K.
Table 3 shows the specific surface area and the mean pore diameter of Ofunato CaO after decarbonization at 1273 K and 1573 K in a muffle furnace. The specific surface area and the mean pore diameter decarbonized at 1573 K is smaller than those at 1273 K. This is probably because that the compounds adhered to the surface of the CaO particle made specific surface area of CaO particle smaller. These physical property changes can support the hydration reactivity decrease of Ofunato CaO.
Table 3.
Specific surface area and mean pore diameter of Ofunato CaO after decarbonization at 1273 K and 1573 K in muffle furnace.
5.3. Effects of Decarbonization Conditions
Repeated hydration experiments are performed on Kawara CaO and Ofunato CaO in the TGA-51 system. Kawara CaO and Ofunato CaO are made from 100 g Ofunato limestone and Kawara limestone decarbonized at different decarbonization temperatures and holding time in a muffle furnace (see Section 4.1). Figure 7 shows the hydration conversion over two cycles of Ofunato CaO and Kawara CaO. From Figure 7, Ofunato CaO has the highest reactivity after decarbonization at 1223 K for 5 h. Additionally, comparing the first hydration reaction rates of Ofunato CaO and Kawara CaO, the reaction rate of Ofunato is much lower than Kawara CaO. However, the 2nd hydration reaction rates of Ofunato CaO become higher than 1st hydration reaction rates. It is hypothesized that the reactivity of Ofunato CaO can be enhanced by hydration/dehydration repetition [27,28].
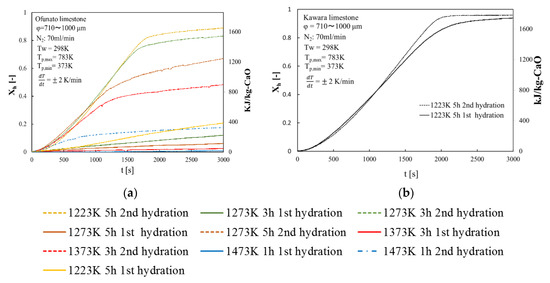
Figure 7.
Hydration conversion (a) Ofunato CaO (b) Kawara CaO.
Figure 8 shows the hydration conversion of Ofunato CaO in TGA-51 after decarbonization at 1223 K for 5 h in a muffle furnace (described in Section 4.1). Figure 9 shows the hydration conversion changes of Ofunato CaO after decarbonization at 1223 K in TGA-51 (see Section 4.2). Figure 8, it shows that 1st hydration conversion of Ofunato CaO decarbonized at 1223 K for 5 h in a muffle furnace is lower. The conversion ratio at 3000 s is only 20.9%. However, after 8000 s, the conversion ratio increased and finally reached up to 86%.
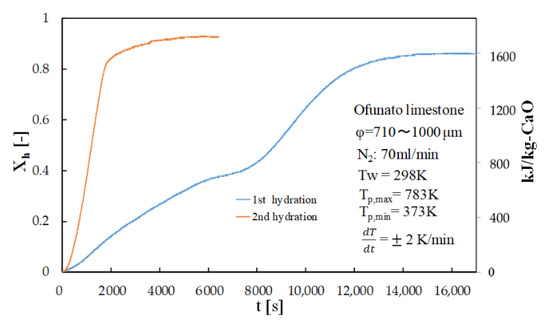
Figure 8.
Hydration conversion of Ofunato CaO in TGA-51 after decarbonization at 1223 K for 5 h in muffle furnace.
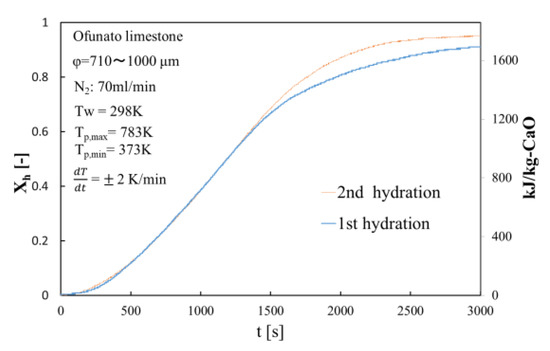
Figure 9.
Hydration conversion of Ofunato CaO after decarbonization at 1223 K in TGA-51.
The conversion ratio of Ofunato CaO after decarbonization in the TGA-51 is 91.1% at 3000 s as seen in Figure 9.
In order to evaluate the reactivity of Ofunato CaO, we did 5-cycle repeated hydration reaction experiments in the TGA-51. Ofunato CaO is made from 100 g Ofunato limestone decarbonized at 1223 K for 5 h in a muffle furnace (see Section 4.1). Figure 10 shows the hydration conversion and the heat output per 1 kg of Ofunato CaO. Ofunato CaO have the high reactivity after 2nd hydration reaction. The hydration reaction rate of Ofunato CaO increased with the repetition of the hydration/dehydration reactions. Meanwhile, the 5th hydration conversion ratio of Ofunato CaO is 95.9%. As shown in Figure 10, the heat output of Ofunato CaO is stable from 870 s to 1710 s and is over 1.11 kW/kg-CaO after 2nd hydration reaction. The maximum heat outputs of Ofunato CaO are about 1.29 kW/kg-CaO at 1410 s and 1470 s during the 5th hydration reaction.
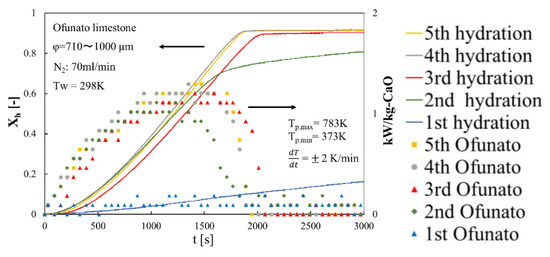
Figure 10.
Hydration conversion and the heat output per 1 kg of Ofunato CaO in TGA-51 after decarbonization at 1223 K for 5 h in muffle furnace.
Figure 11 shows the dehydration conversion of Ofunato CaO after decarbonization in a muffle furnace. The 1st dehydration conversion ratio is lowest. This is becasuse that reactivity of Ofunato Ca(OH)2 is relatively low during the 1st dehydration reaction. After the 2nd dehydration reaction, the reactivity of Ofunato Ca(OH)2 was increased by hydration/dehydration repetition. Figure 12 shows the heat storage and heat release per 1 kg of Ofunato CaO in the TGA-51 system. The heat storage and heat release of Ofunato CaO/Ca(OH)2 are relatively low during the 1st hydation/dehydration, but after a 2nd dehydration reaction, the heat storage and heat release of Ofunato CaO/Ca(OH)2 becomes stable (1700 kJ/kg-CaO).
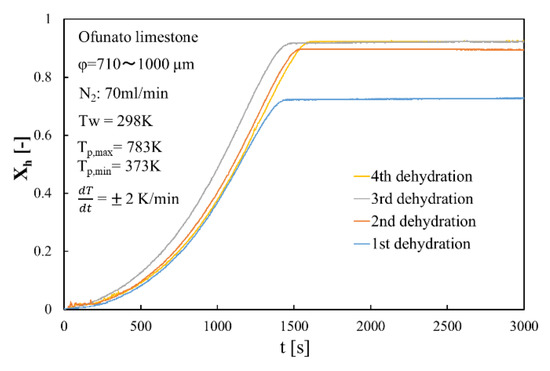
Figure 11.
Dehydration conversion of Ofunato CaO in TGA-51 after decarbonization at 1223 K for 5 h in muffle furnace.
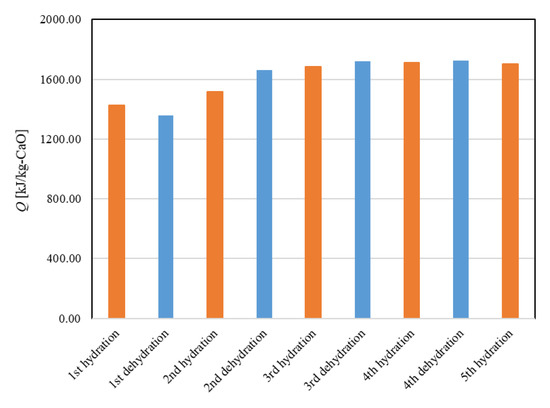
Figure 12.
The heat storage and the heat release per 1 kg of Ofunato CaO in TGA-51.
5.4. Crystal Grain Structure
Figure 13a–c show 5 μm SEM images of Ofunato CaO after decarbonization in a muffle furnace, Ofunato Ca(OH)2 after the 1st hydration reaction and Ofunato CaO after 1st dehydration reaction in the TGA-51 (Section 4.1), respectively. As shown in figures a, b and c, the CaO particles are composed of uniform cocoon-shaped crystal grains. The uniform porous structure can promote the diffusion of water vapor into CaO particles. From pictures a to c, it is inferred that the pore size becomes large.

Figure 13.
SEM images of 710–1000 µmφ (a) Ofunato CaO, (b) Ofunato Ca(OH)2 after 1st hydration reaction, (c) Ofunato CaO after 1st dehydration reaction after decarbonization at 1223 K for 5 h in muffle furnace.
Figure 14a–c show 5 μm SEM images of Ofunato CaO after decarbonization in the TGA-51, Ofunato Ca(OH)2 after the 1st hydration reaction and Ofunato CaO after the 1st dehydration reaction in the TGA-51 (Section 4.2). It is shown that the CaO particles display a plurality of small, heterogeneous block structures. Meanwhile, there are some cracks in the CaO particles. From pictures d to f, it could be seen that the block shaped particles increase. Comparing pictured 13a and 14d, it can be considered that more cracks in Ofunato CaO after decarbonization in the TGA-51 make it easier for water vapor to diffuse into CaO particles than the pores in Ofunato CaO after decarbonization in a muffle furnace.
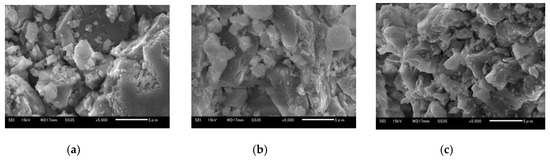
Figure 14.
SEM images of 710–1000 µmφ (a) Ofunato CaO, (b) Ofunato Ca(OH)2 after 1st hydration reaction, (c) Ofunato CaO after 1st dehydration reaction after decarbonization without keeping time in TGA-51.
Table 4 shows the specific surface area of Ofunato CaO after decarbonization at 1223 K for 5 h in a muffle furnace and Ofunato Ca(OH)2 after the 1st hydration reaction. As shown in Figure 13 and Table 4, the specific surface area of Ofunato particles becomes large after the 1st hydration reaction. It is hypothesized that the pores are small after decarbonization in the muffle furnace, thus water vapor cannot smoothly diffuse into the CaO particles, and it can be considered that the CaO particle bed in the muffle furnace has an important impact on the heat transfer. After the 1st hydration reaction, the pores become large and the reactivity of Ofunato CaO improves.
Table 4.
Specific surface area of Ofunato CaO and Ofunato Ca(OH)2 after decarbonization at 1223 K for 5 h in a muffle furnace.
5.5. Effects of Impurities in Ofunato CaO
After decarbonization in the muffle furnace (Section 4.1), Ofunato CaO has some white particles and black particles, as shown in Figure 15. It is hypothesized that the composition of the white particles and black particles is different. Therefore, the elements in Ofunato Ca(OH)2 white particles and black particles are identified by Energy Dispersive X-ray Spectroscopy, as shown in Table 5 and Table 6. From Table 5, the total mass of impurities, like Mg, Al, Si and Fe, is 1.93%. It could be seen that Ofunato CaO (white particles) can react fully with water vapor without any observable effect of the impurities. On the other hand, the total mass of impurities in Ofunato Ca(OH)2 black particles is 26.97%, as shown in Table 6. Figure 16 shows a picture of black particles (Ofunato Ca(OH)2) after a 4th hydration reaction in the TGA-51 system.
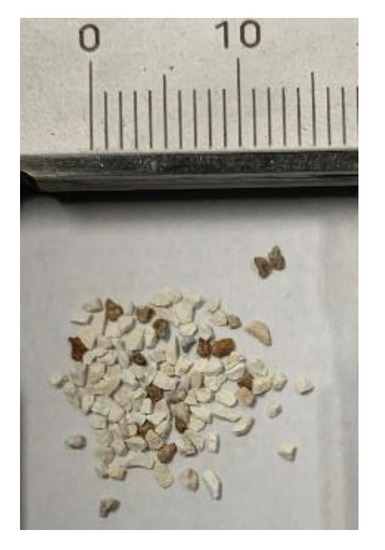
Figure 15.
The picture of white particles (Ofunato CaO) and black particles (Ofunato CaO) after decarbonization at 1223 K for 5 h in a muffle furnace.
Table 5.
Identified elements in Ofunato Ca(OH)2 (white particles) after the 1st hydration in the TGA-51 system and decarbonization in a muffle furnace (measured by Energy Dispersive X-ray Spectroscopy).
Table 6.
Identified elements in Ofunato Ca(OH)2 (black particles) after a 1st hydration in the TGA-51 system and decarbonization in a muffle furnace (measured by Energy Dispersive X-ray Spectroscopy).
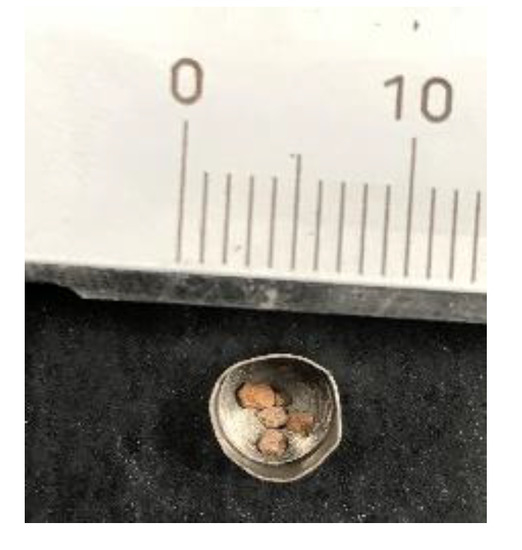
Figure 16.
Picture of black particles of Ofunato Ca(OH)2) after a 4th hydration in the TGA-51 system.
The mass of impurities (Mim) in Ofunato limestone was calculated using Equation (3):
where Mtotal denotes chemical compositions of impurities in Table 1, Mwhite denotes the chemical compositions of white particles in Table 5, Mblack denotes the chemical compositions of black particles in Table 6. The mass of impurities in Ofunato limestone is calculated as 4.43%. It could be seen that even if Ofunato limestone contains some impurities (4.43%), it can still be utilized as a raw material for chemical heat pumps.
Figure 17 shows the hydration conversion of white particles (Ofunato CaO) and black particles (Ofunato CaO) in the TGA-51 system after decarbonization at 1223 K for 5 h in a muffle furnace (Section 4.1). The 1st, 2nd, 3rd and 4th hydration conversion ratios of black particles are only about 0.64%, 1.93%, 2.41% and 1.81%, respectively. In contrast, the 2nd hydration conversion ratio of white particles is 92.8%. Although black particles contain more than 70% of CaO, it could hardly react with water during four cycles of repeated hydration reactions. It is possible that new compounds, such as CaO⋅Al2O3⋅2SiO2, would adhere to the surface of the CaO particles and prevent the water vapor from diffusing into the CaO particles.
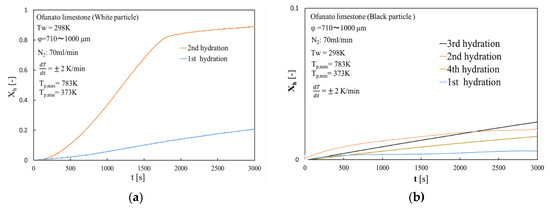
Figure 17.
Hydration conversion in TGA-51 system after decarbonization at 1223 K for 5 h in a muffle furnace. (a) white particle (Ofunato CaO) (b) black particle (Ofunato CaO).
6. Conclusions
In this study, in order to evaluate the potential of Ofunato limestone as a chemical heat pump material, we compared Ofunato limestone with Kawara limestone and Garou limestone by some hydration reaction experiments, and evaluated XRD, specific surface area, mean pore diameter, etc. The conclusions are as follows:
- The high temperature sintering of impurities in Ofunato limestone occurs easier than that in Kawara limestone with lower impurities.
- In the first hydration reaction, the reaction rate of Ofunato CaO is relatively low. However, the reactivity of Ofunato CaO could be improved by repeated hydration reaction experiments.
- For practical development of a chemical heat pump, it is viable to use cheaper Ofunato limestone instead of high quality “kansuiseki” (Kawara limestone), which is more expensive.
- The impurities adhered to the surface of the CaO particles make the specific surface area of CaO particles smaller, which could inhibit the hydration reactions of the CaO particles.
- The adverse effects of impurities on the hydration characteristics can be minimalized by controlling the decarbonization temperature and holding time.
Taken together, these results show that Ofunato limestone including impurities can be utilized as a raw material for chemical heat pumps.
Author Contributions
L.L. performed the experiments, did data analysis and wrote the original manuscript. H.O. leaded the program, conceived and designed the experiments. T.I. performed the XRD measurement, analyzed the test results and helped discussion. M.U. and M.I. prepared the samples and BET surface area analysis. All the authors revised and proofread the manuscript. All authors have agreed to the published version of the manuscript.
Funding
This research was funded by Ogura Laboratory, Chiba University and the Central Research Laboratory, Taiheiyo Cement Corporation.
Conflicts of Interest
The authors declare no conflict of interest.
References
- Ogura, H.; Yamamoto, T.; Kage, H. Efficiencies of CaO/H2O/Ca(OH)2 chemical heat pump for heat storing and heating/cooling. Energy 2003, 28, 1479–1493. [Google Scholar] [CrossRef]
- Ogura, H.; Hamaguchi, N.; Kage, H.; Mujumdar, A.S. Energy and cost estimation for application of chemical heat pump dryer to industrial ceramics drying. Dry. Technol. 2004, 22, 307–323. [Google Scholar] [CrossRef]
- Ogura, H.; Saigusa, A.; Shimadu, T. Fundamental experiments for independent heating/cooling system driven by solar energy using CaSO4/ CaSO4⋅1/2H2O chemical heat pump. In Proceedings of the Japan Solar Energy Society 2013, Naha, Japan, 28–29 November 2013; p. 122. [Google Scholar]
- Ogura, H.; Haba, Y.; Kobayashi, E.; Ren, Y.; Aoki, R.; Hirose, Y. Improvement of Solar Chemical Heat Pump Performance for Refrigeration/Cooling/Heating. In Proceedings of the Grand Renewable Energy 2018, Yokohama, Japan, 17–22 June 2018; p. a90458. [Google Scholar]
- Ogura, H.; Fujita, H. Possibility of waste heat recycle utilization for automobiles by chemical heat pump. Trans. JSAE 2016, 47, 579–585. [Google Scholar] [CrossRef]
- Kuwata, K.; Esaki, T.; Yasuda, M.; Matsuda, T.; Kobayashi1, N.; Shiren, Y.; Aman, Y. Durability of thermochemical heat storage demonstrated through long-term repetitive CaCl2/H2O reversible reactions. J. Renew. Sustain. Energy 2017, 9, 024102. [Google Scholar] [CrossRef]
- Li, J.; Zeng, T.; Kobayashi, N.; Xu, H.; Bai, Y.; Deng, L.; He, Z.; Huang, H. Lithium Hydroxide Reaction for Low Temperature Chemical Heat Storage: Hydration and Dehydration Reaction. Energies 2019, 12, 3741. [Google Scholar] [CrossRef]
- Ryo, K.; Junichi, R. Effect of LiOH Addition on Dehydration Reaction of Mg(OH)2. J. Chem. Eng. Jpn. 2019, 52, 152–158. [Google Scholar] [CrossRef]
- Ogura, H.; Haguro, M.; Shibata, Y.; Otsubo, Y. Reaction characteristics of CaSO4/CaSO4⋅1/2H2O reversible reaction for chemical heat pump. J. Chem. Eng. Jpn. 2007, 40, 1252–1256. [Google Scholar] [CrossRef]
- Esaki, T.; Kobayashi, N. Reaction rate characteristics of SrBr2 hydration system for chemical heat pump cooling mode. J. Mater. Sci. Chem. Eng. 2016, 4, 106–115. [Google Scholar] [CrossRef][Green Version]
- Esaki, T.; Kuwata, K.; Ichinose, A.; Kobayashi, N. Reaction rate analysis with unreacted-core shell model for chemical heat pump cooling mode with SrBr2 hydration. Jpn. Soc. Mech. Eng. 2017, 83, 16-00439. [Google Scholar] [CrossRef]
- Kato, Y.; Yamashita, N.; Kobayashi, K.; Yoshizawa, Y. Kinetic study of the hydration of magnesium oxide for a chemical heat pump. Appl. Therm. Eng. 1996, 16, 853–862. [Google Scholar] [CrossRef]
- Tomari, K.; Kishimoto, A.; Toshima, M.; Kansha, Y.; Ishizuka, M.; Tsutsumi, A. Energy saving process for steel heating by using chemical heat pump. J. Jpn. Inst. Energy 2016, 25, 166–167. [Google Scholar] [CrossRef]
- Anzai, T.; Watanabe, T. Present status in lime industry and the future prospects. J. Soc. Inorg. Mater. Jpn. 2016, 23, 49–53. [Google Scholar]
- Zhang, H.; Ogura, H. Studies on hydration reaction rates of various size CaO particles for chemical heat storage/pump. J. Chem. Eng. Jpn. 2014, 47, 587–594. [Google Scholar] [CrossRef]
- Ogura, H.; Zhang, H.; Umezu, M.; Imai, T.; Ishii, M.; Komatsu, K. Reactivity of Garou Limestone for CaO Chemical Heat Pump/Storage. In Proceedings of the 135th Academic Conference of the Society of Inorganic Materials, Kumamoto, Japan, 16–17 November 2017; p. 45. [Google Scholar]
- Kikuchi, Y.; Ishiyama, Y.; Fijita, H.; Hirata, K.; Nakajyo, T.; Ogura, H. Performance enhancement of chemical heat pump unit driven by industrial waste gas heat. J. Jpn. Soc. Energy Resour. 2019, 40, 111–118. [Google Scholar]
- Lai, L.; Kikuchi, Y.; Ogura, H.; Imai, T.; Umezu, M.; Ishii, M. Reactivity of Calcium Oxide from Natural Limestones for Chemical Heat Pump/Storage. In Proceedings of the 137th Academic Conference of the Society of Inorganic Materials, Toyobashi, Japan, 15–16 November 2018; p. 37. [Google Scholar]
- Yoshimura, T. Characteristic and application of white crystalline limestone (kansuiseki). Limest. Assoc. Jpn. 1997, 56, 69–74. [Google Scholar]
- Tagawa, H.; Sugawara, H.; Fujimori, K. Effect of impurities on the shrinkage of limestone during burning. J. Soc. Chem. Ind. Jpn. 1959, 62, 1809–1915. [Google Scholar] [CrossRef]
- Limestone Mining Association. Japanese Limestone; Yasuki Printing Office Co., Ltd.: Tokyo, Japan, 1983; pp. 261–262. [Google Scholar]
- Zhang, H.; Ogura, H.; Umezu, M.; Imai, T.; Ishii, M. Hydration Reaction characteristics of CaO from various local limestones as chemical heat pump/storage materials. J. Mater. Sci. 2017, 52, 11360–11369. [Google Scholar] [CrossRef]
- The Society of Inorganic Materials. Cement·Gypsum·Lime Handbook, 4th ed.; Gihodo Publishing Co., Ltd.: Tokyo, Japan, 1996; pp. 337–339. ISBN 4-7655-0026-8. [Google Scholar]
- Wu, X.; Zhou, T.; Chen, Y.; Zhang, Z.; Piao, G.; Kobayashi, N.; Mori, S.; Itaya, Y. Mineral melting behavior of chinese blended coal ash under gasification condition. Asia Pac. J. Chem. Eng. 2011, 6, 220–230. [Google Scholar] [CrossRef]
- Sohn, H.Y.; Szekely, J. The effect of reaction order in non-catalytic gas-solid reactions. Chem. Eng. Sci. 1972, 27, 763–778. [Google Scholar] [CrossRef]
- Sohn, H.Y. The effects of reactant starvation and mass transfer in the rate measurement of fluid–solid reactions with small equilibrium constants. Chem. Eng. Sci. 2004, 59, 4361–4368. [Google Scholar] [CrossRef]
- Watanabe, T.; Hayashi, M.; Matsuda, H.; Hasatani, M. Enhancement of reactivity of CaO produced from limestone by means of hydration-dehydration treatment. J. Chem. Eng. Jpn. 1993, 19, 91–98. [Google Scholar] [CrossRef][Green Version]
- Ogura, H.; Abliz, S.; Kage, H. Studies on applicability of scallop material to calcium oxide/calcium chemical heat pump. Fuel Process. Technol. 2004, 85, 1259–1269. [Google Scholar] [CrossRef]


© 2020 by the authors. Licensee MDPI, Basel, Switzerland. This article is an open access article distributed under the terms and conditions of the Creative Commons Attribution (CC BY) license (http://creativecommons.org/licenses/by/4.0/).