Abstract
Farming systems need to be planned to provide suitable levels of economic profitability and, at the same time, ensure an effective energy use, in order to perform environmentally friendly production strategies. The herein present work aims to assess the efficiency of energy use and economic impacts of the main farming methods (conventional, organic and integrated) of Clementine’s crops in Calabria (South Italy), through a combined use of Life Cycle Energy Assessment (LCEA) approach and economic analysis. For this purpose, data were collected from clementine producers by using face-to-face interviews. The results revealed that average energy consumption in the organic farming systems was 72,739 MJ, lower than conventional and integrated systems equal to 95,848 MJ and 94,060 MJ, respectively. This is mainly due to the ban of chemicals. Economic analysis showed that organic farms were more profitable compared with the other farming methods, because of the greater selling price and the EU economic support, reaching an average net profit of 4255 € ha−1 against 3134 € ha−1 of integrated farms and 2788 € ha−1 of conventional ones. The economic efficiency of energy from clementine production was 0.058 € MJ−1 in the organic farming, higher compared to the other two farming systems equal to 0.033 € MJ−1 on average.
1. Introduction
Italy is the second-largest European country in terms of the area that has been devoted to the production of citrus fruits. Italian citrus cultivation represents 28.4% (equal to 146,132 ha) of total surface and 24.2% (2,586,507 tons) of total production in Europe [1]. Almost 58% of the whole production are oranges (Citrus x sinensis), followed by clementine (Citrus × clementina, 22%), lemons (Citrus × limon, 15%) and mandarins (Citrus reticulate, 4.6%). The remaining small share (about 1.2%) is represented by bergamot, grapefruit, chinotto orange, and citron, which still are considered very significant for some areas. Citrus crop cultivation is mostly confined in Southern Italy, particularly in Sicily and Calabria, supplying 87% and 83% of the national production of oranges and mandarins, respectively. Calabria is by far the country’s most important clementine-growing region, which account for about 62% (16,164 ha) of the Italian surface dedicated to its cultivation and 69% (437,800 tons) of the total production [2]. Due to its high organoleptic properties, clementine fruit has been awarded the prestigious European PGI (Protected Geographical Indication) recognition, and it is now known worldwide as the PGI “Clementine of Calabria”. Most of the production is consumed as fresh fruit, although it is also widely used in the preparation of sorbets, juices, syrups, and jams. Since the “Clementine of Calabria” has a high impact on the regional and national gross internal product, it is necessary to protect it from the frequent frauds due to the introduction of fruits produced in other countries and sold with the local brand. Therefore, in 1998 to protect and promote the autochthon products, the Consortium for the Protection of the PGI “Clementine of Calabria” was established [3]. The Consortium also tries to enhance local productions and their territory, thus offering greater economic and work opportunities to the marginal areas of Calabria [4]. However, the clementine sector must also be safeguarded from the feasible price crises triggered by adverse weather conditions, as happened in the 2018 season, favoring price support policies by national and regional governments and thus overcome the strong inequality between prices in origin and the consumer price in the large-scale retail trade [5].
The agricultural sector is responsible for consumption of energy [6]. In this respect, farming activities, that are aimed at improving quality and increasing quantities of outputs, cause an imbalance in terms of energy consumption through, for example: land-use specialization, selection of crop varieties more energy-demanding and, application of external inputs (e.g., fertilizers, pesticides, and water). Therefore, it is necessary to identify strategies that mitigate the energetic demands of intensive agriculture and compromises that allow for agricultural activities to be pursued while environmental issues are respected. This process cannot be generalized but requires specific strategies to be adopted in a site-specific manner given the agricultural requirements of each territory.
Citrus production is an energy-consuming system in Mediterranean agriculture. Many studies have been conducted to assess the energy efficiency of major citrus fruits (e.g., oranges and lemons), while only a few researches focused on minor citrus fruits, such as the clementine. The study by [7] focused on an evaluation of the energy requirements of three different citrus fruits: oranges, lemons, and mandarins, by applying an input-output (IO) methodology, which was limited to the cultivation phase. The results revealed that lemon production was the most energy intensive among the three fruits investigated. Namdari et al. [8] compared orange and mandarin production by using IO analysis and found that a greater amount of energy was consumed in the production of oranges when compared to the energy requirements of mandarin production. The major factors of energy consumption were found to be the use of diesel, fertilizers, and irrigation water. Franco Junior et al. [9] evaluated energy flows for citrus production within different levels of the efficiency of mechanized operations. The authors identified that fuel, pesticides, and fertilizers are the main sources of energy demand and detected a better solution in a maximum efficiency scenario that was related with a 10% increase in yield. Qasemi-Kordkheili et al. [10] used energy IO and data envelopment analysis (DEA) to discriminate efficient and inefficient orchards, and identify wasteful use of energy for orange production. It was found that diesel fuel followed by fertilizer and water for irrigation energies are the largest contributors to saving energy. Pergola et al. [11] applied an energy balance analysis with IO method, a Life Cycle Assessment (LCA) analysis, and production cost analysis to evaluate the performance of orange and lemon orchards, under organic and conventional farming. Their results show the stronger sustainability of the organic management systems in terms of energy consumption and environmental and economic impacts, especially for lemons, thanks to the use of environmentally friendly crop inputs. The study by [12] is recognized as the first study to be related to the agro-food industry that furthers the understanding of energy requirements through the use of a LCA method. Among other environmental indicators, the cumulative energy demand (CED) was calculated in order to define the proportion of energy needed to obtain different citrus-based products. The main results concluded that more than 80% of the indirect energy consumption is due to fossil sources.
A simplified approach of LCA, commonly named Life Cycle Energy Assessment (LCEA), was developed with the objective to further energy analysis of a product or process [13,14]. From a literature review, it emerged that some recent studies have applied LCEA approach to determine the energy efficiency of agro-food products, such as tomato production in greenhouses [15], bread [16] and peach production [17]. However, to the authors’ best knowledge no studies have been implemented on the LCEA analysis of clementine production in Italy.
The aim of the present study is to assess the energy impacts of clementine crops in Calabria in southern Italy by using LCEA approach in combination with an economic analysis. This study focused on the main cultivation techniques (i.e., conventional, organic, and integrated) that are practiced in the main production areas (i.e., the northern, mid, and southern areas) of Calabria to identify the scenario for each area that results in better energy use and economic advantages.
2. Materials and Methods
2.1. Study Area and Scenarios
The present work was carried out in Calabria, a region of southern Italy that covers a total surface area of 15,221.90 km2. It borders to the North with Basilicata and it is bordered to the West by the Tyrrhenian Sea, to the East by the Ionian Sea, and to the South-West it is separated from Sicily by the Strait of Messina. Calabria has a predominantly hilly surface, which covers 49.2% of its territory, but also has large mountainous areas accounting for 41.8%, and modest extension plains (9%).
As already mentioned, Calabria is the most representative area for clementine production, holding a long-standing tradition on its cultivation. In particular, the study focused on comparing the following three cultivation methods that are representative of the actual PGI Clementine production methods in Calabria: organic (O), integrated (I), and conventional (C) farming. Organic farming is characterized by the use of organic fertilizers (e.g., manure, horn meal, or poultry manure), the biological control of pests, mechanical operations (e.g., mechanical weeding), and in some cases, the reduced presence of copper compounds in the soil that can lead to toxic phenomena when they accumulate, according to Council Regulation (EC) no. 834/2007 (EC 2007) [18]. Integrated farming is regulated at the local level by specific procedural guidelines, which describe the most appropriate cultivation techniques for several crops [19]. Chemical compounds are allowed only in specific formulations and in limited quantities and specific tillage recommendations should be followed that favor soft operations, low energy consumption, and conservative ploughings to promote soil fertility and biodiversity. Conventional farming allows for the use of all chemical products authorized by European and national regulations, while the use of fertilizers and pesticides is limited only by specific restrictions for areas that are susceptible to chemical leaching.
To fully characterize the structural framework of PGI Clementine production in Calabria, three different areas were selected: the northern (N), mid (M), and southern (S) areas (Figure 1). The N area is represented by a modern citrus fruit cultivation with innovative fruit orchards and a high level of agricultural mechanization. This site is characterized by a long-term average annual rainfall of 913.7 mm, more than two third concentrated from autumn to winter, and an average annual temperature of 17 °C, with a maximum value of 26.8 °C occurring in August and a minimum value of 8.8 °C in January [20]. The M area is characterized by a quality product owing to the better pedo-climatic conditions and innovative fruit orchards. The average annual rainfall is equal to 927.5 mm, of which 74% distributed in the autumn-winter season, while the mean annual temperature is equal to 17.2 °C with a maximum value equal to 25.3 °C in August and a minimum value of 10.3 °C in January. The S area is characterized by quality production given the favorable climate conditions and characteristics of the land, although some old orchards are often intercropped with olive trees. The site is characterized by a mean annual rainfall of 889.5 mm and an annual temperature of 17.1 °C. Almost 72% of annual rainfall is recorded in the wet period (October-March). According to the Disciplinary of production of the PGI “Clementine of Calabria” [4], the three study areas are characterized by medium-textured soils with a silt and clay content lesser than 60% and a limestone content of no more than 15%. Consequently, nine different scenarios (Figure 2) were identified by taking into account the characteristics of the territories as well as the nature of the production techniques (i.e., the most widespread production contexts present in each of the three areas).
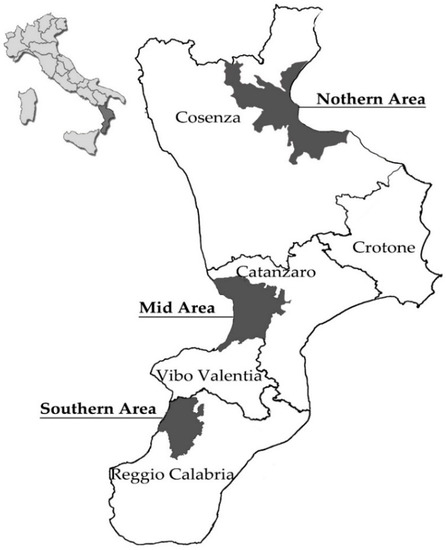
Figure 1.
Case study area.
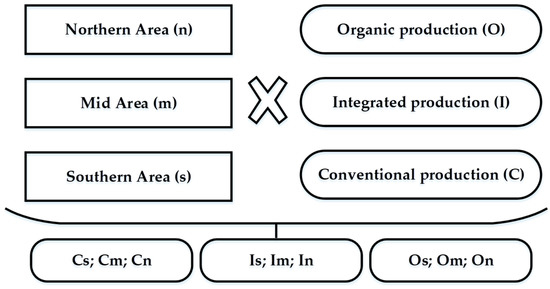
Figure 2.
Scenarios synopsis.
2.2. LCEA Implementation and Economic Analysis
Starting from [19], where a classic input-output energy analysis was applied, a life cycle framework was implemented. In particular, the energy and economic impacts of the different scenarios under study were evaluated following a LCEA approach and production cost analysis. The LCEA approach allowed for an assessment of all the energy requirements connected to agricultural production, including those for facility production and those considered as background inputs in this study. The economic analysis aimed to evaluate all costs linked to farming techniques and the revenues for each scenario (Figure 3).
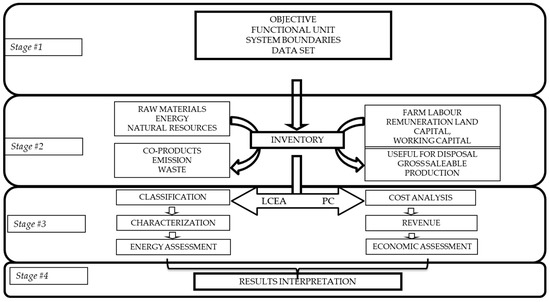
Figure 3.
Methodological implementation.
2.2.1. Goal and Scope Definition
According to the ISO 14040:2006 framework [21], the first step in an LCEA implementation (as in LCA) is to define the goal and scope of the study. This study aimed to assess the relationships between farming practices, production area characteristics, energy demands, and the economic performance of PGI clementine production scenarios in Calabria. The findings of this study may be useful to identify strategies for the optimization of processes aimed at saving energy from non-renewable sources, without compromising the economic results of the farms.
A functional unit (FU) of 1 ha year−1 was adopted to evaluate the potential energy demands of a given area in a given period time. The FU lends itself well to a comparative assessment at a territorial level, which is a scale that is coherent with the decision-making processes of both farmers and policymakers. In addition, a sensitivity analysis was carried out considering 1 ton of product as FU in order to determine whether trade-offs related to organic and integrated production methods could occur.
In order to assess the energy demand of the different citrus farming techniques in this study, the approach “from farm gate to farm gate” was chosen (Figure 4). The assessment was focused on the full production phase of the farming plant, which is the most representative phase in terms of the practices, material inputs, and environmental impacts according to [22]. In this sense, the LCEA analysis and the data collection focused on the background system, which is “the processes on which no or, at best, indirect influence may be exercised by the decision-maker for which an LCA is carried out” [23] and the foreground system, which are “the processes which are under the control of the decision-maker for which an LCA is carried out” [23]. In particular, the foreground system was analyzed in terms of core processes (e.g., agricultural production) but did not consider downstream processes. For the allocation procedure, no cut-off criteria were fixed, and annual consumption was divided by the total number work hours of the machine and multiplied by the time needed for every single operation to determine the quantity of lubricant for each machine operation.
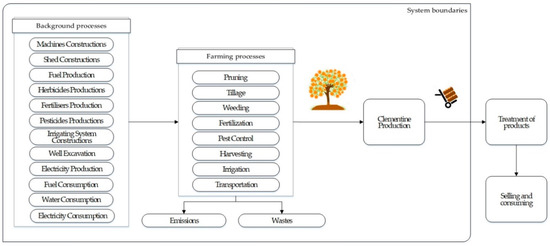
Figure 4.
System boundaries flow chart.
2.2.2. Life Cycle Inventory Data Quality and Gathering
The second step is the life cycle inventory (LCI) analysis in which all input and output data related to products or processes are collected based on FU. Here, the inventory analysis was based on the data of background processes obtained from secondary sources [24] and the data of foreground process that were directly measured from primary sources or estimated from tertiary references from the scientific literature (Table 1). In particular, data on fertilizer emissions were accounted for according to [25,26], whereas, the methodology of [27] was followed to model the fate of pesticides. Fuel combustion emissions, tire use and agricultural tool consumption were quantified in accordance with [25]. No soil carbon sequestration was computed [28,29].

Table 1.
Data quality and data sources.
For the purpose of this study, three leading farms were selected for each of the nine scenarios analyzed (for a total of 27 farms) as sources for the primary data used in the present analyses. The characteristics of these case studies, such as their size, average production, cultivation practices, the age of the plants, and plant density can be considered representative of the regional production, according to data provided by [2,4]. To collect energetic and economic primary data, a face-to-face survey with a detection sheet that was customized following the protocols of [30] was carried out. In particular, the information detected was related to farm production (yield), farm inputs (the types and quantities of agricultural inputs), the machinery use for farm operations (e.g., fertilizer application, tillage, pruning, and weed mowing), outsourced cost items (e.g., expert consultants, transport, and outsourced cultivation operations), and labor. The data collected represented the average value of three years (2015–2017). Table 2 shows the main data collected for each scenario in relation to the functional unit.
Table 2.
Primary data inventory (ha−1 year−1).
2.2.3. Life Cycle Impact Assessment
Life cycle inventory data were processed using SimaPro 8.1 software and the CED method [31]. The life cycle impact assessment (LCIA) method was integrated with the characterization factors of human labor and the water used according to the methodology of [8] to assess the global energy requirements of the different scenarios analyzed. In this way, these inputs that are generally overlooked were added to the LCA to conduct a comprehensive LCEA that took into account all renewable and non-renewable sources so that all input and outputs were connected to the background processes. The CED method, which can be defined as direct and indirect energy use during the entire life cycle of a product or process [32], uses six energy categories that are grouped in two macro categories: non-renewable and renewable energies. The non-renewable energy category includes fossil, nuclear, and primary forest biomass resources, while the renewable energy category includes biomass, water, wind, solar, and geothermal resources. Human labor was integrated into a subcategory, while the water used was allocated to the “renewable water” subcategory.
To evaluate the performance of the scenarios under study from an economic point of view, a production cost analysis was applied as has been done in other studies [33,34,35,36,37]. To carry out such an analysis, an average year in the full production phase was analyzed using the data collected from the field. To calculate the total production cost of each scenario, both the cost items associated with the cultivation methods and those that were not directly linked to the specific farming activities were taken into account (see Table S1 in supplemental materials). The former included all inputs used in PGI clementine production processes, such as fertilizers, pesticides, herbicides, fuels, and machine energy and lubricant consumption as well as the human labor cost needed during agricultural operations. The latter was represented by the cost items, such as services (i.e., accountants, membership fees to the Reclamation Consortium, expenses for organic certifications, laboratory analyses, and outsourced cultivation operations), the ownership costs of machinery and land investments (i.e., quotas of depreciation, maintenance, and insurance), fees, interests (i.e., the remuneration of working capital), administration overheads, and the rents for land use (i.e., land cost). In particular, input costs were calculated by pricing them according to the current market (year 2017). Family labor costs were assessed in terms of opportunity cost and were equaled to the employment of casual workers for manual and mechanical operations by assuming the current hourly wage [38]. Interests on advance capital and capital goods were determined by applying an interest rate of 4.5% and 2%, respectively. To evaluate the rental cost for land use, the average local rental prices were considered. Administration overheads were estimated as 5% of the annual total revenues. In order to compare the profitability of the different scenarios, a net profit indicator was used according to [39,40,41]. Net profit was taken as the difference between total revenues and the total production cost (see Table S1 in supplemental materials). The total revenues were evaluated by multiplying the citrus fruit yield by its market price, including EU direct subsidies. We collected the market prices from the Italian Services Institute for the Agro-food Market (ISMEA) for the years 2015-2017, after which an average market price was assumed.
In the last part of the research, the following indicator was calculated borrowing [33,34,35,36,42] and by relating the net profit to the energy input:
The economic efficiency of energy allows to evaluate from an economic point of view the energy productivity, namely how much gain is generated per consumed MJ to produce clementine.
3. Results
3.1. Energy Results
From an energetic point of view, the O farming system (Figure 5 and Table 3) showed better performance than either C or I farming systems (Table 4 and Table 5). Organic farming scenarios require 72,739 MJ on average, while C and I farming scenarios require 95,848 MJ and 94,060 MJ, respectively. The larger amount of energy consumption of O citrus farms was due to the depletion of fossil energy, which represented about 79% on average.
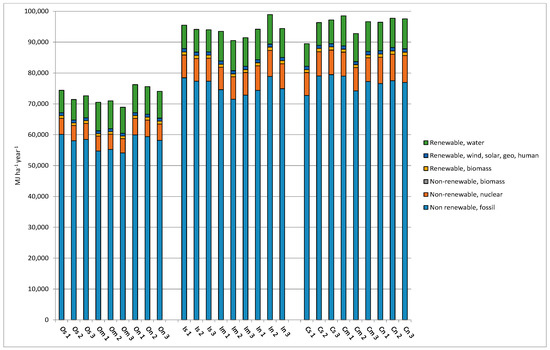
Figure 5.
Energy results.
Table 3.
Energy results in the organic farming system.
Table 4.
Energy results in the integrated farming system.
Table 5.
Energy results in the conventional farming system.
As previously mentioned, the I farming system represented the scenario with the second least amount of impact in terms of energy consumption, although it had a higher “fossil energy” requirement than that of the other two farming systems. Based on sustainable development, non-renewable energy sources should be conserved and an attempt should be made to replace them with renewable energy sources [43]. The ratio of this energy category consumption to the total requirement was similar to that of the O farming system but was not similar to that of the other categories (i.e., a higher ratio for “non-renewable, nuclear” and lower ratio for “renewable, water”). The C farming system produced the worst results, but the cumulative energy demand was quite similar to that of the I farming system. Also, the incidence of different energy sources was similar and the differences were not consistent.
By analyzing the contribution of the different agricultural operations with regard to the cumulative energy demand, O farming systems showed a higher incidence of tillage operations and irrigation compared to that of the I and C farming systems. These last two scenarios showed a higher incidence of fertilization and pesticide distribution compared to that of O farming systems, while the incidence of tillage operations was lower (Figure 6). As expected, emissions make no contribution in terms of energy consumption.
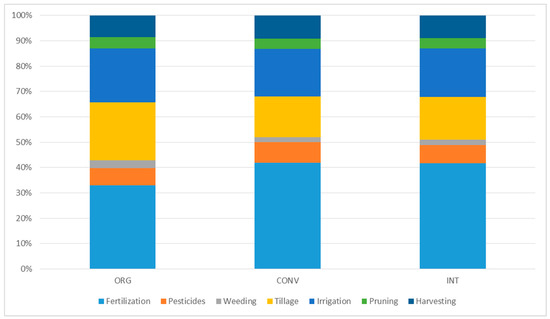
Figure 6.
Contribution to Cumulative Energy Demand by agricultural operations.
3.2. Economic Results
From an economic point of view, more profitable results in terms of net profit indicator associated with organic farms were noted by observing the overall data reported in Table 6, Table 7 and Table 8. Although O farms have the highest total production costs, the selling price of their products and EU incentives for organic farming methods have allowed producers to obtain the highest remuneration for their capital when compared with that of the other methods.
Table 6.
Economic results for the organic farming system (ha−1 year−1).
Table 7.
Economic results in the integrated farming system (ha−1 year−1).
Table 8.
Economic results in the conventional farming system (ha−1 year−1).
Among the organic farms in the same area, minimal differences in cost allocation have been registered, while there is notably variance between farms in different areas. The higher profits were obtained from the farms in the M and N regions even if the total costs were much lower (as in the N region), suggesting a more efficient use of capital and thus more business-like management choices. It should be noted that the share of costs for quotas were lower for N farms than that of the other two areas thanks to a better utilization of capital goods, which allowed for a reduction in the incidence of fixed costs.
Considering that the cost share is directly linked to energetic impacts (e.g., fertilizer costs, pest and weed control, fuel, energy, lubricants, services, and labor), there was a substantial difference between N farms and M and S farms. Northern O farms spend less on fertilizers and fuel than OM farms and more than OS farms, while expenditures for pesticides were more conspicuous when compared with the other farm types. The amount of work used was also greater on N farms, especially for the items linked with external work. In M and S areas, there was a higher share of family work. The analysis of the results shows that farms in the N area were more advanced than those in the S area and this allowed for average higher profits for N farms. Farms in the M region had higher associated costs that did not result in a proportional increase in profits. Of course, it would be necessary to take into account the orographic differences of the three areas that do not always allow for the implementation of cultivation techniques that yield the same results.
The other share of the total cost is represented by quotas, fees, interests, administration overheads, and land costs. Our results confirm what has been reported by [44]. As expected for O farms, the expenditures for quotas and other duties were the highest in this study. This result is certainly due to the control fees required by the inspection body for organic certification.
By analyzing the results related to integrated management (Table 7), it can be observed that only minimal differences between farms in the same area are present, while a notable difference between areas was present but only in terms of net profit. Total costs and their allocation between different production factors were quite similar for all farms analyzed. These findings highlight the lowest economic performance of I farms when compared to either O or C farms. The lower profitability of the I management model is mainly due to the presence of higher average costs, which were slightly higher than that of C farms despite standard production outputs and were due to more favorable prices in the final market. The higher incidence of total costs resulted in C farms being the least profitable of all three farming systems.
The C farming system showed the lowest total costs but also the lowest profits on average (Table 8). Unlike the other two farming systems, there was a greater incidence of costs linked to chemical fertilizer inputs and pest control compounds, while the costs for fuel consumption and labor were lower compared to that of either O or I farming systems. In particular, the costs associated with fuel consumption were directly related to weed management, while O and I farming systems were carried out mechanically.
Figure 7 shows the findings related to the economic efficiency of energy for each scenario analyzed. As expected, the higher net profit and the lesser energy consumption achieved in the O farming systems led to an increase in the “Economic Efficiency of Energy” indicator compared to the I and C systems. The average values of this indicator for the O farms were 0.065 € MJ−1, 0.062 € MJ−1, and 0.049 € MJ−1, in the M, N and S, areas, respectively. The comparison between I and C scenarios showed slight variations of the energy economic efficiency, with a mean amount of 0.030 € MJ−1, 0.039 € MJ−1 and 0.029 € MJ−1 for the respective areas. Here, the EEE indicator suggests how much profit is produced for each MJ consumed during the PGI clementine production process. The greater market price and the EU economic support, as well as a better energy use, achieved in organic farming systems positively affected the results of the economic analysis, endorsing also the findings obtained by [33].
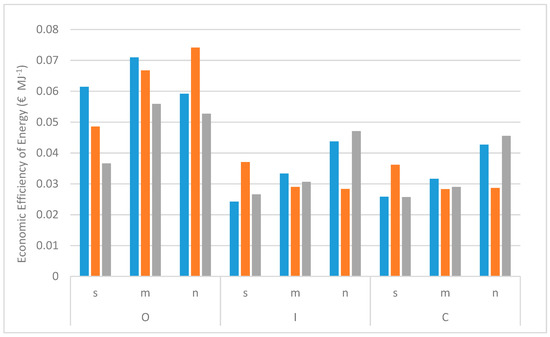
Figure 7.
Results of “Economic Efficiency of Energy” indicator per scenario.
4. Discussion
Results of the present work confirm that the energetic and economic performance variation observed among three different farming systems and their associated outcomes seems to be in line with the results of previous studies. The analyses showed that the best economic performance was associated with organic farming, unlike the findings that have been obtained in similar studies that have been conducted on orange farming showing that conventional farming methods have the highest profitability [45,46]. This result is probably because clementine production can result in higher selling prices with organic or PGI certification, but it is also due to the presence of public incentives for organic production. On the contrary, integrated production scenarios have shown high production costs, not being able to benefit from market advantages and subsidies. However, business results may improve if consumers economically recognized the greater value of such products. This may be accomplished through consumer awareness campaigns, but these processes are not always rapid or effective. Conventional production is the least risky strategy for entrepreneurs, allowing them to make a decent profit with cost levels that are higher than the other two farming alternatives. However, the growing degree of attention that is being paid to environmental and health issues related to food consumption has increasingly spurred individuals to avoid products that are obtained with synthetic inputs (e.g., the exemplary case of glyphosate). This trend could change the market and bring increasing advantages to organic or integrated production methods.
From the LCEA results, organic farming systems have been found to have lower energy requirements than conventional farming systems according to previous studies that have compared different farming systems using energy IO analyses [11,47]. Similar results can also be found in different LCA studies in which the depletion of non-renewable resources has been considered [22,48], but these studies have been generally limited to the use of fossil fuels [49]. The application of LCEA by means of a CED allowed us to obtain results on direct and indirect energy use, including the energy consumed during the extraction, manufacturing, and disposal of raw and auxiliary materials [32] by including some energy inputs that have not been considered by other methods (e.g., human labor and water). The results of the sensitivity analysis confirmed that the organic scenarios are, on average, better than the integrated and conventional scenarios both from an energy and economic point of view. Despite the lower yields, the organic citrus groves represent the most efficient choice for the analyzed region (Table 9).
Table 9.
Results of sensitivity analysis.
The results of this study are fully comparable with those of other studies; however, a greater depth of the most important factors is provided in this study. For example, when considering only one year of production, the results of [11] showed an energy demand for conventional lemon, organic lemon, conventional orange, and organic orange production that was equal to 82,167,34 MJ ha−1 (4,108,367 MJ ha−1 in 50 years), 54,349 MJ ha−1 (2,717,452 MJ ha−1 in 50 years), 77,092 MJ ha−1 (3,854,639 MJ ha−1 in 50 years), and for 55,368 MJ ha−1 (2,768,419 MJ ha−1 in 50 years), respectively. Our results are higher (organic, conventional, and integrated scenarios of 72,739 MJ, 95,848 MJ, and 94,060 MJ, respectively) than those of other studies, but they are relative to the full production phase only.
Ribal et al. [22] state that during the first phase of citrus production (from planting to the 7th year), orchards require only 10% of the amount of fertilizers and pesticides used during full production. In our results, fertilizer and pesticide use ranged from 40–50% of the total energy demand in organic, conventional, and integrated farming systems. According to [22], the findings of the present study were modelled to obtain the CED for the entire life cycle of an orchard (50 years), considering that for the first seven years fertilizer and pesticide use would be 10% of the total amount used during full production. The CED result was 2,733,433 MJ ha−1, 3,605,571 MJ ha−1, and 3,540,699 MJ ha−1 for the organic, conventional, and integrated farming scenarios.
By analyzing the economic and energy results together, a clear advantage of organic production in all production areas can be observed. This cultivation technique not only allowed for higher profits but also had lower associated energy impacts. The higher production costs were mainly owing to the higher costs associated with the employment of labor. Therefore, although organic farming may represent a burden to entrepreneurs, it represents an advantage for society and the land.
The integrated cultivation of clementine was the most advantageous technique after organic farming, but was higher in economic costs when compared to conventional farming, making the use of this technique more risky for entrepreneurs who have to invest more while obtaining fewer benefits in terms of profits and energy consumption. Conventional farming is the most convenient choice for entrepreneurs who want to make a profit by investing the least amount of economic resources. This also translates into higher energy costs and is therefore the less advantageous choice for society and for the land. In every scenario, farms in the northern area produced the best results, which was probably because a greater agricultural vocation exists in this region. Conversely, the southern area produced the worst results, probably because of lesser degree of technical and technological savviness.
5. Conclusions
The main purpose of this paper was to assess the energetic and economic impacts of different clementine cultivation scenarios in southern Italy. The objective of the work was pursued by applying LCEA and production cost methodologies to evaluate the energy and cost profiles of three different farm management strategies (conventional, organic, and integrated farming) that are practiced in the three main production areas of the Calabria Region (northern, mid, and southern areas). Thus, nine different scenarios were identified. The primary dataset for the production of clementine fruits was collected from 27 clementine farms (three farms for each scenario) using a face-to-face questionnaire.
In order to provide farmers and politicians with tools to promote the best use of the agricultural land, a land-based functional unit was used (1 ha) and then the approach “from farm gate to farm gate” was chosen to assess the energetic and economic impacts related to the cultivation processes employed. Organic cultivation represented the better solution in terms of energy demand in all three areas. This result is due to the exclusion of synthetic products from the production process. Indeed, the manufacturing of these products requires great energy consumption, which is mainly non-renewable. Similar results were obtained from the economic assessment owing to the higher revenues associated with organic production. To the contrary, conventional farming scenarios showed the worst energetic and economic performance, recording lesser returns and higher energy impacts. Integrated cultivation is the middle ground between organic and conventional farming practices; however, production costs were very high and above the other two farming strategies with regard to revenues that were not proportionally higher. These findings may be important for the design of targeted policies that are oriented to encourage farmers to adopt more-sustainable and more-profitable production methods, also by identifying specific economic support instruments. Public decision-makers should promote organic production as it represents an advantage for both entrepreneurs and all stakeholders. In addition, entrepreneurs practicing integrated agriculture should be given more support than entrepreneurs that are practicing conventional farming through technical support and consumer awareness campaigns. However, this analysis could not be exhaustive for some limitations. The first due to the energy-oriented approach that overlooking significant environmental impacts linked to the life cycle of product or process (e.g., the effects of nitrogen and phosphorus emissions in terms of eutrophication or the effects of pesticides on toxicity). Another limitation could be ascribable to the extension of the system boundaries by including not only the full production phase, but also the unproductive phases or, even more by considering the whole citrus supply chain “from cradle to grave”. In addition, a larger database, including more farm case studies, should increase the accuracy of the estimate, in terms of better representativeness of the different citrus areas at regional scale. Further research advances could contribute to fill up the gaps, in order to improve the quality of results.
Supplementary Materials
The following are available online at https://www.mdpi.com/1996-1073/13/5/1289/s1, Table S1: Data input for economic analysis (€ ha−1 year−1).
Author Contributions
Conceptualization, M.D., B.P., and G.G.; methodology, G.F., A.I.D.L., T.S., N.I.; investigation, G.F., N.I.; data curation, G.F., T.S., G.D.V., A.S.; writing-original draft preparation, G.F., A.I.D.L., T.S., N.I.; writing-review and editing, A.I.D.L., T.S., G.D.V. All authors have read and agreed to the published version of the manuscript.
Funding
This work has been supported financially by UNICT 2016–2018 – 5A722192141 “Piano per la Ricerca. Linea di intervento 2. Seconda annualità P7/WP2”; Project leader: Gaetano Chinnici.
Conflicts of Interest
The authors declare no conflict of interest.
References
- FAOSTAT. The FAO (Food and Agriculture Organization of the United Nations). Statistical Database. 2019. Available online: http://www.fao.org/faostat/en/#data/QC (accessed on 4 December 2019).
- ISTAT. Istituto Nazionale di Statistica. Statistical Database. 2018. Available online: http://dati.istat.it/Index.aspx?DataSetCode=DCSP_COLTIVAZIONI (accessed on 4 December 2019).
- Benabdelkamel, H.; Di Donna, L.; Mazzotti, F.; Naccarato, A.; Sindona, G.; Tagarelli, A.; Taverna, D. Authenticity of PGI “Clementine of Calabria” by Multielement Fingerprint. J. Agric. Food Chem. 2012, 60, 3717–3726. [Google Scholar] [CrossRef] [PubMed]
- Consorzio per la Tutela Delle IGP Clementine di Calabria. Available online: http://www.igpclementinedicalabria.it/ (accessed on 17 October 2019).
- Confederazione Nazionale Coldiretti. Available online: https://www.coldiretti.it (accessed on 17 October 2019).
- Canakci, M.; Topakci, M.; Akinci, I.; Ozmerzi, A. Energy use pattern of some field crops and vegetable production: Case study for Antalya Region, Turkey. Energy Convers. Manag. 2005, 46, 655–666. [Google Scholar] [CrossRef]
- Ozkan, B.; Akcaoz, H.; Karadeniz, F. Energy requirement and economic analysis of citrus production in Turkey. Energy Convers. Manag. 2004, 45, 1821–1830. [Google Scholar] [CrossRef]
- Namdari, M.; Kangarshahi, A.A.; Amiri, N.A. Input-output energy analysis of citrus production in Mazandaran province of Iran. Afr. J. Agric. Res. 2011, 6, 2558–2564. [Google Scholar]
- Franco Junior, N.C.; Milan, M.; Romanelli, T.L. Energy demand in citrus production under varied operational efficiency values. Engenharia Agrícola 2014, 34, 746–754. [Google Scholar] [CrossRef]
- Qasemi-Kordkheili, P.; Amin Asoodar, M.; Kazemi, N. Application of a non-parametric method to analyze energy consumption for orange production. Agric. Eng. Int. CIGR J. 2014, 16, 157–166. [Google Scholar]
- Pergola, M.; D’Amico, M.; Celano, G.; Palese, A.M.; Scuderi, A.; Di Vita, G.; Inglese, P. Sustainability evaluation of Sicily’s lemon and orange production: an energy, economic and environmental analysis. J. Environ. Manag. 2013, 128, 674–682. [Google Scholar] [CrossRef]
- Beccali, M.; Cellura, M.; Iudicello, M.; Mistretta, M. Resource consumption and environmental impacts of the agrofood sector: life cycle assessment of italian citrus-based products. Environ. Manag. 2009, 43, 707–724. [Google Scholar] [CrossRef]
- Cabeza, L.F.; Rincón, L.; Vilariño, V.; Pérez, G.; Castell, A. Life cycle assessment (LCA) and life cycle energy analysis (LCEA) of buildings and the building sector: A review. Renew. Sustain. Energy Rev. 2014, 29, 394–416. [Google Scholar] [CrossRef]
- Chau, C.K.; Leung, T.M.; Ng, W.Y. A review on Life Cycle Assessment, Life Cycle Energy Assessment and Life Cycle Carbon Emissions Assessment on buildings. Appl. Energy 2015, 143, 395–413. [Google Scholar] [CrossRef]
- Ntinas, G.K.; Neumair, M.; Tsadilas, C.D.; Meyer, J. Carbon footprint and cumulative energy demand of greenhouse and open-field tomato cultivation systems under Southern and Central European climatic conditions. J. Clean. Prod. 2017, 142, 3617–3626. [Google Scholar] [CrossRef]
- Notarnicola, B.; Tassielli, G.; Renzulli, P.A.; Monforti, F. Energy flows and greenhouses gases of EU (European Union) national breads using an LCA (Life Cycle Assessment) approach. J. Clean. Prod. 2017, 140, 455–469. [Google Scholar] [CrossRef]
- Pires Gaspar, J.; Dinis Gaspar, P.; Dinho da Silva, P.; Simões, M.P.; Santo, C.E. Energy Life-Cycle Assessment of Fruit Products—Case Study of Beira Interior’s Peach (Portugal). Sustainability 2018, 10, 3530. [Google Scholar] [CrossRef]
- Council Regulation (EC). No 834/2007 of 28 June 2007 on organic production and labelling of organic products and repealing Regulation (EEC) No 2092/91. 2007. Off. J. Eur. Union 2007, 189, 1–23. [Google Scholar]
- Di Vita, G.; Stillitano, T.; Falcone, G.; De Luca, A.I.; D’Amico, M.; Strano, A.; Gulisano, G. Can sustainability match quality citrus fruit growing production? An energy and economic balance of agricultural management models for ‘PGI clementine of Calabria’. Agron. Res. 2018, 16, 1986–2004. [Google Scholar] [CrossRef]
- ARPACAL. Centro Funzionale Multirischi. Stazioni di Monitoraggio. Available online: http://www.cfd.calabria.it/index.php?option=com_wrapper&view=wrapper&Itemid=27 (accessed on 28 November 2019).
- ISO. ISO 14040:2006 Environment Management-Life Cycle Assessment-Principles and Framework; International Organization for Standardization (ISO): Geneva, Switzerland, 2006. [Google Scholar]
- Ribal, J.; Ramírez-Sanz, C.; Estruch, V.; Clemente, G.; Sanjuán, N. Organic versus conventional citrus. Impact assessment and variability analysis in the Comunitat Valenciana (Spain). Int. J. Life Cycle Assess. 2017, 22, 571–586. [Google Scholar] [CrossRef]
- UNEP/SETAC. Global Guidance Principles for Life Cycle Assessment Databases A Basis for Greener Processes and Products; UNEP/SETAC: Paris, France, 2011. [Google Scholar]
- Weidema, B.P.; Bauer, C.; Hischier, R.; Mutel, C.; Nemecek, T.; Reinhard, J.; Vadenbo, C.O.; Wernet, G. Overview and Methodology. Data Quality Guideline for the Ecoinvent Database Version 3; Ecoinvent Report 1(v3); The Ecoinvent Centre: St. Gallen, Switerland, 2013. [Google Scholar]
- Nemecek, T.; Kägi, T. Life Cycle Inventories of Swiss and European Agricultural Production Systems; Final Report Ecoinvent V2.0 No. 15a; Agroscope Reckenholz-Taenikon Research Station ART, Swiss Centre of Life Cycle Inventories: Zurich and Dübendorf, Switerland, 2007. [Google Scholar]
- Brentrup, F.; Küsters, J.; Lammel, J.; Kuhlmann, H. Methods to estimate on-field nitrogen emission from crop production as an input to LCA studies in the agricultural sector. Int. J. Life Cycle Assess. 2000, 5, 349–357. [Google Scholar] [CrossRef]
- Margni, M.; Rossier, D.; Crettaz, P.; Jolliet, O. Life cycle impact assessment of pesticides on human health and ecosystems. Agric. Ecosyst. Environ. 2002, 93, 379–392. [Google Scholar] [CrossRef]
- Bacenetti, J.; Fusi, A. The environmental burdens of maize silage production: Influence of different ensiling techniques. Animal Feed Sci. Technol. 2015, 204, 88–98. [Google Scholar] [CrossRef]
- Bacenetti, J.; Cavaliere, A.; Falcone, G.; Giovenzana, V.; Banterle, A.; Guidetti, R. Shelf life extension as solution for environmental impact mitigation: A case study for bakery products. Sci. Total Environ. 2018, 627, 997–1007. [Google Scholar] [CrossRef]
- Mourad, A.L.; Coltro, L.; Oliveira, P.A.P.L.V.; Kletecke, R.M.; Baddini, J.P.O.A. A Simple Methodology for Elaborating the Life Cycle Inventory of Agricultural Products. Int. J. Life Cycle Assess 2007, 12, 408–413. [Google Scholar] [CrossRef]
- PRè-Product Ecology Consultants. SimaPro Database Manual-Methods Library v2.9; PRè: Amersfoort, The Netherlands, 2016. [Google Scholar]
- Huijbregts, M.A.J.; Hellweg, S.; Frischknecht, R.; Hendriks, H.W.M.; Hungerbühler, K.; Hendrik, A.J. Cumulative Energy Demand As Predictor for the Environmental Burden of Commodity Production. Environ. Sci. Technol. 2010, 44, 2189–2196. [Google Scholar] [CrossRef]
- Sartori, L.; Basso, B.; Bertocco, M.; Oliviero, G. Energy use and economic evaluation of a three year crop rotation for conservation and organic farming in NE Italy. Biosyst. Eng. 2005, 91, 245–256. [Google Scholar] [CrossRef]
- Mohammadi, A.; Tabatabaeefar, A.; Shahin, S.; Rafiee, S.; Keyhani, A. Energy use and economical analysis of potato production in Iran a case study: Ardabil province. Energy Convers. Manag. 2008, 49, 3566–3570. [Google Scholar] [CrossRef]
- Unakitan, G.; Hurma, H.; Yilmaz, F. An analysis of energy use efficiency of canola production in Turkey. Energy 2010, 35, 3623–3627. [Google Scholar] [CrossRef]
- Zangeneh, M.; Omid, M.; Akram, A. A comparative study on energy use and cost analysis of potato production under different farming technologies in Hamadan province of Iran. Energy 2010, 35, 2927–2933. [Google Scholar] [CrossRef]
- Vastola, A.; Zdruli, P.; D’Amico, M.; Pappalardo, G.; Viccaro, M.; Di Napoli, F.; Cozzi, M.; Romano, S. A comparative multidimensional evaluation of conservation agriculture systems: A case study from a Mediterranean area of Southern Italy. Land Use Policy 2017, 68, 326–333. [Google Scholar] [CrossRef]
- Stillitano, T.; De Luca, A.I.; Iofrida, N.; Falcone, G.; Spada, E.; Gulisano, G. Economic analysis of olive oil production systems in southern Italy. Qual. Access Success 2017, 18, 107–112. [Google Scholar]
- Hemmati, A.; Tabatabaeefar, A.; Rajabipour, A. Comparison of energy flow and economic performance between flat land and sloping land olive orchards. Energy 2013, 61, 472–478. [Google Scholar] [CrossRef]
- Pérez-Pérez, J.G.; García, J.; Robles, J.M.; Botía, P. Economic analysis of navel orange cv. ‘Lane late’ grown on two different drought-tolerant rootstocks under deficit irrigation in South-eastern Spain. Agric. Water Manag. 2010, 97, 157–164. [Google Scholar]
- Sgroi, F.; Foderà, M.; Di Trapani, A.M.; Tudisca, S.; Testa, R. Cost-benefit analysis: A comparison between conventional and organic olive growing in the Mediterranean Area. Ecol. Eng. 2015, 82, 542–546. [Google Scholar] [CrossRef]
- Rahman, S.; Barmon, B.K. Total factor energy productivity and efficiency changes of the GHER (prawn-carp-rice) farming system in Bangladesh: A stochastic input distance function approach. Energies 2018, 11, 3482. [Google Scholar] [CrossRef]
- Di Vita, G.; Pilato, M.; Pecorino, B.; Brun, F.; D’Amico, M. A review of the role of vegetal ecosystems in CO2 capture. Sustainability 2017, 9, 1840. [Google Scholar] [CrossRef]
- Padel, S.; Lampkin, N. (Eds.) The Economics of Organic Farming: An International Perspective; CAB International: Oxon, UK, 1994; pp. 201–222. [Google Scholar]
- Chinnici, G.; Pecorino, B.; Scuderi, A. Environmental and economic performance of organic citrus growing. Qual. Access Success 2013, 14, 106–112. [Google Scholar]
- Patil, S.; Reidsma, P.; Shah, P.; Purushothaman, S.; Wolf, J. Comparing conventional and organic agriculture in Karnataka, India: and when can organic farming be sustainable? Land Use Policy 2014, 37, 40–51. [Google Scholar] [CrossRef]
- Gündoğmuş, E. Energy use on organic farming: A comparative analysis on organic versus conventional apricot production on small holdings in Turkey. Energy Convers. Manag. 2006, 47, 3351–3359. [Google Scholar] [CrossRef]
- Falcone, G.; Strano, A.; Stillitano, T.; De Luca, A.I.; Iofrida, N.; Gulisano, G. Integrated Sustainability Appraisal of Wine-growing Management Systems through LCA and LCC Methodologies. Chem. Eng. Trans. 2015, 44, 223–228. [Google Scholar] [CrossRef]
- Frischknecht, R.; Wyss, F.; Büsser Knöpfel, S.; Lützkendorf, T.; Balouktsi, M. Cumulative energy demand in LCA: the energy harvested approach. Int. J. Life Cycle Assess 2015, 20, 957–969. [Google Scholar] [CrossRef]


© 2020 by the authors. Licensee MDPI, Basel, Switzerland. This article is an open access article distributed under the terms and conditions of the Creative Commons Attribution (CC BY) license (http://creativecommons.org/licenses/by/4.0/).