Abstract
This paper aims at the optimal designing of a stand-alone microgrid (PV/wind/battery/diesel) system, which can be utilized to meet the demand load requirements of a small residential area in Kasuga City, Fukuoka. The simulation part is developed to estimate the electrical power generated by each component, taking into account the variation of the weather parameters, such as wind, solar irradiation, and ambient temperature. The optimal system design is then based on the Particle Swarm Optimization (PSO) method to find the optimal configuration of the proposed system, using the least-cost perspective approach.
1. Introduction
Japan’s energy self-sufficiency rate was as low as 9.6% in 2017, indicating the energy security issues in this country [1]. The energy self-sufficiency rate indicates the proportion of primary energy required for daily life and economic activities that can be secured in the country [2]. Japan’s electric power industry faces a wide range of challenges, including the reliance on imports of fossil fuels through the immediate nuclear power phase-out and also further focusing on reducing and decarbonizing its energy system [3,4]. Initiatives are underway to decentralize the power sector in Japan from the centralized fossil fuel-based systems to distributed ones. The evolution of the electric utility system has many drawbacks because it is vulnerable to disasters due to extreme concentration. One way to avoid this problem is to use Distributed Energy Resources (DER), which enables the decentralization of the electric power sector in Japan. The deployment of DER involves both generators and energy storage technologies. A microgrid is a combination of various interconnected DER and loads that can operate as a grid-tied (connected to the grid) or a stand-alone (disconnected from the grid) controllable system. The stand-alone microgrids are considered as the most appropriate and cost-effective ways to electrify off-grid communities. Since the stand-alone microgrids operate as the off-grid systems, matching the quantity of the supplied electricity with the load requirements is an important issue, particularly when they are used for providing reliable power in small communities or remote areas. However, the integration and hybridization of various energy sources into the microgrid system increases the complexity of the system.
Although microgrids have several advantages, including reduced maintenance costs, emissions, and increased reliability and flexibility, their initial investment costs are higher than the other conventional power systems. Therefore, finding the optimal size and configuration of a microgrid in a cost-effective way has been the main focal point of recent research activities in this field of study.
Research that demonstrates the importance of optimizing microgrid systems with hybrid power supplies has gained more attention from scholars worldwide. Many scholars have developed optimization techniques to find the optimal operating point and configurations of microgrid systems. The main methods include minimizing the total cost and emissions or maximizing the reliability of the system. Table 1 shows the different optimization methods used in microgrid modeling based on the various approaches.

Table 1.
Optimization methods used in microgrid modeling.
Following previous studies, this paper addresses a detailed modeling approach that is used to find the optimal configuration of a typical stand-alone microgrid system consisting of solar panels, wind turbines, battery storage and diesel generators, in order to satisfy the demand load of a residential area in Kasuga city in Japan (Figure 1). The proposed research methodology is based on a cost-effectiveness approach, which aims at finding the optimal configuration of the microgrid together with addressing the uncertainties related to the impact of variable weather conditions on the overall performance of the system and its optimal operation. The analytical framework consists of simulation and optimization models. The simulation model is based on developing a detailed power control strategy that is used to match the supplied electricity with the hourly demand load requirements in the different operating conditions. The optimization model uses the Particle Swarm Optimization (PSO) method to find the optimal configuration (optimal capacity of each DER) of the microgrid. The optimality criterion is satisfied at the minimum total cost of the system.
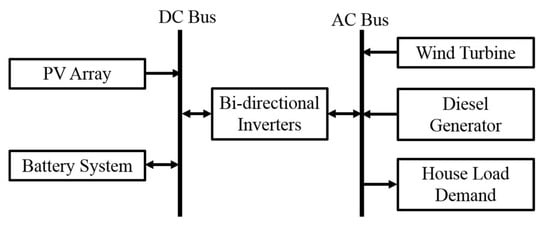
Figure 1.
The proposed microgrid system in this study.
2. Simulation Model
2.1. Wind Turbine
In this simulation model, the following equations are used to quantify the amount of power output from a wind turbine [21]:
where (m/s) refers to the measured wind speed at the reference height, ; α is the power-law exponent; refers to the wind speed at the height of [21]; and , , and refer to the constant power (kW), cut-in speed (m/s), rated wind speed (m/s), and cutout speed (m/s), respectively.
2.2. Solar Photovoltaic (PV)
The Duffie and Beckman principle model was used to calculate the global radiation incident on the PV array, using the following equation [22]:
where τα is the effective transmittance-absorptance of the PV panel (%); GT is the incident solar radiation on the PV surface (kW/m2); ηc is the conversion efficiency of the PV array (%); is the overall heat transfer coefficient of the PV (kW/m2 °C); and and are the PV cell temperature (°C) and the ambient temperature (°C). The equation above states that a balance exists between the solar energy absorbed by the PV array and the amount of electrical output and heat which is transferred to the surroundings. The following formula gives the cell temperature:
Assuming that τα/UL is constant, this equation is substituted into the Equation (3) to calculate Tc:
Finally, the output of the PV array is calculated by the following equation:
where in the above equations, and NOCT refer to the standard test and nominal operating cell temperature conditions, respectively; is the rated capacity of the PV panel (kW); is the PV derating factor (%); and is the temperature coefficient of power (%/°C).
2.3. Diesel Generator
The diesel generator will be used as the backup system in the proposed microgrid. The rate of the fuel consumption of a diesel generator may be estimated by using the following formula [23]:
where is the rate of fuel consumption (L/h); DR is the rated power of the diesel generator (kW); DO is the power output of the diesel generator (kW); AN and BO are the coefficients that are set at 0.2461 (L/kWh) and 0.081451 (L/kWh) [18]; and t is the time period in hours.
2.4. Power Converter
The proposed system utilizes a bi-directional converter to link the AC and DC buses to each other. The amount of the converted power by the converter is calculated by the following equation:
where and are the input and output power from the inverter (kW), respectively; and ηconv is the converter efficiency, which is assumed to be 90%.
2.5. Battery Storage
In this study, a lead–acid battery is considered as the storage system in the proposed microgrid. The state of charge (SOC) of a lead–acid battery system should be controlled within the following range [24]:
where ηB is discharge and charging (round trip) efficiency (%); is the amount of electricity that is charged to or discharged from the battery (kWh); and refers to the rated capacity of the battery(kWh).
2.6. Power Control Strategy
The control strategy flowchart of electricity generation and storage in the proposed microgrid system is represented in Figure 2. If the amount of electricity generated by the renewable generators (PV and wind turbine) exceeds the load requirement, the surplus energy is sent to the battery. If the SOC of the battery reached its maximum level and there is still excess electricity, the extra electricity will be sent to a dummy load. If the amount of generated electricity is less than the load requirement, then the battery storage can be discharged to meet the demand. If the battery discharge was insufficient, a diesel generator would be added to the system as a backup.
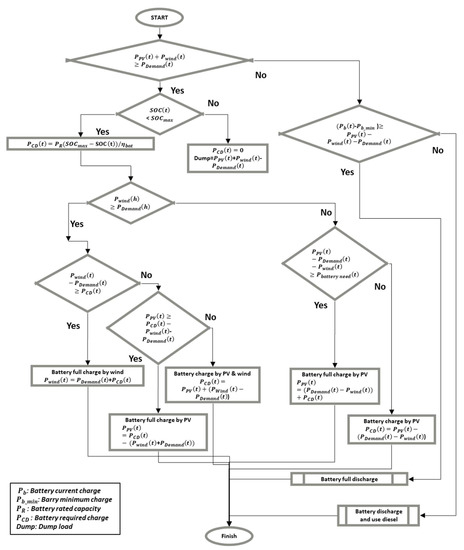
Figure 2.
Power control strategy flowchart.
2.7. Demand Load Calculation
The area of study was selected among the Japanese standard residential buildings located in Kasuga city, Fukuoka prefecture, Japan. The total energy consumption (electrical and thermal loads) of the selected building was estimated using EnergyPlus software developed by the National Renewable Energy Laboratory (NREL), Denver, CO, USA [25]. The 3D model of the targeted Japanese standard house was developed using Sketchup 2019, which is shown in Figure 3. This 3D model includes all walls, ceilings, floors, doors, and windows. A standard size family, including four inhabitants, such as a father, a mother, a son, and a daughter, is supposed to live in the targeted building. An activity schedule was set for each person who should be taken into account, in order to calculate each person’s internal heat gain. The occupancy schedule of each family member in this building is shown in Figure 4.
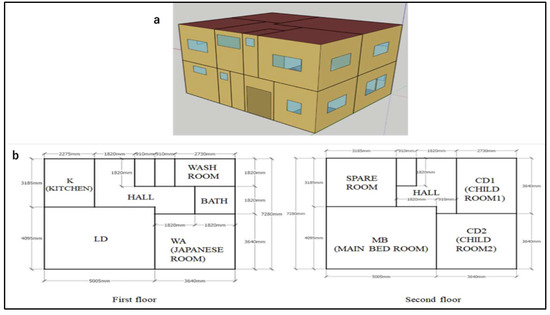
Figure 3.
Layouts of the selected building: (a) 3D layout; (b) 2D Layout.
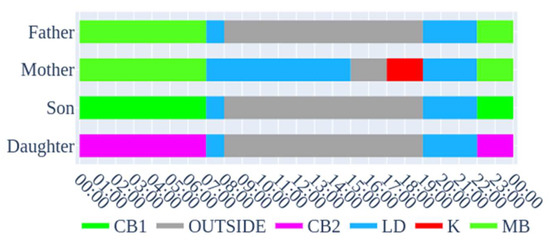
Figure 4.
Occupancy schedule of family members in the selected building.
To meet this schedule, the usage plan of the electrical appliances, lightings, cooling, and heating loads are given in Figure 5, Figure 6, Figure 7 and Figure 8. The internal heat generated from electrical equipment and lighting was not included in the simulation. The variable refrigerant flow (VRF) air conditioning system was considered to provide cooling and heating loads. The values of the cooling and heating Coefficient of Performance (COP) for this air conditioning system was set at 3.4 and 3.3, respectively. The Heating, Ventilation, and Air Conditioning (HVAC) operation strategy is based on the heating and cooling schedule in each room. When the HVAC is ON, cooling occurs when the temperature is higher than the cooling setpoint temperature (26 °C), and heating is performed when the temperature is lower than the heating setpoint (18 °C).
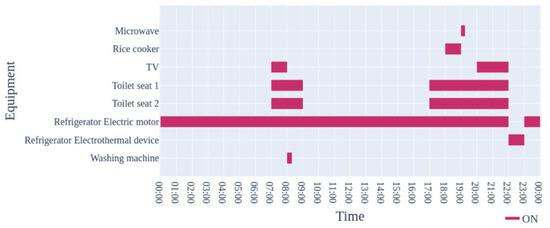
Figure 5.
Appliances usage plan.
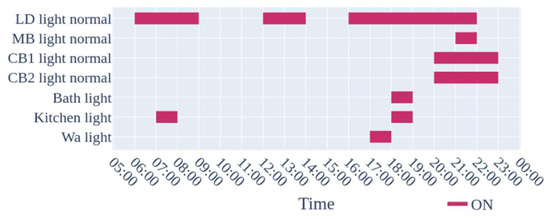
Figure 6.
Lighting usage plan.
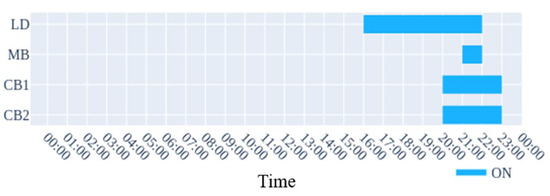
Figure 7.
Cooling load usage plan (hot seasons).
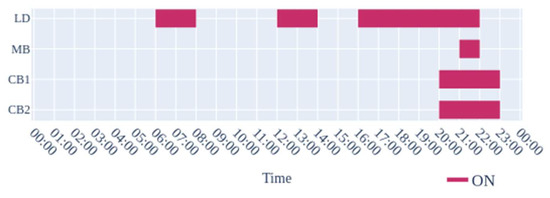
Figure 8.
Heating load usage plan (cold seasons).
The assumed hourly electricity consumption by the electrical appliances and lighting is represented in Figure 9 and Figure 10.
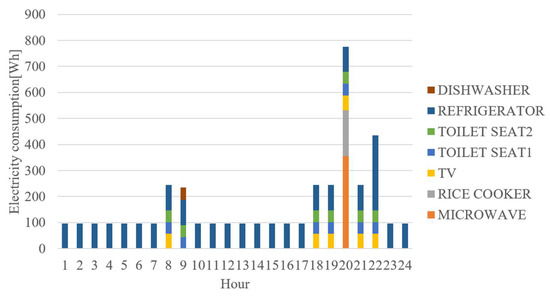
Figure 9.
Hourly electricity consumption of the electrical appliances.
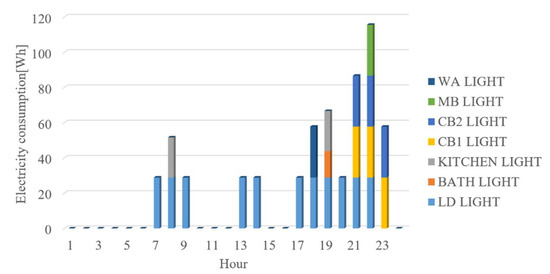
Figure 10.
Hourly electricity consumption of lighting.
3. Weather Data
Weather data was used in this research for the following two purposes:
1) Optimal design of the system: The optimal configuration of the system can be found based on the amount of hourly electricity generation from solar and wind power systems. To this aim, the real measured meteorological data on solar irradiation, wind speed, and ambient temperature in Fukuoka were collected from the Japan Meteorological Agency (JMA) throughout the entire period in 2019, which are shown in Figure 11, Figure 12 and Figure 13 [26].
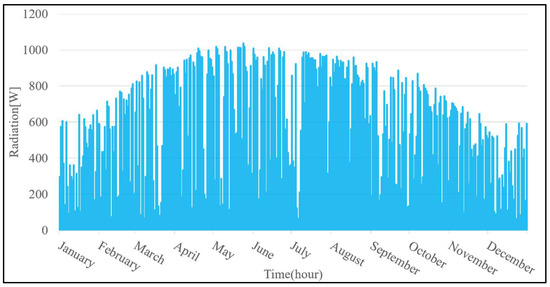
Figure 11.
Hourly solar irradiation in Fukuoka (Source: JMA).
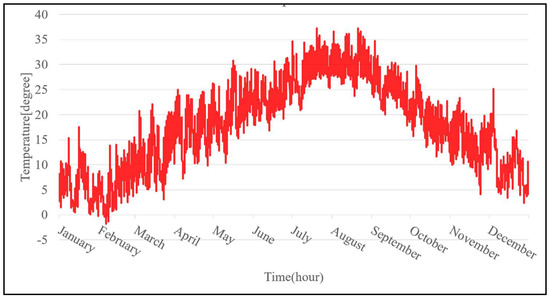
Figure 12.
Hourly ambient temperature in Fukuoka (Source: JMA).
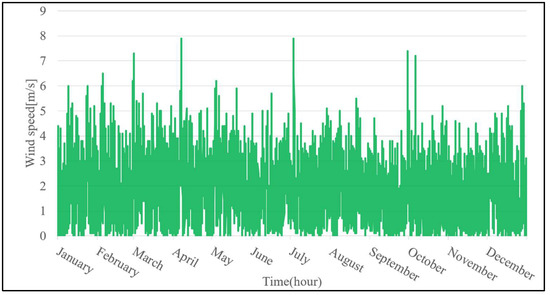
Figure 13.
Hourly wind speed in Fukuoka (Source: JMA).
2) Optimal day-ahead operation: In order to be able to understand the uncertainties related to the impact of variable weather conditions on the day-ahead optimal operation and electric power dispatching of the proposed system, the GPV–MSM weather forecast provided by JMA was used in this study. The GPV–MSM weather forecasting system reproduces atmospheric phenomena using the mesoscale modeling approach, which can be applied to the selected areas in Japan and its neighboring seas, including a horizontal grid of 5 km. Hourly forecasts of seven weather-related variables are provided eight times a day (00:00, 03:00, 06:00, 09:00, 12:00, 15:00, 18: 00, and 21:00; UTC time zone). The forecast period depends on the forecast time and can be up to 39 hours or 51 hours ahead. In this research, we used the first 24 hours of forecast weather data ahead, updated at UTC 00:00 hours (JST 9:00). Temperature and wind speed are the actual meteorological data that were collected from JMA [27]. The comparison between real and forecasting meteorological data used in this study is shown in Figure 14.
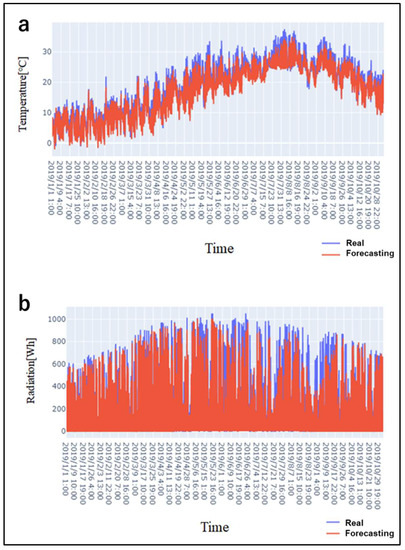
Figure 14.
Comparison between the real and forecasting meteorological data used in this study: (a) Temperature; (b) Solar radaition.
4. Optimization Model
4.1. Objective Function
The optimal sizing of the power generation units in a microgrid system is essential for the efficient utilization of renewable resources. To this aim, the optimization technique was mainly founded on the basis of the minimization of the total cost of the system, subject to satisfying the technical, economic, and environmental constraints. The objective function of the optimization model can be expressed as follows:
where TC is the total cost of the microgrid system over its lifetime ($); Ct, Ot and Ft are investment expenditures, operation costs, and fuel costs in the year t, respectively; and r is the discount rate. The total lifetime of the system, n, is considered to be 20 years.
4.2. Demand–Supply Constraint
The main objective of the model is to find the optimal value of the vector of the decision variables which includes the installed capacities of the PV, wind power generator, battery and diesel generator subject to satisfying the following demand–supply equality:
The above concept was applied to the different dispatching modes, which is visualized in Figure 15.
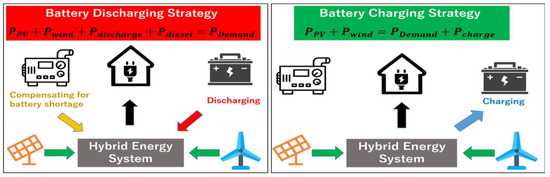
Figure 15.
Demand–supply matching based on the battery charging/discharging modes.
4.3. Solving Method
In this research, the Particle Swarm Optimization algorithm was used to find the least expensive combination of the decision variables. This method consists of a constant search of the best solution by moving the particles at a specific speed calculated in each iteration, which is represented as follows [28]:
where and vid(t) represent the particle’s best candidate position and the velocity of inertia, respectively; is the particle position; and u is the coefficient of inertia. The parameters c1 and c2 are positive weighting constants, described as “self-confidence” and “swarm confidence”, respectively. The random values of φ1 and φ2 are between 0 and 1. ω indicates the inertia weight, which is set in the range (0.5, 1), and near 1 facilitates the global search. The first iteration ends by adjusting the speed and position of the next time step t + 1. Consistently, this process is performed until the best value of the objective function. In this paper, for all variants, fixed values considered as defaults for the PSO parameters were used as c1 = c2 = 1.5, ω = 0.8, iterations = 100, population size = 20 [29,30]. To relocate the wrong particles in the adequate solution space and evaluate the fitness function, as well as provide a valid solution to the optimization problem, the attenuation technique was used to represent the boundary condition of the proposed PSO model, as shown in Figure 16 [30].
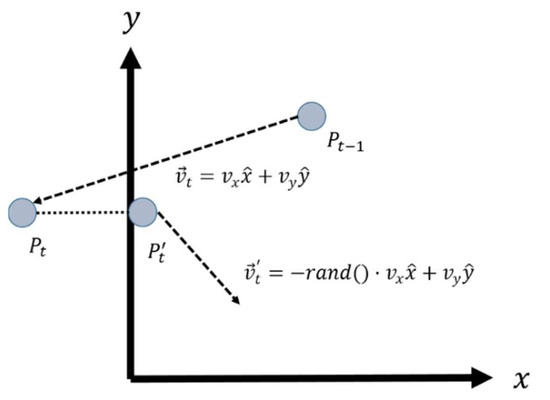
Figure 16.
Boundary conditions for the Particle Swarm Optimization (PSO) developed in this research.
Figure 17 shows the interrelationship between the optimization and simulation models. The global solution of the PSO model, the best place that every individual in the flock has ever achieved, is adopted for all particles.
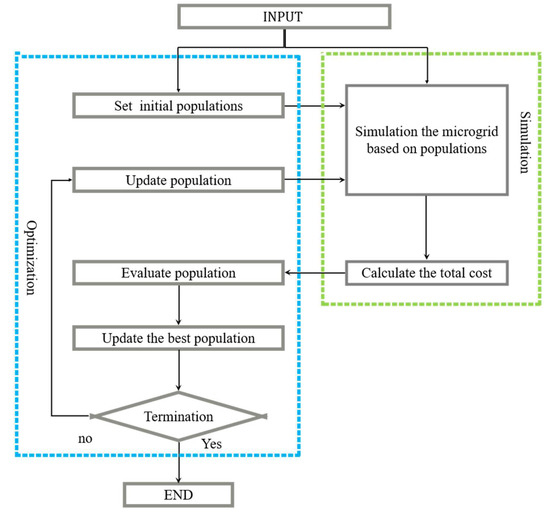
Figure 17.
The interrelationship between the simulation and optimization models.
5. Results and Discussion
5.1. Estimation of the Annual Electricity Demand
EnergyPlus software was used to perform a load simulation by computing an hourly energy balance in the building. The amount of required electricity for providing necessary cooling/heating loads to maintain the building at the desired temperature was estimated based on the given scheduled plan of cooling/heating and the difference between the outdoor and indoor temperatures. The total electricity consumption for cooling and heating purposes in the selected residential building in Kasuga city was estimated at 600 kWh/year. This estimated value was summed up with the total electricity consumption by electrical appliances, considering their usage plans and rated power to calculate the total electricity consumption in the building. Figure 18 shows the hourly electricity demand load. The total electricity consumption in this building was estimated at 2303 kWh/year. The annual electricity consumption in the selected residential building is represented in Figure 18.
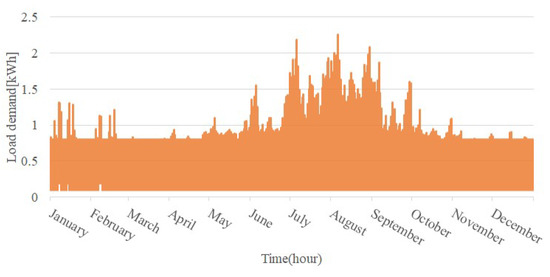
Figure 18.
Estimated annual electricity demand in the selected residential building in Kasuga city.
According to the Japan Agency for National Resource and Energy, the average annual electricity consumption per household in Japan is approximated at 4618 kWh, and the electricity demand of the main electrical appliances accounts for 57% of the total, which is about 2632 kWh [31]. The comparison between this value and the estimated value of total electricity consumption indicates the good agreement between the results of the simulation model and the standard data.
5.2. Optimal Design of the Proposed Microgrid
The technical specifications of the main components of the microgrid system are given in Table 2, Table 3 and Table 4. The hourly power output per unit of wind generator and the solar panel is shown in Figure 19.
Table 2.
Main input data used in the solar panel simulation [32].
Table 3.
Main input data used in the battery storage simulation [24].
Table 4.
Maim input data used in the wind turbine simulation [33].
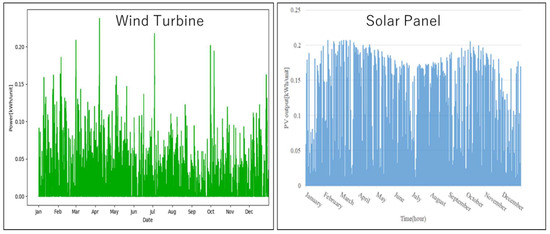
Figure 19.
Estimated power output per each unit of PV panel and wind turbine.
Table 5 shows the cost analysis of the proposed system. The optimal size of each component is given in Table 6. Figure 20 demonstrates the pathways towards reaching the optimal solution by each element (particle in the PSO model) based on satisfying the minimum total cost of the system. The total cost of the proposed microgrid is estimated at USD 42,300.
Table 5.
Cost analysis of the system.
Table 6.
Optimal size and cost of each component.
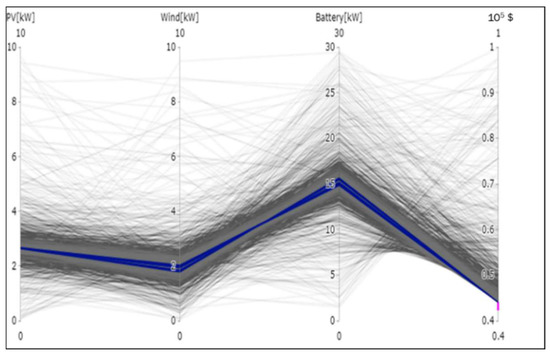
Figure 20.
Pathways towards the optimal solution by the PSO model.
As can be observed from Figure 21, the solar panel represents the largest share in the total cost of the system, followed by the battery storage and diesel generator. The levelized cost of electricity (LCOE) of the proposed microgrid is estimated at 0.88 $/kWh, which is much higher than the average electricity tariff in Japan (0.2 $/kWh 22 JPY/kWh).

Figure 21.
Estimated levelized cost of electricity (LCOE) of the proposed microgrid.
The comparison between the estimated LCOE in this study and other similar off-grid residential microgrids is given in Table 7.
Table 7.
Comparison between the estimated LCOE by the model and other references.
The average monthly electricity generation by the system is shown in Figure 22. The battery SOC is represented in Figure 23.
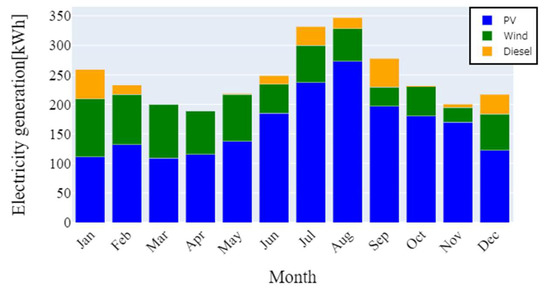
Figure 22.
Monthly average electricity generation by the microgrid.
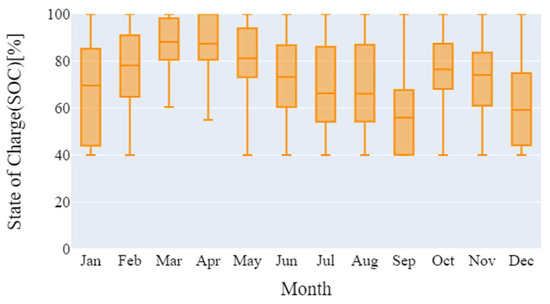
Figure 23.
State of charge (SOC) of the battery in the microgrid.
The model results revealed that the power loss due to the charging and discharging efficiency of the battery is considerable, which is estimated at 719 kWh per year, which indicates that improving the round-trip efficiency of the battery is necessary for the effective utilization of the proposed microgrid system (Figure 24).
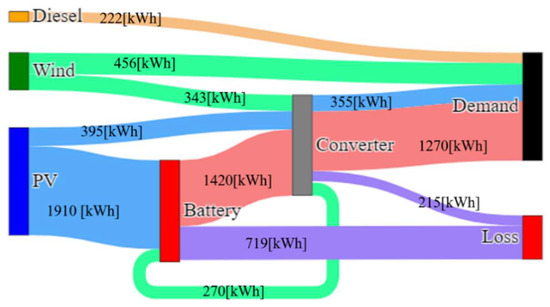
Figure 24.
Annual energy balance in the proposed microgrid.
5.3. Assessing the Impact of Weather Conditions on the Optimal Performance and Power Dispatching of the Proposed System
The microgrid’s fuel consumption and energy storage requirements are examined as a function of the atmospheric conditions. Weather data is thus necessary to establish optimal operating and dispatching plans according to the operational objective of the microgrid. Day-ahead weather forecasts are also responsible for deviations from these plans, thereby being a valuable source of uncertainty in the scheduling process. Figure 25 represents the weather satellite images taken by the satellite Himawari-8 at 12:00 on 3 July 2018 (real data) and 2019 (forecasts). On 3 July 2018, Typhoon No. 7 went north over the East China Sea and approached Kyushu, and strong winds and heavy rain took Fukuoka. Therefore, there was insufficient solar electricity generation, but since the strong wind blew in the afternoon, a sufficient amount of electricity was generated by the wind power generator. However, on the same day in 2019, Fukuoka was covered with heavy clouds, and the average wind speed was very weak at 2–3 (m/s). Therefore, there was no power generation from the wind turbine on this day. Besides, since the sky had been covered with dark clouds for a long time, there was no sufficient power output from the PV panels, which resulted in reducing the SOC of the battery.
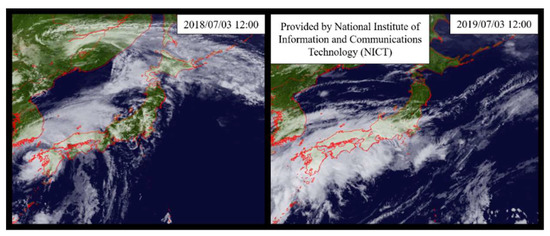
Figure 25.
Comparison of satellite images taken on 2018/07/03 at 12:00 and on 2019/07/03 at 12:00.
As shown in Figure 26, the diesel generator was used to offset the shortage of battery discharge. The comparison between the historical (2018) and forecasting data (2019) highlights the remarkable impact of weather conditions on both fuel consumption and energy storage requirement of the proposed microgrid. Based on the forecasting data, the stationary battery storage’s SOC decreases to 40%, since it cannot be charged by solar and wind in the morning. Therefore, the diesel generator should be used in order to meet the demand load during the evening. It highlights that forecasts of weather conditions at the site location would be required to know in advance the amount of power that the wind turbine or the PV will feed into the battery over the next hours and days. Day-ahead forecasting of the weather data will help in managing the battery operation through monitoring its SOC condition and lowering the usage of the diesel generator to reduce its cost and environmental impacts on the system.
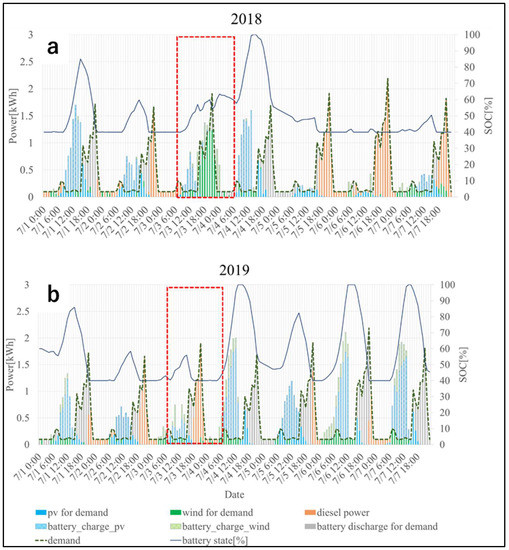
Figure 26.
Optimal operation of the microgrid within the same period in 2018 and 2019: (a) based on the measured weather data; (b) based on the weather forecast.
6. Conclusions
This research addressed the optimal design of a stand-alone microgrid system that can be used in order to meet the electrical load requirement in a selected Japanese standard building in Kasuga city, Fukuoka prefecture, Japan. Based on the results, the optimal size of the main components of the system was estimated for the PV as 2.65 kW; for wind power as 2.01 kW; for the battery as 14.86 kW; for the diesel generator as 3.6 kW; and for the converter as 2.8 kW. The total cost of the proposed system was estimated at USD 42,300. The LCOE of the proposed system was estimated at 0.88 $/kWh, which is much higher than the average electricity rate in Japan. The percentage of power provided by each power unit was estimated at 43.4% by the solar PV, 16.7% by the wind power, 4.9% by the diesel generator, and 35% by the battery discharge. The model results show that the operation of the proposed microgrid system is highly dependent on batteries and solar power, due to the high potential of solar energy in Kasuga city. Furthermore, the results revealed the remarkable impact of weather conditions on the optimal operation of the proposed microgrid, especially during the windy and rainy seasons. Due to the issue of the high LCOE of the proposed microgrid in this study, the investment demand of the system might be insufficient in the early stages, which makes customers lack the motivation to participate in the project. In order to promote the development of such a system, the corresponding incentive mechanism should be designed through an optimal subsidy from the Japanese government and an optimal cooperation incentive from the energy supplier. Another solution would be the introduction of the community microgrid, including some prosumers and consumers, all with access to a local grid, which allows its participants to achieve a greater outcome than they would individually. In this scheme, participants who generate excess electricity are able to share their generation with participants of their choosing. They are also able to take advantage of shared energy-storage systems in the community to improve the operational reliability and the economy. However, it demands extra efforts regarding a detailed cost analysis of the system, which can be considered as the future work.
Author Contributions
Conceptualization, methodology and investigation: Y.Y., Writing—review, editing and supervising: H.F. Both authors have read and agreed to the published version of the manuscript.
Funding
This research was supported by the Kurata grant of the Hitachi Global Foundation.
Acknowledgments
The author wishes to thank the editor and the reviewers for their contributions on the paper.
Conflicts of Interest
The author declares no conflict of interest.
References
- Agency for Natural Resources and Energy Energy White Paper 2019. Available online: https://www.enecho.meti.go.jp/about/whitepaper/2019html/ (accessed on 14 December 2019).
- Farzaneh, H.; McLellan, B.; Ishihara, K.N. Toward a CO2 zero emissions energy system in the Middle East region. Int. J. Green Energy 2016, 13, 682–694. [Google Scholar] [CrossRef]
- McLellan, B.C.; Zhang, Q.; Utama, N.A.; Farzaneh, H.; Ishihara, K.N. Analysis of Japan’s post-Fukushima energy strategy. Energy Strategy Rev. 2013, 2, 190–198. [Google Scholar] [CrossRef]
- Esteban, M.; Portugal-Pereira, J.; Mclellan, B.C.; Bricker, J.; Farzaneh, H.; Djalilova, N.; Ishihara, K.N.; Takagi, H.; Roeber, V. 100% renewable energy system in Japan: Smoothening and ancillary services. Appl. Energy 2018, 224, 698–707. [Google Scholar] [CrossRef]
- Zhang, W.; Maleki, A.; Rosen, M.A.; Liu, J. Sizing a stand-alone solar-wind-hydrogen energy system using weather forecasting and a hybrid search optimization algorithm. Energy Convers. Manag. 2019, 180, 609–621. [Google Scholar] [CrossRef]
- Farzaneh, H. Design of a Hybrid Renewable Energy System Based on Supercritical Water Gasification of Biomass for Off-Grid Power Supply in Fukushima. Energies 2019, 12, 2708. [Google Scholar] [CrossRef]
- Farzaneh, H. Energy Systems Modeling: Principles and Applications; Springer Nature: Singapore, 2019. [Google Scholar]
- Bukar, A.L.; Tan, C.W.; Lau, K.Y. Optimal sizing of an autonomous photovoltaic/wind/battery/diesel generator microgrid using grasshopper optimization algorithm. Sol. Energy 2019, 188, 685–696. [Google Scholar] [CrossRef]
- Angelopoulos, A.; Ktena, A.; Manasis, C.; Voliotis, S. Impact of a Periodic Power Source on a RES Microgrid. Energies 2019, 12, 1900. [Google Scholar] [CrossRef]
- Jing, R.; Wang, M.; Zhang, Z.; Liu, J.; Liang, H.; Meng, C.; Shah, N.; Li, N.; Zhao, Y.Y.; Lu, Y.; et al. Renewable energy system optimization of low/zero energy buildings using single-objective and multi-objective optimization methods. Energy Build. 2019, 89, 123–139. [Google Scholar] [CrossRef]
- Sharafi, M.; ELMekkawy, T.Y. Multi-objective optimal design of hybrid renewable energy systems using PSO-simulation based approach. Renew. Energy 2014, 68, 67–79. [Google Scholar] [CrossRef]
- Kuznia, L.; Zeng, B.; Centeno, G.; Miao, Z. Stochastic optimization for power system configuration with renewable energy in remote areas. Ann. Oper. Res. 2013, 210, 411–432. [Google Scholar] [CrossRef]
- Khatib, T.; Mohamed, A.; Sopian, K. Optimization of a PV/wind micro-grid for rural housing electrification using a hybrid iterative/genetic algorithm: Case study of Kuala Terengganu, Malaysia. Energy Build. 2012, 47, 321–331. [Google Scholar] [CrossRef]
- Ahmarinezhad, A.; Tehranifard, A.A.; Ehsan, M.; Firuzabad, M.F. Optimal sizing of a stand alone hybrid system for Ardabil area of Iran. IJTPE 2012, 4, 118–125. [Google Scholar]
- Giannakoudis, G.; Papadopoulos, A.I.; Seferlis, P.; Voutetakis, S. Optimum design and operation under uncertainty of power systems using renewable energy sources and hydrogen storage. Int. J. Hydrog. Energy 2010, 35, 872–891. [Google Scholar] [CrossRef]
- Kashefi Kaviani, A.; Riahy, G.H.; Kouhsari, S.M. Optimal design of a reliable hydrogen-based stand-alone wind/PV generating system, considering component outages. Renew. Energy 2009, 34, 2380–2390. [Google Scholar] [CrossRef]
- Cai, Y.P.; Huang, G.H.; Tan, Q.; Yang, Z.F. Planning of community-scale renewable energy management systems in a mixed stochastic and fuzzy environment. Renew. Energy 2009, 34, 1833–1847. [Google Scholar] [CrossRef]
- Dufo-López, R.; Bernal-Agust, J.L.; Contreras, J. Optimization of control strategies for stand-alone renewable energy systems with hydrogen storage. Renew. Energy 2007, 32, 1102–1126. [Google Scholar] [CrossRef]
- Garcia, R.S.; Weisser, D. A wind-diesel system with hydrogen storage: Joint optimisation of design and dispatch. Renew. Energy 2006, 31, 2296–2320. [Google Scholar] [CrossRef]
- Koutroulis, E.; Kolokotsa, D.; Potirakis, A.; Kalaitzakis, K. Methodology for optimal sizing of stand-alone photovoltaic/wind-generator systems using genetic algorithms. Sol. Energy 2006, 80, 1072–1088. [Google Scholar] [CrossRef]
- Hiendro, A.; Kurnianto, R.; Rajagukguk, M.; Simanjuntak, Y.M. Junaidi Techno-economic analysis of photovoltaic/wind hybrid system for onshore/remote area in Indonesia. Energy 2013, 59, 652–657. [Google Scholar] [CrossRef]
- HOMER Pro 3.12 User Manual. Available online: https://www.homerenergy.com/products/pro/docs/ (accessed on 13 December 2019).
- Jamshidi, M.; Askarzadeh, A. Techno-economic analysis and size optimization of an off-grid hybrid photovoltaic, fuel cell and diesel generator system. Sustain. Cities Soc. 2019, 44, 310–320. [Google Scholar] [CrossRef]
- Dhundhara, S.; Verma, Y.P.; Williams, A.; Ehsan, M.; Kuznia, L.; Zeng, B.; Centeno, G.; Miao, Z.; Agüera-Pérez, A.A.; Palomares-Salas, J.C.; et al. Techno-economic analysis of the lithium-ion and lead-acid battery in microgrid systems. Renew. Energy 2017, 145, 304–317. [Google Scholar] [CrossRef]
- Shabunko, V.; Lim, C.M.; Mathew, S. EnergyPlus models for the benchmarking of residential buildings in Brunei Darussalam. Energy Build. 2018, 169, 507–516. [Google Scholar] [CrossRef]
- Japan Meteorological Agency. Available online: https://www.data.jma.go.jp/obd/stats/etrn/view/monthly_s3_en.php?block_no=47401&view=11 (accessed on 14 December 2019).
- Japan Meteorological Agency. Available online: https://www.jma.go.jp/en/week/346.html (accessed on 14 December 2019).
- Parsopoulos, K.; Vrahatis, M. Particle Swarm Optimization Method for Constrained Optimization Problem. In Intelligent Technologies-Theory and Applications: New Trends in Intelligent Technologies; IOS Press (Frontiers in Artificial Intelligence and Applications): Fairfax, VA, USA, 2002; Volume 76, pp. 214–220. [Google Scholar]
- Zhang, W.J.; Xie, X.F.; Bi, D.C. Handling boundary constraints for numerical optimization by particle swarm flying in periodic search space. In Proceedings of the 2004 Congress on Evolutionary Computation, Portland, OR, USA, 19-23 June 2004; Volume 2, pp. 2307–2311. [Google Scholar]
- Xu, S.; Rahmat-Samii, Y. Boundary conditions in particle swarm optimization revisited. IEEE Trans. Antennas Propag. 2007, 55, 760–765. [Google Scholar] [CrossRef]
- Japan Agency for National Resource and Energy. Available online: https://www.enecho.meti.go.jp/index.html (accessed on 14 December 2019).
- Panasonic Panasonic Photovoltaic Module HIT VBHN245SJ25 VBHN240SJ25. Available online: https://panasonic.net/lifesolutions/solar/download/pdf/VBHN245_240SJ25_ol_190226.pdf (accessed on 14 January 2020).
- Intelligent Energy—Europe, Catalogue of European Urban Wind Turbine Manufacturers, (2011) 61. Available online: http://123doc.org/document/1227748-catalogue-of-european-urban-wind-turbine-manufacturers-potx.htm (accessed on 21 March 2020).
- Panasonic, Panasonic Residential Catalog. Available online: https://sumai.panasonic.jp/catalog/solarsystem.html (accessed on 10 December 2018).
- Shibata, Y. How Can “Solar PV + Battery System” Be Economically Competitive and Reliable Power Generation? IEEJ 2017, 1–23. Available online: https://eneken.ieej.or.jp/data/7457.pdf (accessed on 21 March 2020).
- IRENA—International Renewable Energy Agency. Solar photovoltaic Summary Charts. Available online: https://www.irena.org/costs/Charts/Solar-photovoltaic (accessed on 21 March 2020).


© 2020 by the authors. Licensee MDPI, Basel, Switzerland. This article is an open access article distributed under the terms and conditions of the Creative Commons Attribution (CC BY) license (http://creativecommons.org/licenses/by/4.0/).