Article

Combining Radar and Optical Satellite Imagery with Machine Learning to Map Lava Flows at Mount Etna and Fogo Island

1
Istituto Nazionale di Geofisica e Vulcanologia (INGV), Sezione di Catania, Osservatorio Etneo, 95125 Catania, Italy
2
Dipartimento di Ingegneria Elettrica Elettronica e Informatica, University of Catania, 95125 Catania, Italy
*
Author to whom correspondence should be addressed.
Energies 2021, 14(1), 197; https://doi.org/10.3390/en14010197
Submission received: 7 December 2020 / Revised: 29 December 2020 / Accepted: 29 December 2020 / Published: 2 January 2021

Abstract

:
Lava flow mapping has direct relevance to volcanic hazards once an eruption has begun. Satellite remote sensing techniques are increasingly used to map newly erupted lava, thanks to their capability to survey large areas with frequent revisit time and accurate spatial resolution. Visible and infrared satellite data are routinely used to detect the distributions of volcanic deposits and monitor thermal features, even if clouds are a serious obstacle for optical sensors, since they cannot be penetrated by optical radiation. On the other hand, radar satellite data have been playing an important role in surface change detection and image classification, being able to operate in all weather conditions, although their use is hampered by the special imaging geometry, the complicated scattering process, and the presence of speckle noise. Thus, optical and radar data are complementary data sources that can be used to map lava flows effectively, in addition to alleviating cloud obstruction and improving change detection performance. Here, we propose a machine learning approach based on the Google Earth Engine (GEE) platform to analyze simultaneously the images acquired by the synthetic aperture radar (SAR) sensor, on board of Sentinel-1 mission, and by optical and multispectral sensors of Landsat-8 missions and Multi-Spectral Imager (MSI), on board of Sentinel-2 mission. Machine learning classifiers, including K-means algorithm (K-means) and support vector machine (SVM), are used to map lava flows automatically from a combination of optical and SAR images. We describe the operation of this approach by using a retrospective analysis of two recent lava flow-forming eruptions at Mount Etna (Italy) and Fogo Island (Cape Verde). We found that combining both radar and optical imagery improved the accuracy and reliability of lava flow mapping. The results highlight the need to fully exploit the extraordinary potential of complementary satellite sensors to provide time-critical hazard information during volcanic eruptions.

1. Introduction

Lava flows represent a significant natural hazard to communities living at the edge of an active volcano [1]. People, properties, and services can be severely damaged by lava flows. When lava flows through inhabited areas, destruction is usually complete [2]. Timely and accurate measurements of the areal coverage of newly erupted lava are therefore a critical component of volcano monitoring [3]. To date, advancements in satellite remote sensing offer incomparable opportunities for detecting and tracking eruptive activity thanks to the massive amount of data with varying degrees of temporal and spatial resolution provided from a number of sensors operating in the visible, infrared, thermal, and microwave regions of the electromagnetic spectrum [4]. Once an eruption is in progress, the monitoring provided by satellite data allows an extraordinary view of active lava flows and their associated hazards that might not otherwise be possible due to the large size and inaccessibility of the affected areas [5].
The temperature of the fresh lava can vary between 1073 and 1273 K, while cooler active surfaces may reach 673 K [6]. At these temperatures, the main radiant emissions are in the thermal infrared (TIR), middle infrared (MIR), and shortwave infrared (SWIR) regions of the spectrum [7]. A variety of multispectral satellites have sensors capable of measuring these infrared emissions and, as such, are regularly adopted for volcano monitoring from space (Table 1). Operational monitoring centers like the Etna Volcano Observatory (EVO) of the INGV in Catania are nowadays heavily reliant on optical remote sensing to provide detailed documentation of lava flow activity during an ongoing eruption [8]. In particular, near infrared (NIR) bands (1.6–2.2 µm) are generally used to map hot lava flow [9,10,11], while TIR bands (10–11 µm) are used to map cooling lava flow [12]. Visible (VIS) and NIR bands are also used to automatically map the cooling lava flow area exploiting the 10-m bands of the MultiSpectral Instrument (MSI) on board of Sentinel-2 satellite. This task is achieved by applying a machine learning technique based on K-means and the Bayesian Neural Network [13]. An increase in temperature of the crust characterizing active hot lava flows leads color to change from red to yellow, thus being perceivable by VIS bands.
Despite the heavy utilization of optical remote sensing data for the early detection of volcanic thermal features and lava flows mapping, the presence of clouds and the dependence on solar illumination can produce gaps in optical imagery and missing data in optical time series [14]. For classification and monitoring purposes, this drawback considerably influences the performances. Thus, active measurements from synthetic aperture radar (SAR) have also been used to map lava flows, since SAR is not affected by time of day or atmospheric conditions (e.g., [15,16]).
SAR has shown to be a valuable data source for the detection of surface changes that have direct relevance to volcanic hazards [17]. To fully utilize the information content (both amplitude and phase) provided by SAR backscattering signal, detection methods are based either on the evolution of the reflectivity, namely, the amplitude of the radar images, or on variations in the correlation of the signal, which is a measure of the phase change. In particular, the phase-based change detection methods work well for a post-eruption assessment of volcanic deposits [18,19,20], but have some limitations in monitoring and tracking eruption progression, as strong surface changes lead to loss of phase coherence during an ongoing eruption [21]. Instead, the amplitude-based change detection methods have particular strengths in identifying the onset of an eruption, the tracking of eruption progression, and the detection and tracking of depositional features such as new emplacement of surface lava flows [22,23,24]. This approach necessitates that variations in the SAR backscattering signal in areas surrounding the fresh lava flows have to be small. Therefore, the imaging geometry and flight passes of the SAR imagery must be as identical as possible. In addition, the SAR images should be acquired with a very short temporal separation (approximately days) to minimize the reduction in radar coherence due to environmental changes in areas not covered by newly erupted lava. Various change detection techniques in SAR images are used for producing a difference image by subtracting SAR backscattering intensity images acquired before and after the monitored event, thus showing changes in the roughness and the dielectric constant of the surface. As a result, the change image can be classified in “change” and “no change” classes [25]; the most commonly used method to perform this task is the histogram thresholding [26], but defining a threshold is not straightforward and affects the classification results.
Despite the increasing importance gained over the last decade, automatic change detection and classification from SAR images is still a difficult task [25,27,28]. This is mainly due to (i) the high level of speckle noise that typically characterizes SAR images; (ii) the complicated nature of the surface backscatter response in SAR data even for rather homogeneous surfaces; (iii) the differences in imaging geometry (incident angle, orbit path, etc.) between sequential SAR images, as the sensor never acquires successive images from exactly the same position; and (iv) the poor performance of SAR in accurately delineating the boundary of changed regions. Finally, it should not be overlooked that the limitations of adaptive techniques for the selection of change detection thresholds have hampered the development of a fully automatic change detection approach. Thus alternative adaptive approaches based on synergic use of multi-sensor satellite data have been proposed [29].
In the last few years, the complementarity of radar and optical information has fostered the development of multisensory classification procedures that exploit both sources simultaneously [30]. This has led to numerous successes in the integrated use of SAR and multispectral optical sensors for an effective and efficient extraction of volcano-related features [29]. This exceptional combination of pressing challenges and abundant data is leading to the growing use of data-driven approaches, as well as machine learning (ML) models, to face automatic classification problems. Machine learning employs a bottom-up approach where classification algorithms learn relationships between input data and output results as part of the model-building process, so ML can identify patterns and trends buried in large volumes of data that are not evident to human experts [31,32].
Here, we propose a machine learning approach to automatically estimate the area of active lava flows by using the images acquired by the SAR sensor on board of Sentinel-1 mission (from ESA) and by optical and multispectral sensors of Landsat-8 missions (from NASA and USGS) and Multi-Spectral Imager (MSI) on board of Sentinel-2 mission (from ESA). In fact, machine learning provides the possibility for reliable and accurate classification of remotely sensed imagery. The strengths of machine learning include the ability to rapidly process enormous volumes of data and to map classes with very complex characteristics without using explicit instructions, relying instead on trends and patterns. Machine learning algorithms build a mathematical model based on sample data, known as “training data”. As new input data become available, this model can be used to make predictions or decisions without human intervention [33,34].
We design a machine learning classifier for each data source and a machine learning classifier for the whole heterogeneous available datasets. Then, when all the classifier outcomes are retrieved, namely Sentinel-1, Sentinel-2, Landsat-8 and fused classifier, the final outcome will result from the combination of both fused and per-source classifiers. The reason behind that is to strengthen the complementarity as well as the discriminative power of the per-source information. In fact, per-source features need to be discriminative alone, i.e., independently from each other. Moreover, an alternative automatic approach is proposed as a change detection algorithm to deal with SAR intensity images based on an unsupervised K-means algorithm in order to select an opportune threshold.
We have used the machine learning classifiers to map lava flow emplacement during two effusive eruptions occurred at Mount Etna, Italy, in December 2018 and at Fogo Island, Cape Verde, from November 2014 to February 2015. These eruptive events were chosen as case studies because lava flows posed major threats to people and property. Moreover, both eruptions were well documented by satellite measurements that have been extremely useful for monitoring the eruptive activity. The flow maps produced from machine learning classifiers correspond well with the actual lava flow fields of both eruptive events discriminating between pixels belonging to the lava flow and pixels belonging to the background, exploiting all the available satellite data. This algorithm is implemented in the Google Earth Engine (GEE), which is a cloud computing platform for environmental data analysis from local to planetary scales, with fast access and processing of satellite data from different missions [35].

2. Materials

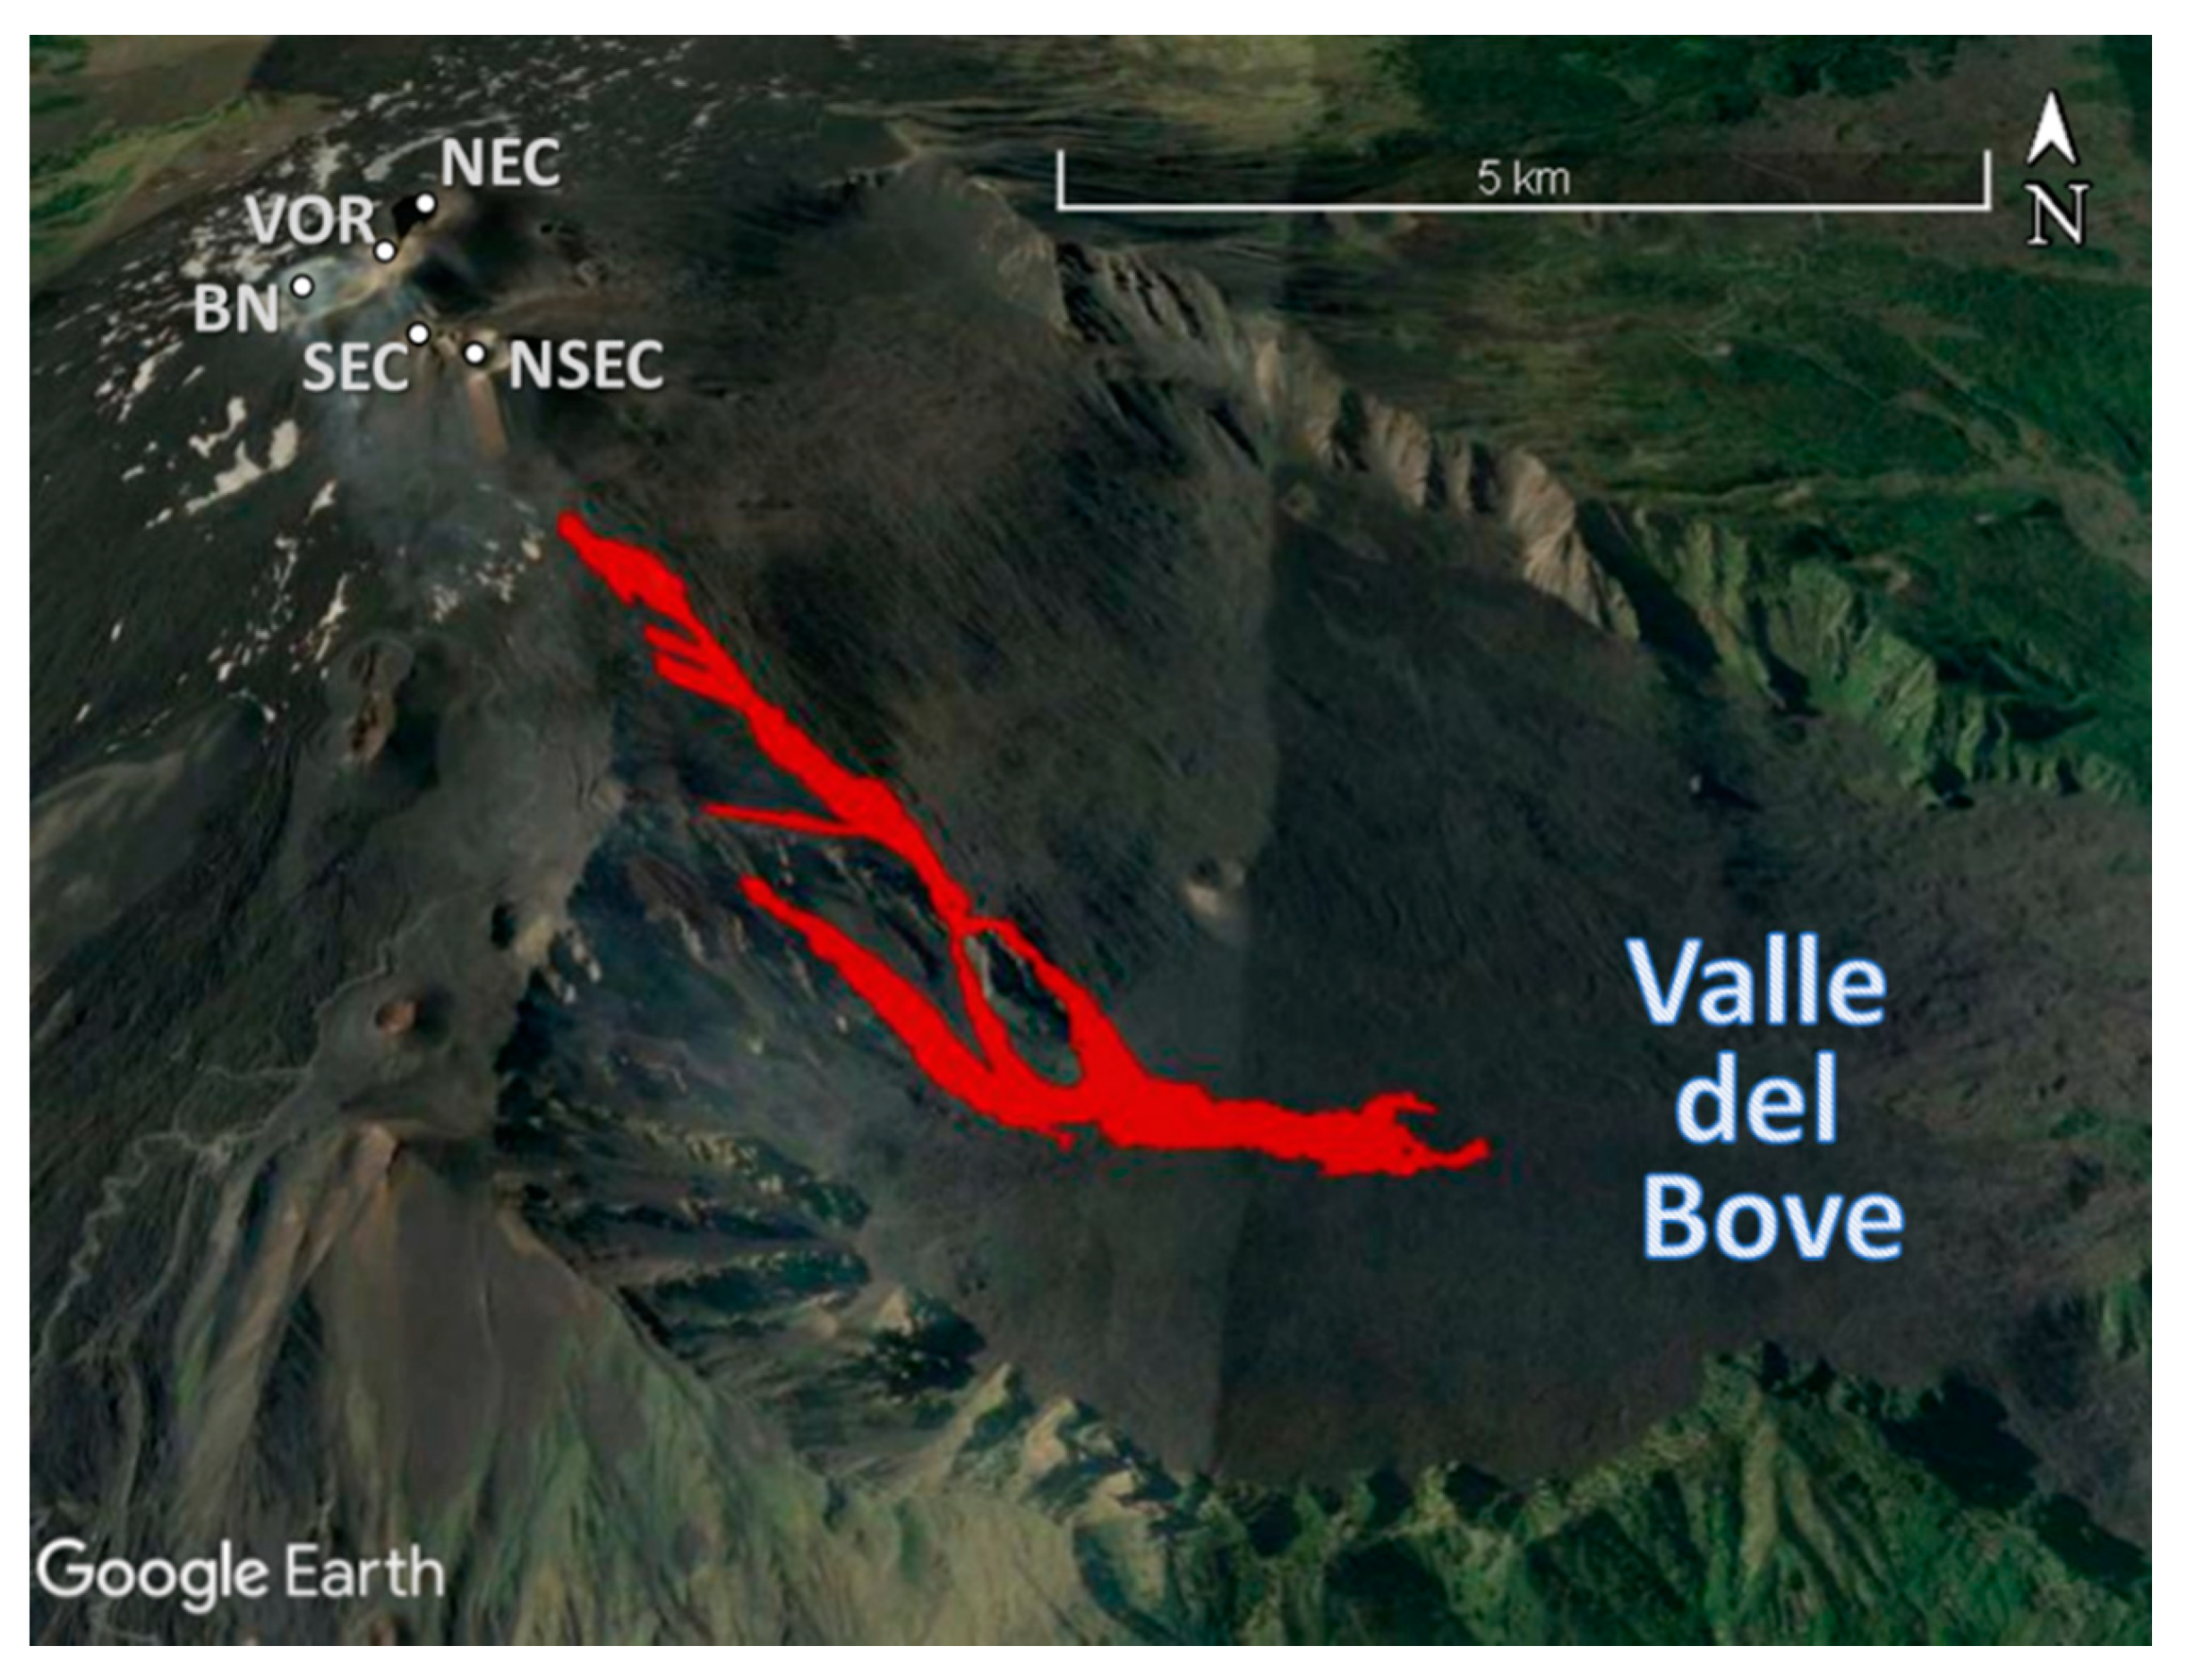
2.1. Study Sites and Reference Data

The most recent eruptions at Mt. Etna and Fogo Island offered a dramatic demonstration of the volcanic hazards associated with lava flows and an excellent example of the importance of remote sensing datasets for monitoring eruptive activity. Mt. Etna is one of the most active volcanoes in the world, characterized by persistent explosive activity at the summit craters and frequent effusive events along fissures located on its flanks. During the past 400 years Etna has erupted over 60 times from flank vents [36], producing lava flows that can extend for several kilometers. Flank eruptions present a major hazard to the towns located around the volcano, especially when the eruptive vents open at very low altitudes. The last eruption of Mount Etna occurred between 24 and 27 December 2018 (total duration of 4 days) from a fissure that opened on the high south-eastern flank [37]. Lava fountains and ash plumes accompanied the opening of the uppermost eruptive fissure, causing disruption to Catania International Airport, and were followed by a quiet lava effusion within the uninhabited Valle del Bove, a large depression on the east flank of Mt. Etna. The final outline of the actual lava flow field (real area) was manually produced through visual analysis of the image acquired by the PlanetScope satellite (from Planet Labs Inc., San Francisco, CA, USA) on 29 December 2018 with a spatial resolution of 3 m (Figure 1). We computed an areal extension of 0.88 km2. This will be considered as the true lava flow value.
Fogo volcano is an island in the southwest end of the Cape Verde Archipelago, located at ~800 km west of the coast of Western Africa. The Cape Verde Archipelago is of volcanic origin, and Fogo is one of the youngest and most active volcanic islands. Over the past 500 years, around 27 eruptions have been documented with a mean interval of about 20 years [38]. The last effusive eruption started on 23 November 2014 and ended on 8 February 2015 (total duration of 78 days) [39]. The eruption produced a three-branch lava flow that buried a considerable extent of cultivated land and overwhelmed two villages on Fogo Island, causing approximately 1000 residents living around the volcano to be evacuated and a local airport to be closed. The final outline of the actual lava flow field (real area) was manually extracted through visual analysis of the image captured by the Pleiades satellites (from French Space Agency) on 20 June 2015 with a spatial resolution of 0.5 m (Figure 2). We calculated an areal extension of 4.8 km2. This will be considered as the true lava flow value.

2.2. Data Sources

Sentinel-1 and Sentinel-2 satellite missions are part of the Copernicus programme of the European Space Agency (ESA). The Sentinel-1 constellation consists of two identical satellites launched in 2014 (Sentinel-1A) and 2016 (Sentinel-1B). Both satellites are equipped with C-band Synthetic Aperture Radar (SAR) instruments (frequency 5.33 GHz, wavelength 5.6 cm), providing data in dual or single polarizations. Sentinel-1 data are acquired in four different operational modes, namely Stripmap (SM), Interferometric Wide swath (IW), Extra Wide swath (EW) and Wave (WV) modes; different spatial resolutions (from 10 m to 40 m) depending on the selected mode. Sentinel-1 (S1) images acquired in C-band IW mode, with dual polarization (VH and VV) in ascending orbit and a temporal resolution of 12 days, are made available at level-1C Ground Range Detected (GRD) by Google Earth Engine. These are already preprocessed based on the algorithms implemented by the Sentinel-1 Toolbox software [40], namely applied orbit files, GRD border noise removal, thermal noise removal, radiometric calibration, and terrain correction steps.
Additionally, Sentinel-2 consists of a constellation of two identical satellites, Sentinel-2A was launched in 2015 and was followed by Sentinel-2B in 2017. The revisit frequency of one satellite is 10 days, resulting in a revisit frequency of 5 days for the constellation. Both satellites are equipped with a MultiSpectral Instrument (MSI) with 13 bands in the visible, near infrared, and shortwave infrared part of the spectrum at spatial resolutions of 10–20 m. Sentinel 2 (S2) images are made available at level-2A Surface Reflectance (SR) by Google Earth Engine.
Landsat-8 is an Earth observation satellite launched in the frame of a joint NASA and USGS mission in 2013. It carries two sensors, namely Operational Land Imager (OLI) characterized by 9 spectral bands: in the visible, near infrared and shortwave infrared (spatial resolution of 30 m). In addition, it has a Panchromatic band at a spatial resolution of 15 m. The second sensor is Thermal Infrared Sensor (TIRS) with 2 bands of 100 m in spatial resolution. Landsat-8 data are characterized by a high radiometric resolution (16 bits), and the scenes cover 185 × 180 km, available at free of charges [41]. Landsat-8 (L8) images are made available as atmospherically corrected surface reflectance from the OLI and TIRS sensors by Google Earth Engine. L8 TIRS bands are already resampled using cubic convolution to 30 m in GEE.
Since we want to highlight the main changes due to the lava flow emplacement, each satellite dataset is made by selected images acquired in two time intervals, namely before the eruption starts (pre-eruptive group) and after the eruption ends (post-eruptive group) for each case of study.

3. Methods

The proposed ML approach relies on three main steps as it is shown in Figure 3:
  • Input feature preparation, features are opportunely extracted from each available satellite data source among S1, S2 and L8, and a further features vector is obtained by concatenating the previously extracted features.
  • Classification, for each of the previously defined features vector, a ML classifier is opportunely designed depending on the input data source.
  • Combination, the outcomes coming from each classifier are merged to provide a final lava flow map.

3.1. Input Feature Preparation

In the first step, images are initially preprocessed for each data source; in particular, S1 data is filtered from speckle noise by using the algorithm proposed in [42] and all the data are projected to UTM/WGS84 reference system. For each data source, we chose the spectral bands to be used to map lava flows; in particular, for L8 we considered both TIRS bands and SWIR bands images. Regarding S2, previous works use either VIS, NIR, and shaded topographic information (especially relevant in VIS bands) for recent lava flow mapping [14] or SWIR for fresh lava flow mapping [11]. In this analysis, both 10-m spatial resolution bands (VIS and NIR bands) and two 20-m SWIR bands (1.61 µm and 2.2 µm) are considered to map the overall lava flow field.
Successively, pre-eruptive and post-eruptive images are selected. For S1 and L8 data, the most recent available image from the pre-eruptive group and the least recent from the post-eruptive group are selected. For S2, we have considered, as in [14], one pre- and two post-eruptive images, but a modification was performed to make the algorithm more robust. The first available image after the eruption accounting for the fresh lava flow is considered as one of the post-eruptive images (post). Then, we use multiple images with partial covering taken closer to the eruption rather than a single perfectly clear image taken much before or much later the eruption as pre-eruptive image (pre) and post-eruptive image (post2), respectively so that defective pixels in one image may be compensated by clear pixels in the other. Thus, pre and post2 are obtained by averaging the values of the 5 most recent available images from the pre-eruptive group and the 5 least recent from the post-eruptive group (excluding the post image already used) to reduce any disturbance due to clouds or ice; considering average images allows to reduce external noises.
Finally, images are combined to generate input features to be used in the next step. For S1 and L8, we subtract the pre eruptive image from the post eruptive image to build the difference image as input feature, while S2 input feature is obtained by concatenating the pre- and post-eruptive images, i.e., 1 × (N × 3) with N = 6 number of bands, namely 1 × 18 vector. Moreover, the features obtained for all the available data sources are concatenated as fused features to be used as a further classifier input.

3.2. Classification

In the second step, a classifier for each extracted set of features is used, thus four classifiers are implemented, namely three classifiers for each data source and one main classifier for the fused features. At this point, the un-supervised K-means technique is used as a change detection algorithm for the S1 feature. The K-means algorithm classifies the input data in a pre-defined number of classes, two classes in our case, depending on their similarity in terms of their Euclidean distance. This algorithm does not need a priori labeling of classes being useful as adaptive threshold technique. Consequently, we adopted this approach to detect changes in intensity in SAR images where “lava” and “background” are the two classes, i.e., n = 2, identified by the K-means algorithm. On the other hand, since more complex patterns involving multi input variables can be better caught by other kinds of classifiers such as Support Vector Machines (SVM), this technique is adopted to classify the remaining data sources, S2 and L8, and the extracted fused data. SVM aims at achieving the best hyperplane or set of hyperplanes separating two classes in order to maximize the distance between their training points (margin). In fact, the larger the margin, the lower the generalization error [43]. The design parameters for SVM are the Kernel type, γ that is the ‘spread’ of the Kernel and therefore of the decision region, and the cost c that is the penalty for misclassifying a data point [44]. In particular, a Radial Basis Function (RBF) kernel is used in our cases with gamma parameter γ = 0.5, and cost c = 10. As a training dataset for the SVM classifiers, a small area belonging to the lava flow field is manually drawn in GEE, namely 8% at maximum of the overall area. In particular, small lava portions belonging to each of the two phases of the lava flow, namely active and cooling phase, must be considered.
Finally, a K-means classifier is designed to classify S1 input data, three SVM classifiers are designed to classify S2, L8 and the fused satellite data. It is worth noticing that a K-means algorithm could also be used for L8 data, but since TIR trend is predominant when analyzing an image close to the eruptive event, some underlying pattern accounting for the SWIR bands contribution could be hidden thus worsening the classifier performance. A final post-processing step is performed for each classifier in order to remove isolated pixels from the foreground from each binary map.

3.3. Combination

In the third step, the outcomes from all the classifiers are leveraged to perform the final lava classification. In particular, the summation of all the weighted contributions is performed and all the weights are set to 1, except the fusion outcome that is set to 2 to enforce the discriminative power of the per-source learned features while privileging the fused features in the combination. Then, a pixel is classified as lava if the combined value is greater than 1, i.e., at least two classifiers outcome must be “lava”, as “background” otherwise.

4. Results

4.1. 2018 Etna Eruption

For the first case study, the closest pre-eruptive and post-eruptive images available, and not affected by clouds, for each data source are shown in Table 2. S1 input data is available right after the lava flow is erupted, on 28 December 2018 and it is used to compute the intensity difference image. The input data is thus made by 1 timestamps × 2 Bands, namely ‘VV’ and ‘VH’. As previously stated, the K-means algorithm does not need a training dataset. The outcome of the K-means classifier is shown in Figure 4a.
S2 input data is made by 3 timestamps × 6 Bands for S2, thus each pixel of the input image will be 1 × (3 × 6) feature vector and it will be given as input to the SVM classifier. The outcome of the SVM classifier is shown in Figure 4b.
L8 images are available close to the eruptive event, thus allowing to get a good map of the lava flow. A difference image is computed, and each pixel of the input image will be a 1 × (4) feature vector and it will be given as input to an SVM classifier. The outcome of the SVM classifier is shown in Figure 4c.
For the data fusion case, input data is made by the concatenation of all the previous satellite data, namely S1, S2 and L8. Thus, each pixel will be characterized by 1 × (2(S1) + 18(S2) + 4(L8)) = 1 × 24 data points. The outcome of the SVM classifier is shown in Figure 4d.
Finally, all the classifiers’ outcomes are combined such that when each pixel value increases greater than 1, the pixel is considered as belonging to the lava flow. The combined lava flow is shown in Figure 5. Table 3 shows the areal extent of lava flows for the investigated eruption extracted from each satellite source.

4.2. 2014–2015 Fogo Eruption

For the second case of study, Sentinel-2 data were not available, thus only S1 and L8 data are used. The closest pre-eruptive and post-eruptive images available, and not affected by clouds, for each data source are shown in Table 4. S1 input data is made by an intensity difference image for each available band, only ‘VV’ in this case. Thus, the input data will be made by 1 time stamp x 1 Band. As previously stated, the K-means algorithm does not need a training dataset. The outcome of the K-means classifier is shown in Figure 6a.
L8 images are not available close to the end of the eruptive activity, the first available image day after the eruption ends thus few lava flow sections are still observable from L8. The outcome of the SVM classifier is shown in Figure 6b.
For the fused dataset, input is made by the concatenation of all the previous satellite data, namely S1 and L8. Thus, each pixel will be characterized by 1 × (1(S1) + 4(L8)) = 1 × 5 data points. The outcome of the SVM classifier is shown in Figure 6c. The final combined outcome is shown in Figure 7. Table 5 shows the areal extent of lava flows for the investigated eruption extracted from each classifier.

4.3. Performance Indices

In order to evaluate our ability to automatically map lava flows by using machine learning classifiers, we compare the areal dimensions of calculated (test area) and actual lava flow fields. The areal extent of the actual lava flow field (real area) for each case of study are manually retrieved. To establish the reliability of our results, we computed three different performance indices, which have been widely employed to quantify the goodness of fit between real and calculated lava flow areas [39,45,46]. They are defined as [14]:
  • accuracy (ACC) = [A(test ∩ real)/A(test ∪ real)]1/2
  • precision (also known as the positive predictive value, PPV) = [A(test ∩ real)/A(test)]1/2
  • sensitivity (also known as the true positive rate, TPR) = [A(test ∩ real)/A(real)]1/2
ACC evaluates the difference in emplacement between the diverse lava flow fields, where A(test ∩ real) and A(test ∪ real) are the areas of the intersection and union between the calculated and actual lava flows, respectively. PPV measures the percentage of calculated lava flow field covered by the actual lava flows. TPR evaluates the percentage of actual lava flow field covered by the calculated lava flows.
The lower and upper limits for the three performance indices are 0 and 1. A fitting score equal to 1 indicates a complete overlap, i.e., the calculated area coincides totally with the actual lava flow field. On the contrary, a fitting score equal to 0 corresponds to the maximum error, i.e., lack of common areas between the calculated and actual lava flows. The comparison between the ACC, PPV, and TPR gives insights on how the calculated emplacements change with respect to the actual areas. Precisely, the testing area underestimates the actual one if PPV is higher than ACC, while it overestimates if TPR is greater than ACC [47]. The results of the performance indices ACC, PPV and TPR calculated for 2018 Mt. Etna and 2014–2015 Fogo Island eruptions are shown in Table 3 and Table 5, respectively.

5. Discussion

Except for one case, the values for indices ACC, PPV, and TPR are always higher than 0.70 for all the classifiers for both the eruptions considered. This means that the actual lava flow fields are well reproduced, and each classifier can give a positive contribution to the lava flow mapping. Only for the L8 classifier in Fogo eruption, the index ACC has a low value of 0.57. This is, probably, due to the L8 image acquired on 11 January 2015, when the main effusive activity was over for several days already. In fact, since the end of December 2014, no evident growth of the lava flow field was observed, even if the eruption was declared officially over on 8 February 2015.
As it is expected, although each single classifier is able to reproduce good portions of the lava flow field ranging from ACC = 0.74 to ACC = 0.83 for the Etna lava flow and ACC = 0.70 for S1 for the Fogo lava flow, both the cases of study show that the fused and the combined mapping are more accurate than the single satellite data classifiers, thus confirming that using all the available information in our proposed machine learning framework allows to get a better knowledge of the lava flow extension. In particular, it is worth to notice that combining all the classifier outcomes slightly increases the accuracy with respect to using only the fused classifier when all the data sources are taken into account, e.g., Etna case of study. On the other hand, its value remains the same as the fused ones when fewer data sources are considered, e.g., Fogo case of study.
For the Etna case of study, we can notice that both the single S2 and the combined final classifiers achieve better results in terms of performance indices with respect to the ones shown in [14], i.e., ACC = 0.83, PPV = 0.79, and TPR = 0.84. Results show that the information provided by SAR intensity images is valuable even though S1 classifier alone may underestimate the lava flow area. This underestimation was already reported in [29], where it is shown that SAR intensity only under-estimates the lava total area with respect to the one estimated from the optical and multispectral datasets during Fogo eruption. The reason behind that is related to different aspects. Since the detected lava flow map mainly reflects change in roughness of the lava surface, these may be difficult to be detected either when a new lava flow is imposed in an older lava flow field since it is characterized by similar textures or when the observed lava flow is characterized by a pahoehoe smooth morphology. In particular, the lava flow erupted at Fogo has been shown to be made by both ʻaʻā (rough) and pahoehoe (smooth) morphologies [48]. Thus, in this case, the lava flow field, extracted by only using S1, is mainly related to the ʻaʻā (rough) lava flow portion as can be verified by comparing it with the ʻaʻā flow map in [48]. The pahoehoe (smooth) lava flow section can then be retrieved by subtracting the previously extracted ʻaʻā lava flow from the overall lava flow field obtained by using our ML technique.
It is worth noting that in this case, the use of SAR intensity images appears crucial to retrieve an estimate of the overall lava flow field since S2 data are missing and only a L8 image is available far after the eruption ends. Thus, although lava flow cannot be fully retrieved by using SAR intensity signals since it only measures changes in roughness of the monitored surface, its contribution to lava flow mapping when combined with other satellite sensors appears to be fundamental.
Thus, without adopting any other source of information but free available ones, a good estimate of the lava flow has been obtained with an accuracy of ACC = 0.92 for the Fogo study case and ACC = 0.85 for the Etna study case. Furthermore, it is a great advantage having the possibility to use the first available post eruptive S1 image right after lava flow emission regardless of the meteorological condition, but at the same time being able to compensate for S1 limitations by using also optical satellite data.
Adopting our machine learning-based approach allows avoiding the difficulties of mapping on location with traditional field surveys and obtaining an extraordinary view of active lava flows in an automatic way. On one hand, manually retrieving a lava flow map from satellite images is time-consuming thus this machine learning approach appears to be a valuable alternative. It can be run on a common laptop with processing time of a few minutes. S1 lava flow emplacement is automatically detected by simply using a K-means unsupervised clustering approach thus overcoming the problem of choosing an opportune fixed threshold. A short time is needed for labelling, since the training area can be chosen by selecting a small region belonging to the lava flow and to the background that can be just drawn in GEE. On the other hand, the reduced spatial resolution of the adopted satellite data leads to overestimation of the actual lava flow field and, consequently, to lower quality of the calculated lava flow map. However, future developments to improve the overall performance could be including further satellite data, such as InSAR data that are not available in GEE at this time.

6. Conclusions

Our objective was to develop a general method to estimate the areal coverage of the newly erupted lava solely by using freely available and open source data from space-borne instruments. We have introduced a machine learning approach to rapidly map lava flows exploiting all the freely available information coming from Sentinel-1, Sentinel-2, and Landsat-8 satellite. We found that the joint analysis of radar and multispectral satellite data provides a superb means of documenting lava flow activity at Etna and Fogo volcanoes. By exploiting both data sources simultaneously, it is possible to map new lava flows with high accuracy.
Our approach relies on a set of machine learning classifiers, one for each satellite dataset and one for all the satellite datasets together, which are able to discriminate between lava and background pixels. Their outcomes are then combined to get a final lava flow map. We used two machine learning techniques, namely the unsupervised K-means to deal with Sentinel-1 SAR intensity data and a supervised Support Vector Machine to deal with Sentinel-2 MSI and Landsat-8 OLI and TIRS data. In particular, a simple alternative approach as a change detection algorithm has been implemented for Sentinel-1 SAR intensity data that does not need any a-priori information.
We investigated two eruptions characterized by different duration and features, namely the 2018 eruption at Mount Etna that lasted 4 days and the 2014–2015 eruption at Fogo Island that lasted 78 days. The results show that the combined outcomes are in good agreement with the targets for both eruptions. It is worth noting that the reference lava flow maps used to validate our approach have been manually produced by using very-high spatial resolution data from PlanetScope at Mt. Etna and Pleiades at Fogo Island, which are not freely-available and quite expensive.
Although some isolated pixels are wrongly classified as belonging to the lava flow, our machine learning approach is able to correctly identify the main lava flow body. This classifier produces good results, especially when the available radar and multispectral images are recorded within a few days that the lava emission ends; after this amount of time the performances get worse.
Lava-flow maps produced adopting this approach can be used to facilitate field mapping, giving insights into emplacement processes, and to improve monitoring and assessment of lava flow hazards. We have shown that both the merged and discriminative information provided by radar and the optical satellite images may allow to distinguish among lava flow morphologies, e.g., ʻaʻā and pahoehoe. This is especially important when considering that pahoehoe lava flows are often related to lava tubes formation, which is fundamental to evaluate and detect the development of potential devastating lava flows.
Finally, it is worth recalling that our machine learning classifier is implemented in GEE so it can be readily accessible. The potentiality of this approach relies on the possibility to get the most from the wide variety of available data sources, overcoming the intrinsic limitations of the single satellite sensor.

Author Contributions

Conceptualization, C.C. and C.D.N.; methodology, C.C. and C.D.N.; software, C.C.; validation, G.B.; formal analysis, A.C.; investigation, C.C. and C.D.N.; resources, A.C.; data curation, G.B.; writing–original draft preparation, C.C.; writing–review and editing, C.C., C.D.N., G.B., A.C. and L.F.; visualization, L.F. and C.D.N.; supervision, L.F. and C.D.N.; project administration, C.D.N.; funding acquisition, C.D.N. All authors have read and agreed to the published version of the manuscript.

Funding

This research was funded by the ATHOS Research Programme.

Acknowledgments

This work was developed within the framework of the Laboratory of Technologies for Volcanology (TechnoLab) at the INGV in Catania (Italy). Sentinel-1 SAR, Sentinel-2 MSI and Landsat-8 OLI data used in this work are available through the Google Earth Engine platform. The authors also appreciate the efforts of the European Space Agency and NASA in providing high-quality open-access data to the scientific community and Google Earth Engine for facilitating the access to and the processing of the archive of publicly available satellite imagery.

Conflicts of Interest

The authors declare no conflict of interest.

References

  1. Del Negro, C.; Cappello, A.; Neri, M.; Bilotta, G.; Hérault, A.; Ganci, G. Lava flow hazards at Mount Etna: Constraints imposed by eruptive history and numerical simulations. Sci. Rep. 2013, 3, 3493. [Google Scholar] [CrossRef] [Green Version]
  2. Del Negro, C.; Cappello, A.; Bilotta, G.; Ganci, G.; Hérault, A.; Zago, V. Living at the edge of an active volcano: Risk from lava flows on Mt. Etna. GSA Bull. 2020, 132, 1615–1625. [Google Scholar] [CrossRef]
  3. Jenkins, S.F.; Day, S.J.; Faria, B.V.E.; Fonseca, J.F.B.D. Damage from lava flows: Insights from the 2014–2015 eruption of Fogo, Cape Verde. J. Appl. Volcanol. 2017, 6, 6. [Google Scholar] [CrossRef]
  4. Poland, M.P.; Lopez, T.; Wright, R.; Pavolonis, M.J. Forecasting, Detecting, and Tracking Volcanic Eruptions from Space. Remote Sens. Earth Syst. Sci. 2020, 3, 55–94. [Google Scholar] [CrossRef]
  5. Ganci, G.; Cappello, A.; Bilotta, G.; Del Negro, C. How the variety of satellite remote sensing data over volcanoes can assist hazard monitoring efforts: The 2011 eruption of Nabro volcano. Remote Sens. Environ. 2020, 236, 111426. [Google Scholar] [CrossRef]
  6. Fink, J.H.; Srivastava, A.; Sylvester, D.; Blaauw, D. Lava Flows and Domes: Emplacement Mechanisms and Hazard Implications; Springer: Berlin, Germany, 2008. [Google Scholar]
  7. Blackett, M. An Overview of Infrared Remote Sensing of Volcanic Activity. J. Imaging 2017, 3, 13. [Google Scholar] [CrossRef]
  8. Del Negro, C.; Cappello, A.; Ganci, G. Quantifying lava flow hazards in response to effusive eruption. GSA Bull. 2015, 128, 752–763. [Google Scholar] [CrossRef]
  9. Ganci, G.; James, M.R.; Calvari, S.; Del Negro, C. Separating the thermal fingerprints of lava flows and simultaneous lava fountaining using ground-based thermal camera and SEVIRI measurements. Geophys. Res. Lett. 2013, 40, 5058–5063. [Google Scholar] [CrossRef]
  10. Corradino, C.; Ganci, G.; Bilotta, G.; Cappello, A.; Buscarino, A.; Del Negro, C.; Fortuna, L. Improving cloud detection with imperfect satellite images using an artificial neural network approach. In Proceedings of the 2019 IEEE International Conference on Systems, Man and Cybernetics (SMC), Bari, Italy, 6–9 October 2019. [Google Scholar]
  11. Marchese, F.; Genzano, N.; Neri, M.; Falconieri, A.; Mazzeo, G.; Pergola, N. A multi-channel algorithm for mapping vol-canic thermal anomalies by means of sentinel-2 MSI and landsat-8 OLI data. Remote Sens. 2019, 11, 2876. [Google Scholar] [CrossRef] [Green Version]
  12. Flynn, L.P.; Mouginis-Mark, P.J.; Horton, K.A. Distribution of thermal areas on an active lava flow field: Landsat observations of Kilauea, Hawaii, July 1991. Bull. Volcanol. 1994, 56, 284–296. [Google Scholar] [CrossRef]
  13. Corradino, C.; Ganci, G.; Bilotta, G.; Cappello, A.; Del Negro, C.; Fortuna, L. Smart Decision Support Systems for Volcanic Applications. Energies 2019, 12, 1216. [Google Scholar] [CrossRef] [Green Version]
  14. Corradino, C.; Ganci, G.; Cappello, A.; Bilotta, G.; Hérault, A.; Del Negro, C. Mapping Recent Lava Flows at Mount Etna Using Multispectral Sentinel-2 Images and Machine Learning Techniques. Remote Sens. 2019, 11, 1916. [Google Scholar] [CrossRef] [Green Version]
  15. Lu, Z.; Fielding, E.; Patrick, M.; Trautwein, C. Lava volume estimated by precision combination of multiple baseline space-borne and airborne interferometric synthetic aperture radar: Application to the 1997 eruption of Okmok Volcano, Alaska. IEEE Trans. Geosci. Remote Sens. 2003, 41, 1428–1436. [Google Scholar]
  16. Rowland, S.K.; Harris, A.J.L.; Wooster, M.J.; Amelung, F.; Garbeil, H.; Wilson, L.; Mouginis-Mark, P.J. Volumetric characteristics of lava flows from interferometric radar and multispectral satellite data: The 1995 Fernandina and 1998 Cerro Azul eruptions in the western Galapagos. Bull. Volcanol. 2003, 65, 311–330. [Google Scholar] [CrossRef]
  17. Pinel, V.; Poland, M.; Hooper, A. Volcanology: Lessons learned from Synthetic Aperture Radar imagery. J. Volcanol. Geotherm. Res. 2014, 289, 81–113. [Google Scholar] [CrossRef]
  18. Ebmeier, S.K.; Biggs, J.; Mather, T.A.; Elliott, J.; Wadge, G.; Amelung, F. Measuring large topographic change with InSAR: Lava thicknesses, extrusion rate and subsidence rate at Santiaguito volcano, Guatemala. Earth Planet. Sci. Lett. 2012, 335, 216–225. [Google Scholar] [CrossRef] [Green Version]
  19. McAlpin, D.; Meyer, F.J. Multi-sensor data fusion for remote sensing of post-eruptive deformation and depositional features at Redoubt Volcano. J. Volcanol. Geotherm. Res. 2013, 259, 414–423. [Google Scholar] [CrossRef]
  20. Whelley, P.; Jay, J.; Calder, E.S.; Pritchard, M.E.; Cassidy, N.J.; Alcaraz, S.; Pavez, A. Post-depositional fracturing and subsidence of pumice flow deposits: Lascar Volcano, Chile. Bull. Volcanol. 2011, 74, 511–531. [Google Scholar] [CrossRef] [Green Version]
  21. Dietterich, H.; Poland, M.P.; Schmidt, D.A.; Cashman, K.V.; Sherrod, D.R.; Espinosa, A.T. Tracking lava flow emplacement on the east rift zone of Kīlauea, Hawai‘i, with synthetic aperture radar coherence. Geochem. Geophys. Geosyst. 2012, 13, 13. [Google Scholar] [CrossRef]
  22. Meyer, F.; McAlpin, D.; Gong, W.; Ajadi, O.; Arko, S.; Webley, P.; Dehn, J. Integrating SAR and derived products into operational volcano monitoring and decision support systems. ISPRS J. Photogramm. Remote Sens. 2015, 100, 106–117. [Google Scholar] [CrossRef]
  23. Wadge, G.; Saunders, S.; Itikarai, I. Pulsatory andesite lava flow at Bagana Volcano. Geochem. Geophys. Geosystems 2012, 13. [Google Scholar] [CrossRef] [Green Version]
  24. Zebker, H.A.; Rosen, P.; Hensley, S.; Mouginis-Mark, P.J. Analysis of active lava flows on Kilauea volcano, Hawaii, using SIR-C radar correlation measurements. Geology 1996, 24. [Google Scholar] [CrossRef] [Green Version]
  25. Ajadi, O.A.; Meyer, F.J.; Webley, P. Change Detection in Synthetic Aperture Radar Images Using a Multiscale-Driven Approach. Remote Sens. 2016, 8, 482. [Google Scholar] [CrossRef] [Green Version]
  26. Rosin, P.L. Thresholding for Change Detection. Comput. Vis. Image Underst. 2002, 86, 79–95. [Google Scholar] [CrossRef]
  27. Jung, J.; Kim, D.-J.; Park, S.-E. Correction of Atmospheric Phase Screen in Time Series InSAR Using WRF Model for Monitoring Volcanic Activities. IEEE Trans. Geosci. Remote Sens. 2014, 52, 2678–2689. [Google Scholar] [CrossRef]
  28. Shahrezaei, I.H.; Kim, H.-C. Fractal Analysis and Texture Classification of High-Frequency Multiplicative Noise in SAR Sea-Ice Images Based on a Transform- Domain Image Decomposition Method. IEEE Access 2020, 8, 40198–40223. [Google Scholar] [CrossRef]
  29. Bignami, C.; Chini, M.; Amici, S.; Trasatti, E. Synergic Use of Multi-Sensor Satellite Data for Volcanic Hazards Monitoring: The Fogo (Cape Verde) 2014–2015 Effusive Eruption. Front. Earth Sci. 2020, 8. [Google Scholar] [CrossRef] [Green Version]
  30. Lu, Z.; Rykhus, R.; Masterlark, T.; Dean, K.G. Mapping recent lava flows at Westdahl Volcano, Alaska, using radar and optical satellite imagery. Remote Sens. Environ. 2004, 91, 345–353. [Google Scholar] [CrossRef]
  31. Maxwell, A.E.; Warner, T.A.; Fang, F. Implementation of machine-learning classification in remote sensing: An applied review. Int. J. Remote Sens. 2018, 39, 2784–2817. [Google Scholar] [CrossRef] [Green Version]
  32. Calvari, S.; Di Traglia, F.; Ganci, G.; Giudicepietro, F.; Macedonio, G.; Cappello, A.; Nolesini, T.; Pecora, E.; Bilotta, G.; Centorrino, V.; et al. Overflows and Pyroclastic Density Currents in March-April 2020 at Stromboli Volcano Detected by Remote Sensing and Seismic Monitoring Data. Remote Sens. 2020, 12, 3010. [Google Scholar] [CrossRef]
  33. Karpatne, A.; Ebert-Uphoff, I.; Ravela, S.; Babaie, H.A.; Kumar, V. Machine Learning for the Geosciences: Challenges and Opportunities. IEEE Trans. Knowl. Data Eng. 2019, 31, 1544–1554. [Google Scholar] [CrossRef] [Green Version]
  34. Corradino, C.; Ganci, G.; Cappello, A.; Bilotta, G.; Calvari, S.; Del Negro, C. Recognizing Eruptions of Mount Etna through Machine Learning Using Multiperspective Infrared Images. Remote Sens. 2020, 12, 970. [Google Scholar] [CrossRef] [Green Version]
  35. Gorelick, N.; Hancher, M.; Dixon, M.; Ilyushchenko, S.; Thau, D.; Moore, R. Google Earth Engine: Planetary-scale geospatial analysis for everyone. Remote Sens. Environ. 2017, 202, 18–27. [Google Scholar] [CrossRef]
  36. Cappello, A.; Neri, M.; Acocella, V.; Gallo, G.; Vicari, A.; Del Negro, C. Spatial vent opening probability map of Etna volcano (Sicily, Italy). Bull. Volcanol. 2012, 74, 2083–2094. [Google Scholar] [CrossRef]
  37. Calvari, S.; Bilotta, G.; Bonaccorso, A.; Caltabiano, T.; Cappello, A.; Corradino, C.; Del Negro, C.; Ganci, G.; Neri, M.; Pecora, E.; et al. The VEI 2 Christmas 2018 Etna Eruption: A Small but Intense Eruptive Event or the Starting Phase of a Larger One? Remote Sens. 2020, 12, 905. [Google Scholar] [CrossRef] [Green Version]
  38. Day, S.J.; Carracedo, J.; Guillou, H.; Pais, F.J.P.; Badiola, E.R.; Fonseca, J.F.; Heleno, S.I. Comparison and cross-checking of historical, archaeological and geological evidence for the location and type of historical and sub-historical eruptions of multiple-vent oceanic island volcanoes. Geol. Soc. Lond. Spec. Publ. 2000, 171, 281–306. [Google Scholar] [CrossRef]
  39. Cappello, A.; Ganci, G.; Calvari, S.; Pérez, N.M.; Hernández, P.A.; Silva, S.V.; Cabral, J.; Del Negro, C.; Vitória, S. Lava flow hazard modeling during the 2014-2015 Fogo eruption, Cape Verde. J. Geophys. Res. Solid Earth 2016, 121, 2290–2303. [Google Scholar] [CrossRef] [Green Version]
  40. Karamanolakis, G.; Hsu, D.; Gravano, L. Weakly Supervised Attention Networks for Fine-Grained Opinion Mining and Public Health; Association for Computational Linguistics (ACL): Stroudsburg, PA, USA, 2019; pp. 1–10. [Google Scholar]
  41. Barsi, J.A.; Lee, K.; Kvaran, G.; Markham, B.L.; Pedelty, J.A. The Spectral Response of the Landsat-8 Operational Land Imager. Remote Sens. 2014, 6, 10232–10251. [Google Scholar] [CrossRef] [Green Version]
  42. Mastriani, M.; Giraldez, A.E. Enhanced Directional Smoothing Algorithm for Edge-Preserving Smoothing of Synthet-ic-Aperture Radar Images. arXiv 2016, arXiv:1608.01993. [Google Scholar]
  43. Hastie, T.; Tibshirani, R.; Friedman, J. The Elements of Statistical Learning: Data Mining, Inference, and Prediction; Springer: Berlin/Heidelberg, Germany, 2009. [Google Scholar]
  44. Suykens, J.A.K.; Vandewalle, J. Least Squares Support Vector Machine Classifiers. Neural Process. Lett. 1999, 9, 293–300. [Google Scholar] [CrossRef]
  45. Kereszturi, G.; Cappello, A.; Ganci, G.; Procter, J.; Nemeth, K.; Del Negro, C.; Cronin, S.J. Numerical simulation of basaltic lava flows in the Auckland Volcanic Field, New Zealand—implication for volcanic hazard assessment. Bull. Volcanol. 2014, 76, 1–17. [Google Scholar] [CrossRef]
  46. Kereszturi, G.; Nemeth, K.; Moufti, M.R.; Cappello, A.; Murcia, H.; Ganci, G.; Del Negro, C.; Procter, J.; Zahran, H.M.A. Emplacement conditions of the 1256 AD Al-Madinah lava flow field in Harrat Rahat, Kingdom of Saudi Arabia—Insights from surface morphology and lava flow simulations. J. Volcanol. Geotherm. Res. 2016, 309, 14–30. [Google Scholar] [CrossRef]
  47. Bilotta, G.; Cappello, A.; Hérault, A.; Del Negro, C. Influence of topographic data uncertainties and model resolution on the numerical simulation of lava flows. Environ. Model. Softw. 2019, 112, 1–15. [Google Scholar] [CrossRef]
  48. Calvari, S.; Ganci, G.; Vitória, S.; Hernández, P.A.; Pérez, N.M.; Barrancos, J.; Alfama, V.; Dionis, S.; Cabral, J.; Cardoso, N.; et al. Satellite and Ground Remote Sensing Techniques to Trace the Hidden Growth of a Lava Flow Field: The 2014–2015 Effusive Eruption at Fogo Volcano (Cape Verde). Remote Sens. 2018, 10, 1115. [Google Scholar] [CrossRef] [Green Version]
Figure 1. Reference lava flow erupted during the 2018 eruption at Mt. Etna. The lava areal coverage was extracted by the PlanetScope image acquired on 29 December 2018. North-East Crater (NEC), Voragine (VOR), Bocca Nuova (BN), South-East Crater (SEC), and New South-East Crater (NSEC) are the summit craters of Etna. Valle del Bove is the large depression on the eastern flank of the volcano. This figure was generated using Google Earth.
Energies 14 00197 g001
Figure 2. Reference lava flow erupted during the 2014–2015 eruption at Fogo volcano. The lava areal coverage was extracted by the Pleiades image acquired on 20 June 2015. Chã das Caldeiras is the summit caldera, inside which the active cone of Pico do Fogo rises up. This figure was generated using Google Earth.
Energies 14 00197 g002
Figure 3. General block scheme representing the three main steps of the ML algorithm: (i) Input Features Preparation, (ii) Classification, and (iii) Combination.
Energies 14 00197 g003
Figure 4. Classifiers outcomes for the 2018 Etna eruption. (a) K-mean outcome for the S1 data; (b) SVM outcome for the S2 data; (c) SVM outcome for the L8 data; (d) SVM outcome for the fused data. North-East Crater (NEC), Voragine (VOR), Bocca Nuova (BN), South-East Crater (SEC), and New South-East Crater (NSEC) are the summit craters of Etna. Valle del Bove is the large depression on the eastern flank of the volcano. This figure was generated using Google Earth.
Energies 14 00197 g004
Figure 5. Combined outcome from all the classifiers: true positive (red area), false positive (yellow area) and false negative (blue area). North-East Crater (NEC), Voragine (VOR), Bocca Nuova (BN), South-East Crater (SEC), and New South-East Crater (NSEC) are the summit craters of Etna. Valle del Bove is the large depression on the eastern flank of the volcano. This figure was generated using Google Earth.
Energies 14 00197 g005
Figure 6. Classifiers outcomes for the 2014–2015 Fogo eruption. (a) K-mean outcome for the S1 data; (b) SVM outcome for the L8 data; (c) SVM outcome for the fused data. Chã das Caldeiras is the summit caldera, inside which the active cone of Pico do Fogo rises up. This figure was generated using Google Earth.
Energies 14 00197 g006
Figure 7. Combined outcome from all the classifiers: true positive (red area), false positive (yellow area) and false negative (blue area). Chã das Caldeiras is the summit caldera, inside which the active cone of Pico do Fogo rises up. This figure was generated using Google Earth.
Energies 14 00197 g007
Table 1. Characteristics and attributes of some sensors used for the optical monitoring of volcanoes by satellite (VNIR: visual and near infrared; SWIR: short-wave infrared; MIR: mid-infrared; TIR: thermal infrared). (Updated after [7]).
SensorCharacteristics
Advanced Land Imager (ALI) on-board the NASA Earth Observation (EO)-1 satellite9 bands: VNIR-SWIR
Resolution: 30 m
Advanced Spaceborne Thermal Emission and Reflection Radiometer (ASTER) on-board NASA Terra14 bands: VNIR-SWIR-TIR
Resolution: 15, 30 and 90 m
Advanced Very High Resolution Radiometer (AVHRR) on-board the National Oceanic and Atmospheric Administration (NOAA) satellites5 bands: VNIR-SWIR-MIR-TIR
Resolution: 1100 m
Imager on-board the NASA Geostationary Operational Environmental Satellite (GOES)5 bands: VNIR-MIR-TIR
Resolutions: 1000–4000 m
Moderate-resolution Imaging Spectroradiometer (MODIS) on-board NASA Terra and Aqua satellites32 bands: VNIR-MIR-TIR
Resolutions: 250, 500 and 1000 m
Operational Land Imager (OLI) on-board the NASA Landsat-8 satellite9 bands: VNIR-SWIR
Resolutions: 15–30 m
Spinning Enhanced Visible and Infrared Imager (SEVIRI) on-board the ESA Meteosat Second Generation satellites12 bands: VNIR-TIR
Resolution: 1000–3000 m
Thermal Infrared Sensor (TIRS) on-board the NASA Lansdsat-8 satellite2 bands: TIR
Resolution: 100 m
Visible Infrared Imaging Radiometer Suite (VIIRS) on board the NASA Suomi National Polar-Orbiting Partnership (S-NPP) satellite22 bands: VNIR-SWIR-TIR
Resolutions: 375–750 m
Multi Spectral Instrument (MSI) on-board the European Space Agency (ESA) Sentinel-2A and Sentinel-2B satellites10 bands: VNIR-SWIR
Resolutions: 10–20 m
Table 2. Satellite dataset used for the 2018 Etna eruption.
MissionSensorAcquisition Date
Sentinel-1SAR22 December 2018
Sentinel-1SAR28 December 2018
Sentinel-2MSI6 December 2018
Sentinel-2MSI11 December 2018
Sentinel-2MSI16 December 2018
Sentinel-2MSI24 December 2018
Sentinel-2MSI29 December 2018
Sentinel-2MSI8 January 2019
Sentinel-2MSI15 January 2019
Sentinel-2MSI25 January 2019
Landsat-8OLI/TIRS9 November 2018
Landsat-8OLI/TIRS27 December 2018
Table 3. Areal extent of lava flow field of the 2018 Etna eruption estimated by machine learning classifiers using S1, S2, L8, fused and combined data. The performance indices ACC, PPV, and TPR, ranging between 0 (worst case) and 1 (best case), quantify the goodness of fit with the actual lava flow area.
DataArea [km2]ACCPPVTPR
Sentinel-10.940.740.830.86
Sentinel-20.750.830.940.87
Landsat-80.980.820.870.93
Fused1.000.840.890.95
Combined1.000.850.880.97
Table 4. Satellite dataset used for the 2014–2015 Fogo eruption.
MissionSensorAcquisition Date
Sentinel-1SAR3 November 2014
Sentinel-1SAR02 January 2015
Landsat-8OLI/TIRS23 October 2014
Landsat-8OLI/TIRS11 January 2015
Table 5. Areal extent of lava flow field of the 2014–2015 Fogo eruption estimated by machine learning classifiers using S1, L8, fused and combined data. The performance indices ACC, PPV, and TPR, ranging between 0 (worst case) and 1 (best case), quantify the goodness of fit with the actual lava flow area.
Data Area [km2]ACCPPVTPR
Sentinel-12.540.700.970.71
Landsat-81.600.570.980.57
Fused4.340.920.980.93
Combined4.340.920.980.93
Publisher’s Note: MDPI stays neutral with regard to jurisdictional claims in published maps and institutional affiliations.

