1. Introduction
The quality of life [
1] assessment implies an investigation of factors representing economic, social, and ecological aspects. It is essential that indicators [
2] provide information that can be easily interpreted [
3] by decision and policymakers [
4]. Moreover, they should facilitate the process of planning [
5,
6], monitoring [
7], and evaluation [
8]. However, an unbiased assessment using some sets of indicators [
9] does not always provide realistic outcomes [
10]. Thus, researchers seek the simplified models and methods [
11] for urban sustainability assessment [
12] that could finally be a useful instrument [
13] for decision makers [
14,
15].
Big data may play a crucial role in achieving sustainability goals and, as a consequence, improving the quality of life, provided the privacy aspects are respected [
16]. Furthermore, GIS (Geographic Information Systems) and remote sensing technologies may contribute to generating a set of urban livability evaluating indicators via extracted land-use information [
17]. Some research has underlined the importance of a multidimensional [
18] and multi-criteria approach that combines three methodologies: material flow analysis (MFA), life cycle assessment (LCA), and data envelopment analysis (DEA) [
19,
20].
The environmental dimension [
21,
22] is considered to influence the level of quality of life the most [
23]. Other studies have concentrated on green infrastructures [
24] and sustainable transportation [
25] and mobility [
26,
27,
28,
29] or logistics [
30,
31] as key issues to reach smart [
32] and sustainable development in cities [
33,
34]. In one of the studies concerning Qatar, a comprehensive life cycle sustainability assessment for four different support utility electric vehicle technologies has been presented. It included hybrid, plug-in hybrid, and full battery electric vehicles. Fourteen sustainability indicators representing the three pillars of sustainability have been taken into consideration to create a model for the hybrid multi-regional input–output-based life cycle sustainability assessment. The results proved that all-electric vehicle types have significant potential to lower global warming potential, air pollution, and photochemical oxidant formation [
35].
Another important aspect is the Internet of Things (IoT) as one of the key components of the ICT infrastructure of smart sustainable cities. Urban planners, scholars, ICT (Information and Communication Technologies) experts, and other city stakeholders should be aware of the environmental benefits arrising from implementing smart sustainable city initiatives and projects on the basis of the IoT and related big data applications [
36]. In accordance with some latest research, there is also a need to create a holistic catalogue of innovative technologies and solutions on energy, mobility, and ICTs [
37] in order to integrate these sectors. In various studies, the proposed indicators allow researchers to assess trends of urbanized space shaping and quality of life [
38]. There are also studies searching for strategies that may enhance the concept of better governance [
39], smartainability [
40], or circular city [
41] and city regions, particularly important for seaport agglomeration with huge congestion [
42].
Giffinger and al. elaborated the ranking of European medium-sized cities to illustrate differences regarding to their smart development level. The analysis was made within six characteristics: smart governance, environment, mobility, people, living, and economy. In their research, 74 indicators were used and the data were standardized and aggregated to finally present the cities’ profiles [
43].
Moreover, some studies have indicated that there is a need for a holistic approach, integrating urban metabolism and life cycle assessment [
44]. Life cycle thinking (LCT) includes environmental life cycle assessment (LCA), life cycle costing (LCC), and social LCA (S-LCA). It also embraces life cycle sustainability assessment (LCSA), as well as integrated analyses with combined tools. Under the analysis carried out by Petit-Boix et al., water, waste, and buildings are the most studied urban issues, whereas a few studies have been devoted to urban planning and energy. At the same time, strong interrelations among urban issues were identified, especially including water. As much as 79% of the studies exclusively applied life cycle tools and 84% of them focused on the environmental dimension. Such single environmental indicators as global warming were common in 20% of cases. Overall, there is a need for methodological advances and their applications, especially as regards social and sustainability assessment.
While considering how to measure urban sustainability [
45], there is a need for universal approach [
46], including socio-cultural [
47,
48], demographic changes [
49], energy [
50,
51,
52] or safety issues [
53], and other global challenges [
54,
55,
56].
The ISO 37120 standard [
57,
58] may be considered as an appropriate instrument of assessing the quality of life with regard to city services [
59,
60]. This regulation was published by the International Organization for Standardization on 15 May 2014 during the city world summit held by the Global City Indicators Facility. The Polish version of the PN-ISO 37120: 2015-03 standard “Sustainable development of communities. Indicators for City Services and Quality of Life” was adopted in March 2015. This standard allows researchers to assess the city performance, the inhabitants’ quality of life, and work in particular areas of activity. The criteria included in the standard allow researchers to observe and assess changes on an annual basis and provide possibilities to compare the results with other cities.
The standard defines 100 indicators with the adopted methodology to calculate them; these indicators can be used by other cities of different sizes to measure and control the level of their development in the following aspects: social, economic, and environmental ones [
61]. All indicators are grouped in 17 thematic areas. They include: economy, education, energy, environment, finances, crisis management, local government bodies, recreation, safety, solid waste, telecommunication, innovation, transport, urban planning, wastewater management, water management, and sewage system management.
These indicators are divided into 46 basic and 54 auxiliary indicators. Moreover, the standard includes numerous profile indicators that allow the cities to decide which of them are the most appropriate for comparison. However, the standard focuses on three main aspects [
62,
63,
64]: transparency in data presentation, review of taken decisions, and innovation in becoming the world leader in implementing the highest standards of services provided by the city.
The main advantages resulting from the ISO 37120: 2015 standard include: effective city management and higher quality of services rendered by the city; the standard provides a framework for the sustainable development and strategic planning of the city; information for city managers and decision makers used in decision-making; access to data, including the possibility of increasing the reliability of data through audit and data verification by external institutions; better credibility on financial markets, better prospects of acquiring new investors, and introduction of activity funding programs; usefulness of certification in efforts to obtain financing for the city from the EU funds.
Cities can be assessed by five levels of certification: aspiring, brown, silver, gold, and platinum. The certification levels depend on how many of these indicators are monitored in a given city. The measurement of specific sets of indicators provides opportunities to compare them and benchmark data between particular cities subject to this certification. However, the main issue related to collecting this type of data is the possibility of communicating it between particular cities and with open access. To do so, the open data platform of the World Council on City Data (WCCD) with a seat in Toronto was established. The platform coordinates all activities related to the municipal data reported under the ISO 37120 standard, as well as to other normative solutions based on this standard. Particular cities that have been granted the ISO 37120 certificate are added to the database of Global Cities Registry™ for one year. At the end of this period, they must re-enter the certification process. All data reported by cities is posted on a specially developed virtual platform
http://open.dataforcities.org/ (accessed on 28 April 2021), providing open access to data.
Monitoring and improving the level of particular indicators defining the quality of life should be included in the urban development strategy. The most important goals include [
63]: eradicating poverty and hunger, good health of city residents, high-quality education, gender equality, access to clean water and cleaning products, clean and inexpensive energy, decent working conditions and economic growth, reducing inequalities, promoting the idea of sustainable city and society [
65], responsible consumption and production, fighting climate change, sustainable use of water resources, and sustainable use of ecosystems on land.
It is possible to analyze the data related to the development changes in the cities using the utility method. It was applied by Alpopi at all, for example, in relation to the sustainable urban development. The authors compared the Romanian cities using the indicators divided into four categories: economic, social, environmental and natural resources. The comparison of the scores allows researchers to differentiate the cities in terms of sustainability and provides important information about the measures that can be applied for future improvement [
66]. The authors also carried out research regarding the quality of electronic government services using fuzzy analysis (for evaluating the quality of Bucharest town hall’s websites), and in relation to housing sector taking into account such indicators as the number of dwellings per 1000 inhabitants, the average number of rooms per dwelling, overcrowding, the degradation rate of housing, and the rate of utilities [
67,
68].
The aim of this paper was to investigate the possibility of illustrating in a transparent way the urban quality of life, and therefore to deliver the method facilitating data-driven decisions on urban management, planning, and investment. The analysis has been carried out using examples of selected European cities: Amsterdam, Gdynia, London, and Zagreb, three of them being the capital cities (data related to the Polish capital, Warsaw was not available). The hypothesis reads as follows: it is possible to use the total and partial utility method in order to assess the level of urban quality of life with regard to the three dimensions of sustainable development in order to monitor progress and results and prioritize and implement the changes within urban policy. The criterion for selecting the cities for the comparative analysis was the data availability in regards to the indicators related to the ISO 37120 standard and the fact that those cities went through the process of certification.
2. Materials and Methods
The paper made use of the data collected in the World Council on City Data (WCCD) database. This study proves that it is possible to use the utility method to convert the values of indicators that define particular dimensions of sustainable development, reported in the ISO 37120 standard, into the values of partial and total utility. The essence of this conversion is the fact that the applied mathematical equation allows researchers to reduce the unit characteristics of a given indicator, and the obtained result forms the value of real number between 0–1, which constitutes the value of partial utility. Then, the obtained values of real numbers for various indicators can be summed up and in a transparent way, compared to particular dimensions and cities.
However, it is crucial to determine the function of assessment of a particular indicator, i.e., whether it is a stimulant (S; the increase in its value is favorable), a destimulant (D; the increase in its value is unfavorable), or a nominant (the most favorable values are intermediate values). In this study, indicators were qualified as stimulants or destimulants.
The partial utility is a relative value of the sustainable development indicator for the analyzed city compared to the values for other cities and is calculated as per the following formula:
where:
Uij—partial utility for city i relative to indicator j,
Cij—value of sustainable development indicator j for city i,
—the lowest (for the sustainable development stimulant) or the highest (for the sustainable development destimulant) value of the sustainable development indicator j among the analyzed cities,
—the highest (for the sustainable development stimulant) or the lowest (for the sustainable development destimulant) value of the sustainable development indicator j among the analyzed cities.
The value of partial utility falls within the range of real numbers 0–1, when the value is equal to 0, it proves that a given city has reached the worst result among the analyzed cities, whereas when the value of partial utility equals 1, it means that the city is a leader regarding a given indicator.
The total utility is calculated as per the following formula:
The value of total utility depends not only on the values of partial utility, but also on the number of analysed indicators. With max. value of partial utility equal to 1 for the values of particular partial utilities, the total value of total utility equals the sum of indicators included in a given analysis.
This study presents the assessment of the quality of life in 4 European cities of different populations, size, and geographical location: Gdynia (0.25 million, 135 km
2), Zagreb (0.8 million, 641 km
2), London (9 million, 1572 km
2), and Amsterdam (0.8 million, 219.3 km
2). The first two cities are located in postsocialist countries: Poland entered the EU in 2004 whereas Serbia is not the EU member yet. The other two cities belong to the north-western part of Europe: the UK has just left the EU and the Netherlands has been a member since the very beginning. The quality-of-life assessment was performed under 20 selected sustainable development indicators as per the ISO 37120 standard (
Table 1).
3. Results
Under the adopted methodology, indicators presented in
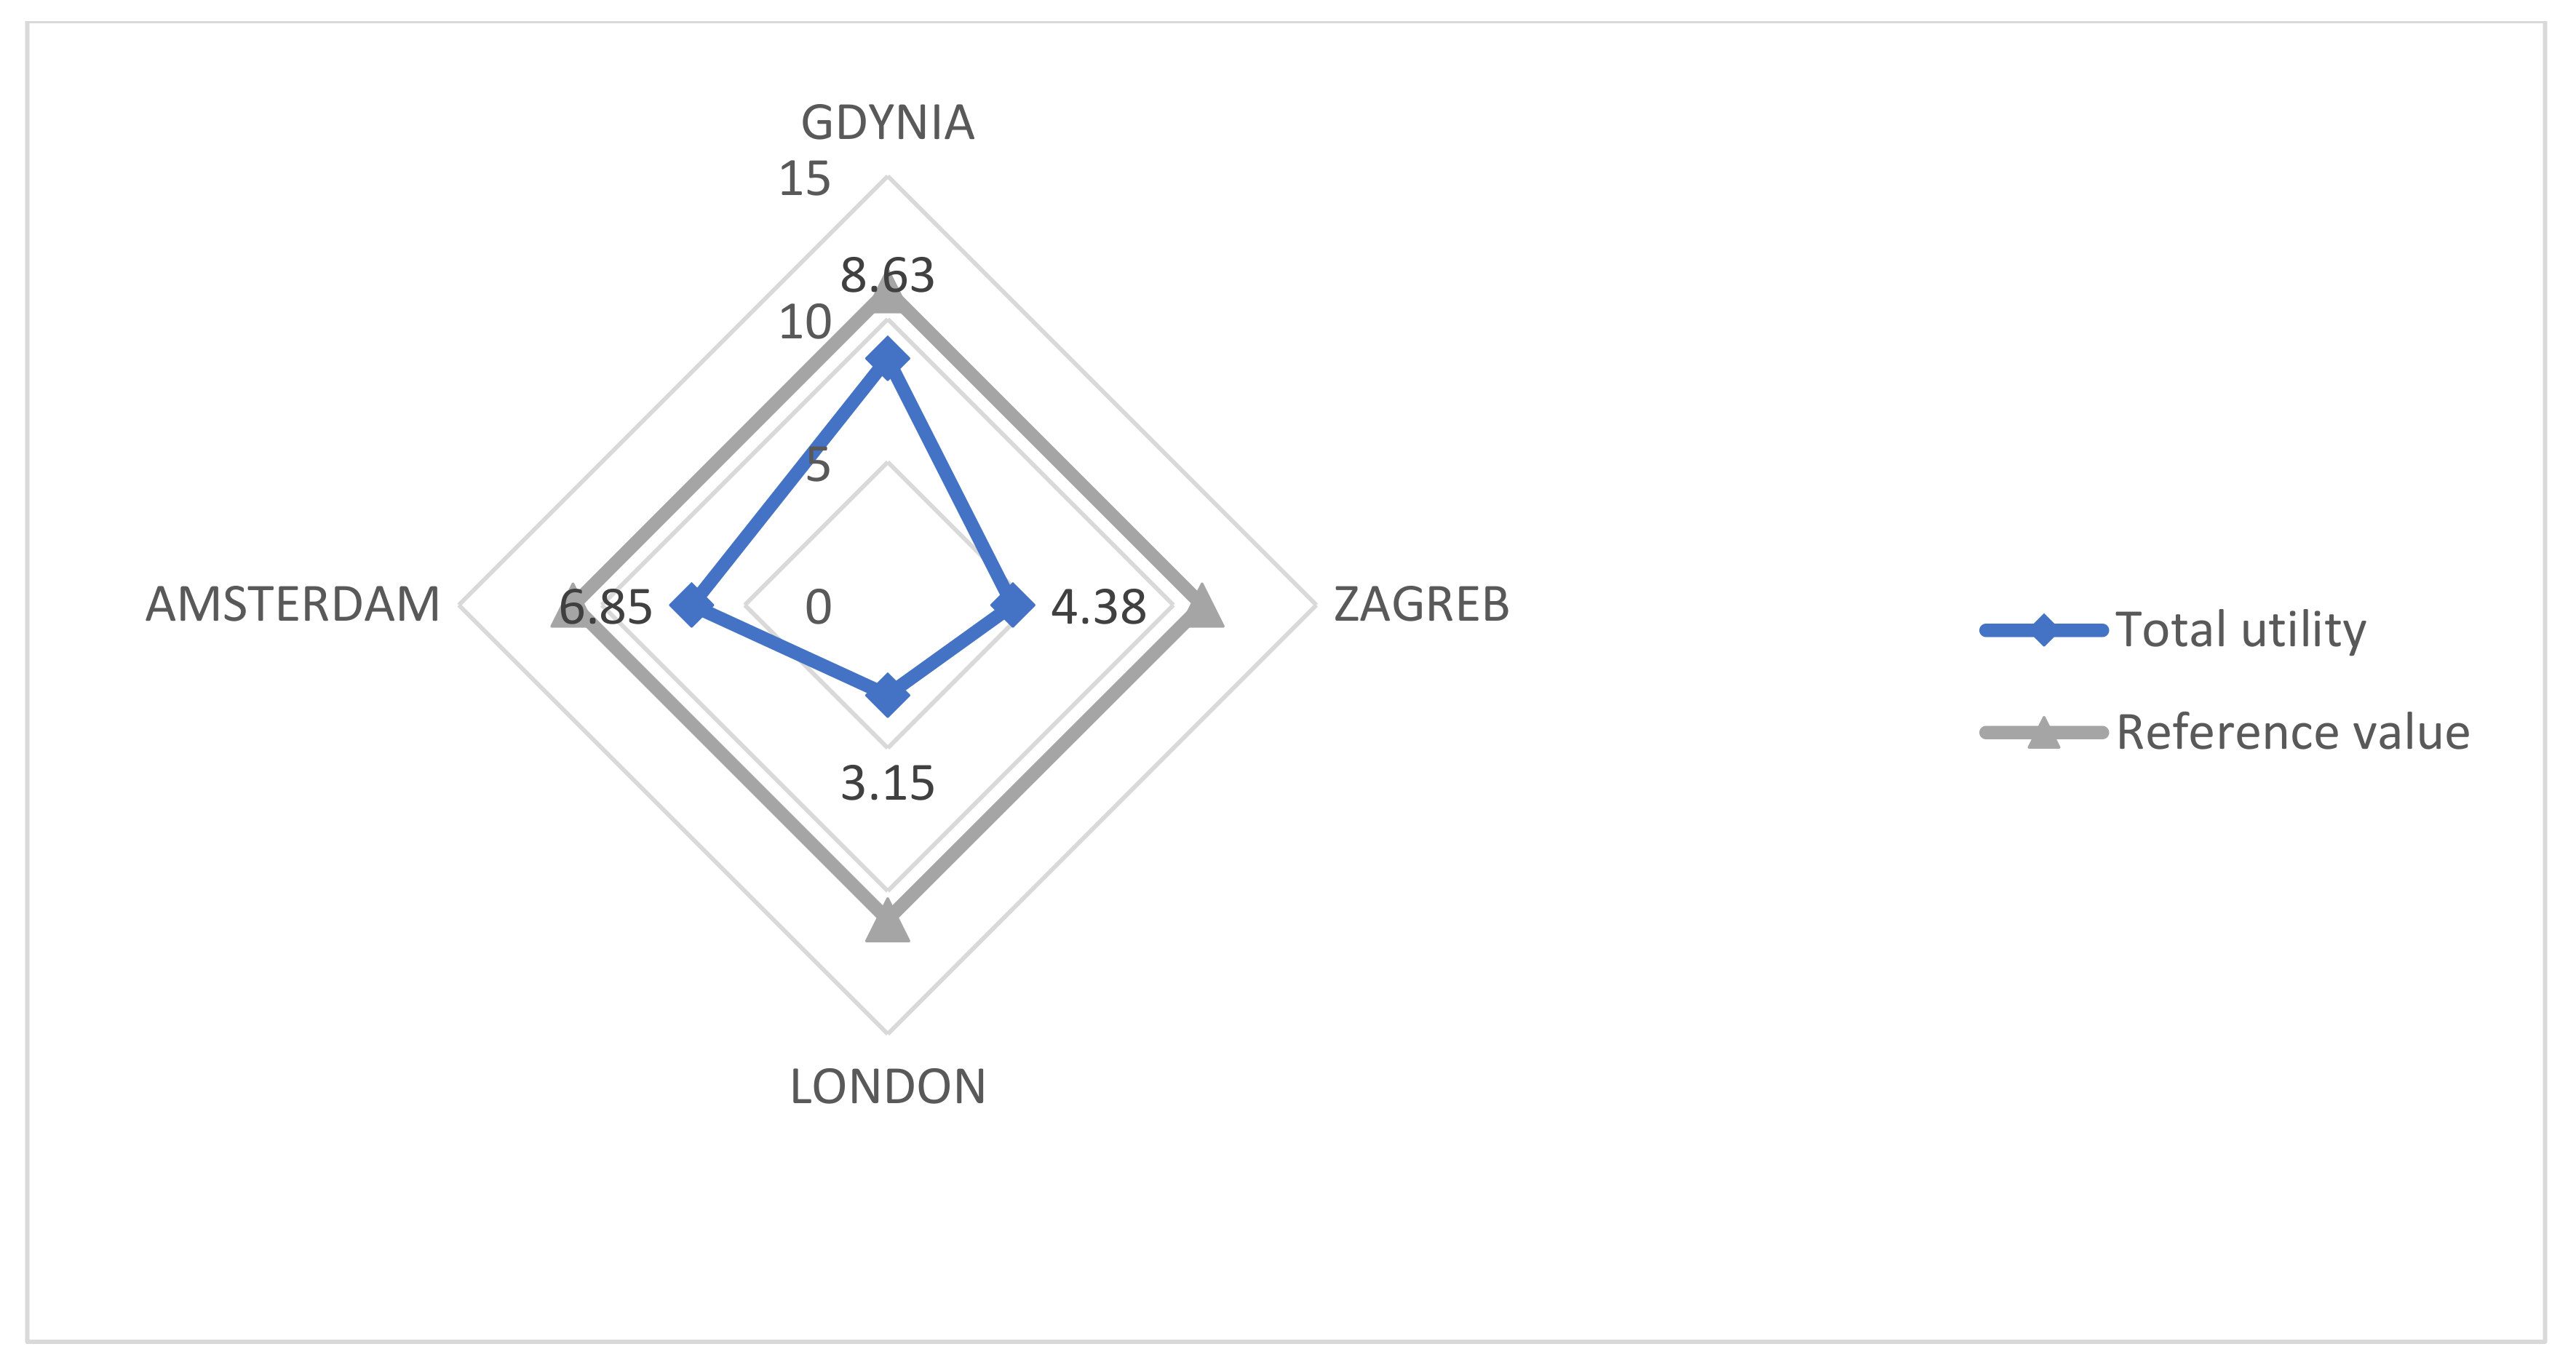
Table 1 were converted into the value of partial and total utility. The selected indicators were categorized into particular dimensions of sustainable development: social (
Table 2,
Figure 1), economic (
Table 3), and environmental ones (
Table 4,
Figure 2).
Under the obtained results it can be concluded that the most favorable value of total utility (16.4) was achieved by the city of Gdynia, since from among 20 sustainable development indicators selected for the analysis, as many as 13 obtained the value of 1, i.e., the max. value, and among them, six indicators referred to the social dimension. These included: number of firefighters per 100,000 inhabitants, under-five mortality rate per 1000 births, violent crime rate per 100,000 inhabitants, percentage of population living in slums, percentage of women elected to office at the public municipal administration, and number of doctors per 100,000 inhabitants. In the environmental dimension, five indicators obtained the max. value and they included: concentration of fine particulate matter PM 2.5, concentration of fine particulate matter PM 10, concentration of NO
2, total amount of solid waste collected in the city per capita, total water consumption in the city. The other two indicators referred to the economic dimension: number of companies per 100,000 inhabitants and debt servicing rate (
Table 2,
Table 3 and
Table 4).
The city of Amsterdam took second place with the value of total utility at 13.42, and the result was composed of the following six partial utility indicators valued between 0.99–1.0: concentration of fine particulate matter PM 2.5, concentration of fine particulate matter PM 10, voter turnout in the last local elections, number of Internet connections per 100,000 inhabitants, violent crime rate per 100,000 inhabitants, total amount of solid waste collected in the city per capita, number of cars per capita. Among those six indicators, four referred to the environmental and two referred to the social dimension (
Table 2,
Table 3 and
Table 4).
The other two European cities: Zagreb and London, in the conducted assessment of the quality of life, obtained nearly identical results, respectively: 10.31 and 10 points of the value of total utility. For the city of Zagreb, the max. value of partial utility (0.92–1.0) referred to four indicators: ambulance response time from notification received, percentage of population living in slums, total amount of solid waste collected in the city per capita, total water consumption in the city. Therefore, two indicators referred to the social and two to the environmental dimension (
Table 2,
Table 3 and
Table 4).
The city of London was characterized by the highest value of total utility (6.13). This value was composed of high values of partial utility (0.84–1.0) of the following indicators (
Table 3 and
Table 4):
- -
concentration of fine particulate matter (PM 2.5);
- -
concentration of particulate matter (PM 10);
- -
total amount of solid waste collected in the city per capita;
- -
total water consumption in the city;
- -
green areas per 100,000 inhabitants;
- -
number of cars per capita.
The comparison of total utility by dimensions for the analyzed European cities is presented in
Table 5, whereas the graphic differences in the value of total utility between the compared cities with regard to the analyzed dimensions are presented in
Figure 3.
All things considered, the applied utility measure has revealed that the city of Gdynia is distinguished by a relatively high quality of life, which results from the social dimension indicators related to the inhabitants’ health and safety, i.e., with regard to the number of doctors per 100,000 inhabitants, percentage of women elected to office at the public municipal administration, violent crime rate per 100,000 inhabitants, under-five mortality rate per 1000 births, number of firefighters per 100,000 inhabitants, and the percentage of population living in slums. The two indicators of economic dimension are also very favorable: the number of companies per 100,000 inhabitants and the debt servicing rate. Distinctive, also, are the four indicators related to the environmental dimension, proving a good quality of life with regard to air quality and economical water consumption in the city. Whereas the city of Amsterdam is distinguished by a high number of Internet connections per 100,000 inhabitants, voter turnout in the last local elections, and favorable air quality indicators, as well as a low number of cars per capita. The biggest advantages regarding high quality of life in the city of London involve a large greenery area per 100,000 inhabitants, low number of cars per capita, concentration of fine particulate matter (PM 2.5), concentration of fine particulate matter (PM 10), total amount of solid waste collected in the city per capita, and total water consumption per person in the city. However, this city ranking declined due to the social dimension indicators related to violent crime rate per 100,000 inhabitants (0), voter turnout in the last local elections (0), percentage of women elected to office at the public municipal administration (0.05), and number of Internet connections per 100,000 inhabitants (0.04).
Whereas as for social dimension, the city of Zagreb achieved very good results regarding indicators such as: ambulance response time from notification received, under-five mortality rate per 1000 births, percentage of population living in slums. The city obtained even better results as for environmental dimension since from among seven characterized indicators, as many as five reached nearly the reference value (0.81–0.96), specifically: concentration of fine particulate matter (PM 2.5), concentration of fine particulate matter (PM 10), total amount of solid waste collected in the city per capita, total water consumption per person in the city, and number of cars per capita. However, two indicators were very far from the reference value: green areas per 100,000 inhabitants (0.03) and concentration of NO2 (0.27), and they decreased the city’s ranking when assessing their performance under indicators of the ISO 37120 standard.
4. Discussion
The authors have assumed that in the analyzed cities, the sustainable development in the context of objective quality of life occurs when the average values of total utilities exceed 60% of the reference value in the analyzed dimensions. The applied vector of reference is an artificial reference of the most favorable values, equal to the number of all indicators taken into account in the analysis (20) with their highest value possible to obtain, i.e., the value of 1.
The data presented in
Table 6 prove that the most favorable result in this respect was achieved by the city of Gdynia—82% of the value of the reference. The city of Amsterdam took the second place with the result of 67.1%. Therefore, it can be considered that the two cities are characterized by the sustainable development in the context of objective quality of life with regard to the 20 ISO 37120 standard indicators included in the analysis. The other two analyzed cities, Zagreb and London fail to meet this condition, since the percentage share of the total utility value in the value of reference amounts to 51.55% and 50.0%, respectively.
The percentage share of the total utility value with regard to the value of reference is graphically presented in
Figure 4.
The authors are aware that the presented analysis of the ranking of cities is to some extent limited by the fact that only some indicators were selected for the analysis. However, this study aimed to present the possibilities of using the partial and total utility method for more transparent and measurable assessment of the quality of life in cities. The attempt to compare the value of pure indicators doesn’t allow us, in an aggregated way, to prove the differences between the analyzed objects. When they are calculated and transferred into the partial and total utility value and finally summarized, this enables us to find out measurable differences within the studied cities.
Detailed studies would require including all indicators within the WCCD Global Cities Registry™ (GCR) database. The other limitation refers to a small number of cities in this database. The concept of comparing the quality of life with the use of ISO 37120 standard indicators would ensure more objective assessment only if a larger number of cities implemented the standard and provided the data to be included in the GCR database.
Nevertheless, it is a useful instrument, allowing researchers to categorize the cities and assess the level of their sustainability and smart development. However, the procedure of collecting and processing data is time- and cost-consuming and it is difficult to interpret and compare numerous values of indicators of different units. It hinders their interpretation and widespread use. The authors of this publication believe that the applied utility method allows users to establish a database of results that are easier to interpret and, therefore, to compare the quality of life on a temporal and spatial scale, in an objective and transparent manner.
5. Conclusions
The conducted analysis allowed us to positively verify the adopted research hypothesis—it is possible to use the total and partial utility method to compare the level of urban quality of life with regard to the three dimensions of the sustainable development. As regards the environmental dimension, all the cities reached quite good results. There were small differences between the analyzed cities and it should be underlined that their scores were near the reference value. When it comes to the social pillar, the differences were more significant: Amsterdam and Gdynia reached the highest values, whereas for London and Zagreb these values were much lower.
The overall analysis of the obtained results has indicated that the city of Gdynia is characterized by the relatively high level of the quality of life compared to other cities. This final result was influenced significantly by best values within the economic dimension for this Polish city. In 2017, Gdynia was granted the ISO 37120 certificate at the aspiring level. At that time, 80 indicators, including 40 basic and 40 auxiliary indicators were monitored. It should be noted that Gdynia underwent the certification process in WCCD; therefore, the city is included in the GCR database, which allows users to assess the city in the ranking of smart European and global cities.
The utility method presented in this publication allows researchers to convert, in a simple way, the value of ISO 37120 indicators into the partial utility value and after aggregating all values, to express it as the real value of total utility value, which, as a quantified value, allows them to compare the quality of life with regard to the social, economic, and environmental dimensions in the cities.
However, on interpreting the results it should be noted that the assessment of the quality of life refers to the pre-pandemic time. Recently, the quality of life in the analyzed cities certainly changed since the restrictions introduced during the pandemic adversely affected the value of some ISO 37120 indicators within all dimensions, i.e., the social, economic, and environmental ones. The quantified comparison of the ISO 37120 indicators converted into the values of partial and total utility presented in this study may provide interesting information for the activity of local governments within the smart city and urban resilience concept during and—hopefully—after the COVID-19 pandemic.
The authors are aware that the research is not fully adequate in relation to a large number of indicators and the sizes of the cities. Besides, the selected cities represent quite a different development level related to the historical, political, economic, geographical, and cultural context and background. The area of the study should be extended, however at this stage of the research, we took into consideration four cities that had the ISO 37120 certificate and were registered in the World Council on City Data as a sufficient base to explore the possibility to use the utility method for the transparency of quality of life assessment. This instrument could be potentially extended with specific features determining the quality of life in the future, obviously for more complex research studies.
In consequence, this method could be a clear, simple, and useful instrument for decision makers as regards urban policy implementation. The obtained results may be relevant and even constitute guidelines for public decisions making. The added value of the paper is also a contribution to the discussion about the methods for measuring and operationalizing the sustainability in a aggregated, and thus useful, way. The utility method could be helpful for cities and communities of all sizes to make data-driven decisions on management, planning and investment, and monitoring of progress and results, and overall aid them in becoming more sustainable, safe and resilient, prosperous, inclusive, and smart.


