Article

Cost of Industrial Process Shutdowns Due to Voltage Sag and Short Interruption

by
Édison Massao Motoki
1,2,*,
José Maria de Carvalho Filho
2,
Paulo Márcio da Silveira
2,
Natanael Barbosa Pereira
3 and
Paulo Vitor Grillo de Souza
2,4
1
Power Systems Department, Mackenzie Presbyterian University, São Paulo 01302-907, SP, Brazil
2
Institute of Electrical Systems and Energy, Federal University of Itajubá, Itajubá 37500-903, MG, Brazil
3
Energias de Portugal—EDP, São José dos Campos 12210-010, SP, Brazil
4
Automatic Department, Federal University of Lavras, Lavras 37200-000, MG, Brazil
*
Author to whom correspondence should be addressed.
Energies 2021, 14(10), 2874; https://doi.org/10.3390/en14102874
Submission received: 7 April 2021 / Revised: 7 May 2021 / Accepted: 11 May 2021 / Published: 16 May 2021
(This article belongs to the Special Issue Analysis and Experiment for Electric Power Quality)

Abstract

:
The objective of this work is to propose and apply a methodology to obtain the cost of industrial process shutdowns due to voltage sag and short interruption. A field survey, aided by a specific questionnaire, was carried out in several industries connected to medium voltage networks, in the states of Espírito Santo and São Paulo in Brazil. The results obtained were the costs per event and the costs per demand in a total of 33 companies in 12 different types of activities. It is noteworthy that this survey brings a relevant technical contribution to the electricity sector, helping to fill, even partially, an existing gap in both national and international literature.

1. Introduction

1.1. Relevance

Voltage sags and short interruptions are the power quality disturbances that most affect industrial consumers and are caused by the occurrence of short circuits, especially in aerial transmission and distribution networks that are exposed to various climatic events and environmental effects, such as atmospheric discharges, gales, burning, and vandalism, which can cause temporary or permanent outages in the network.
Voltage sags and short interruptions can influence the operation of various equipment and result in serious consequences, especially for those consumer units that have sensitive loads.
Due to the advancement of the electronic area, the equipment brings in its technological support devices with great sensitivity so that the voltage sags and short interruptions can impact the operation of the industries. The effects result in losses due to production stoppages, losses of raw material, damage to equipment, delays, and fines for non-delivery of products, and even lost profits [1].
In this context, the main objective of this work is to propose and apply a survey methodology to obtain the cost estimate of industrial process shutdowns due to the occurrence of voltage sags and short interruptions.

1.2. State of Art

A search for published articles on the costs of process shutdowns due to voltage sags and short interruption was carried out, and a summary of the main works found is presented below.
In [1], research showed the possibilities to mitigate the voltage sags with some applications of technologies for the industry and presented the cost per voltage sag of US $5000.00 for industry in general.
In [2], a survey was carried out by sending a questionnaire in three districts in Italy, to which 93 industries from 18 different types of activity responded. The results indicated that the processes were susceptible to certain power quality disturbances, these being: 84% due to voltage sags and short interruption, 8% due to transient overvoltage, 6% due to voltage fluctuation, and finally 2% due to harmonics. Qualitatively, 89% of the companies answered about the annual economic impact due to power quality problems, these being: 8% despised it, 28% as a minimum, 20% as low, 25% as medium, 16% as high, and 3% as very high. Only 10 industries in the sample reported the average annual cost, with 7 of them indicating an average economic loss of up to US $20,000.00; in another, the cost varied between US $20,000.00 and US $50,000.00, and for 2 of them, the value varied between US $50,000.00 and US $250,000.00 per year.
In the research [3], a method was presented to estimate the number of voltage sags and the resulting costs through a study of five electricity utilities in Finland. For this purpose, the number of occurrences of voltage sag was estimated using the fault position method. Data regarding permanent faults in the network were used, as well as a correction factor being applied to consider temporary faults of the different types (single-phase, two-phase, three-phase). The economic consequences were assessed considering the number of process shutdowns, the costs involved and the number of customers affected. Annual costs due to voltage sags were €530,000.00 for 500 industries in Rural area 1; €270,300.00 for 150 industries in Rural area 2; €8,474,700.00 for 1950 industries in Rural area 3; €1,038,800.00 for 1400 industries in the Urban area 1 and €519,400.00 for 700 industries in the Urban area 2.
In [4], a method was used to calculate the cost of process shutdowns for small industrial plants caused by voltage sags and interruptions in Italy. The formulation of the cost of process shutdowns includes loss of production, loss of raw material, imperfections in production, damaged equipment, extra maintenance, and finally, the process stop times. The methodology was applied in a plastic company supplied at medium voltage and which experienced an annual average of 25 to 30 process shutdowns due to voltage sags. The analysis was performed on four types of process machines that are sensitive: injection, compression, polymerization, and molds. Considering their average production resumption times and with their cost parameters linked to each type of machine, a cost per voltage sags was reached with a variation of €300 to €550, between the stop times (0 sec to 1 h).
In the work of [5], a study was carried out in a generic distribution network consisting of 295 buses, 296 transmission lines, and a large number of switches and circuit breakers in order to allow changing the network topology to obtain better system reliability. The methodology used to assess the financial losses suffered by the consumer as a result of voltage sags was the fault position method. Various types of fault were applied at different points in the network according to the probability of occurrence of each one of them. Thirty-seven industries with high sensitivity to voltage sags were chosen and the Monte Carlo method was used to perform the simulations. Ten thousand tests were simulated to verify the variation in the number of process shutdowns, considering different categories of industries, classified into 3 groups: group I for high loads (>2 MW); group II for medium loads (1 MW to 2 MW) and group III for small loads (up to 1 MW). The costs obtained for the industrial processes shutdowns were £1000.00 for small loads, £16,300.00 for medium load industries, and £581,000.00 for large industrial loads.
In [6,7], a methodology was proposed to estimate financial losses due to supply interruptions and voltage sags by means of a probabilistic assessment, applicable both for the evaluation of individual consumer losses and of the total system losses. For economic losses, it was considered that every shutdown of the plant requires 24 h to resume normal production and that the costs of various types of activities are those of interruption due to voltage sags. The estimated cost for the class of industrial consumers was US $19,594.00 per event.
In article [8], a practical implementation of a stochastic assessment of financial losses due to voltage sags was used. The study characterized the process shutdown by a cumulative probabilistic equation based on the study of [6,7] and took into account the sensitivity and the interconnection of equipment present in a given process, as well as the types of consumers and their location in the distribution network. The simulated network consisted of a distribution system of 29 bars, 28 lines, and 11 transformers, using the Monte Carlo method. The loads were classified into three categories: group I (>20 MW); group II (between 5 and 20 MW); group III (up to 5 MW). For all categories, costs per process shutdown due to voltage sags were from Rs 46,300.00 to Rs 781,000.00 (US $648.00 to US $10,934.00) per event.
Reference [9] presents the methodology used and the main results of a survey carried out in Norway on short-term interruption costs, based on questionnaires about direct costs and the consumer’s willingness to pay to avoid voltage variations or to accept them. The results are normalized and standardized by the energy not supplied, in kWh, in the case of interruptions lasting more than three minutes, and by the power, in kW, for short interruptions and voltage sags less than or equal to three minutes. The results showed that the cost per interrupted demand due to voltage sags in industrial consumers was between US $3.34/kW and US $5.18/kW.
In [10], the study presented the cost estimate due to the occurrence of voltage sags based on the momentary reduction of the power flow and of the energy not supplied. As a case study, real measurements made in a transmission system in Brazil were used. The costs obtained were due to 37 events considered significant and ranged from US $510.00/event to US $772,800.00/event, considering that the voltage sag was proportional to the energy not supplied and that the costs were more concentrated in values below US $50,000.00 per event.
In work [11], a hybrid method was used to assess risks linked to interruptions in sensitive processes due to faults in the electrical distribution system. For each consumer, indices related to voltage sags are determined, such as the frequency of occurrences classified in ranges of magnitude and duration, as well as the impacts on industrial processes fed by the distribution system used as a test case. The average annual cost due to voltage sags for industrial consumers was U$ 64,417.00.
In [12], researchers presented a methodology for cost-benefit analysis aimed at mitigating short-term voltage variation in a cement factory, considering the probability of process shutdown. The cost per voltage sag reported by the cement industry was Rs 750,000.00 or US $13,385.00 per event.
In [13], a study was carried out to assess the level of power quality in Malaysia, as well to estimate the cost associated with the occurrence of voltage sags. The events were captured by meters installed at appropriate locations on the power grid. The costs per event vary according to the type of activity of the consumer unit, with the lowest cost being found at US $24,124.00/event (commercial sector) and the highest at US $723,729.00/event (semiconductors sector); glass/stone/clay/cement, ceramic and tiles the cost was US $96,500.00/event; metal/aluminum/copper products, US $168,700.00/event. Also, in this reference is shown the cost per voltage sag of US $5000.00 at the plastics industry in the USA.
In [14], the impact of voltage sags on consumer units in China was discussed and the method of calculating losses resulting from voltage sags was through questionnaires or personal interviews. The results show that there is a great variation in the cost per voltage sags according to the industrial sector, mainly due to the added value of the final product; for the chemical fiber industry they ranged from US $29,000.00 to US $172,000.00, while for the semiconductor industry the costs were between US $574,000.00 and US $3,585,000.00.
In [15], costs were assessed due to the occurrence of voltage sags in a distribution system typical of a chemical industry, considering five types of sensitive equipment installed in the industrial process. The cost considered was US $1893.00 per event (voltage sag), including labor costs, unfinished product costs, losses of raw materials, among others. The results obtained with the simulations vary with the bus where the sensitive loads are installed. The number of estimated shutdowns ranges from 24 to 344 per year, resulting in losses ranging from US $380.80 to US $12,128.20 per year.
In [16], an investment analysis study was carried out to minimize losses due to the occurrence of voltage sags and short interruptions. Using the Monte Carlo simulation method for stochastic simulation of voltage sags for a period of 30 years, the Modified RBTS Bus 2 test system was used. To validate the simulation data, the costs considered were obtained from reference [13], in the plastic and automotive industries as US $48,920.00 and US $56,142.00, respectively, representing an average of US $52,531.00 per event. For the analysis, two types of systems were considered, overhead lines and underground cables. The best result was obtained when you chose to change a total of 4 overhead lines to underground cables.
In [17], the importance of assessing financial losses in industrial consumers due to voltage sag and short interruptions was mentioned. The authors proposed a new model for assessing the impact of voltage sags using voltage tolerance curves (VTC) associated with a truth table to characterize the logical relationship of sensitive equipment with the production process. The model is applied in a production process of TLT-LCD, whose estimated annual loss due to voltage sags was US $776,439.00 per year. The case study also showed that the proposed model had better adaptability in relation to the conventional model.

1.3. Contributions

The bibliographic research carried out included about two decades of work and aimed to verify the existence of works related to process shutdown costs due to voltage sags and short interruption. Directly related to the theme, several procedures were used to obtain cost estimates, namely: conducting surveys through forms, conducting stochastic simulations of voltage sags, and conducting measurements. Among the main countries where the costs were assessed, the following stand out: Italy, China, India, Finland, Brazil, Malaysia, and Norway. In general, cost estimates were presented on an annual basis, per event and per interrupted kW. Despite the significant number of types of activities surveyed in the publications, it was observed that the costs obtained in different countries were very different for the same productive sector. It was also found that most publications were old and few of them were in journals. In the specific case of Brazil, the works found were generic and did not quantify costs by type of activity. In this context, this work aims to fill the gaps identified by conducting direct surveys, in a total of 33 companies in 12 different business areas, supplied at medium voltage (11.9/13.8 kV) by the company EDP in the states of Espírito Santo and São Paulo in Brazil.

2. Theory

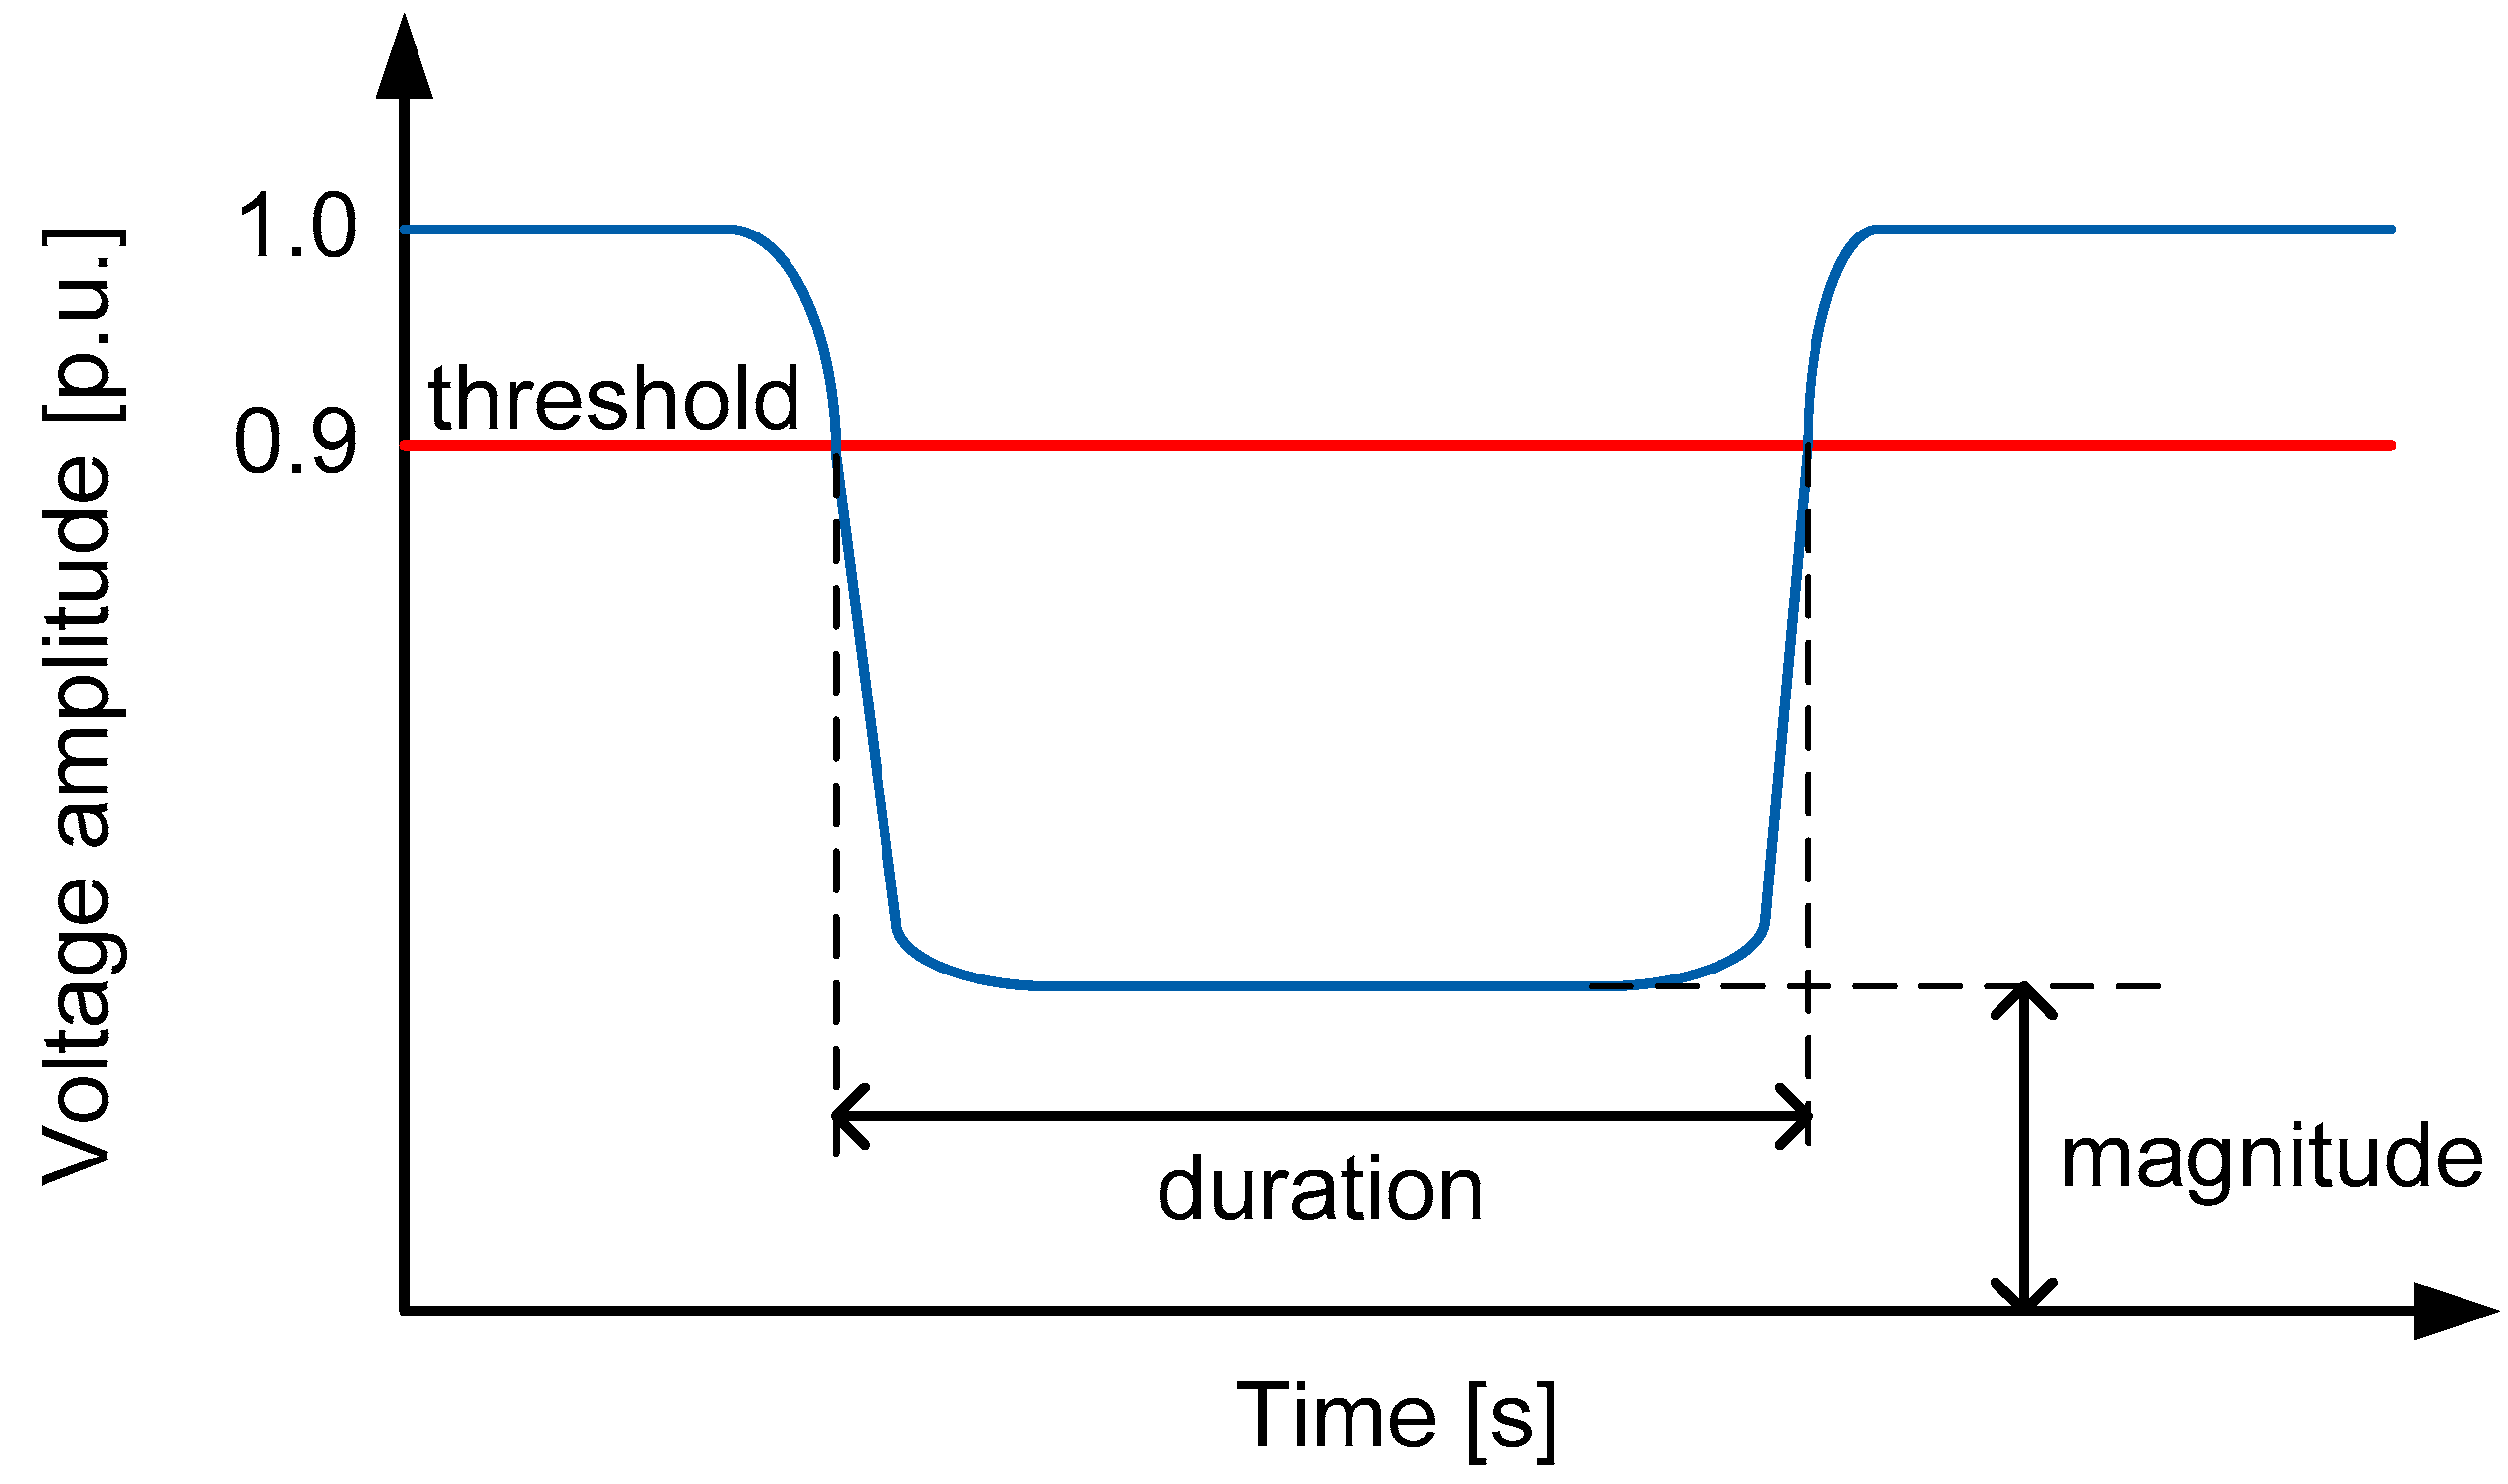
2.1. Voltage Sag and Short Interruption

The IEEE 1159-2009 defines voltage sag as being a decrease between 0.1 and 0.9 p.u. in rms voltage and with a duration from 0.5 cycles to 1 min [18]. Figure 1 shows the representation of voltage sag and is characterized by sag magnitude and duration. The sag magnitude is defined as the lowest rms voltage of the three phase voltages during the sag event, and its duration is the time that the voltage is lower than the 0.9 p.u. threshold in all three phases. Usually, voltage sags and short interruptions occurred due to power system faults.
Table 1 shows the category, the type of event, and the duration of each one. The information contained in the table was adopted from [18].

2.2. Overview of Equipment and Process Sensitivity

Each piece of equipment has a behavior in terms of voltage sags, which can be represented by a tolerance curve, which is usually rectangular and presents the thresholds of magnitude and duration. For example, Figure 2 shows the rectangular voltage tolerance curve indicating that when the voltage sags are longer than the duration threshold (Tmax) and deeper than the voltage magnitude threshold (Vmin), the equipment will trip (or malfunction).
Sensitivity curves are often used to assess the impact of voltage sags on industrial loads and processes. However, these curves do not have a single pattern of behavior, and there may be significant variations due to differences in manufacturer, model, hardware topology, software configurations, loading, among others [5,19]. Two others important characteristics of the voltage sags, in addition to the magnitude and duration of the voltage sags already mentioned are:
  • point on wave—which corresponds to the phase angle of the instantaneous voltage at the sag initiation.
  • phase–angle shift—the difference between the voltage phase angle at the pre sag moment and during the event.
The equipment most used in the industries and which were also found during the field survey carried out were: programmable logic controller—adjustable speed drive—ASD [20], PLC [21], contactor and [22,23,24].

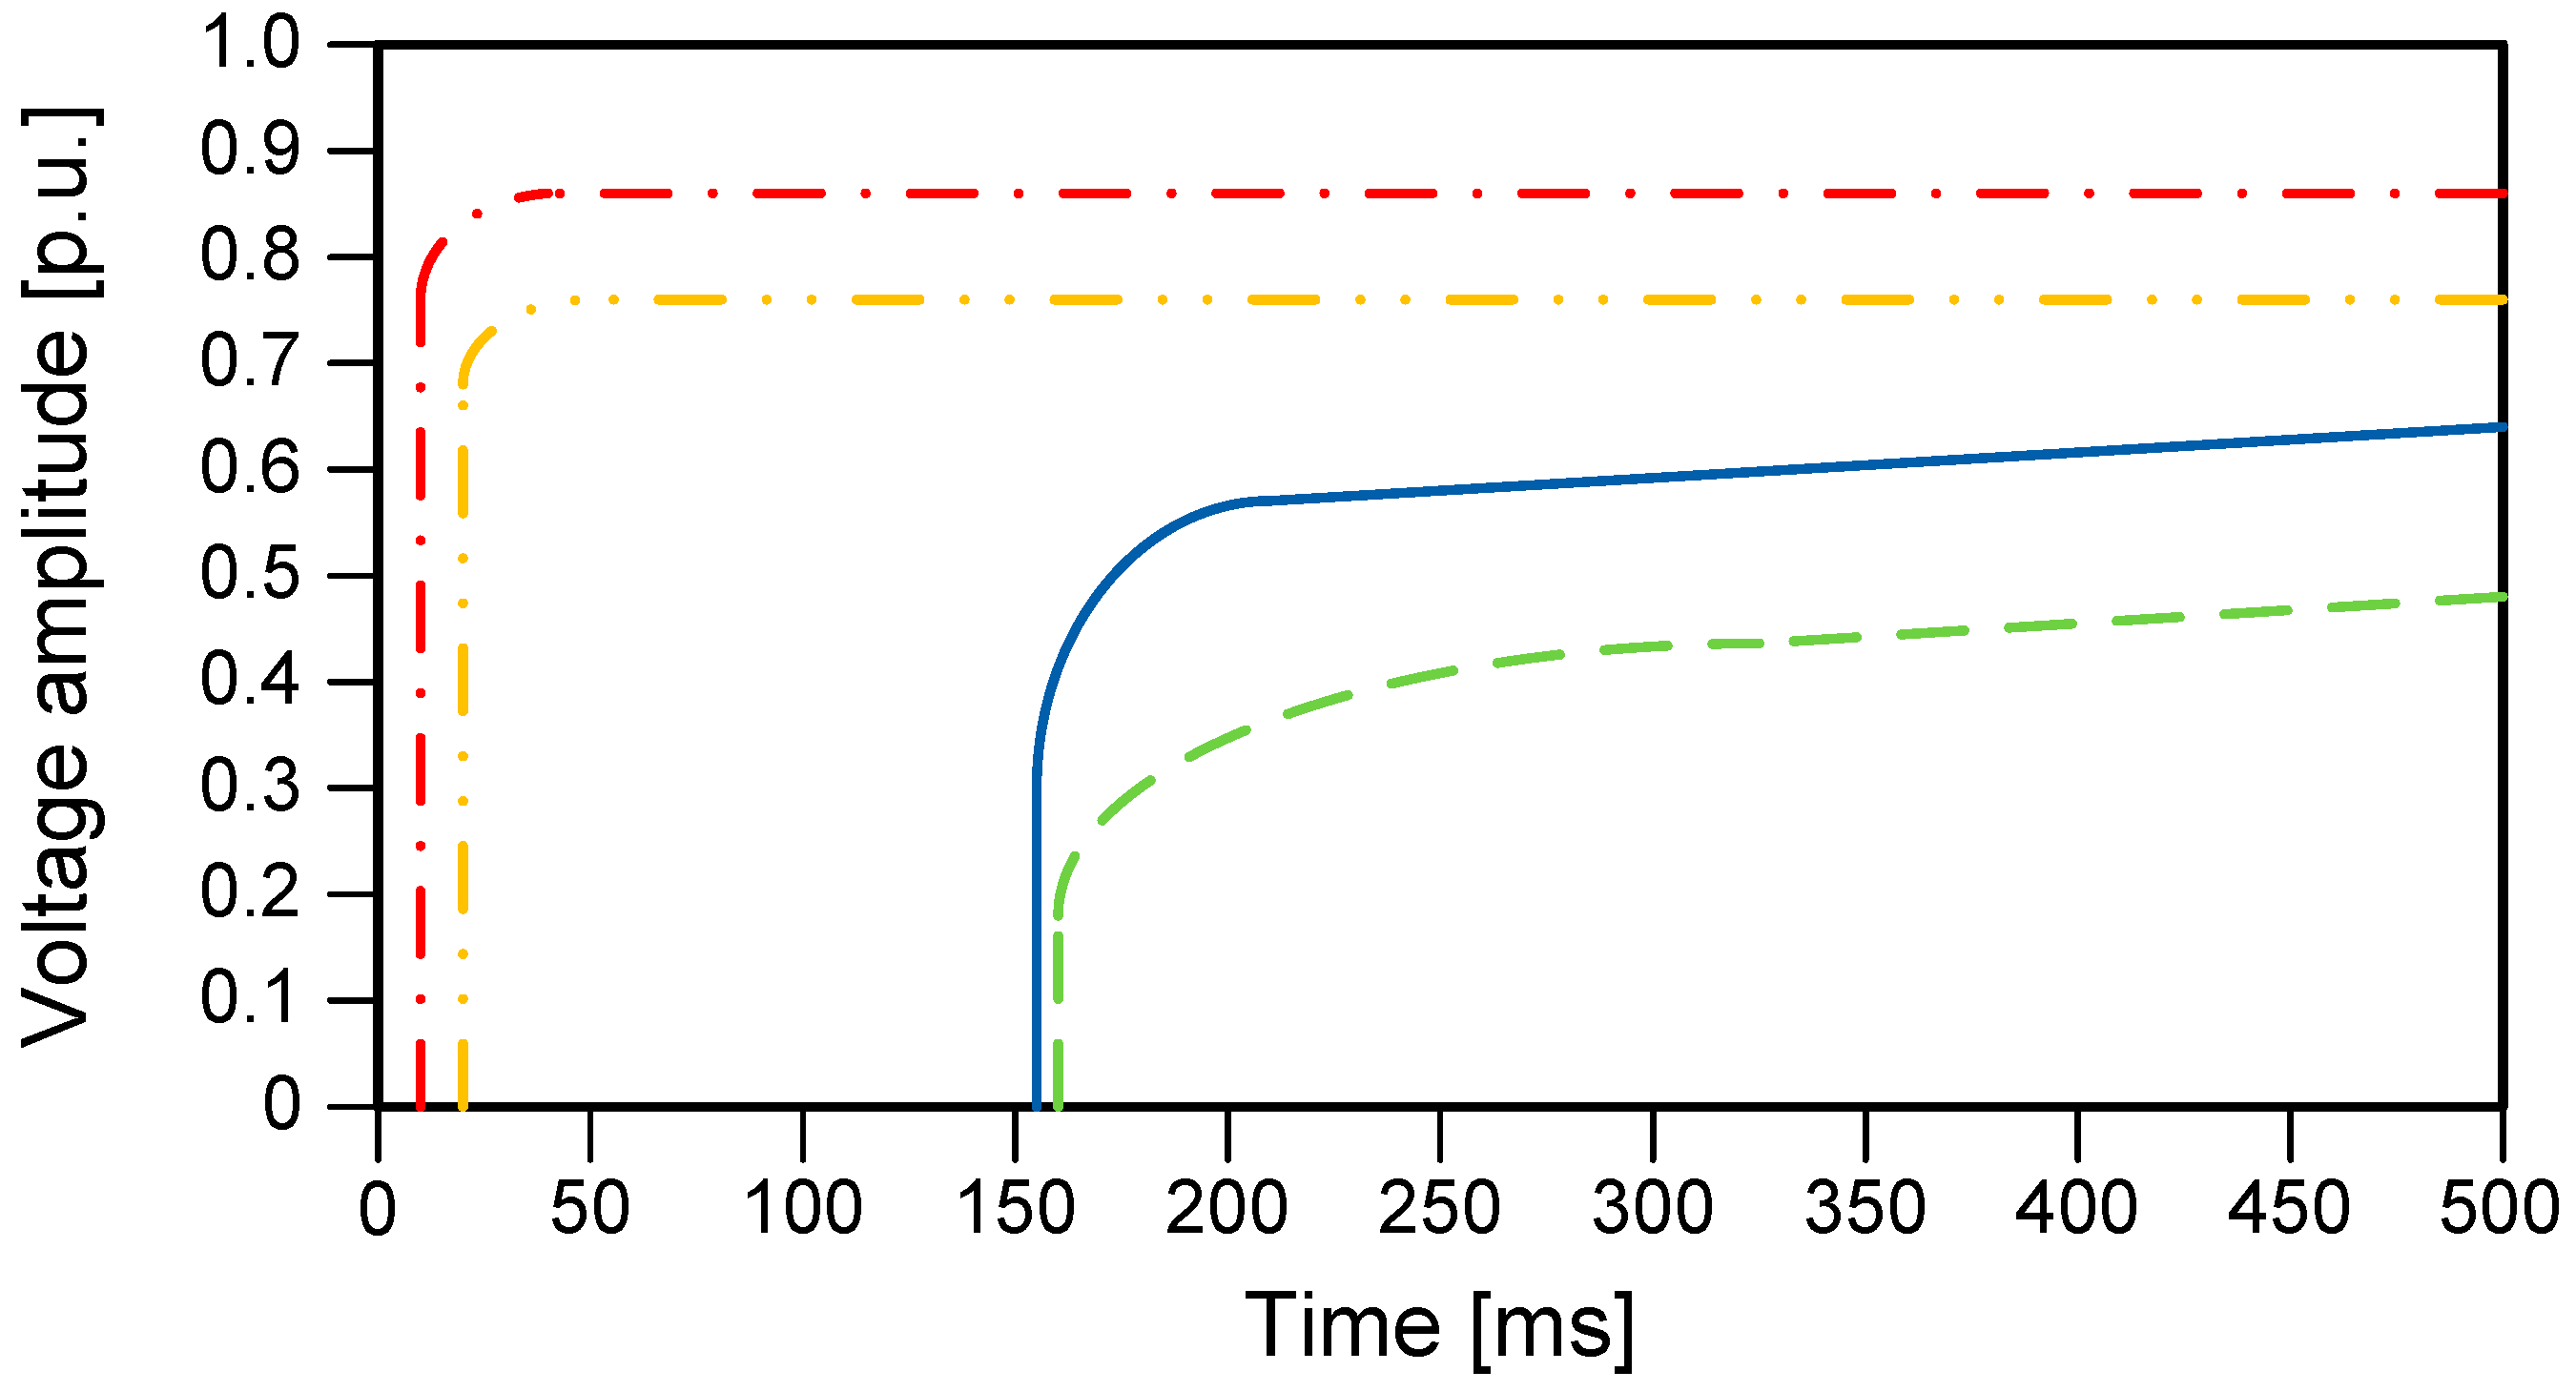
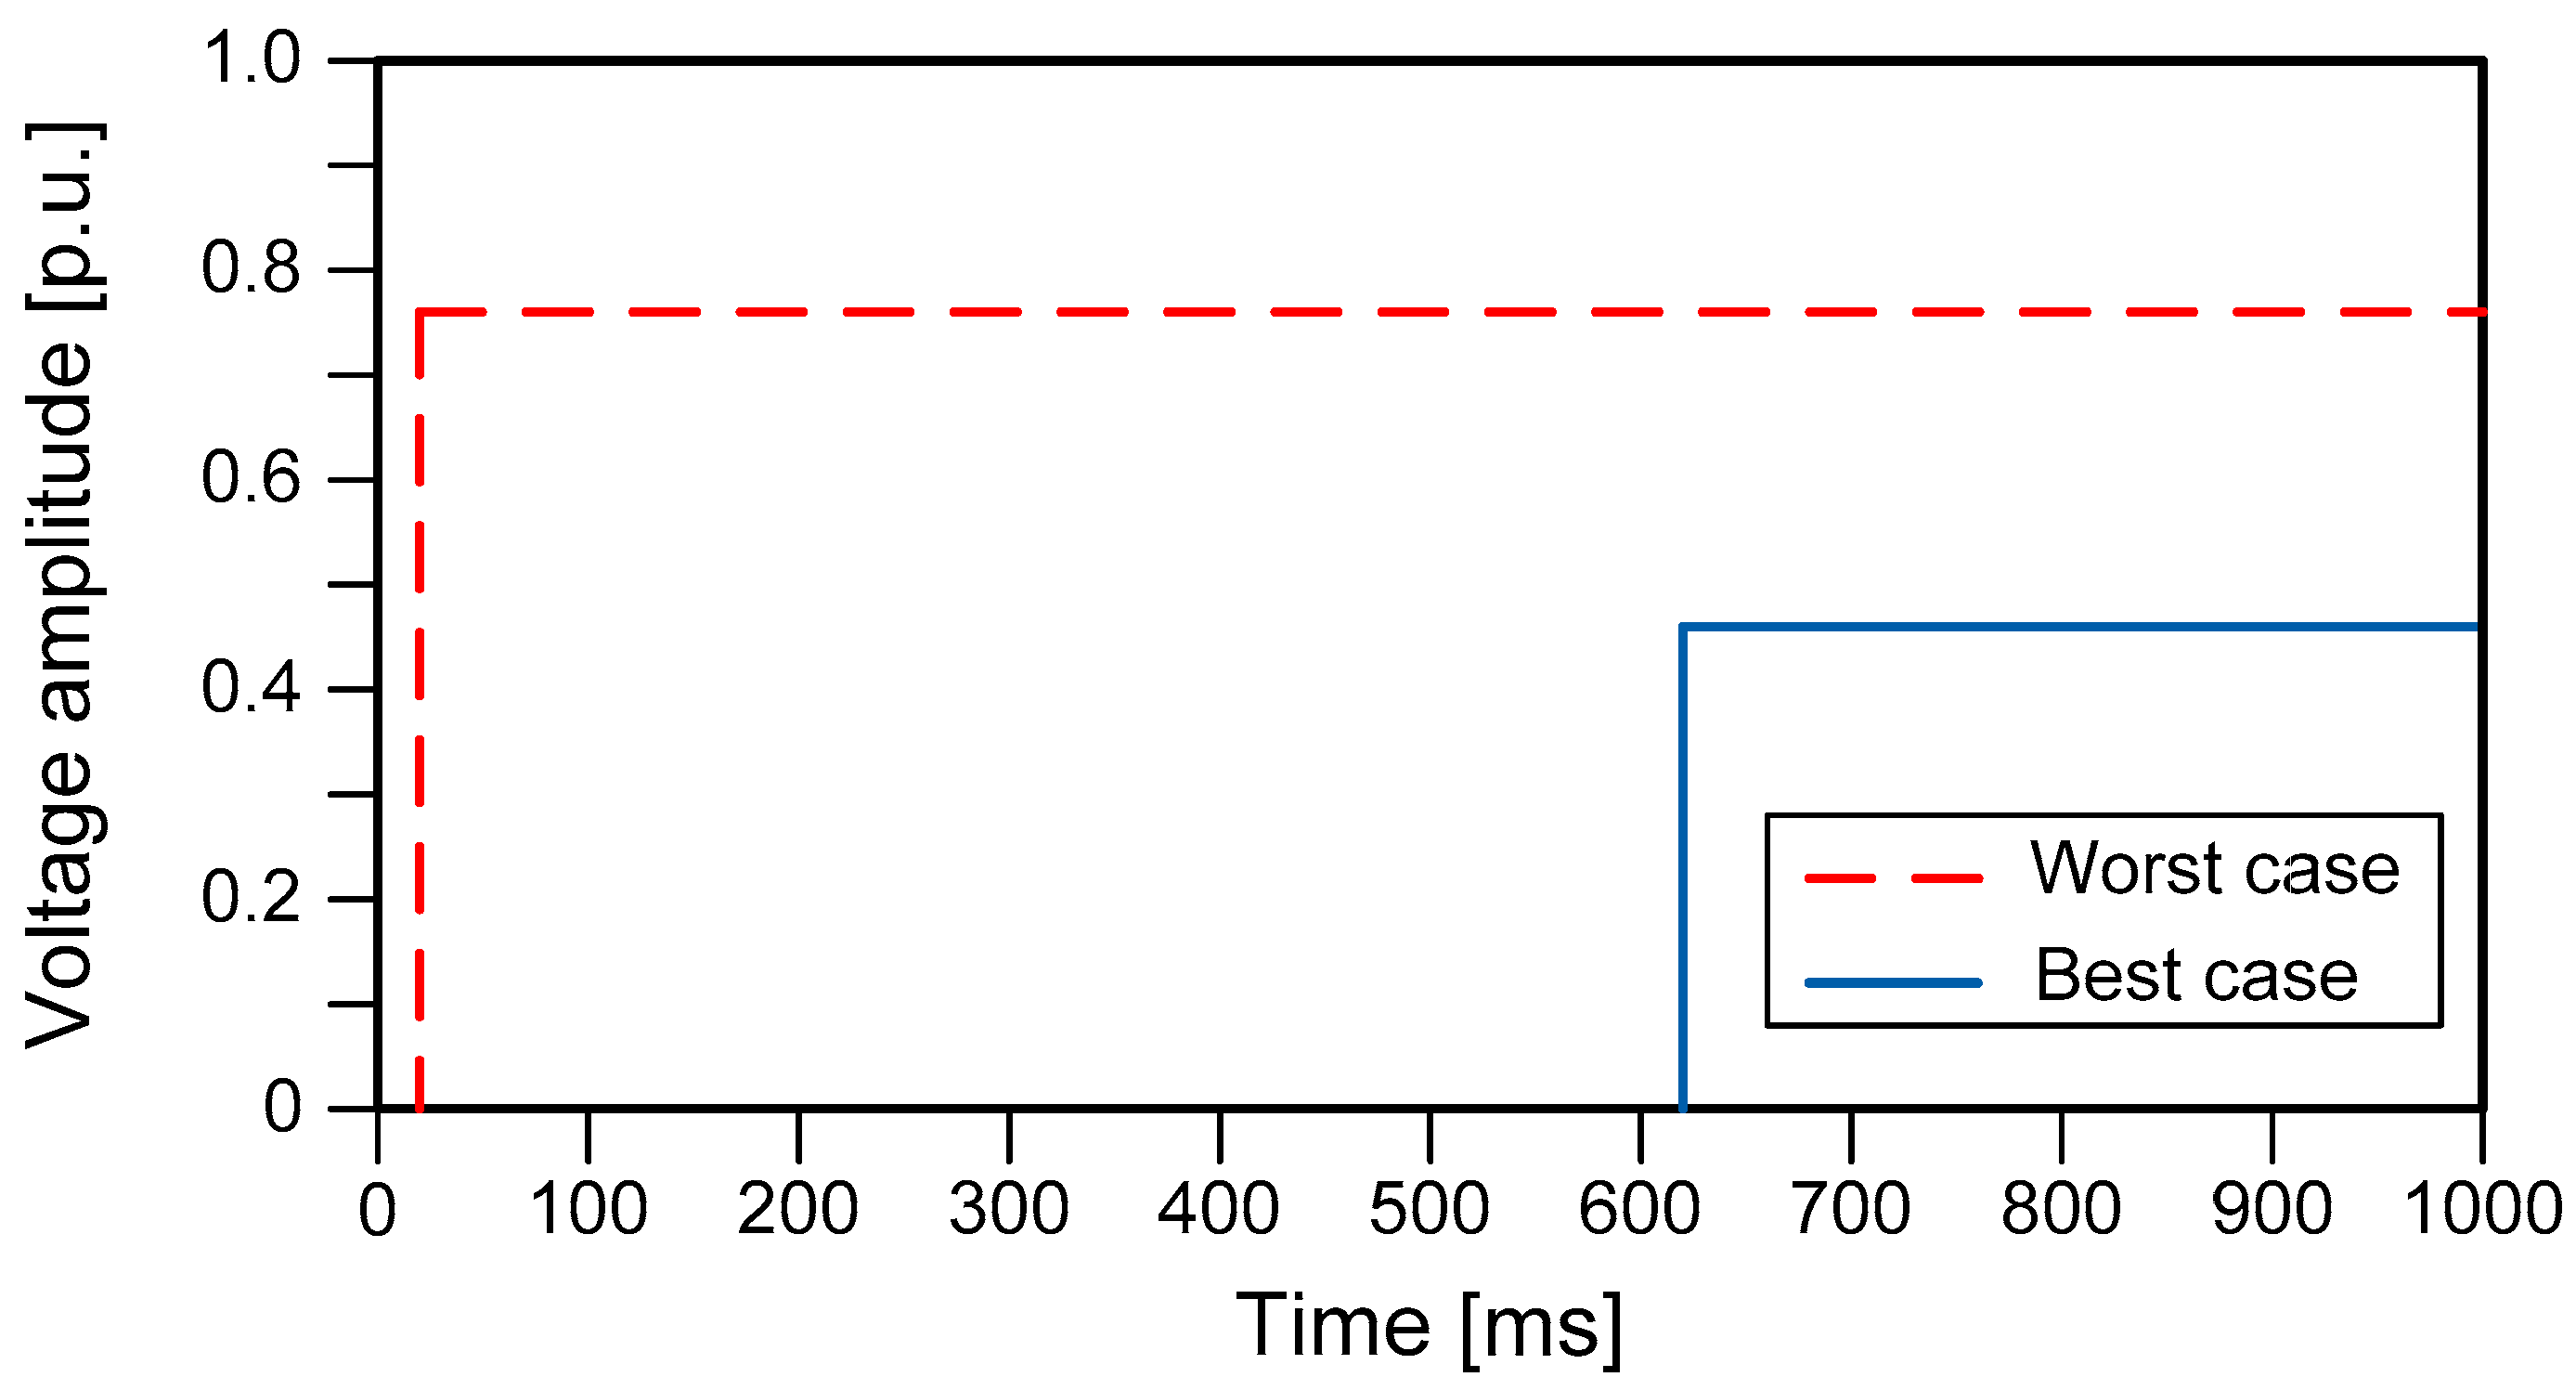
2.2.1. Adjustable Speed Drive—ASD

ASDs are equipment widely used in industries to drive induction motors for better process control. In addition to reducing thermal and mechanical stress during starting and breaking the motors, they optimize the use of energy in applications that require variable torque or reduced speeds [20].
To evaluate the performance of a three-phase equipment, it must be taken into account that different types of voltage sags results and their different effects on their operation [20,25]. Figure 3 shows sensitivity curves obtained from ASDs, referring to the type I event (most severe reduction in voltage in one of the phases). It can be seen in Figure 3 that the ASDs had different levels of sensitivity.

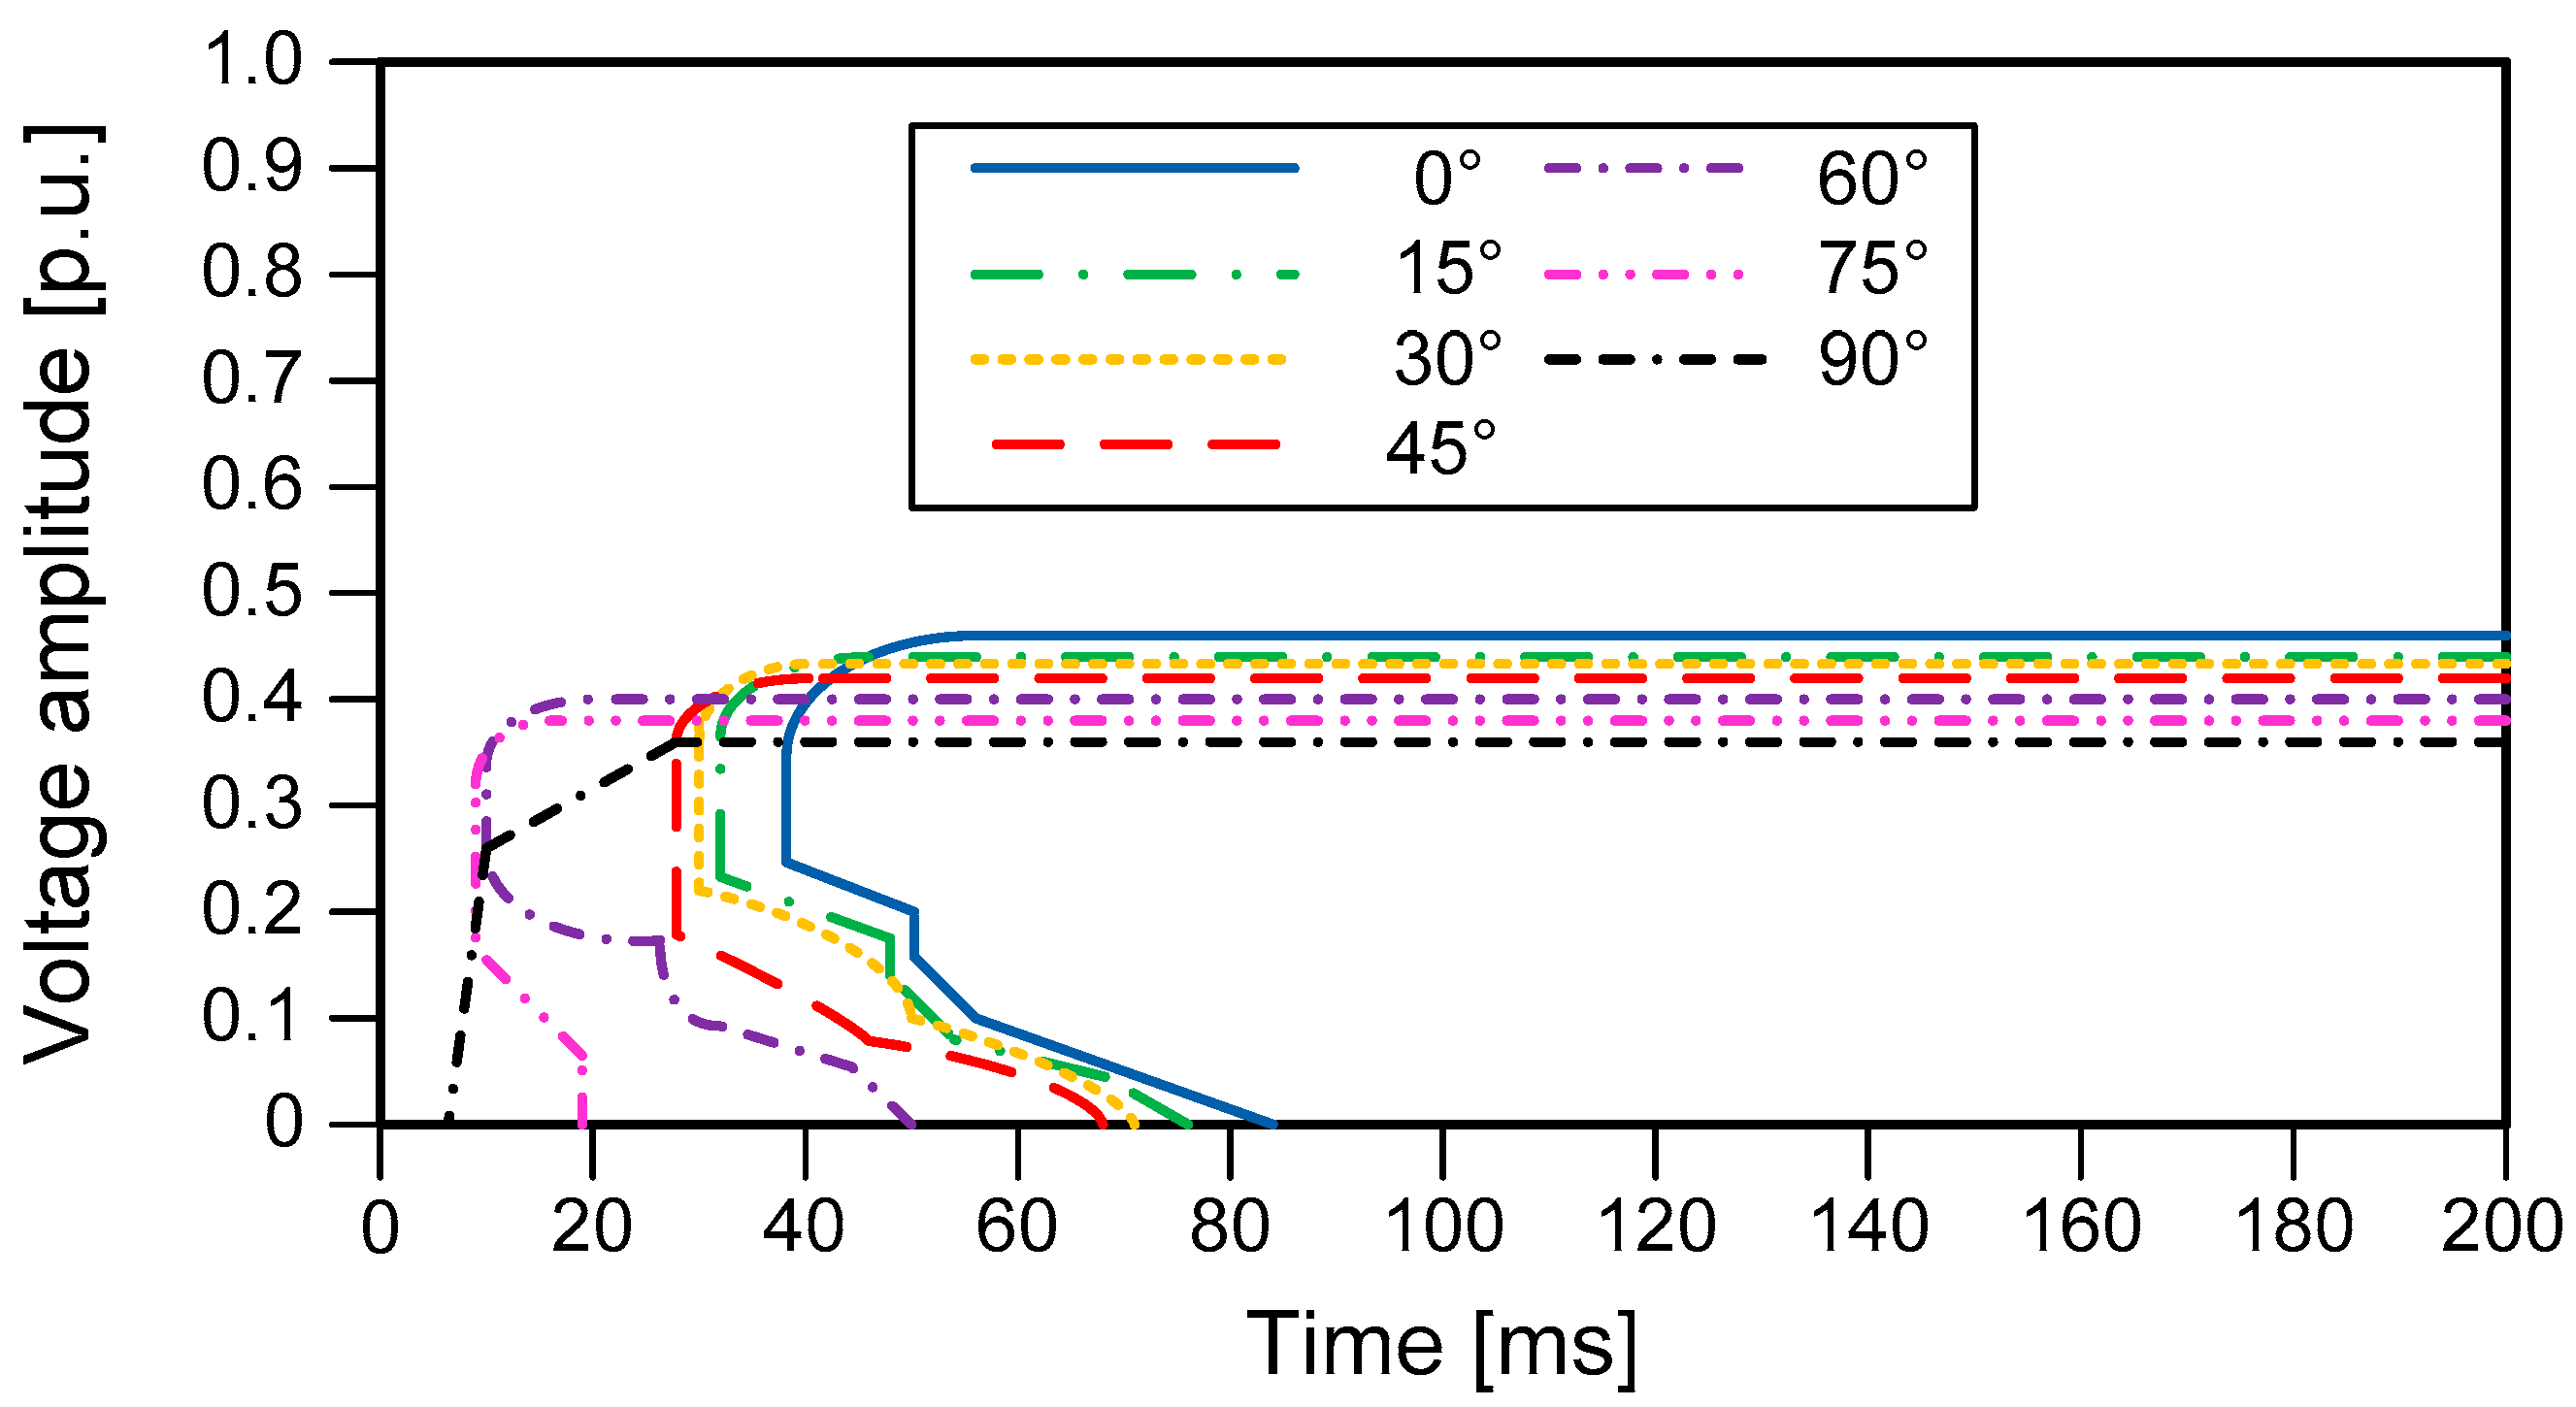
2.2.2. Programmable Logic Controller—PLC

The programmable logic controller—PLC, is a digital system that performs control and monitoring functions through a set of instructions previously defined by the user. The basic structure of its circuit is formed by: power supply, processing unit (CPU), and signal input and output modules, which can be digital or analog [21].
Figure 4 shows the sensitivity curves obtained through tests on several PLCs, illustrating the “worst case” and “best case”. In the worst case, the sensitivity of the PLC was 0.75 p.u.

2.2.3. Contactor

The contactor is an electromechanical device that controls loads from a command circuit, it is one of the most used devices in the industry [22,23,24]. The starting point of the event is also an important parameter in evaluating the performance of this equipment [19,22,23,24], as shown in the sensitivity curve of Figure 5.

3. Methods

The methodology used in the research adopted a procedure similar to that used in [2,9,14] and was divided into four stages:
  • Preparation of the survey form;
  • Selection of companies;
  • Field survey;
  • Analysis of the results.

3.1. Preparation of the Survey Form

The form was prepared with the objective of obtaining detailed data on:
  • Type of industrial activity, contracted demand, supply voltage, installed loads;
  • Industry opening hours, number of employees;
  • Critical parts of the process, identification of sensitive equipment, number of process shutdowns, types of losses, and critical period of the day;
  • Overtime to recover lost production, lost raw material, investments to mitigate shutdowns.
The proposed form contained 19 questions, the content of which was prepared on the basis of Annex 2 of [26,27]. The questions contained in the survey form and their justifications are shown in Appendix A.
Therefore, it is noteworthy that this form was intended to obtain, in a more realistic way, the data necessary for the survey of process shutdown costs for each industrial activity due to the occurrence of voltage sag or short interruption.

3.2. Selection of Companies

The energy distributor that financed the research project (EDP), together with the researcher, generated a list of companies that could participate in the survey, from a total of 70 industries.
The selection criteria were: companies that “most complain” about process shutdowns due to the occurrence of events in the concessionaire’s network; to contemplate in the research the largest possible number of types of activities; geographic location of the consumer units and to select from the sample companies located in two different states, the state of São Paulo and Espírito Santo.
Among the 70 selected industries, the established goal is to obtain at least 30 responses, considering that some would not be interested in participating in the survey due to confidentiality issues or because they do not have data available to be provided.

3.3. Field Survey

As a general strategy for conducting the visits, the following procedure was adopted:
  • Schedule visits in advance with the assistance of the electric utility;
  • Clarify the client about the survey objectives and send the survey form in advance to be evaluated and filled out.
As an operational strategy, visits should be carried out as follows:
  • The researcher was always accompanied by an EDP representative. On the day of the visit, the objectives of the survey were explained again and its importance clarified, both in relation to the academic sphere, as well as the business aspect of customer service;
  • When possible, the plants of the companies’ production process were visited, in order to understand the manufacturing process, identifying the critical parts of the process, in order to better understand the causes of the shutdowns due to the occurrence of voltage sags and short interruptions.
An important point of the survey was to have the survey form filled out by the technician responsible for the visited company. If the questions were not answered previously, the researcher must ask the questions verbally in the meeting on the day of the visit, in order to obtain the necessary data to complete the form.

3.4. Analysis of the Results

The results obtained with the application of the survey forms were treated statistically and organized into tables and graphs in order to facilitate the display, interpretation, and analysis.

4. Case Study

4.1. Results

Among the 70 pre-selected companies, 11 withdrew from the survey, so 59 were visited between May and November 2019 and 33 responded in full to the survey form.
Table 2 shows the list of companies containing the type of activity, the size of the company, and a column of observations that presents some additional information.
Table 3 shows, for each company, the sensitive equipment used in its processes, the average number of monthly shutdowns, and the average time to resume production when the process stops.
Table 4 shows, for each company surveyed, the demand, the cost per event, the cost per demand, and other information about additional costs such as payment of fines, rework, and repairs of equipment damaged by the occurrence of voltage sag or short interruption.

4.2. General Analysis

Considering all the companies surveyed, boxplots were generated for the number of employees, number of events per month, breakdown time, demand for electricity, cost per event, and cost per demand.
Figure 6 shows the boxplot of the number of employees; in this case, there were no data considered to be outliers. The average value of the number of employees found was 349 and the boxplot demonstrates that, in general, the research was focused on small and medium-sized companies.
Figure 7 presents the boxplot of the number of voltage sags or short interruptions per month, as noted, there are 4 companies with a number of events considered to be outliers. In average terms, there are approximately 8 events per month, which can be considered a high value, since depending on the type of product manufactured, a single process shutdown can generate major losses.
Figure 8 shows the boxplot for the breakdown time, which corresponds to the time necessary for the company to resume production when a process shutdown occurs. There is only one outlier, most companies had a breakdown time between 10 min and 60 min, and the average was 50.76 min.
The graph in Figure 9 corresponds to the boxplot of electricity demand, which presented a discrepant value (company 30). The average demand for electricity is 1423.48 kW, with a large concentration of companies in the range from 500 kW to 2500 kW, reinforcing that the majority of companies surveyed were small and medium-sized.
Figure 10 shows the boxplot of cost per event, it was observed that there were two outliers, companies 17 and 33, that presented a cost per event much higher than the other companies surveyed due to the high added value of the product. It was also noted that the average cost related to the occurrence of voltage sag and short interruption was US $7364.75, with the minimum and maximum values being US $556.00 and $13,049.00, respectively.
Figure 11 presents the boxplot of costs per demand, where companies 17, 27, 31, and 33 were characterized as outliers. It was observed that the average found was US $6.72/kW and that there was a large concentration of companies in the range of US $2.00/kW to US $6.00/kW.
It is worth mentioning that considering the average values found for the number of events per month (8) and the average cost per event (US $7364.75), there was an estimate of the average annual cost due to voltage sags and short interruption of US $707,016.00. The magnitude of this value shows the importance of assessing the economic impacts of these events and when viable to use energy conditioners to mitigate these costs.
Another analysis that can be done is whether the company’s electricity demand correlates with the cost per event or the cost per demand. The graph in Figure 12 shows the dispersion and the correlation coefficient between cost per event and demand, while Figure 13 shows the same information between the variables cost per demand and demand.
Due to the low correlation coefficient found in both cases (r = 0.22 and r = −0.13 respectively), it can be concluded that demand did not affect the cost per event or cost per demand, probably the main variable that influences costs was the added value of the product generated.

4.3. Analyzes by Type of Activity

Among the 33 companies analyzed, 12 different types of activities were identified. Table 5 presents the demand, cost per event, and cost per demand, data obtained for the different types of activity. The foundry, galvanizing, aluminum extrusion, and umbilical cable industries were included in the metallurgical activity, since they produce products designed for this purpose. The toy industry was considered in the activity of the plastic industry, since they are manufactured by polymer injection machines.
Table 5 shows that the largest number of visits were made to the plastics industry, corresponding to 24.24% of the total number of companies visited whose costs per event and cost per demand ranged from US $1640.00 to US $9667.00 and US $1.40 to US $13.26, respectively. This wide range of values is due to the fact that the types of products produced have different aggregate values. The average cost per event found was US $4943.00 and the cost per demand was US $4.79.
The automotive industries represented 12.12% of the total visited companies and their costs were very close to each other, ranging from US $6000.00 to US $6847.00 for auto parts, although each company manufactures a specific product, and US $13,048.00 for the automaker. Average costs per event and demand were US $7947.50 and US $3.39, respectively.
The commercial activity sector had three companies visited, representing 9.09% of the companies, and the costs per event obtained ranged from US $2717.00 to US $9311.00, presenting an average of US $6293.00, while the average cost per demand was US $3.03. In this activity, 2 shopping centers and 1 storage shed were grouped.
The two glass industries had an average cost per event of US $1799.00 and the cost per demand of US $4.42, remembering that the glass companies visited were destined to the construction sector.
Metallurgical industries accounted for 18.18% of the visits and presented cost values per event from US $556.00 to US $52,800.00, with an average of US $10,787.67. In this activity, small metal smelting and galvanizing companies were grouped, which produce raw materials for metallurgical industries. The extruded umbilical optical cable industry was also grouped, for its use in deep waters, for the extraction of oil, whose cost of production shutdown is high.
In the food industries, it was observed that the costs per event were very different. The factory dedicated to animal feeding had a lower value, while the beverage manufacturer had a higher cost. In the latter case, the operation of resuming the unit was complex, since there was a need to wash the production lines, increasing the time to resume the process.
The two companies in the furniture sector had the cost per event values very close with an average of US $7195.50 and cost per demand of US $9.23, demonstrating that possibly this value is typical in this type of activity.
The textile industries also had very close costs per event, ranging from US $1501.00 to US $1509.45. The average cost per demand obtained was US $2.51.
The rest of the activities surveyed, that is, mining, chemistry, stones and granites, and oil prospecting, had only one company in the sample and it was not possible to make a comparative analysis. However, it is noted that there was great variability in the values of cost per event in these industries, mainly due to the added value of the product that each company produces.
Figure 14 shows a graphical comparison between the average values of the cost per event of the types of activities surveyed. It should be noted that, with the exception of the petroliferous sector, the other sectors had an average cost close to each other and around US $6000.00. Therefore, the size of the company is probably a variable that also affects the cost per event.

4.4. Difficulties

The main difficulties faced in carrying out this survey were:
  • Planning visits, scheduling difficulties, and delay in responding to the interest in participating in the survey;
  • Difficulty in logistics and locomotion to visit companies. The distance between the city of São Paulo, where the researcher resides, and the companies chosen in this state was around 150 km. Regarding the state of Espírito Santo, travel is only viable by air, since the distance between São Paulo and Espírito Santo is 1100 km.
Besides, during the field survey, it was noted the concern of the interviewees in not being able to provide their costs in detail, possibly due to fear of speculation from competing companies in the market. In general, companies consider costs to be a strategic part of business, even though the researcher had guaranteed data confidentiality and that the name of the company would not be disclosed.
Of the 59 companies visited, 13 did not respond to the questionnaire claiming that they had not received authorization from the board, in 9 companies it was not possible to obtain the data requested in the questionnaire during the visit, and 4 companies gave up on the survey. In summary, 26 companies did not participate in the survey, which represented 44% of the total visited.
Of the 33 companies visited, 10 medium-sized companies requested that their names be kept confidential. In small companies, almost all agreed to have their names revealed, including allowing costs to be disclosed. However, for reasons of consistency, the authors chose not to disclose the name of any researched company.

5. Conclusions

The literature review presented in Section 1.2 proves that in fact, several types of industries installed in different countries face problems of loss of production due to the occurrence of voltage sags and short interruptions. It was found that several procedures are used to obtain an estimate of these costs, which are: conducting research through forms, conducting stochastic simulations, and conducting measurements. Cost estimates are presented on an annual basis, per event, and per interrupted kW. Despite the significant number of branches of activity surveyed in the publications, it was observed that the costs obtained in different countries for the same productive sector are very disparate.
This work presented and applied a survey methodology with the objective of evaluating the financial impact of voltage sags and short interruptions on industrial and commercial consumers. The methodology is based on conducting on-site visits and applying a specific questionnaire containing a total of 19 questions.
The survey results made it possible to quantify the losses involved in 33 small and medium-sized companies, with an average number of 349 employees, grouped in 12 business areas, all supplied in medium voltage networks (11.9 kV and 13.8 kV). The average cost obtained was US $7364.75 per event and US $6.72/kW interrupted.
We conclude that this work achieved the objectives initially established, representing an effective contribution to the electricity sector, especially for the Brazilian sector.
As a proposal to continue this line of research, it is recommended to contemplate other segments of activities and expand the sample size of the segments already researched (food industry, furniture, mining, stones and granites, oil).
Regarding the success rate of response to the form, considering that the initial sample was 70 companies, with 33 responses to the survey form, the rate was 47.1%, however, considering the sample of 59 companies due to withdrawal of 11 companies, the rate becomes 55.9%.
As improvements to the procedure used, it is proposed to take actions to publicize the survey in advance, such as the holding of a workshop with wide participation of companies, with the objective of attracting and motivating the participation of consumers. With this attitude, it is believed that the percentage of participation could be improved.

Author Contributions

Conceptualization, É.M.M., J.M.d.C.F. and P.M.d.S.; data curation, É.M.M. and P.V.G.d.S.; formal analysis, É.M.M., J.M.d.C.F. and P.M.d.S.; funding acquisition, N.B.P.; investigation, É.M.M. and J.M.d.C.F.; methodology, É.M.M., J.M.d.C.F. and P.M.d.S.; project administration, J.M.d.C.F. and P.M.d.S.; supervision, J.M.d.C.F. and P.M.d.S.; validation, É.M.M. and J.M.d.C.F.; writing—original draft, É.M.M. and P.V.G.d.S.; writing—review and editing, É.M.M., J.M.d.C.F., P.M.d.S. and P.V.G.d.S. All authors have read and agreed to the published version of the manuscript.

Funding

The authors gratefully acknowledge the financial support of Capes, CnPq, Fapemig, and EDP.

Institutional Review Board Statement

Not applicable.

Informed Consent Statement

Not applicable.

Data Availability Statement

The data presented in this study are contained in the article.

Acknowledgments

The authors thank the support of EDP in providing the data used in this study and are also grateful for the technological support provided by the Federal University of Itajubá.

Conflicts of Interest

The authors declare no conflict of interest.

Appendix A

Following is the survey form:
1. 
Company name.
2. 
Main type of activity.
3. 
Average monthly demand, consumption and supply voltage.
Questions 1 to 3 aim to identify the company, its type of activity, as well as its demand, consumption, and supply tension.
4. 
Opening hours of the company.
5. 
Number of employees of the company.
Questions 4 and 5 seek to obtain the production regime, the number of work shifts and to identify the size of the company.
6. 
Types of loads and processes installed.
7. 
How many processes shutdowns have occurred due to voltage sags and short interruptions in the last 12 months?
Questions 6 and 7 seek to know the purpose of energy use and the types of loads installed in the industry. It also seeks to identify the number of process stops due to voltage sag or short interruption.
8. 
Considering voltage sag and short interruption identify the events that have the greatest impact (instantaneous, momentary, and temporary).
Question 8 aims to know, in a qualitative way, the interviewees’ perception regarding process shutdowns, their frequencies and their impacts on the process and to identify the types of most impactful events.
9. 
What is the critical period of the day that the occurrence of a voltage sag or short interruption causes more losses?
10. 
Which equipment in your company is most sensitive to voltage sag or short interruption?
Questions 9 and 10 seek to verify, in a qualitative way, if there is a period of the day that presents a higher frequency of voltage sag or short interruption that directly affects the company in terms of process shutdowns. In addition, they aim to identify sensitive loads and the interviewees’ perception of whether these loads have or not correlations with the process shutdowns.
11. 
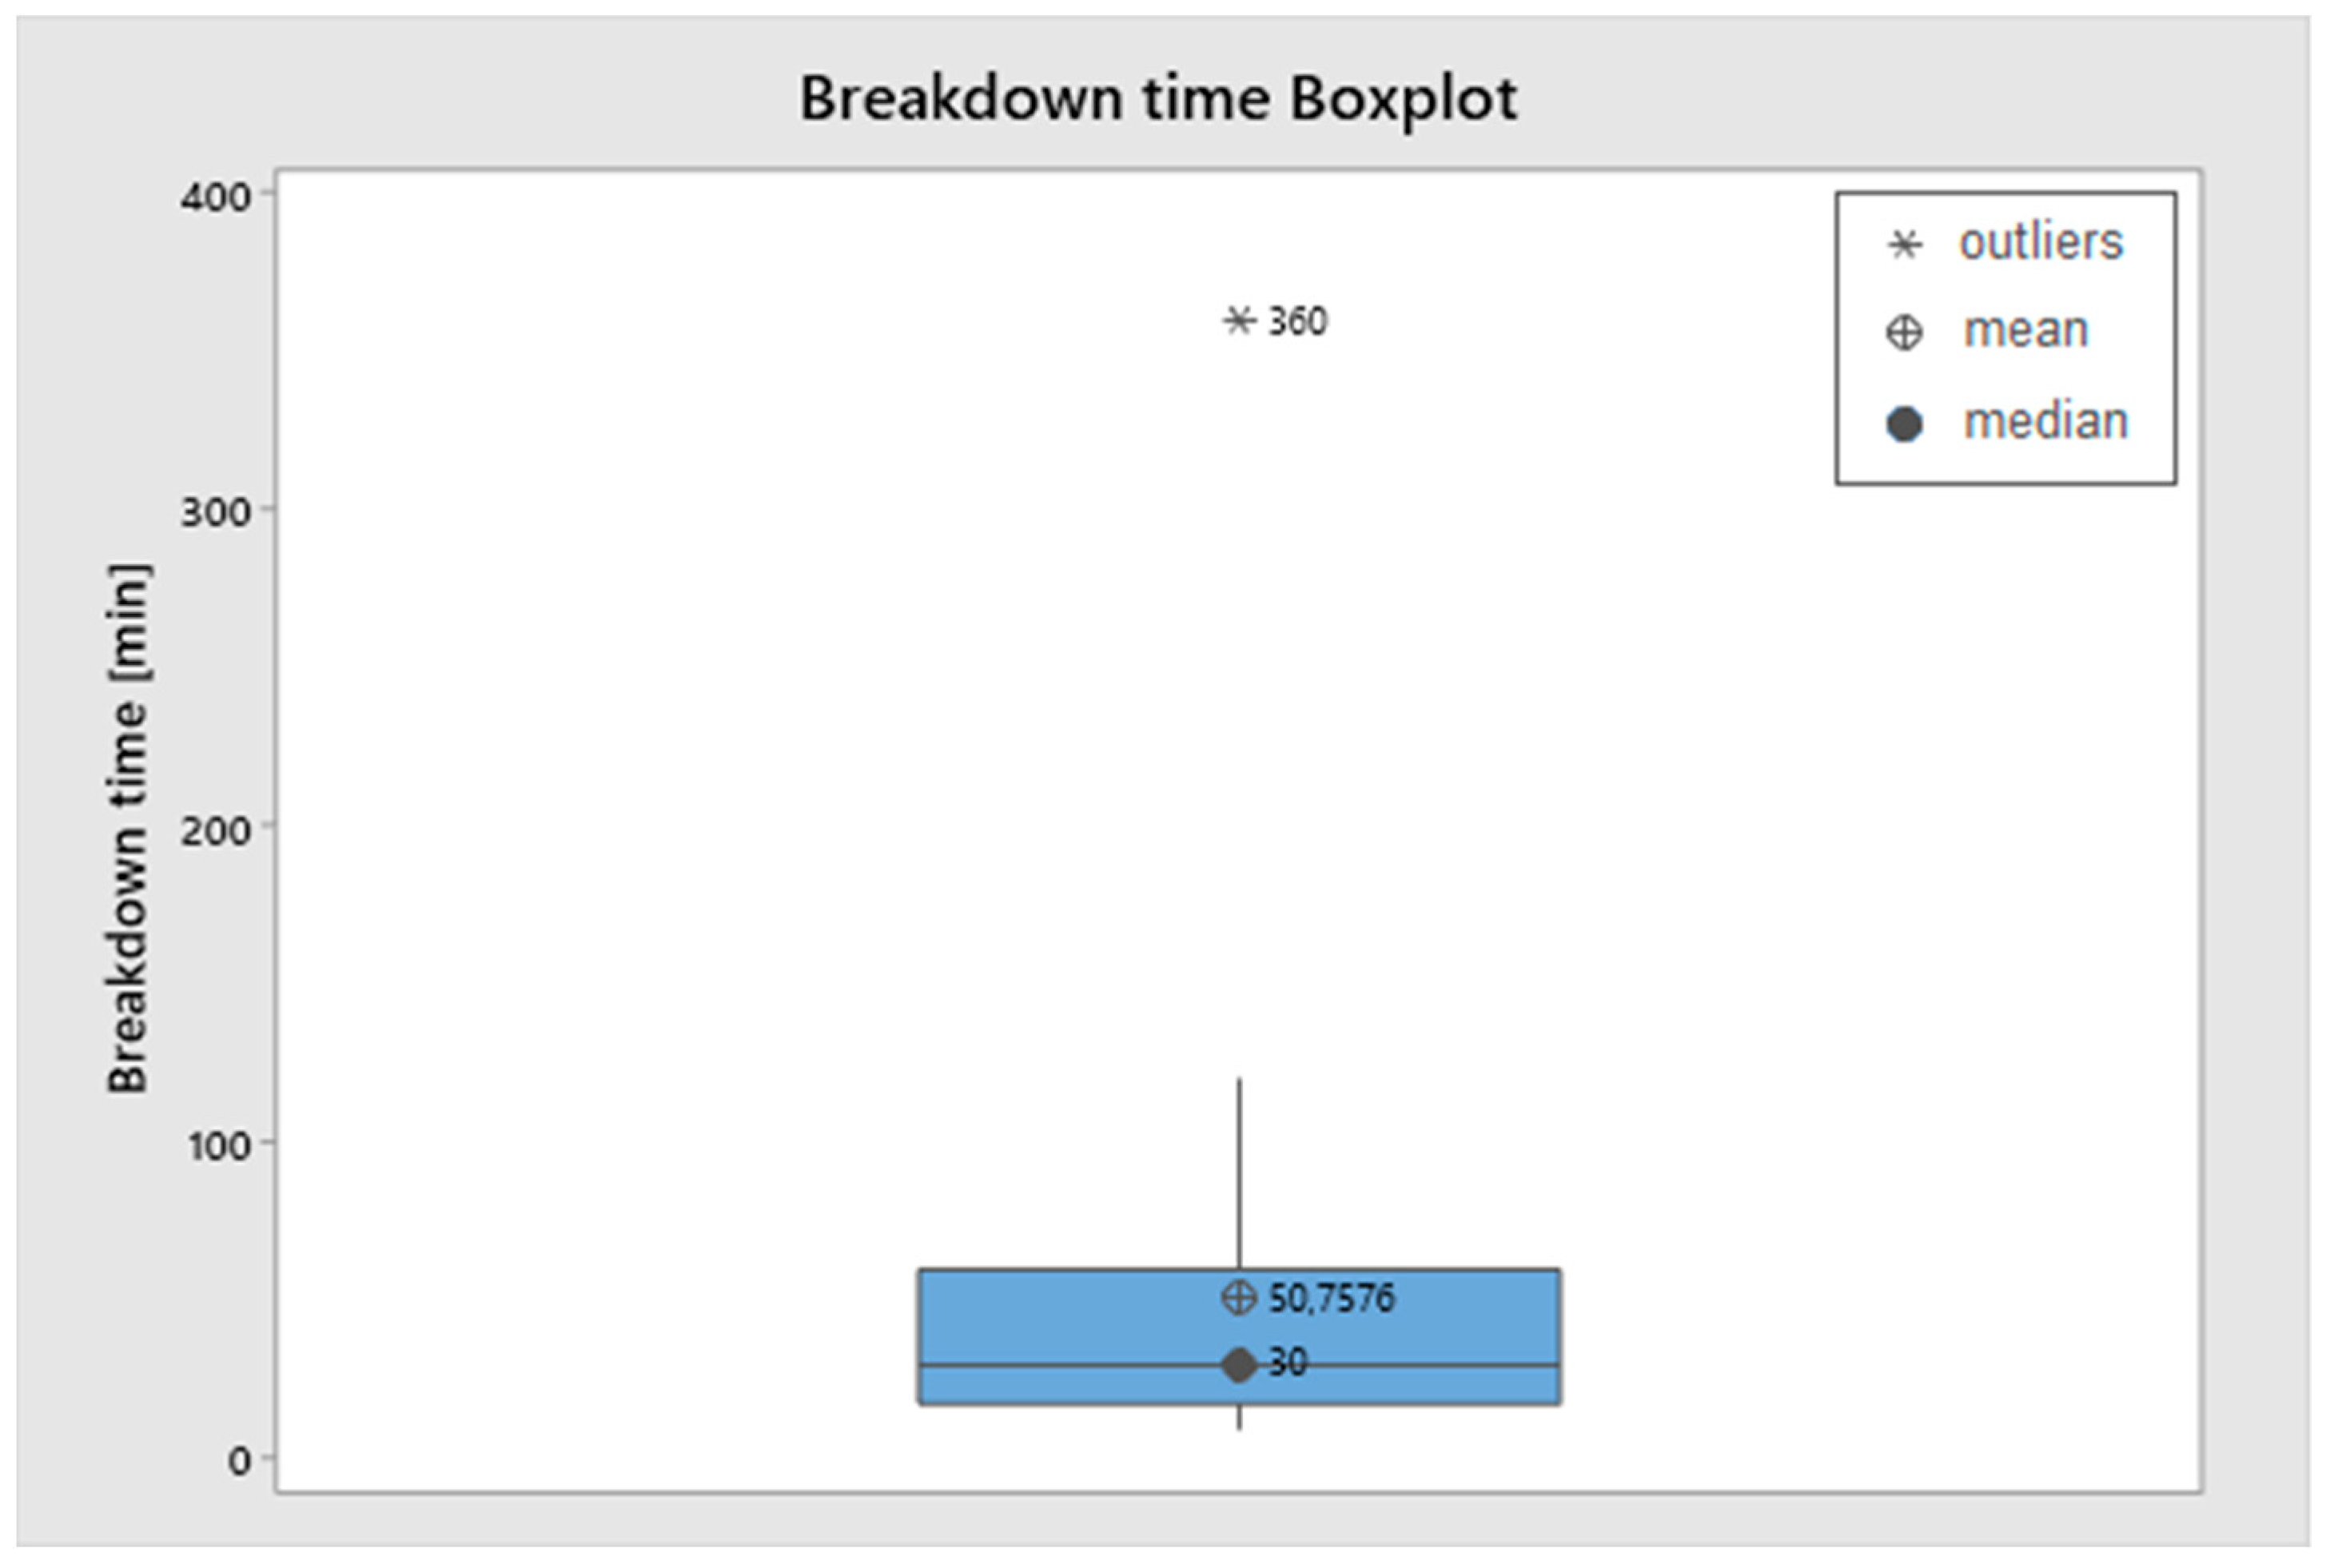
How long would it take to resume production or operation if there was an unexpected process shutdown?
Question 11 seeks to determine the time taken to resume the production process.
12. 
When there is an unexpected process shutdown due to voltage sag or short interruption, what type of damage or loss does the company have, and to what extent?
This question aims to verify whether it is possible to detail each item that makes up the total cost of the loss according to the specifics of each industrial activity.
13. 
Considering a day and a period of high production, what is the estimated cost of restarting production/operation and the loss of production/operation/billing that your company would have in that period if there was an unexpected process shutdown due to voltage sag and short interruption?
Question 13 is complementary to the previous one, in order to verify whether there is also a lost profit.
14. 
Does the company pay overtime to employees in order to recover production or billing losses, even to end interrupted production, due to an unexpected process shutdown due to voltage sag and short interruption? If so, could the expenditure on the payment of such overtime be estimated?
This question aims to verify, in qualitative and quantitative terms, whether there is payment of overtime to employees due to the occurrence of voltage sag and short interruption.
15. 
Does your company have raw material, product in process, or finished product that would be discarded due to an unexpected process shutdown? If so, could you estimate the cost related to these losses?
This question aims to verify, depending on the company’s activity, if there is a loss of raw material, finished product or in processing, in addition to obtaining the associated costs.
16. 
Does the company have expenses for repairs and replacement of damaged equipment due to an unexpected process shutdown? If so, could you estimate the cost related to this?
Question 16 is intended to verify if there are expenses with repairs and replacement of equipment damaged due to voltage sag and short interruption.
17. 
Would the company have, in addition to the factors mentioned above, any other type of loss if an unexpected process shutdown occurred due to voltage sag and short interruption? If so, which one? Could you estimate the cost related to this other factor?
The question aims to verify if there is another type of cost due to an unexpected process shutdown.
18. 
Does the company have procedures or equipment to monitor voltage sags and short interruptions? If yes, detail the type of monitoring.
This question is intended to find out if the company has voltage sag or short interruption monitoring procedures or equipment.
19. 
What does your company do to mitigate voltage sag and short interruption? And what is the investment for that?
This question aims to find out if the company invests in equipment to mitigate voltage sag or short interruption.

References

  1. MCGranaghan, M.; Roettger, B. Economic Evaluation of Power Quality. IEEE Power Eng. Rev. 2002, 22, 8–12. [Google Scholar] [CrossRef]
  2. LaMedica, R.; Esposito, G.; Tironi, E.; Zaninelli, D.; Prudenzi, A. A survey on power quality cost in industrial customers. In Proceedings of the 2001 IEEE Power Engineering Society Winter Meeting. Conference Proceedings (Cat. No.01CH37194), Columbus, OH, USA, 28 January–1 February 2001. [Google Scholar]
  3. Heine, P.; Pohjanheimo, P.; Lehtonen, M.; Lakervi, E. A method for estimating the frequency and cost of voltage sags. IEEE Trans. Power Syst. 2002, 17, 290–296. [Google Scholar] [CrossRef]
  4. Quaia, S.; Tosato, F. A method for the computation of the interruption costs caused by supply voltage dips and outages in small industrial plants. In Proceedings of the IEEE Region 8 EUROCON 2003, Computer as a Tool, Ljubljana, Slovenia, 22–24 September 2003; Volume 2, pp. 249–253. [Google Scholar] [CrossRef]
  5. Gupta, C.P.; Milanovic, J.V. Costs of Voltage Sags: Comprehensive Assessment Procedure. In Proceedings of the IEEE Russia Power Tech, St. Petersburg, Russia, 27–30 June 2005; pp. 1–7. [Google Scholar] [CrossRef]
  6. Milanovic, J.V.; Gupta, C.P. Probabilistic Assessment of Financial Losses due to Interruptions and Voltage Sags-Part I: The Methodology. IEEE Trans. Power Deliv. 2006, 21, 918–924. [Google Scholar] [CrossRef]
  7. Milanovic, J.V.; Gupta, C.P. Probabilistic Assessment of Financial Losses due to Interruptions and Voltage Sags—Part II: Practical Implementation. IEEE Trans. Power Deliv. 2006, 21, 925–932. [Google Scholar] [CrossRef]
  8. Goswami, A.K.; Gupta, C.P.; Singh, G.K. Assessment of Financial Losses due to Voltage Sags in an Indian Distribution System. In Proceedings of the 2008 IEEE Region 10 and the Third international Conference on Industrial and Information Systems, Kharagpur, India, 8–10 December 2008; pp. 1–6. [Google Scholar] [CrossRef]
  9. Kjølle, G.H.; Samdal, K.; Singh, B.; Kvitastein, O.A. Customer Costs Related to Interruptions and Voltage Problems: Methodology and Results. IEEE Trans. Power Syst. 2008, 23, 1030–1038. [Google Scholar] [CrossRef]
  10. Carvalho Filho, J.M.; Leborgne, R.C.; Oliveira, T.C.; Oliveira, J.F.; Watanabe, G.T. Voltage Sag Cost Assessment Based on Power Flow Reduction and Non Supplied Energy. In Proceedings of the 2009 IEEE Power & Energy Society General Meeting, Calgary, AB, Canada, 26–30 July 2009. [Google Scholar]
  11. Cebrian, J.C.; Kagan, N. Hybrid Method to Assess Sensitive Process Interruption Costs Due to Faults in Electric Power Dis-tribution Networks. IEEE Trans. Power Deliv. 2010, 25, 1686–1696. [Google Scholar] [CrossRef]
  12. Goswami, A.K.; Gupta, C.P.; Singh, G.K. Cost-benefit analysis of voltage sag mitigation methods in cement plants. In Proceedings of the 2014 16th International Conference on Harmonics and Quality of Power (ICHQP), Bucharest, Romania, 25–28 May 2014; pp. 866–870. [Google Scholar]
  13. Salim, F.; Nor, K.M.; Said, D.M.; Rahman, A.A.A. Voltage sags cost estimation for malaysian industries. In Proceedings of the 2014 IEEE International Conference on Power and Energy (PECon), Kuching, Sarawak, 1–3 December 2014; pp. 41–46. [Google Scholar]
  14. Chen, W.; Ding, C.; Wang, L.; Zhu, X. Economic analysis of voltage sag loss and treatment based on on-site data. In Proceedings of the 2016 China International Conference on Electricity Distribution (CICED), Xi’an, China, 10–13 August 2016; pp. 1–4. [Google Scholar]
  15. Behera, C.; Banik, A.; Nandi, J.; Dey, S.; Reddy, G.H.; Goswami, A.K. Assessment of Financial Loss Due to Voltage Sag in an Industrial Distribution System. In Proceedings of the 2019 IEEE 1st International Conference on Energy, Systems and Information Processing (ICESIP), Chennai, India, 4–6 July 2019; pp. 1–6. [Google Scholar]
  16. Somrak, T.; Tayjasanant, T. Minimized Financial Losses Due to Interruptions and Voltage Sags with Consideration of Investment Cost. In Proceedings of the 2019 IEEE PES GTD Grand International Conference and Exposition Asia (GTD Asia), Bangkok, Thailand, 19–23 March 2019; pp. 29–34. [Google Scholar]
  17. He, H.-Y.; Zhang, W.-H.; Wang, Y.; Xiao, X.-Y. A Sensitive Industrial Process Model for Financial Losses Assessment Due to Voltage Sag and Short Interruptions. IEEE Trans. Power Deliv. 2020. [Google Scholar] [CrossRef]
  18. Institute of Electrical and Electronics Engineers IEEE Std 1159-2009: IEEE Recommended Practice for Monitoring Electric Power Quality; IEEE: New York, NY, USA, 2009. [CrossRef]
  19. Escribano, A.H.; Gómez-Lázaro, E.; Molina-García, A.; Fuentes, J. Influence of voltage dips on industrial equipment: Analysis and assessment. Int. J. Electr. Power Energy Syst. 2012, 41, 87–95. [Google Scholar] [CrossRef]
  20. Djokic, S.; Stockman, K.; Milanovic, J.; Desmet, J.; Belmans, R. Sensitivity of AC adjustable speed drives to voltage sags and short interruptions. IEEE Trans. Power Deliv. 2005, 20, 494–505. [Google Scholar] [CrossRef]
  21. Wu, Y.; Li, C.; Xu, Y.; Wei, P. Characterizing the tolerance performance of PLCs to voltage sag based on experimental research. In Proceedings of the 2016 IEEE PES Asia-Pacific Power and Energy Engineering Conference (APPEEC), Xi’an, China, 25–28 October 2016; pp. 496–501. [Google Scholar]
  22. Djokic, S.; Milanovic, J.; Kirschen, D. Sensitivity of AC Coil Contactors to Voltage Sags, Short Interruptions, and Undervoltage Transients. IEEE Trans. Power Deliv. 2004, 19, 1299–1307. [Google Scholar] [CrossRef]
  23. Kanokbannakorn, W.; Saengsuwan, T.; Sirisukprasert, S. The modeling of AC magnetic contactor for immunity studies and voltage sag assessment. In Proceedings of the The 8th Electrical Engineering/ Electronics, Computer, Telecommunications and Information Technology (ECTI) Association of Thailand—Conference 2011, Khon Kaen, Thailand, 17–19 May 2011; pp. 621–624. [Google Scholar]
  24. Shareef, H.; Marzuki, N.; Mohamed, A.; Mohamed, K. Experimental Investigation of ac contactor ride through capability during voltage sag. In Proceedings of the 2010 9th International Conference on Environment and Electrical Engineering, Institute of Electrical and Electronics Engineers (IEEE), Cappadocia, Turkey, 16–19 May 2010; pp. 325–328. [Google Scholar]
  25. Cigre/Cired/Uie Joint Working Group C4.110 Voltage Dip Immunity of Equipment and Installations; Cigre Technical Brochure 412; CIGRE: Paris, France, 2010.
  26. Magalhaes, C.H.N. Recursos Operativos no Planejamento de Expansão de Sistemas de Potência. Doctoral Thesis, Universidade de São Paulo–USP, São Paulo, Brazil, 23 March 2009. (In Portuguese). [Google Scholar]
  27. Pelegrini, M.A.; Almeida, C.F.M.; Kondo, D.V.; Magalhaes, C.H.; Silva, F.T.; Baldan, S.; Filho, F.C.S.; Garcia, V.V. Survey and applications of interruption costs in large customers. In Proceedings of the 2012 IEEE 15th International Conference on Harmonics and Quality of Power, Hong Kong, China, 17–20 June 2012; pp. 860–864. [Google Scholar]
Figure 1. Voltage sag.
Energies 14 02874 g001
Figure 2. Equipment voltage tolerance curve.
Energies 14 02874 g002
Figure 3. ASD sensitivity curves type I.
Energies 14 02874 g003
Figure 4. Sensitivity curves referring to the PLC.
Energies 14 02874 g004
Figure 5. Contactor sensitivity curves for different starting points.
Energies 14 02874 g005
Figure 6. Boxplot (Number of employees).
Energies 14 02874 g006
Figure 7. Boxplot (Events per month).
Energies 14 02874 g007
Figure 8. Boxplot (Breakdown time).
Energies 14 02874 g008
Figure 9. Boxplot (Demand).
Energies 14 02874 g009
Figure 10. Boxplot (Cost per event).
Energies 14 02874 g010
Figure 11. Boxplot (Cost per demand).
Energies 14 02874 g011
Figure 12. Correlation (Cost per event × demand).
Energies 14 02874 g012
Figure 13. Correlation (Cost per demand × demand).
Energies 14 02874 g013
Figure 14. Scatter plot (Type of activity).
Energies 14 02874 g014
Table 1. Category of event, duration, and voltage magnitude.
Category TransitoryDurationVoltage Magnitude
Short-time durationInstantaneousVoltage sag0.5→to 30 cycles0.1 to 0.9 pu
MomentaneousInterruption0.5→to 30 cycles<0.1 pu
Voltage sag30 cycles to 3 s0.1 to 0.9 pu
TemporaryInterruption3 s to 1 min<0.1 pu
Voltage sag3 s to 1 min0.1 to 0.9 pu
Table 2. Company identification.
NumberActivity TypeCompany SizeObservation
1PlasticBig (1000 employees)Plastic film for food area
2AutomotiveMedium (560 employees)Locks and door handles
3TiresBig (1000 employees)Tires for cars
4TiresBig (1000 employees)Tires for cars
5CommercialMedium (300 employees)Space lease
6CommercialSmall (150 employees)Space lease
7WallpaperMedium (300 employees)Wallpaper
8MetallurgicalSmall (170 employees)Aluminum profiles
9ToysSmall (190 employees)Toys
10PVC PlasticMedium (400 employees)Plastic film for food area
11PVC PlasticMedium (800 employees)Plastic film for food area
12ElectroplatingSmall (35 employees)Pieces and parts
13ExtrusionSmall (49 employees)Metallurgical
14TextileSmall (120 employees)Wool fiber
15TextileSmall (70 employees)Dyeing clothes
16GlassSmall (80 employees)Glass for boxing, doors of residences
17ExtrusionMedium (500 employees)Use in deep sea waters
18PlasticMedium (300 employees)Packaging for food area
19FoundrySmall (50 employees)Freight train parts—Vale do Rio Doce
20Rock miningSmall (45 employees)Granules for civil industry
21GlassSmall (60 employees)Glass for boxing, doors of residences
22FoodSmall (250 employees)Pulp juices
23FurnitureMedium (300 employees)MDF boards
24FurnitureMedium (300 employees)MDF boards
25Animal foodSmall (50 employees)Animal food
26Stones and granitesSmall (250 employees)Manufacturing granite and marble sinks
27Chips cardsSmall (200 employees)Card for banks and general trade
28PlasticSmall (100 employees)Plastic packaging for food industry
29MetallurgicalMedium (300 employees)Vertical, horizontal movements
30CommercialBig (1000 employees)Space lease
31FertilizerSmall (100 employees)Packaging
32AutomotiveMedium (500 employees)Bus assembler
33PetroleumBig (1000 employees)Onshore oil prospecting
Table 3. Sensitive equipment, event history and breakdown time.
NumberActivity TypeSensitive EquipmentEvent HistoryBreakdown Time
1PlasticASD, PLC2 events/month120 min
2AutomotiveASD, PLC, Robot4 events/month60 min
3TiresASD, PLC2 events/month120 min
4TiresASD, PLC, Electronic cards3 events/month60 min
5CommercialComputer, No break7 events/month15 min
6CommercialBuilding Manag. System, No break, Computer4 events/month20 min
7WallpaperASD, PLC5 events/month30 min
8MetallurgicalASD, PLC2 events/month60 min
9ToysASD, PLC8 events/month45 min
10PVC PlasticASD, PLC, electronic cards10 events/month30 min
11PVC PlasticASD, PLC, electronic cards10 events/month30 min
12ElectroplatingContactor1 event/month10 min
13ExtrusionASD, PLC3 events/month15 min
14TextileASD, Contactor2 events/month30 min
15TextileASD, PLC, Electronic cards6 events/month40 min
16GlassASD, PLCnot available10 min
17ExtrusionASD, PLC, RX SCANNER30 events/month60 min
18PlasticASD, PRINTER25 events/month60 min
19FoundryASD, PLC1 event/month60 min
20Rock miningASD, PLCnot available20 min
21GlassASD, PLCnot available20 min
22FoodASD, PLCnot available360 min
23FurnitureASD, PLC, UV lamp8 events/month60 min
24FurnitureASD, PLC, UV lamp8 events/month30 min
25Animal foodASD, PLC8 events/month30 min
26Stones and granitesASD, PLC4 events/month30 min
27Chips cardsPrinters machines8 events/month120 min
28PlasticASD, PLC4 events/month15 min
29MetallurgicalASD, PLC4 events/month15 min
30CommercialComputers, Servers, Elevators, Escalators5 events/month10 min
31FertilizerASD, PLC, Contactor, Elevatornot available10 min
32AutomotiveLaser, Tube Bender, Welding Robot30 events/month20 min
33PetroleumASD, PLC18 events/month60 min
Table 4. Cost per event and cost per kW.
NumberActivity TypeDemand (kW)Cost/Event
(US $)
Cost/kW
(US $/kW)
Other Information
1Plastic30004190.301.40US $3286.50 equipment damage
2Automotive25006847.002.74Damage to some equipment
3Tires29006003.002.07US $12,005.00/month (scrap reprocessed)
4Tires17006000.003.53US $18,000.00/month (scrap reprocessed) + 2096.00 maintenance
5Commercial12002717.002.26US $76,070.00/month of penalty (12 h no energy)
6Commercial13006851.005.27US $261.00 in damaged equipment and 1 h no monitoring
Investment—US $227,718.00 in 8 generators, 2018/Jan.
7Wallpaper17009667.005.69US $2370.00 equipment damage
8Metallurgical14002071.001.48-
9Toys12003657.003.05US $740.00 equipment damage
10PVC Plastic5001640.003.28US $2368,00 equipment damage
11PVC Plastic13506056.004.50US $7130,00 equipment damage
12Electroplating350556.001.60US $470,00 equipment damage
13Extrusion5001811.003.62-
14Textile9501501.001.67-
15Textile4501509.453.35US $2841,00 equipment damage
16Glass4101437.003.51Loss of 1 oven due to an 8-h interruption
17Cables Extrusion85052,800.0062.18Loss of umbilical tubes up to 2 km
18Plastic24005690.002.37-
19Foundry8504773.005.61Scraps are reprocessed
20Rock mining20004085,002.04Loss of particle size
21Glass4052161.005.33Scraps are destined for beverage factories
22Food7005145.007.355 no breaks—800 kVA
23Furniture7607238.009.52Damage of UV Lamps
24Furniture8007153.008.94Damage of Transformer and track rollers
25Animal food1000650.000.65Refused feed is recycled in the process
26Stones and granites315011,130.003.53Imperfect granite slabs are reprocessed
27Chips cards5006613.0013.26-
28Plastic4002031,005.08Material is recycled and reprocessed
29Metallurgical5002715.005.43-
30Commercial60009311.001.55Investment in harmonic filter
31Fertilizer Chemical2504565.0018.26Refuse is reprocessed
32Automotive250013,049.005.22Investment in no breaks, generator
33Petroleum250041,414.0016.57-
Table 5. Costs by type of activity.
NumberDemand (kW)Cost/Event (US $)Cost/kW (US $/kW)
Plastic—Total Companies: 8—24.24%
130004190.001.40
717009667.005.69
912003657.003.05
105001640.003.28
1113506056.004.50
1824005690.002.37
275006613.0013.26
284002031.005.08
Range400 to 30001640.00 to 9667.001.40 to 13.26
Average1381.254943.004.83
Automotive—Total Companies: 4—12.12%
225006847.002.74
329006003.002.07
417006000.003.53
32250013,049.005.22
Range1700 to 29006000.00 to 13,049.002.07 to 5.22
Average24007974.753.39
Commercial—Total Companies: 3—9.09%
512002717.00 2.26
613006851.005.27
3060009311.001.55
Range1200 to 60002717.00 to 9311.001.55 to 5.27
Average2833.336293.003.03
Glass—Total Companies: 2—6.06%
164101437.003.51
214052161.005.33
Range405 to 4101437.00 to 2161.003.51 to 5.33
Average4081799.004.42
Metallurgical—Total Companies: 6—18.18%
814002071.001.48
12350556.001.60
135001811.003.62
1785052,800.0062.18
198504773.005.61
295002715.005.08
Range350 to 1400556.00 to 52,800.001.48 to 62.18
Average741.6710,787.6713.26
Mining—Total Companies: 1—3.03%
2020004085.002.04
Food—Total Companies: 2—6.06%
227005145.007.35
251000650.000.65
Range700 to 1000650.00 to 5145.000.65 to 7.35
Average8502897.504.00
Furniture—Total Companies: 2—6.06%
237607238.009.52
248007153.008.94
Range760 to 8007153.00 to 7238.008.97 to 9.52
Average7807195.509.23
Stones and Granites—Total Companies: 1—3.03%
26315011,130.003.53
Chemical—Total Companies: 1—3.03%
312504565.0018.26
Textile—Total Companies: 2—6.06%
149501501.001.67
154501509.453.35
Range450 to 9501501 to 1509.451.67 to 3.35
Average7001505.232.51
Petroliferous—Total Companies: 1—3.03%
33250041,414.0016.57
Publisher’s Note: MDPI stays neutral with regard to jurisdictional claims in published maps and institutional affiliations.

