
Optimization of Modernization of a Single-Family Building in Poland Including Thermal Comfort


Division of Air Conditioning and Heating, Faculty of Building Services, Hydro and Environmental Engineering, Warsaw University of Technology, Nowowiejska 20, 00-653 Warsaw, Poland
*
Author to whom correspondence should be addressed.
Energies 2021, 14(10), 2925; https://doi.org/10.3390/en14102925
Submission received: 14 March 2021
/
Revised: 14 May 2021
/
Accepted: 14 May 2021
/
Published: 18 May 2021
(This article belongs to the Special Issue Building Energy Management: Materials, Modeling, and Components)
Abstract
:The impact of thermal comfort demand on the renovation process was carried out on an optimization basis for the thermo-modernization process of an exemplary single-family home located in Warsaw. The verified TRNSYS simulation program was used to generate a set of variants of building modernization solutions. This variants set was used afterwards as a database for optimization. The analysis performed includes the internal air temperature, indicators of thermal comfort (PPD), and annual energy demand for heating and cooling, and investment costs of modernization building. The results indicated the importance of analyzing various variants of building modernization solutions. Performing modernization without analyzing its effects can have positive as well as negative consequences, e.g., achieving a significant reduction in the primary energy demands at the expense of the deteriorated thermal comfort of users. It was shown that separate analysis of indicators leads to completely different solutions and should not be recommended during modernization of single-family buildings.
1. Introduction
Construction and transport are the most energy-consuming sectors in developed countries. Concerning buildings, the reduction of energy consumption is usually achieved by increasingly stringent insulation standards and air tightness of the building envelope. An example is Directive (EU) 2018/844 amending Directive 2010/31/EU on the energy performance of buildings, and Directive 2012/27/EU on energy efficiency [1,2]. However, in a favor of creating further standards in this area, basic functions of the building, which is to ensure appropriate environmental conditions and, in particular, about thermal comfort and good indoor air quality, are often neglected. The aim of the research work was to find the best solution for the modernization of the existing single-family building in terms of minimizing energy consumption, minimizing investment costs, and improving of thermal comfort conditions.
Issues of energy consumption, costs, and maintenance of environmental conditions should be analyzed together, preferably in an annual cycle. Increasing the thermal insulation and air tightness of the building envelope will reduce energy consumption for heating in winter, but it will also increase the average value and amplitude of internal temperature fluctuations in the summer [3]. This leads to deterioration in the thermal comfort of users in buildings without an air conditioning system. It is therefore necessary to apply additional technical solutions limiting temperature fluctuations. Of course, the best solution for maintaining thermal comfort during whole year is the use of heating in the winter, cooling in the summer, and a control system that allows adjustment of the heating and cooling power to the current needs. However, such a solution requires additional financial costs and increased consumption of energy. On the other hand, the increase or decrease of the internal temperature in the long term with small daily fluctuations will not significantly deteriorate user comfort. This is due to the adaptive abilities of the human body.
An important problem in the assessment of thermal comfort is the application of the right comfort model. Currently, generally two models can be applied: the static model (steady state model) and the adaptive model (adaptive model). The static model was described by Fanger in 1970 [4], and the comfort parameters given there are still used in international standards: ISO 7730 [5], EN 15,251 [6] replaced by [7], or ASHRAE 55 (ASHRAE Standard 55, 2007). According to this approach, thermal comfort is described by PMV and PPD indicators, and the estimated human comfort perception depends on human activity (metabolism), clothing insulation, and environmental conditions (temperature and humidity of the internal air, temperature of radiation, and the air velocity). The calculations done according to the given standards indicate, that without changing clothes, for light work (e.g., office), the range of internal temperature changes, varying from 20 to 24 °C in class A rooms in accordance with PN-ISO 7730 (PMV = ±0.2; PPD = 6% with relative humidity in the range of 40 ÷ 60% and air velocity 0.1 ÷ 0.2 m/s), does not cause deterioration of thermal comfort.
If someone that experiences thermal discomfort adapts to it or tries to improve it by their own behavior, it means that an adaptive model to assess thermal comfort according to EN15251:2007, ASHRAE 55:2007 has been applied. In literature [4,8,9], there are three factors of adaptation of the human organism to the environmental conditions: behavioral (changing clothes, opening windows and doors, switching on fans that increase air velocity), physiological (acclimatization of the organism to changing environmental conditions), and psychological (reference to external environment conditions or expectations). Adoption of the adaptive model essentially changes the range of internal environment parameters considered to be comfortable or at least acceptable [10]. Zhang et al. [11] proves that in the temperature range 19.5 to 25.5 °C, buildings do not need to be either heated or cooled. In the temperature range of 25.5 to 28 °C (and even 30 °C), ceiling fans will provide acceptable comfort (by increasing air velocity up to 2 m/s). Rooms should be cooled only above 28 (30) °C and heated below 19.5 °C. The level of thermal comfort is also influenced by the type of ventilation or utility functions of buildings. For example, in buildings with personalized air conditioning systems (PAC system) an increase in the upper limit of temperature of thermal comfort is observed [12,13,14]. Furthermore, users of buildings with natural ventilation are more tolerant, and their comfort limits depend on the outdoor climate [15]. In a cold climate, these boundaries move toward smaller values [16,17,18,19], while in a warm climate, toward higher values [20,21,22,23]. The research conducted indicates the legitimacy of using an adaptive model of thermal comfort [20,21,22,23] with changes in internal environment parameters in long periods. Adaptation to the external climate is even shaping the lifestyle or daily routines of the inhabitants in many countries. When high and low temperatures appear in the diurnal cycle, that is, when significant fluctuations of temperature changes appear in a relatively short period, the acclimatization of the organism is limited. In this case, the adaptation behavior prevails: the need to change clothes, open windows, turn on the fans, etc. However, such activities are troublesome, increase the risk of local discomfort, and can lead to overcooling or overheating of the human body.
Summarizing, it can be stated that even high or low values of internal temperature, lasting for a long period with relatively small fluctuations throughout the day, are acceptable by users. However, users do not accept large daily temperature fluctuations. Therefore, when assessing thermal comfort, it seems reasonable to use a static model for large daily fluctuations in indoor temperature and an adaptive model at high or low temperatures but with small daily amplitude. In the first case PMV and PPD indicators can be used, in the second, time of exceeding the temperature limits admitted as acceptable in summer or winter. Not without a reason, in the assessment of the quality of HVAC systems, control systems allow fluctuations of the internal air temperature below ±1 K.
In the field of single-family buildings, optimization analyses of energy demand can be found, including multicriteria optimization and also lifecycle assessment (LCA) analysis of buildings. For example, the results in [24] show that the optimum insulation level, obtained either from the lifecycle energy use or the lifecycle cost, is greater than those values recommended by the energy efficient building regulation in Quebec. Unfortunately, the article does not concern the analysis of thermal comfort conditions. Another example of looking for an algorithm for selecting solutions that improve energy performance of single-family buildings is the analysis presented in [25], which concerns selection of solutions for the building envelope. The results presented are to be an element supporting the choice for investors. While the authors of [26] focus on formulating general conclusions, guidelines and recommendations are provided for both investors and designers energy-efficient and ecological houses. Interesting results are presented in [27] in which the actual benefits of the process of building modernization are described. This article combines all the elements together and is a contribution to finding an answer to the question of how to find modernization measures that improve not only energy efficiency but also thermal comfort in existing single-family buildings.
Reference [28] presented a multicriteria optimization of the building complex that accounted for elements such as direct construction costs, construction site organization, urban layout, and occupancy costs. However, the analysis was carried out only on the basis of the simulation model and it concerned mainly the layout of buildings in the estate. The impact of the type of windows and insulation thickness of the external partitions for a single-family building with natural ventilation on lifecycle cost (LCC) was analyzed in [29]. Many publications focus on a very important environmental aspect [30,31], or they use the optimum cost criterion [32,33,34]; however, due to the complexity of thermal modernization of existing buildings, LCC cannot be the only criterion. To the question of what kind of modernization the users of single-family houses are interested in, efforts were made in [35] to find an answer. The authors showed on the basis of a questionnaire survey that the choice of improvements depends on the context and that building owners should be supported in making rational improvement packages.
An example of research of a similar scope but concerning a completely different type of building is presented by Roberti at al. [36], which presents the results of the optimization of a historic building with regard energy performance, comfort, and conservation. The aim of the work was to transform a vacant building into a cultural center. However, in this study, temperature measurements were not made during the use of the building prior to modernization and the thermal comfort analysis was based only on the simulation results. Similar results were obtained concerning the impact of thermal insulation on energy demand and thermal comfort; however, it should be emphasized that a completely different purpose and technical equipment of the building were analyzed. In residential buildings, the scope of the analysis should also take into account investment and operating costs. Another publication on the modernization of historic buildings is the analysis presented by Lucchi at al. [37], where the optimal cost method was used to find the best solution for the internal insulation of historic buildings.
The study presented in this article concerns a very important segment of the market, i.e., existing single-family buildings. The energy demand of these buildings depends on individual use. In addition, this area is difficult to assess due to the fact that the user likes to feel at ease in the place of residence and wants to have an impact on the scope of modernization [38], so influencing his or her behavior is very difficult and sometimes not possible, for example, in public buildings. It is necessary to create regulations and an advisory system for end-users of single-family buildings that include the process of increasing energy efficiency, which will be beneficial from not only an economic point of view [39]. The importance of this segment, single-family houses in Poland in the context of thermal modernization, was shown in [40,41]. Improvement of the energy quality of existing buildings together with the increasing of thermal comfort and reduction of greenhouse gas and dust emissions, can be achieved using the optimization procedure and appropriate definition of the objective function and decision variables.
2. Materials and Methods
2.1. Building Model
The analysis was carried out on the basis of an exemplary single-family house located in Warsaw. The analyzed building, constructed in 2007, is a semidetached house, two stories, without basement and with an unused attic. The calculations were carried out using the TRNSYS simulation program. A 13-zone model of the building was built using element Type 56, included in the TRNSYS program [42]. The model was created in such a way as to re-create the existing state of the building as accurately as possible. Main characteristics of the analyzed spaces, such as its functions, their location, type of zones adopted in the model, and the location of the measurement sensors used during model verification, are given in Figure 1. Table 1 and Table 2 present the description of rooms and zones and basic thermal parameters of building partitions. Detailed description of the building can be found in a PhD thesis [43].
Simulation calculations were carried out for the whole year with one-hour time step. A typical meteorological year was used for the location of Warsaw according to PN-EN ISO 15927-4: 2007 [43,44]. Using a simulation model of the building, 384 simulations were performed for different variants of building modernization. Based on those simulations, an extensive database for optimization was created. The applied program also accounted for the accumulation of building partitions of the analyzed building.
2.2. Heating System Model
The analyzed building has a central heating system, with compact, rail, and floor radiators. A two-stage quality and quantity control of the heating system was applied. Water temperature supplying the heating system is adjusted by a weather compensation controller and air temperature in rooms is controlled by thermostatic valves.
A weather compensator controller is equipped with an additional temperature sensor, located in the living room, which allows for application of corrections into the control chart. The heat source is a gas boiler and heating demand is 8.2 kW. The heating system model includes a gas boiler, insulation, radiators, and thermostatic control valves. The characteristic parameters of the thermostatic control valves and heating system are given in Table 3. Set temperature in the rooms is 20 °C.
2.3. Ventilation System Model
In the existing state, the building has a natural ventilation system, where the external air flows through the gaps in the windows, then through the internal rooms, and is removed through the ventilation grilles located in the kitchen, bathroom, and toilet. The air flows were assumed on the basis of experimental measurements and the verification of the simulation model. The list of air exchange rates in each of the model zones is shown in Table 4.
2.4. Heat Gain Model
The model includes internal and external heat gains such as internal heat gains from users (four adults), central heating and hot water system in building, electrical appliances, and lighting.
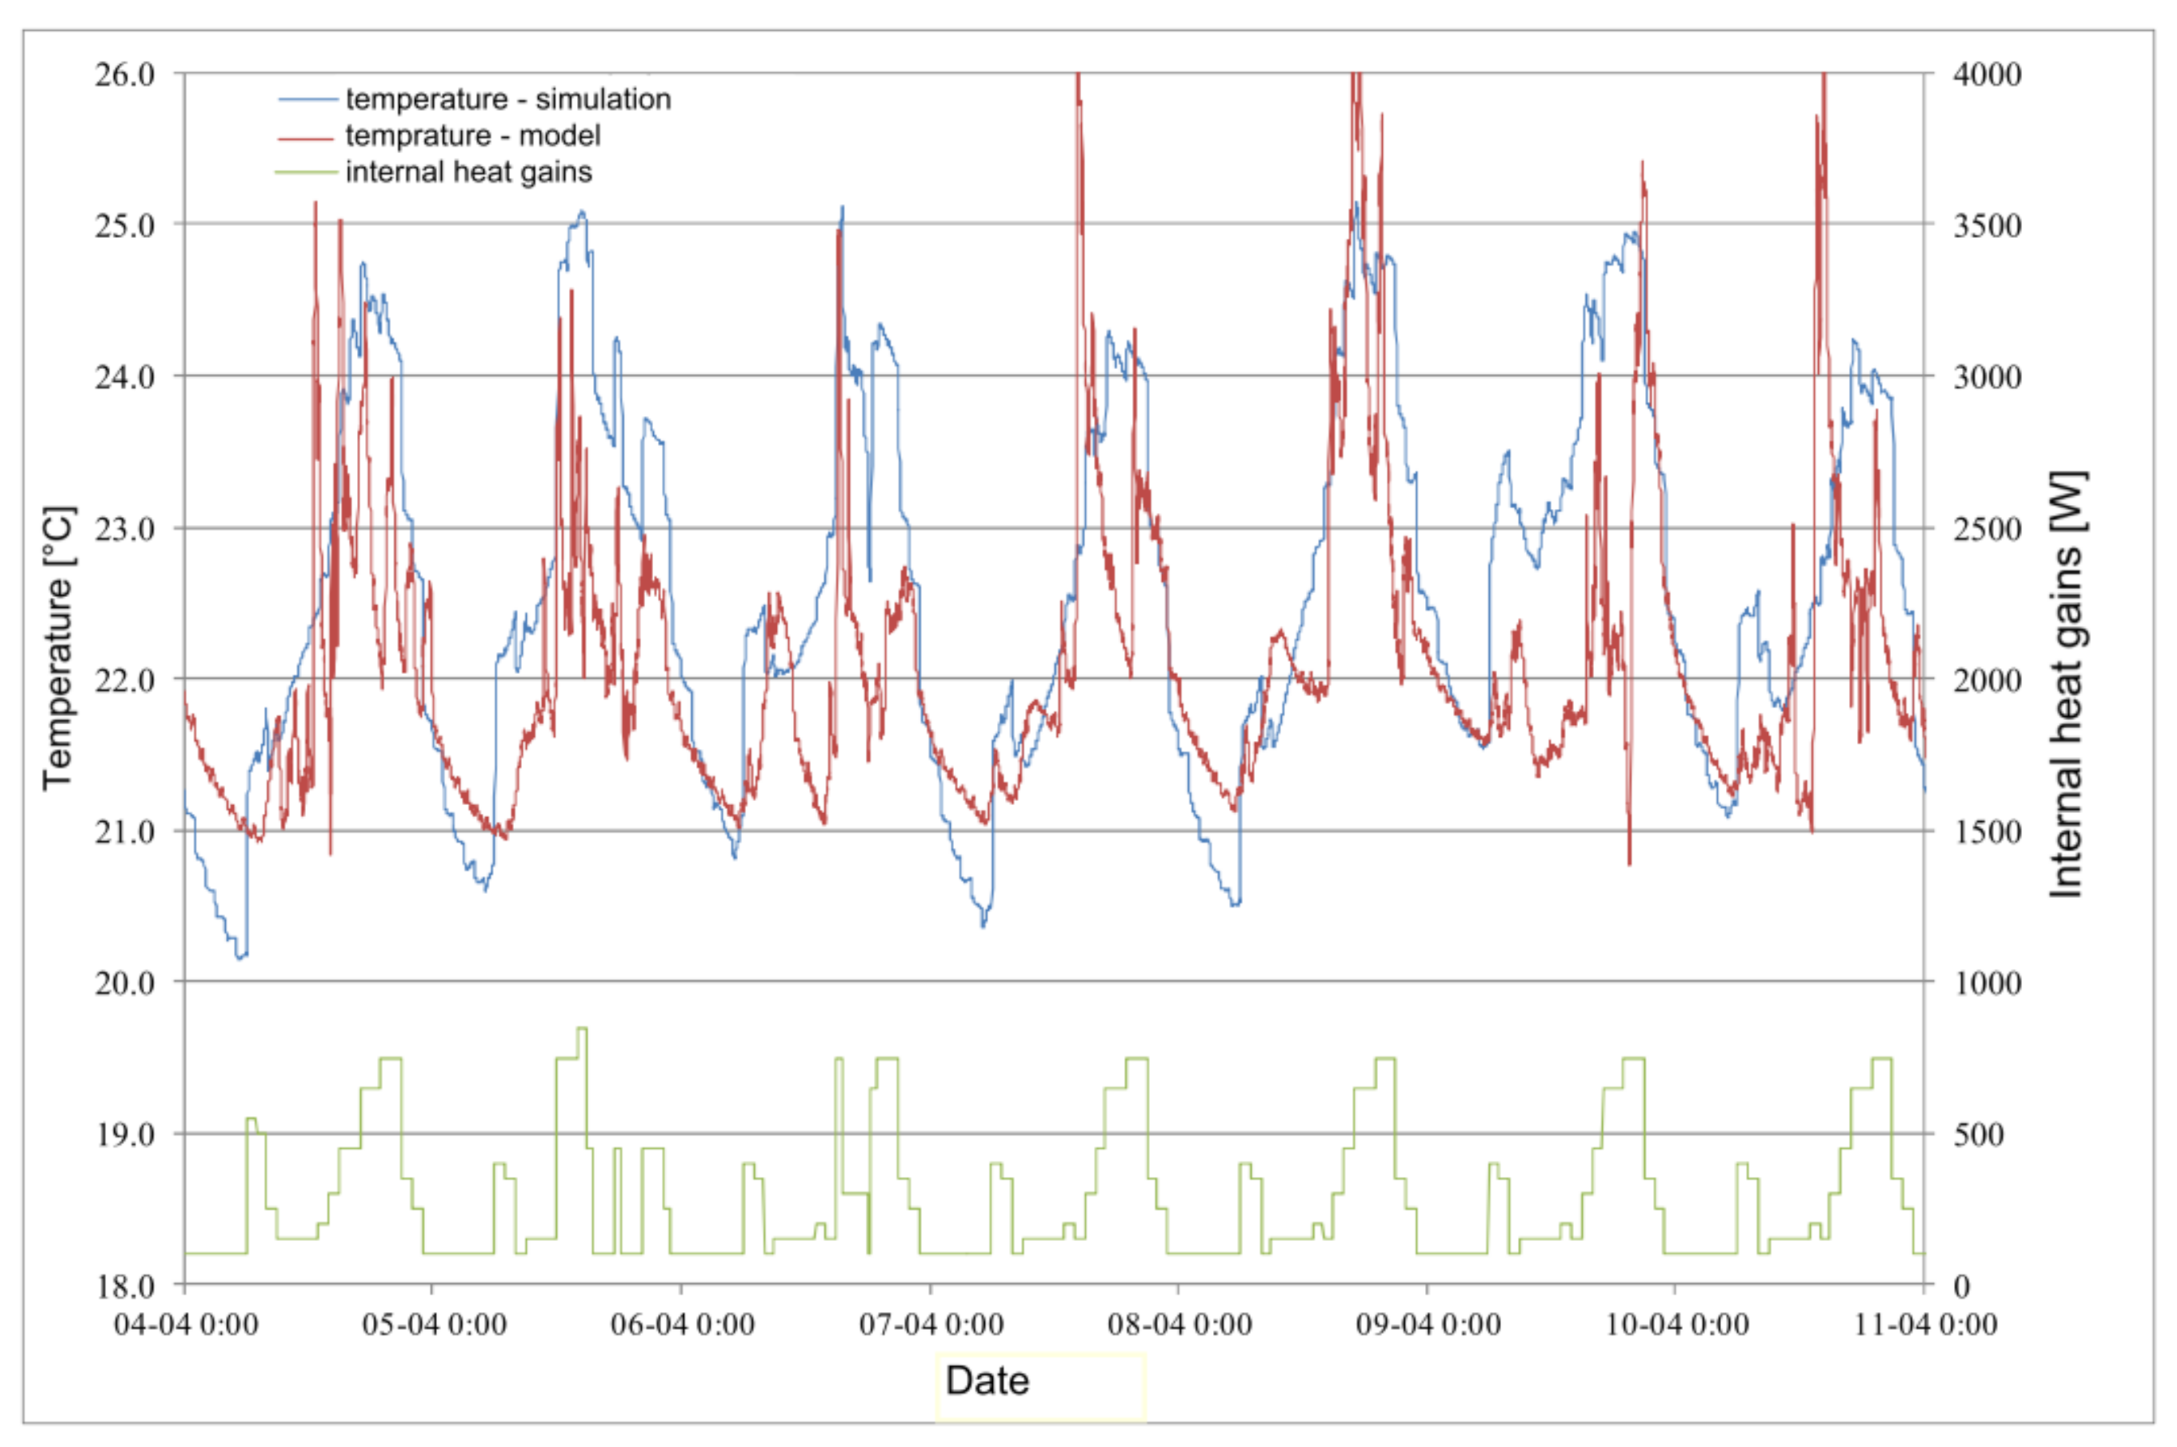
The schedule of internal gains from users, electrical appliances, and lighting was determined on the basis of information obtained from people living in the building. Heat gains from the hot water installation mainly comes from the hot water tank (located in the boiler room), and central heating and hot water system distribution pipes. Schedule of the heat gains is for each hour and zone, and can be found in [43]. External heat gains depend on the solar radiation, surface orientation, surface properties, and shading created by the external elements of the building. Figure 2 shows a comparison of the selected period of temperature from the measurement and simulation, and the variability of internal heat gains.
In the TRNSYS program, element Type 34 was applied. This element allows for the automatic calculation of solar radiation on defined partitions that accounts for shading.
2.5. Cooling System Model
A cooling system was not installed in the existing building; however, for the optimization purposes two types of cooling systems were developed in the TRNSYS simulation program. The first simple solution is an individual cooling system consisting of individual air conditioners located in zones 2, 3, 7, 8, 9, and 12; wherein the power of the air conditioners depends on the current temperature in each zone. The second is technically more difficult to implement—a central cooling system with one air cooler in the ventilation unit; cooling power in this case depends only on the current temperature in zone 2.
Nominal capacity of air conditioners was assumed on the basis of the maximum heat gains in each zone and, in turn, the nominal power of the central cooler based on the maximum level of heat gains for the entire building. Table 5 presents the list of nominal capacities and air flows for cooling units operating in each zone.
The operation scheme of zone air conditioners and the cooler in the ventilation unit was modeled using element type 696 [45].
2.6. Thermal Comfort Model
The thermal comfort of users is an extremely important aspect; however, in technical regulations for single-family buildings there are no consistent methods for its assessment. The evaluation was performed using the static thermal comfort (PPD) model, in accordance with the European EN 16798-1:2019 standard [7]. For this purpose, the clothing insulation, users’ metabolic rate, and air velocity were assumed. In zones 7, 9, and 12 (rooms) metabolic rate was lower during the night. Clothing insulation depended on the period of the year, therefore different values were adopted for winter and summer. The air velocity in the zones was assumed to be constant through the entire year and was set at 0.1 m/s. Values in particular periods are presented in Table 6. The PPD indicator was calculated only in the following zones: 2, 3, 7, 8, 9, and 12, and only for the summer period.
2.7. Model Verification
The building’s model was verified experimentally. Three measurement series were carried out, covering a total of five periods: January/February/March 2009 (26.01 ÷ 6.02, 22.02 ÷ 06.03), April 2009 (04.04 ÷ 11.04, 18.04 ÷ 24.04), and July 2009 (5.07 ÷ 14.07). The meteorological data used for verification are presented in Table 7.
Measurements were performed using the computer measuring system type S10 from Honeywell. The air temperature was measured with Pt1000 resistance sensors with an accuracy of ± 0.3 K in the measuring range −30 ÷ + 150 °C. The difficulty of making measurements was due to the fact that they were performed during normal use, which means that all sensors and connecting cables had to be located in a way that would not interfere with its use. Due to the long length of the test leads (from 15 to 34 m), the system was calibrated through measurements. In addition, due to the different height of the temperature sensors, adjustments of their indications were made on the basis of additional measurements of the temperature change along with the height. The results of the measurements are described in detail in [43].
During verification, rooms not separated by partitions were treated as one zone. Simulations used to verify the model included two periods: initial and appropriate. Both were characterized by an identical variability of the outside air temperature, solar radiation, internal heat gains, and operation of the natural ventilation system.
For all zones, a high compatibility between the measurements and results from the simulation model was obtained. The resulting average difference between the temperature values measured and simulated was from 0.01 to 1.0 K. Only in zone 13 (attic) was such good compliance not achieved. Worse match for that zone is mainly due to the inability to precisely map the internal and external heat gains. The results of the verification are presented in the Table 8 (standard deviation σ, the mean difference between measured and simulated value of air the temperature ∆t for each zone, and the final energy demand ΔQh,k difference between measurements and model). Data on energy consumption in the building were obtained from gas and electricity meters installed on the site. The location of the temperature sensors is shown in Figure 1.
The difference between the energy demand for heating in the analyzed periods, calculated on the basis of simulations and measurements, does not exceed 5.5%. It needs to be highlighted that the actual outside air temperature was used in the simulation; however, meteorological data of solar radiation, cloudiness, wind speed, and wind direction came from a typical meteorological year for Warsaw.
The users provided information on the use of rooms (zones) and devices during the measurement period. This solution was used because during the measurements it was not possible to automatically record the time spent in rooms; therefore, the schedule included in the program could slightly differ from the actual.
2.8. Research Procedure
The optimization of buildings can have different goals, such as a level of insulation quality of the building envelope, equipping with technical systems, the best thermal comfort, lowest construction costs, or lowest operating costs. Regulations in the field of thermal protection of buildings should take into account, first, limiting the energy demand for the building and the emission of pollutants. A very important aspect is maintaining the thermal comfort of users because appropriate parameters must be ensured in the building. Often, the analysis of modernization of buildings is performed without taking into account the measurements of indoor air parameters, and if they are done, they are carried out in experimental facilities. Polish regulations on thermal protection of a building focus mainly on reducing energy demand. The principles of protection against overheating do not force designers to perform detailed analysis, so it is extremely important to bring all these aspects together. The single-family housing sector has a very high potential for modernization. However, many activities are aimed exclusively at protecting the quality of outdoor air and energy efficiency.
The optimization procedure was performed on the basis of the building model and its installation created in the Trnsys 16 program. The following data were entered into the building model: thermal insulation of partitions, heating system characteristics including regulations, ventilation system characteristics, actual heat gains (data collected from user questionnaires), and actual metrological data. The model of the existing building was verified on the basis of air temperature measurements in zones and the consumption of utilities from the meters. The aim of the study was to find the minimum of the following objective functions: primary energy consumption factor for heating and cooling, simple payback time, investment costs of modernization, and thermal comfort coefficients. Solutions were searched for on the basis of the results from the verified building model in which calculations were performed depending on building orientation, insulation thickness of external walls and roof, the area of the windows in the garden façade of the building in zone 2, type of windows, type of ventilation system, cooling system and shading system type, and night cooling. Changes in the values of decision variables were introduced to the model in Trnsys 16. In total, calculations were made for 384 different variants of the building and its installation. On the basis of the results of energy demand for heating and cooling and the results of temperature in zones, solutions were found for individual objective functions. The calculation scheme for each variant is shown in Figure 3.
After determining the value of all objective functions in all analyzed variants, optimal solutions were found for each.
3. Optimization
3.1. Decision Variables
As decision variables should be taken as factors affecting the energy consumption, energy costs, and temperature fluctuations in the building, on which an investor or user has influence. Therefore, for example, the use of renewable energy sources was not analyzed because a renewable energy source lowers the primary energy demand index, but they do not affect the thermal comfort of the users. The following decision variables were taken into account:
- Building orientation;
- Insulation thickness of external walls and roof;
- Area of the windows in the garden façade of the building in zone 2;
- Type of windows (value of window heat transfer coefficient Uw and the total solar energy transmission coefficient gg);
- Type of ventilation system, cooling system, and shading system type;
- Night cooling.
Six decision variables require analysis of the optimization problem in seven-dimensional space, which makes it difficult to analyze. The graphic interpretation of the results is especially difficult to follow. For this reason, the number of decision variables was reduced to three. Three decision variables allow for graphical interpretation of the objective function in 3D space with additional use of color. Therefore, the first and last decision variable was omitted. The first was excluded due to the fact that the building already exists and therefore its orientation cannot be changed. The sixth was omitted because night cooling is not very effective in single-family buildings with natural ventilation. So-called “short air flows” can arise, which would reduce the effectiveness of cooling and also could cause thermal discomfort. The second and third decision variable was merged into one, defined as “wall type”. It was characterized by the average thermal insulation of the building envelope Uavg.
The other decision variable considered consisted of two variants of additional insulation of external walls, i.e., 5 or 10 cm. The most commonly used method of (building) insulation is the light wet method, also known as exterior wall insulation, and this was the chosen method for the analysis. Adding 5–10 cm of insulation to the existing façade ensures that the building complies with the current regulations requiring 0.18 W/(m2K) U value for external walls. There are no specific energy classes in Poland and the requirements contained in the regulations define a nearly zero-energy building. That is, with these new insulation thicknesses, the building meets the requirements of a nearly zero-energy building in Poland. Moisture analysis was not carried out; however, with such a partition structure (walls with external insulation) there is no risk of moisture condensation.
For the third variable, four values of the share of window area in the surface of the garden façade of the living room were assumed, i.e., 33%, 50%, 67%, and 83%. Variant Al = 0.33 (Table 9) had a minimum window area equal to 33% of the wall surface, and it corresponded to the current state of the building.
In the calculations, the weighted average thermal insulation of the external walls was determined. It takes into account the thermal insulation of the external walls, ceiling, and the area of windows in the living room. In this way, a new 12-step decision variable, “wall type” was obtained. Dependence between the value of the variable “wall type” and average thermal insulation of the building envelope Uavg, type of windows and their surface, and thickness of the additional insulation wall layer, are given in Table 8 (W_2, W_4, W_7, and W_10 type of windows according to Table 10, Al-share of window, area in the garden façade in the living room, and I additional insulation of walls).
The other two variables were Windows Type and System Type. Values of the decision variable Windows type characterize window parameters such as heat transfer coefficient Uw and the solar energy transmittance of glass gg. The parameters were chosen on the basis of recommendations presented in a DTU Civil Engineering publication [46], and their adaptation to Polish conditions by Rucińska et al. [47]. Specific parameters of windows are described in Table 10.
Decision variable System type includes information about the type of ventilation, cooling, and shading system. The heating system is the same for all analyzed cases because an applied heating system is a frequently solution used in one family buildings. However, in each variant of the modernization, the heating system should be “adjusted” to ensure the supply of heat to the rooms with changing demand. The change to the underfloor heating system was not analyzed because the users live in the building and they do not plan to move out during the modernization.
The following variants were analyzed:
- -
- S—Blinds on the windows limiting the heat gain from the sun; the blind is lowered if the internal temperature in the zone exceeds 22 °C, the shade coefficient of the blind was set to 0.5.
- -
- VN—Natural ventilation system, the air is removed by convection from the kitchen and toilets, the inflow of fresh air occurs by infiltration; the air change rate was determined during the experimental verification of the model and is 0.5 L/h for winter period, 0.72 for mid-period, and 1.06 for summer period.
- -
- VM—Mechanical ventilation system with heat recovery (thermal efficiency 60%) and constant ventilation air flows in zones (according to Table 11).
- -
- C—Cooling with individual air conditioners (with natural ventilation) or central cooling system (with mechanical ventilation); individual air conditioners are turned on if the temperature in the zone exceeds 24 °C, central cooling is turned on if the temperature in the living room exceeds 24 °C.
Due to the complexity of the problem and easier interpretation of the results obtained, the following decision variables were used:
- -
- Wall type (thermal insulation of the building envelope) decision variable form 1 ÷ 12 according to Table 8; existing stage variant number 9.
- -
- System type (ventilation/cooling/shading type) decision variable values form 1 ÷ 8; existing stage variant number 4:
- 1
- (VN + S)—natural ventilation/no cooling system/external shading devices,
- 2
- (VM + S)—mechanical ventilation/no cooling system/external shading devices,
- 3
- (VM + C + S)—mechanical ventilation/central cooling system/external shading devices,
- 4
- (VN)—natural ventilation/no cooling system/without external shading devices,
- 5
- (VM)—mechanical ventilation/no cooling system/without external shading devices,
- 6
- (VM + C)—mechanical ventilation/central cooling system/without external shading devices,
- 7
- (VN + C)—natural ventilation/individual air conditioners/without external shading devices,
- 8
- (VN + C + S)—natural ventilation/individual air conditioners/external shading devices.
- -
- Window type values from 1 to 4 according to Table 10, existing stage variant number 4 (W_10):
- 1
- (W_2)—type of windows 2,
- 2
- (W_4)—type of windows 4,
- 3
- (W_7)—type of windows 7,
- 4
- (W_10)—type of windows 10.
3.2. Description of the Objective Function
The goal of optimization was to find a solution that minimizes the following objective functions:
- -
- Primary energy consumption factor EP for heating and cooling;
- -
- Simple payback time SPBT;
- -
- Investment costs of modernization KRIavg;
- -
- Thermal comfort coefficients PPDavg and DTavg.
The objective function EP was calculated from the equation:
where:
EP—primary energy demand factor (kWh/(m2a));
wh, wc, wel—coefficients of nonrenewable primary energy for heating (wh = 1.1), cooling (wc = 3.0) and auxiliary appliances (wel = 3.0) (pumps, vents, etc.) (-);
wsh—coefficients of nonrenewable primary energy for shading system auxiliary appliances (-);
Qk,h—annual final energy for heating and ventilation system, heating system efficiency 0.75 (kWh/a);
Qk,c—annual final energy for cooling system, cooling system efficiency 2.94 (kWh/a);
Qk,el —annual final energy for auxiliary appliances (kWh/a);
Qk,sh—annual final energy for external blinds (kWh/a).
The SPBT objective function was calculated from the equation:
where:
SPBT—simple payback time (year);
Kinvest—investment costs of modernization for each variant (EUR/(kWhm2));
ΔKE—energy annual saving costs, (kWh/(m2a)).
The KRIavg objective function was calculated as average annual additional investment costs related to annual energy costs in the building in the existing state from the equation:
where:
KEh,w—energy costs for heating, domestic hot water, ventilation and for axillary appliances before modernization, (EUR/(m2a));
Nsys, Nb—lifecycle of the cooling system and building components; in the calculations lifecycle for cooling system is Nsys = 15 and for building components Nb = 60 years;
KIsys, KIb—additional investment costs of installation and construction elements based on building materials and HVAC appliances producers price lists, (EUR).
In Poland, there are no specific assessment periods for buildings. One of the most popular assessing buildings systems is the BREEAM system, in which a total life time of building is equal to 60 years in LCA analysis MAT1. The lifetime of the installation and materials depends on the data provided by the producers and it was based on environmental product declarations. The average lifetime of the elements was 15 years and that is why it was assumed for the analysis.
Objective function PPDavg was a prediction based on the percentage of those dissatisfied for the indoor climate, and calculated as a weighted average (PPDavg) from selected zones of the building (zone 2, 3, 7, 8, 9, and 12) in summer period (from 1 May to 30 September) from the equation:
where:
PPDk—predicted percentage of dissatisfied in the summer period in the k-th zone (%);
s—number of zone (-);
wPPD_k—comfort weighting factor for zone (-).
The PPD indicator was calculated using the TRNSYS program for six zones: zone 2 (living room), zone 3 (office room), and zones 7, 8, 9, 12 (bedrooms). The values of the comfort weighting factor wPPD_k in a given zone were calculated as the ratio of the area of a room to the surface of a building in which the thermal comfort was assessed. The values are given in Table 12.
The verification measurements also took into account the relative humidity of the air in the living room, but due to the fact that the analyzed systems do not regulate their values, the focus was on maintaining the temperature of the indoor air within the set limits. In single-family houses in Poland, central systems for the regulation of the relative humidity level are very rarely used. Occasionally, users use their portable devices as needed during winter when relative humidity is low. Due to the systems used and thermal insulation of partitions, there is no risk of local discomfort such draft, thermal asymmetry, and radiant temperature asymmetry.
The PPDavg objective function was supplemented by an indicator (DTavg) of exceeding the internal air temperature limit in selected building zones (zones 2, 3, 7, 8, 9, and 12). This indicator took into account the value and time duration of exceeding the air temperature limit in the summer period of 24 °C. The value DTavg was calculated from the equation:
where:
n—number of hours of the summer period (from 1 May to 30 September) (-);
nk—number of hours of exceeding the temperature in summer in k-th zone (-);
tk,i—air temperature in a given k-th zone (°C).
3.3. Energy and Modernization Costs
The results of the economic analysis depend on the adopted costs, therefore such an analysis should be prepared for each building. All costs for the building analyzed were calculated based on the data of energy suppliers, technology producers, and building materials (all prices are net prices). Net prices for energy carriers are electricity, 0.11 EUR/kWh, and gas, 0.04 EUR/kWh; insulating the partitions with additional insulation, 5 cm, 4.1 EUR/m2, and 10 cm, 8.3 EUR/m2. Costs of type of changing windows included increased investment cost of windows with better thermal insulation parameters and lower solar radiation transmission. In the case of changing the window area in the garden façade in zone 2, an additional cost related to the change of the partition structure was also taken into account (replacing a brick wall with a window) (Table 13).
Investment cost of variants, including changes the type of ventilation system, is summarized in Table 14 on the basis of catalogs and price lists. The costs include the mechanical ventilation system, the cost of ventilation ducts and air handling unit; the central cooling system, the cost of the cooling coil; an individual air conditioning system, the cost of six multisplit air conditioners and a central outdoor unit; and the external shading system, the cost of external blinds.
System costs include costs of control systems. The change in energy prices and technology costs was not analyzed at this stage.
4. Results
Calculations were made on the basis of the results for 384 different variants; for further considerations and for the choice of the optimal solution, only variants which meet the following conditions were selected:
- -
- EP < 134.5 kWh/(m2a);
- -
- PPDavg < 26%;
- -
- SPBT < 1.1*60 years.
The limit value of the SPBT simple payback time results from the building lifecycle of 60 years. The energy performance of the building should not be worse than in the existing variant, therefore the limit value of EP is 134.5 kWh/(m2a). In addition, the limit value of the predicted percentage of dissatisfied results from the assumption that thermal comfort in a building should be better than in the existing one (PPDavg = 26%). It was also assumed that average investment costs should not exceed the energy costs of energy consumed in the building. The analysis included variants at the border when the values of the two objective functions slightly exceeded the limit values and the remaining values were well below the limit value.
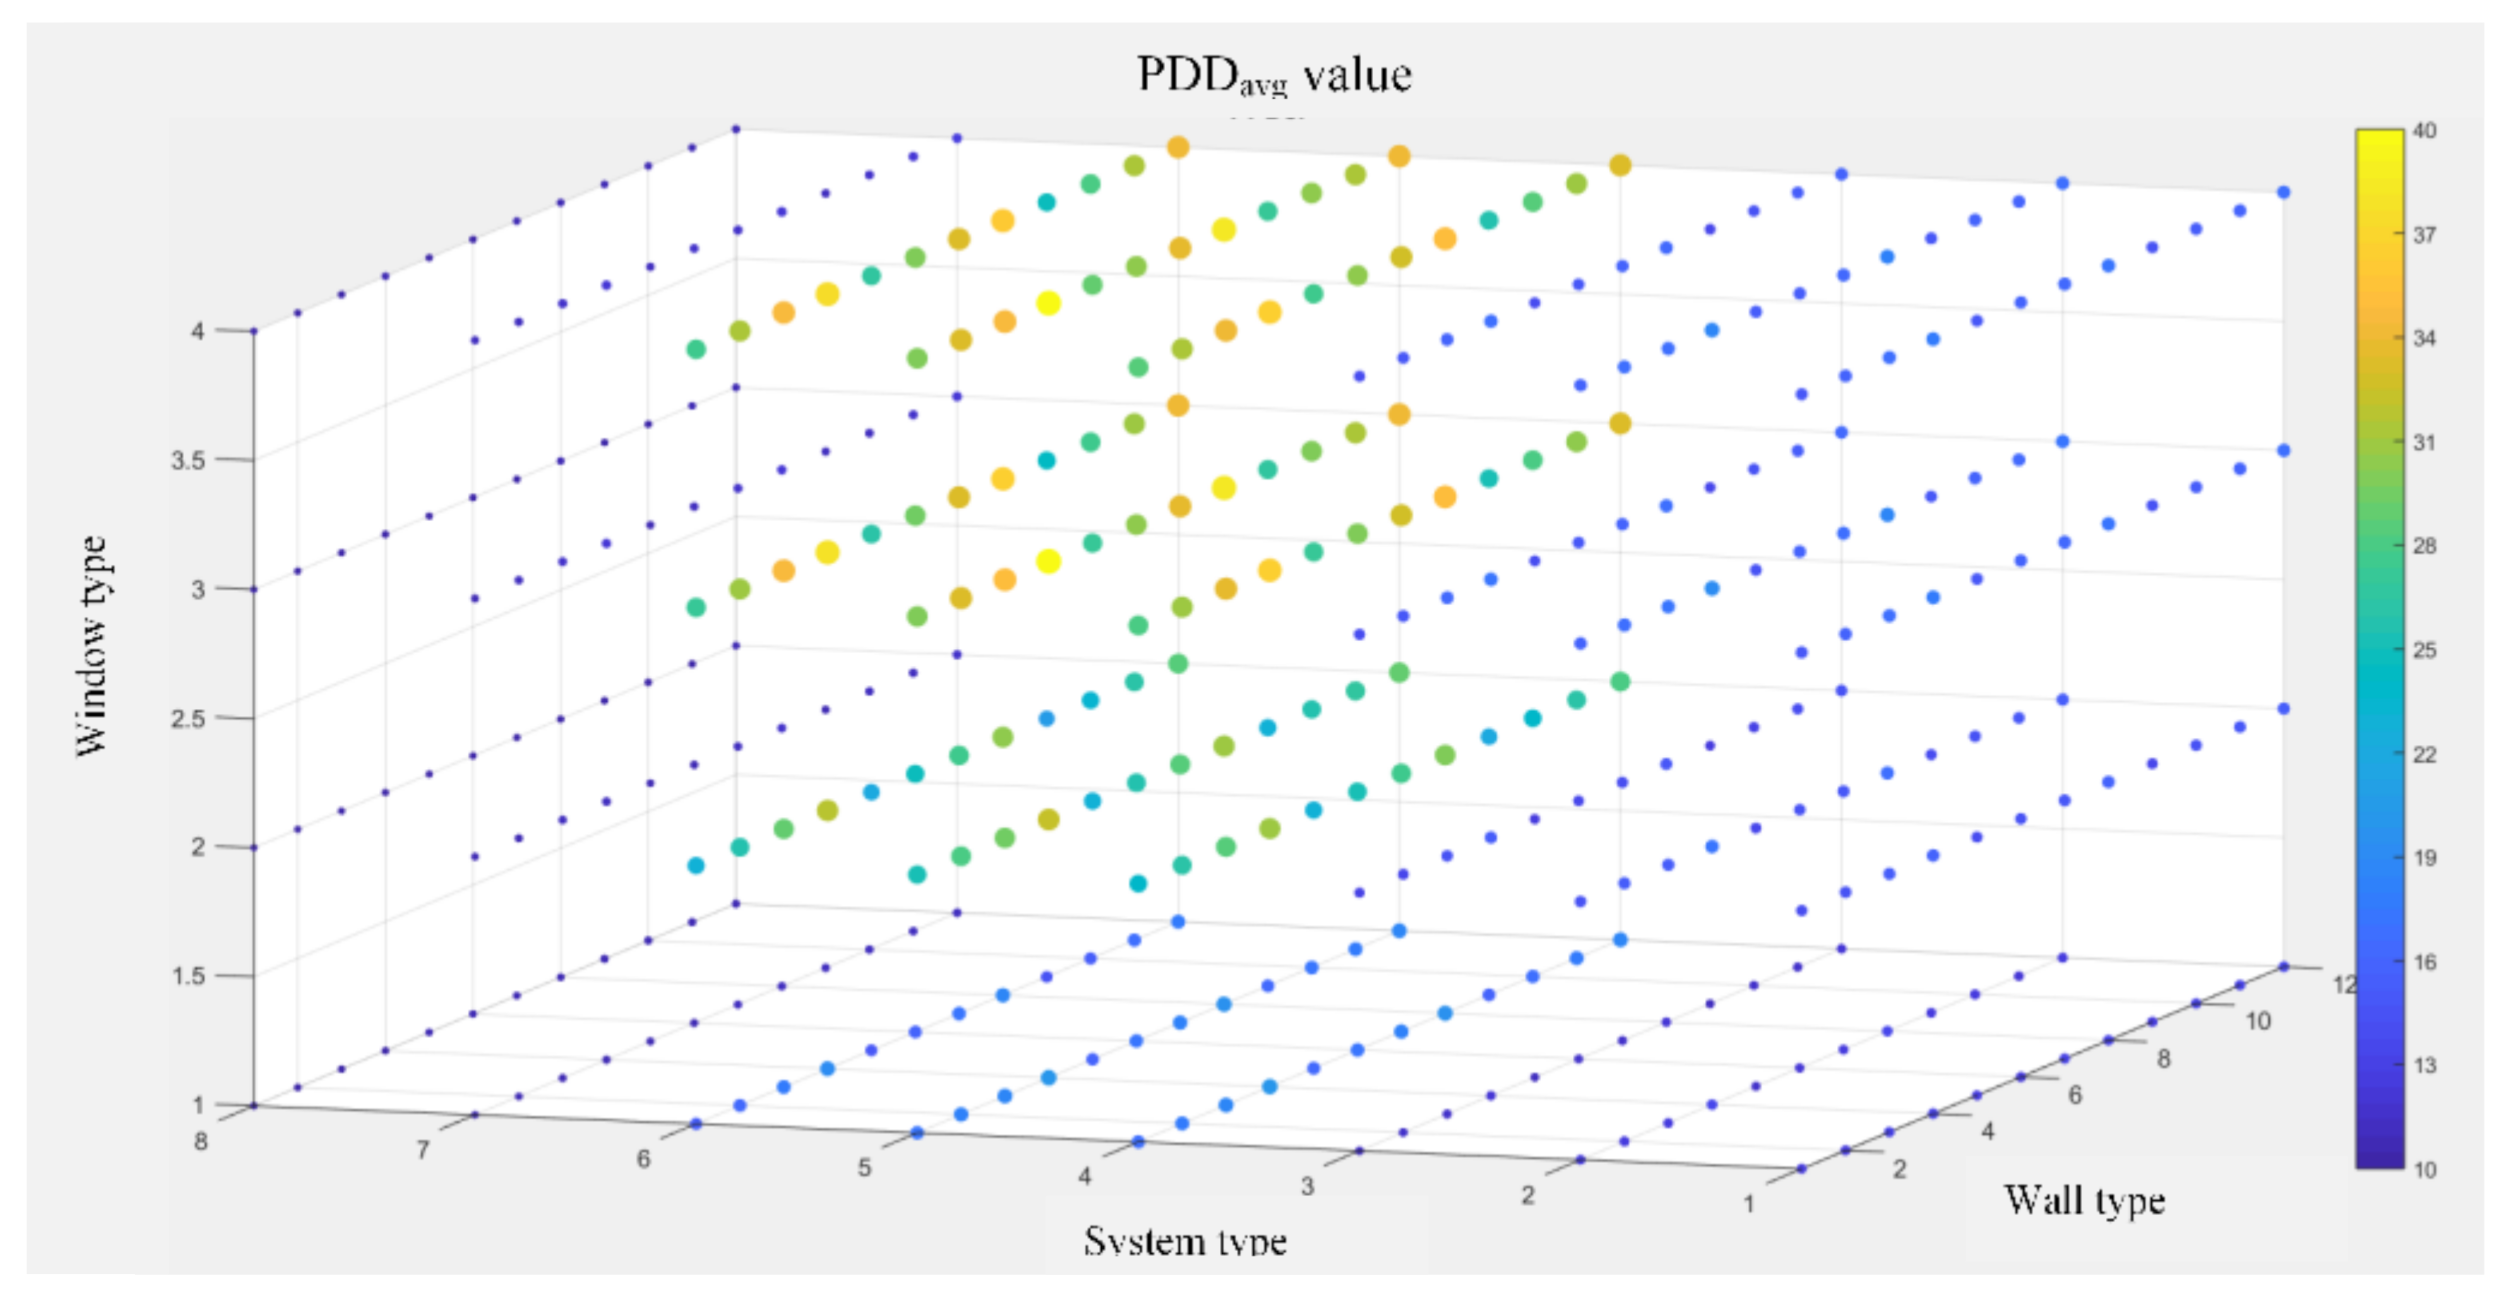
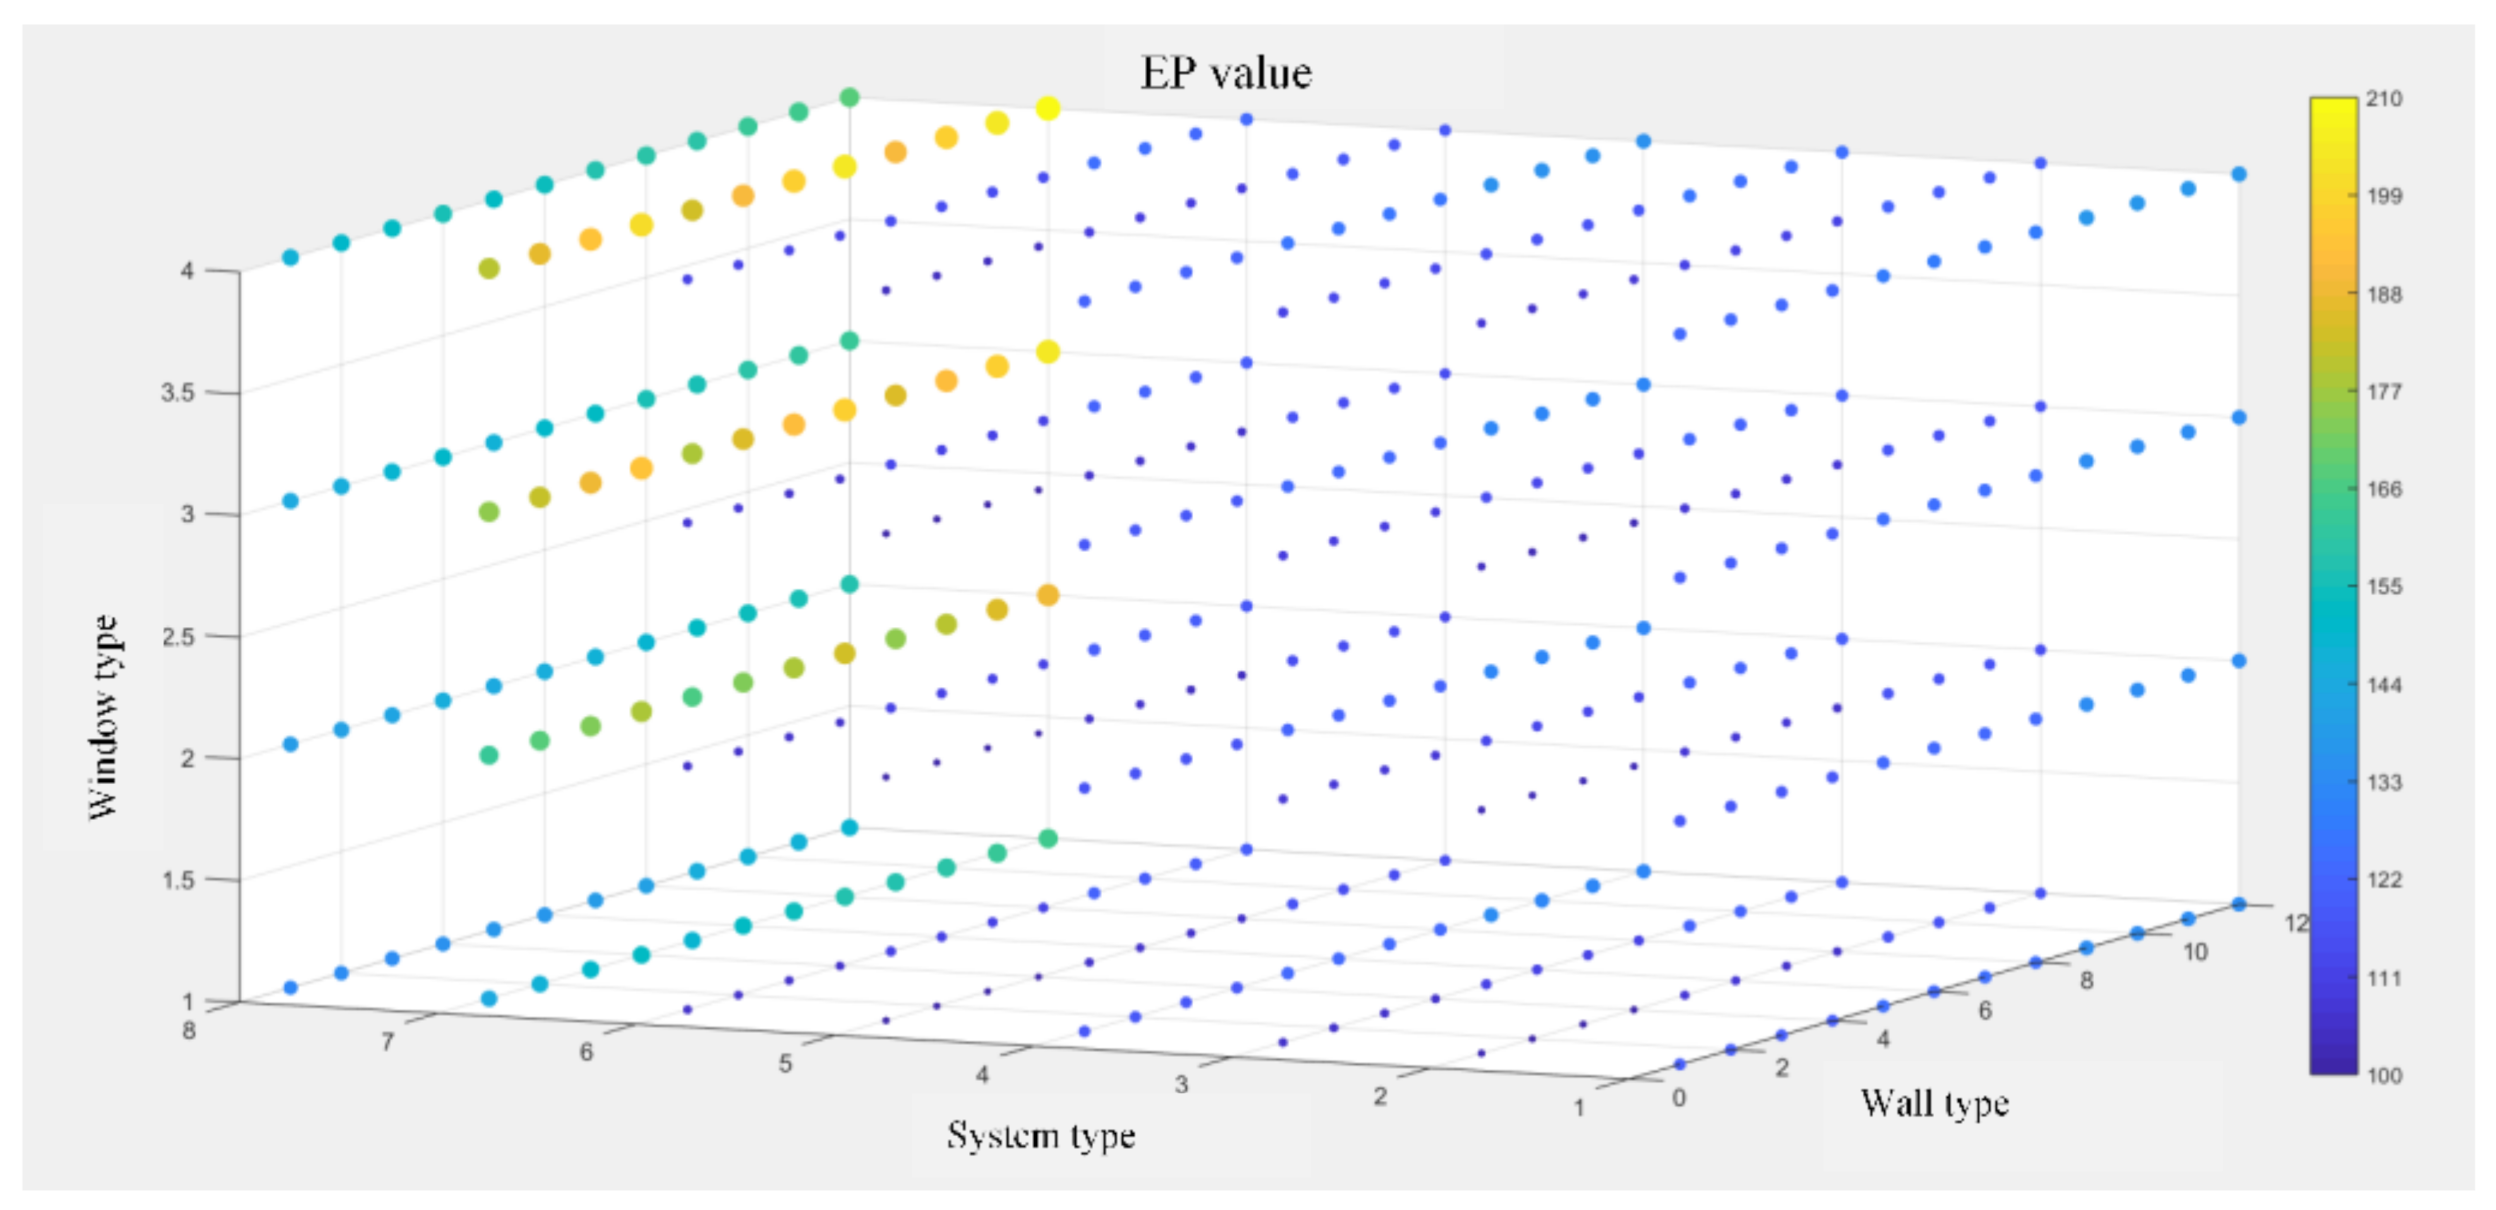
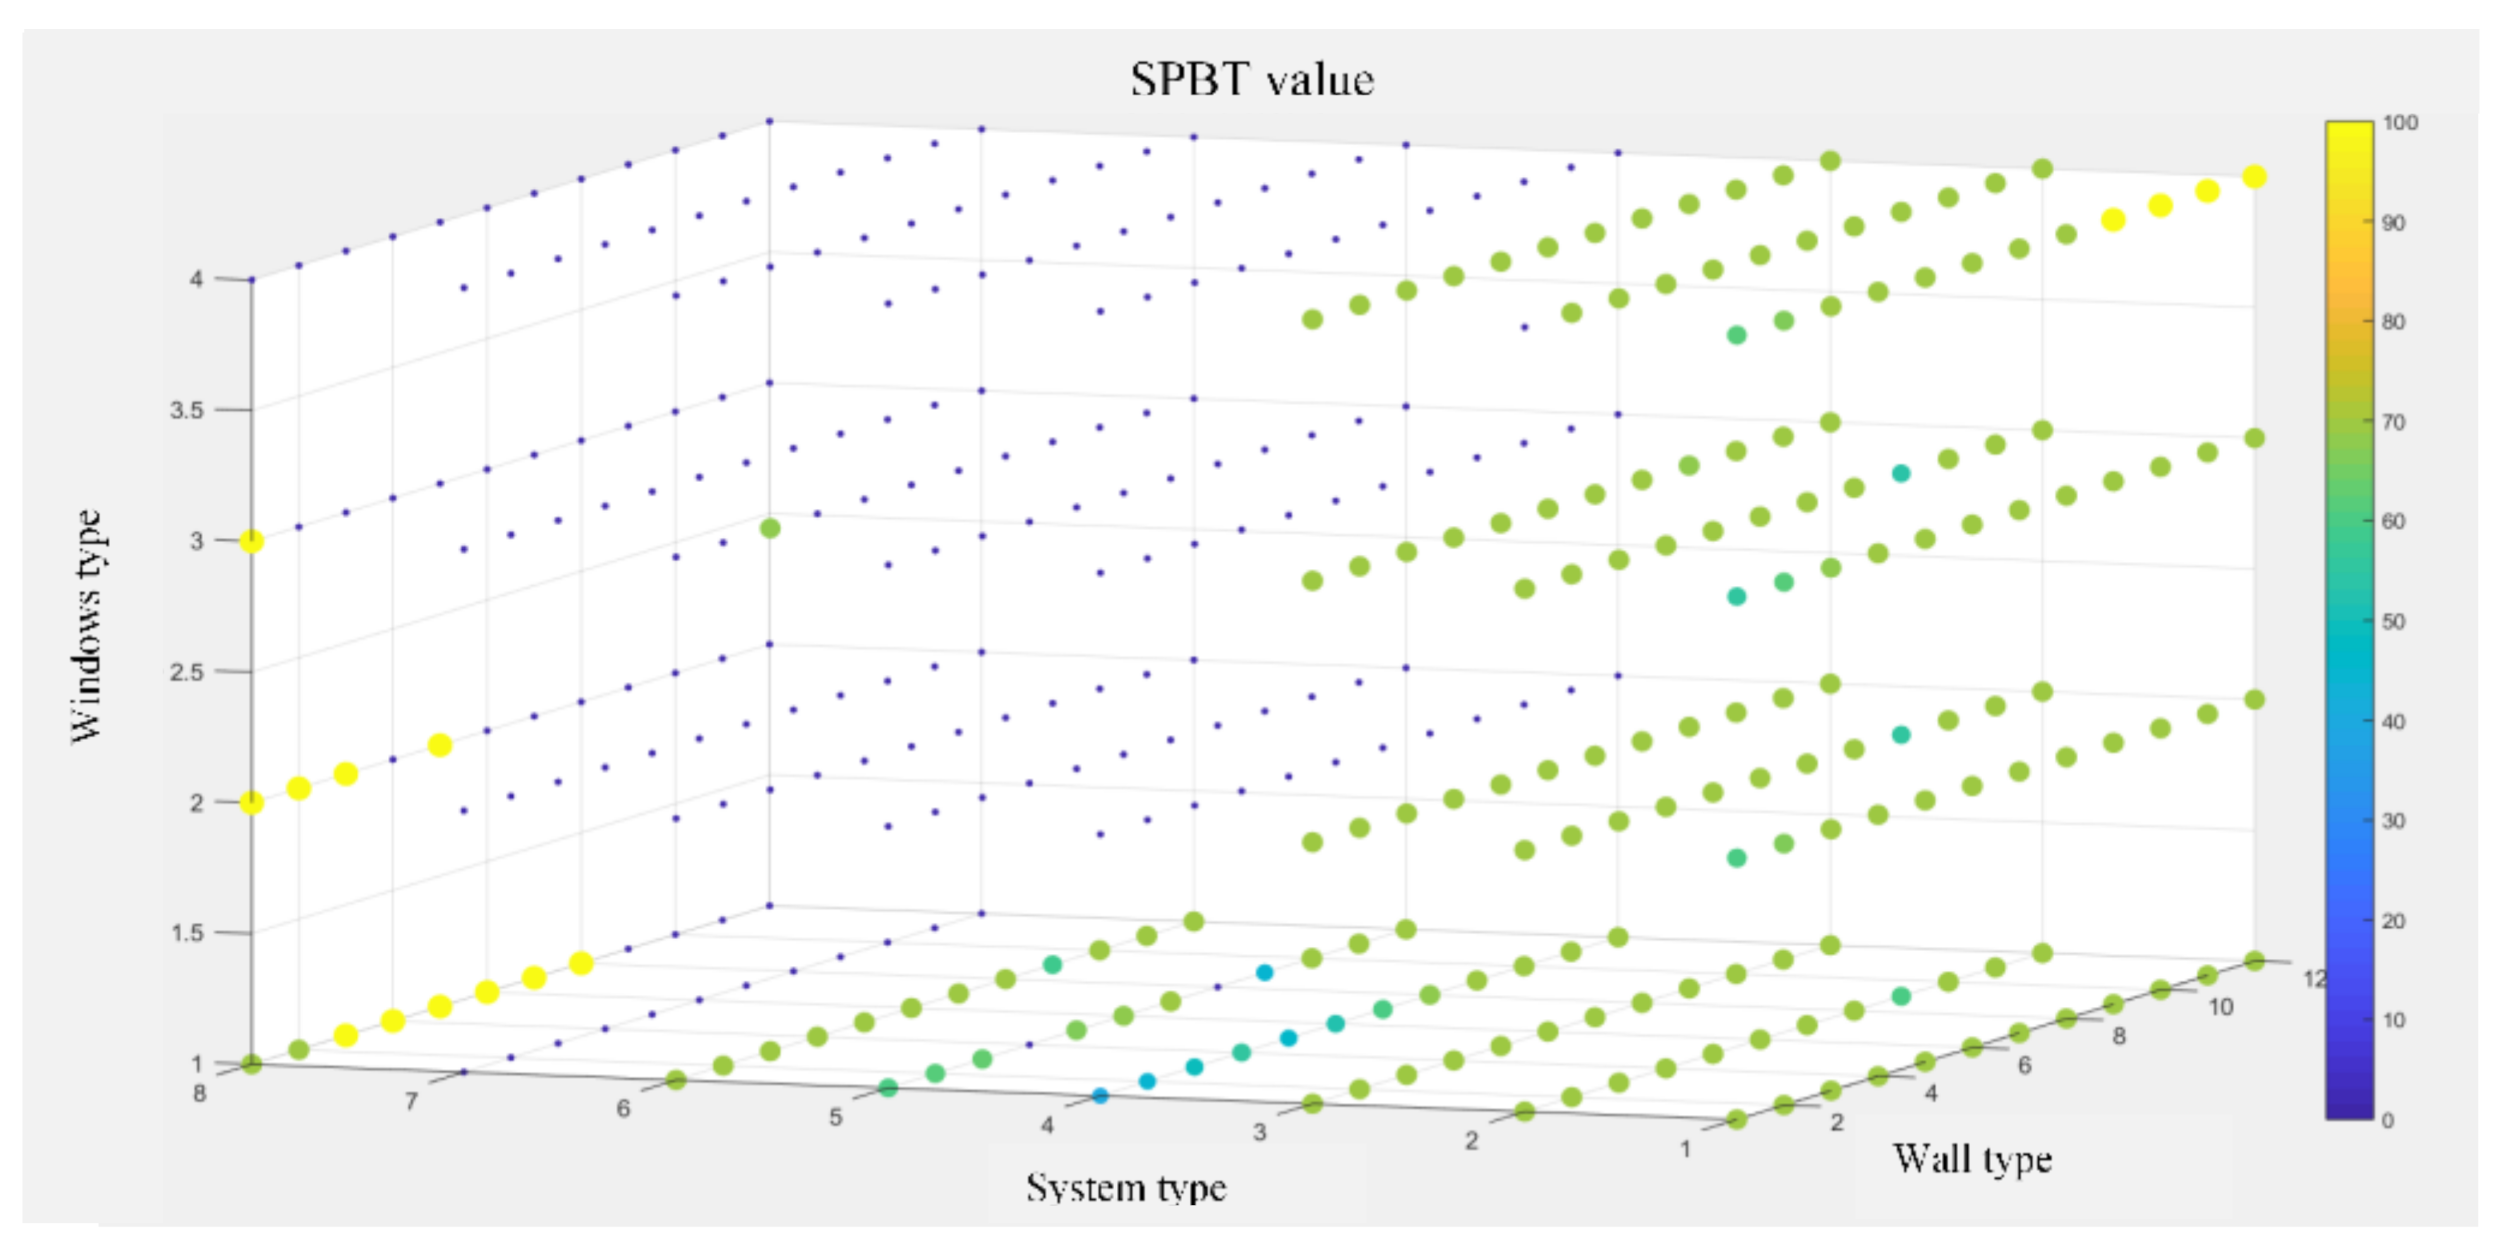
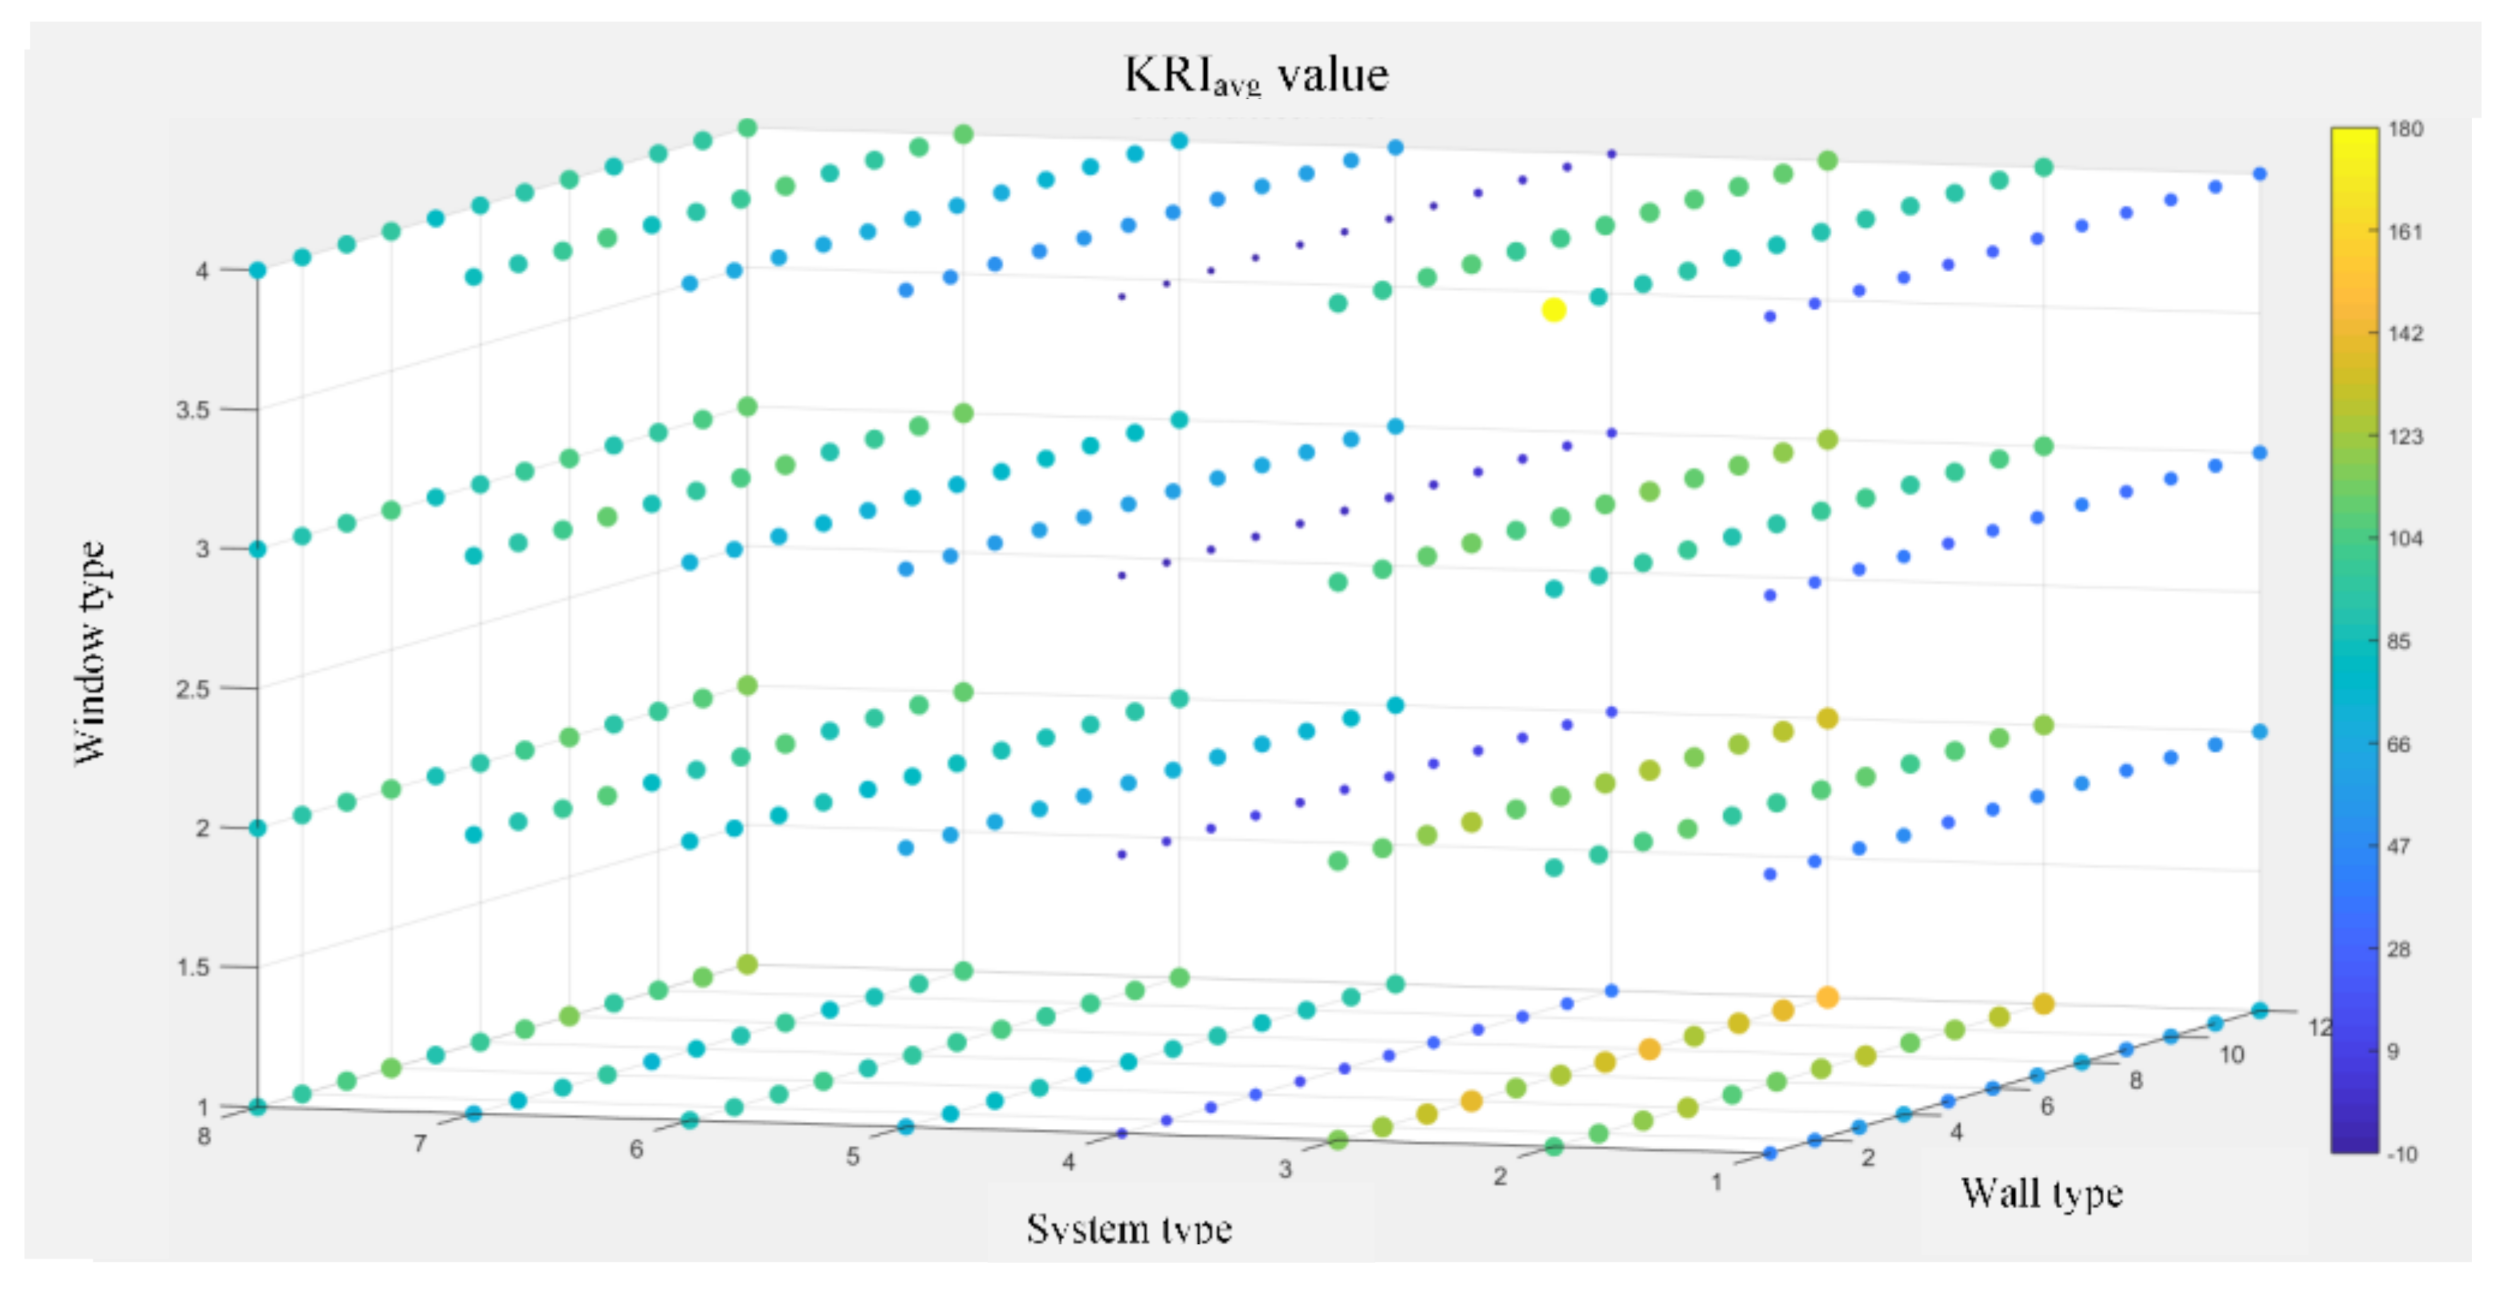
Results of calculations in four-dimensional space (X, Y, Z, C) that met the conditions are presented in Figure 4, Figure 5, Figure 6, Figure 7. Axes (X–wall type, Y–system type, Z–window type) present values of decision variables, and the C axis (color and size of balls) presents the values of the objective function EP (Figure 4), SPBT (Figure 5), KRIavg (Figure 6), and PPDavg (Figure 7). The dark blue and the small diameter of the ball mean the smallest values of the objective function while dark red and large diameter balls indicate the largest values of the objective function. If a given option was excluded due to limitations on the graph, the maximum value of the objective function was assumed for the variant.
As shown in the figures, the minimum of each objective function is obtained with completely different values of decision variables. It can even be said that these criteria are mostly contradictory. A modernization variant that reduces the value of one criterion at the same time increases the value of another. Therefore, Table 15 presents a list of the three best solutions for each criterion.
The lowest primary energy consumption (EP = 103.2 ÷ 103.3 kWh/(m2a)) was obtained in variants containing well-insulated building partitions (10 cm of insulation), with a large window area in the living room, windows with low U-value coefficient (window type 2 and 1), and without external blinds, and mechanical ventilation system with heat recovery (system type 5). These solutions are economical, but they require significant investment cost (KRIavg = 94.5 ÷ 113.6 %) and have a long simple payback time (SPBT = 56.0 ÷ 66.2 years), comparable with the lifecycle of building components. However, the greatest disadvantage of these solutions is the deterioration of thermal comfort of users in the summer. PPDavg values in summer equal to 32.1% and 29.6% and the value of exceeding the internal temperature above 24 °C (DTavg = 4.3 K i 4.04 K) are higher than for the existing state (PPDavg = 26% and DTavg = 3.78 K). This means that thermal comfort does not fit into any of the classes according to EN 7730 [5]. Only one variant (wall type 4, window type 1, system type 5), including windows that absorb significantly solar radiation, allows for an improvement of thermal comfort (PPDavg = 20.57 % i DTavg = 2.92 K), although it is still out of the class.
The shortest simple payback times (SPBT = 14.2 ÷ 15.8 years) allow for obtaining variants with average insulation of walls (5 cm of insulation) and other parameters as for minimum EP. The average annual costs are within the limits KRIavg = 1.82 ÷ 2.33 %, unfortunately, with relatively high primary energy consumption EP = 126.3 ÷ 126.6 kW/(m2·a). Thermal comfort is also not included in any of the classes defined in EN 7730 (PPDavg = 27.45 ÷ 32.65 %; DTavg = 3.94 ÷ 4.56).
Variants of modernization that improve thermal comfort the most are those with well-insulated partitions (10 cm of insulation), a small window surface in the living room (33%), windows with an average U-value coefficient (window type 2 and 3), and external blinds and individual air conditioning system (system type 8). These variants allow for obtaining values of PPDavg = 10.86÷10.91 % and DTavg = 0.58÷0.61 K in the summer. The disadvantage of these solutions is higher consumption of primary energy EP = 137.4 ÷ 141.6 kWh/(m2a) and high investment costs KRIavg = 68.1 ÷ 79.7 %.
The lowest cost investment options are variants that increase the window area in the living room in garden façade. Unfortunately, in addition to low investment costs (and better daylighting in the living room), they do not improve the other indicators. Primary energy consumption EP increases, which makes them uneconomical. Thermal comfort is also worse in these variants.
However, interesting results give a comparison according to the criterion minimum annual average investment costs and operating costs (minimum KRIEavg). In this case, the best results have variants characterized by good insulation of walls (10 cm of insulation), with windows as in the existing state (window type 4), no external blinds, and a natural ventilation system (system type 4). KRIEavg costs are negative, which means that they are smaller than in the existing building (amounting to 90.5 ÷ 91.5% of operating costs in the building analyzed). Investment costs are compensated by reduction of costs for energy. The simple payback time SPBT is from 18.3 to 19.6 years, with primary energy consumption in the range EP = 121.1 ÷122.0 kWh/(m2a). Unfortunately, in these variants thermal comfort is worse in the summer. All three solutions do not fit into any of the classes defined in EN 7730. The values of comfort indicators are within limits PPDavg = 28.44 ÷ 33.81 %, and DTavg = 4.05 ÷ 4.70 K.
Another solution is selection of modernization variants ensuring minimum of only one criterion, while limiting the values of other indicators. In this way, improvement of all indicators can be obtained, i.e., reduction of primary energy consumption in relation to the existing building (EP < 134.5 kW/(m2a)), improving thermal comfort (to be at least in class C according to EN 7730), and economic indicators (SPBT < 70 years). Solutions ensuring maintenance of thermal comfort in at least C class are obtained in variants with well-insulated walls (10 cm of insulation), a small window area in the living room, windows with average thermal coefficient (window type 2 and 3), and building with external blinds and a natural ventilation system (Table 12, sixth row). Lower energy consumption (Table 12, seventh row), with nonclass thermal comfort (but PPDavg < 20%) is obtained in variants with well-insulated walls (10 cm of insulation), a small window area in the living room, and windows with the best thermal insulation (window type 1), in a building without external blinds and mechanical ventilation system with heat recovery (system type 5).
5. Discussion and Future Work
The goal of improving the energy efficiency of single-family buildings by EPBD [1,48] was to increase the awareness of building owners and users of their energy consumption. An extremely important aspect, both in new and modernized buildings, is the thermal comfort of use. In some countries, the energy certification system includes indicators on the number of hours of overheating or the investment costs needed to improve energy efficiency. This study showed that accepting only one decision variable may result in a completely different choice of solutions and technologies, which may not necessarily lead to an improvement in the thermal comfort or energy standard of the building. In the case of single-family buildings, a particularly important aspect is therefore the appropriate formulation of technical regulations for buildings in a way that ensures selection of solutions that improve energy efficiency and thermal comfort.
Currently, there is a discussion on how to properly carry out such modernizations, which results in projects aimed at proper modernization of buildings [49]. When optimizing the modernization of a building, the criterion of its impact on the external environment should also be taken into account, in particular, the use of renewable energy sources and the reduction of CO2 emissions to the atmosphere. The number of decision variables and criteria used will therefore be even greater than presented in the analysis. It is necessary to create tools to support end-users in the proper planning of increasing energy efficiency, but at the same time taking care of the thermal comfort and impact on the external environment. Optimization is a widely available and well-known tool that can be used. Due to the number of decision variables, an integrated function should be formulated and a multicriteria solution should be found. The key problem of the multicriteria optimization of the modernization of the building is the selection of the method of formulating the integrated objective function.
6. Conclusions
The research presented shows that reducing energy consumption in existing single-family buildings can be achieved primarily by increasing the insulation of building external walls. Due to the low insulation costs, implementation of such modernization provides a relatively short simple payback time. However, such modernization usually worsens the thermal comfort of users. Modernizations that improve thermal comfort are primarily the reduction of heat gains by using external blinds, windows with low solar transmittance, or a ventilation system with cooling, but recognizing that a cooling system significantly increases energy consumption and energy costs. Only modernization that allows for obtaining smaller values of all objective functions is window type. Using a window with a lower U value and solar transmission coefficient enables reduction of heat losses and gains, so it saves energy and improves thermal comfort.
Performing modernization without analyzing its effects can have positive or negative consequences, for example, achieving a significant reduction in the primary energy demand but with a decreasing level of thermal comfort. In this paper, solutions were found for the most common decision variables with the assumed limitations. It was shown that separate analysis of indicators leads to completely different solutions and should not be recommended during thermo-modernization of single-family buildings. End-users should be provided with an appropriate advisory and support system so that the process of increasing energy efficiency is beneficial for them, and not only from the economic point of view. Therefore, it is necessary to use multicriteria optimization in order to find an algorithm that helps users to select projects that lower energy demand, reduce emission rate, and improve thermal comfort, while maintaining rational investment costs.
Author Contributions
Concept, J.R. and B.Z.; introduction, B.Z.; methodology, J.R.; calculations, optimization, and analysis, J.R. and B.Z. Both authors have read and agreed to the published version of the manuscript.
Funding
This research was co-financed under the research grant of the Warsaw University of Technology supporting the scientific activity in the discipline of Civil Engineering and Transport.
Institutional Review Board Statement
Not applicable.
Data Availability Statement
Data available on request. The data presented in this study are available on request from the corresponding author.
Conflicts of Interest
The authors declare no conflict of interest.
References
- 2018/844. Directive (EU) 2018/844 of the European Parliament and of the Council of 30 May 2018 Amending Directive 2010/31/EU on the Energy Performance of Buildings and Directive 2012/27/EU on Energy Efficiency. In Official Journal of the European Union; EU: Brussels, Belgium, 2018; OJ L 156, 19.6.2018; pp. 75–91. [CrossRef]
- 2010/31/EU. Directive 2010/31/EU of the European Parliament and of the Council of 19 May 2010 on the Energy Performance of Buildings (Recast). In Official Journal of the European Union; EU: Brussels, Belgium, 2010; OJ L 153, 18.6.2010; pp. 13–35.
- Nowak-Dzieszko, K.; Rojewska-Warchał, M. Influence of the Balcony Glazing Construction on Thermal Comfort of Apartments in Retrofitted Large Panel Buildings. Procedia Eng. 2015, 108, 481–487. [Google Scholar] [CrossRef] [Green Version]
- Fanger, P.O. Thermal Comfort, Analysis and Applications in Environmental Engineering; McGraw-Hill: New York, NY, USA, 1970. [Google Scholar]
- ISO 7730 Ergonomics of the Thermal Environment—Analytical Determination and Interpretation of Thermal Comfort Using Calculation of the PMV and PPD Indices and Local Thermal Comfort Criteria. 2005. Available online: https://www.iso.org/standard/39155.html (accessed on 23 February 2021).
- EN 15251:2007 Indoor Environmental Input Parameters for Design and Assessment of Energy Performance of Buildings Addressing Indoor Air Quality, Thermal Environment, Lighting and Acoustics. 2007. Available online: http://www.cres.gr/greenbuilding/PDF/prend/set4/WI_31_Pre-FV_version_prEN_15251_Indoor_Environment.pdf (accessed on 23 February 2021).
- EN 16798-1:2019 Energy Performance of Buildings—Ventilation for Buildings—Part 1: Indoor Environmental Input Parameters for Design and Assessment of Energy Performance of Buildings Addressing Indoor air Quality, Thermal Environment, Lighting and Acous. 2019. Available online: https://standards.iteh.ai/catalog/standards/cen/b4f68755-2204-4796-854a-56643dfcfe89/en-16798-1-2019 (accessed on 23 February 2021).
- Cabanac, M. Physiological Role of Pleasure. Science 1971, 173, 1103–1107. [Google Scholar] [CrossRef] [PubMed]
- De Dear, R. Revisiting an old hypothesis of human thermal perception: Alliesthesia. Build. Res. Inf. 2011, 39, 108–117. [Google Scholar] [CrossRef]
- Xu, C.; Li, S.; Zhang, X.; Shao, S. Thermal comfort and thermal adaptive behaviours in traditional dwellings: A case study in Nanjing, China. Build. Environ. 2018, 142, 153–170. [Google Scholar] [CrossRef]
- Zhang, H.; Arens, E.; Pasut, W. Air temperature thresholds for indoor comfort and perceived air quality. Build. Res. Inf. 2011, 39, 134–144. [Google Scholar] [CrossRef] [Green Version]
- Zhai, Y.; Zhang, H.; Zhang, Y.; Pasut, W.; Arens, E.; Meng, Q. Comfort under personally controlled air movement in warm and humid environments. Build. Environ. 2013, 65, 109–117. [Google Scholar] [CrossRef] [Green Version]
- Huang, L.; Ouyang, Q.; Zhu, Y.; Jiang, L. A study about the demand for air movement in warm environment. Build. Environ. 2013, 61, 27–33. [Google Scholar] [CrossRef]
- Sun, W.; Cheong, K.; Melikov, A.K. Subjective study of thermal acceptability of novel enhanced displacement ventilation system and implication of occupants’ personal control. Build. Environ. 2012, 57, 49–57. [Google Scholar] [CrossRef]
- García, A.; Olivieri, F.; Larrumbide, E.; Ávila, P. Thermal comfort assessment in naturally ventilated offices located in a cold tropical climate, Bogotá. Build. Environ. 2019, 158, 237–247. [Google Scholar] [CrossRef]
- Lomas, K.J.; Kane, T. Summertime temperatures and thermal comfort in UK homes. Build. Res. Inf. 2013, 41, 259–280. [Google Scholar] [CrossRef] [Green Version]
- Petrova, S.; Gentile, M.; Mäkinen, I.H.; Bouzarovski, S. Perceptions of Thermal Comfort and Housing Quality: Exploring the Microgeographies of Energy Poverty in Stakhanov, Ukraine. Environ. Plan. A Econ. Space 2013, 45, 1240–1257. [Google Scholar] [CrossRef]
- Engvall, K.; Lampa, E.; Levin, P.; Wickman, P.; Öfverholm, E. Interaction between building design, management, household and individual factors in relation to energy use for space heating in apartment buildings. Energy Build. 2014, 81, 457–465. [Google Scholar] [CrossRef]
- Huang, L.; Zhu, Y.; Ouyang, Q.; Cao, B. Field survey of indoor thermal comfort in rural housing of northern China in heating season. J. Southeast Univ. 2010, 26, 169–172. [Google Scholar]
- Nematchoua, M.K.; Tchinda, R.; Orosa, J.A. Adaptation and comparative study of thermal comfort in naturally ventilated classrooms and buildings in the wet tropical zones. Energy Build. 2014, 85, 321–328. [Google Scholar] [CrossRef] [Green Version]
- Moujalled, B.; Cantin, R.; Guarracino, G. Comparison of thermal comfort algorithms in naturally ventilated office buildings. Energy Build. 2008, 40, 2215–2223. [Google Scholar] [CrossRef]
- Wagner, A.; Gossauer, E.; Moosmann, C.; Gropp, T.; Leonhart, R. Thermal comfort and workplace occupant satisfaction—Results of field studies in German low energy office buildings. Energy Build. 2007, 39, 758–769. [Google Scholar] [CrossRef]
- Akair, A.; Bánhidi, L. Thermal comfort investigation in Libya. Period. Polytech. Mech. Eng. 2007, 51, 45. [Google Scholar] [CrossRef] [Green Version]
- Hameln, M.; Zmeureanu, R. Multi-objective life cycle optimization of a single-family house envelope. In Proceedings of the Canadian Conference on Building Simulation, Halifax, Canada, 1–4 May 2012; pp. 202–214. [Google Scholar]
- Chardon, S.; Brangeon, B.; Bozonnet, E.; Inard, C. Construction cost and energy performance of single family houses: From integrated design to automated optimization. Autom. Constr. 2016, 70, 1–13. [Google Scholar] [CrossRef]
- Grygierek, K.; Ferdyn-Grygierek, J.; Gumińska, A.; Baran, Ł.; Barwa, M.; Czerw, K.; Gowik, P.; Makselan, K.; Potyka, K.; Psikuta, A. Energy and Environmental Analysis of Single-Family Houses Located in Poland. Energies 2020, 13, 2740. [Google Scholar] [CrossRef]
- Hurnik, M.; Specjal, A.; Popiolek, Z.; Kierat, W. Assessment of single-family house thermal renovation based on comprehensive on-site diagnostics. Energy Build. 2018, 158, 162–171. [Google Scholar] [CrossRef]
- Fedorczak-Cisak, M.; Kotowicz, A.; Radziszewska-Zielina, E.; Sroka, B.; Tatara, T.; Barnaś, K. Multi-Criteria Optimisation of an Experimental Complex of Single-Family Nearly Zero-Energy Buildings. Energies 2020, 13, 1541. [Google Scholar] [CrossRef] [Green Version]
- Grygierek, K.; Ferdyn-Grygierek, J. Multi-Objective Optimization of the Envelope of Building with Natural Ventilation. Energies 2018, 11, 1383. [Google Scholar] [CrossRef] [Green Version]
- Petrovic, B.; Myhren, J.A.; Zhang, X.; Wallhagen, M.; Eriksson, O. Life cycle assessment of a wooden single-family house in Sweden. Appl. Energy 2019, 251, 113253. [Google Scholar] [CrossRef]
- Dara, C.; Hachem-Vermette, C.; Assefa, G. Life cycle assessment and life cycle costing of container-based single-family housing in Canada: A case study. Build. Environ. 2019, 163, 106332. [Google Scholar] [CrossRef]
- Becchio, C.; Dabbene, P.; Fabrizio, E.; Monetti, V.; Filippi, M. Cost optimality assessment of a single family house: Building and technical systems solutions for the nZEB target. Energy Build. 2015, 90, 173–187. [Google Scholar] [CrossRef]
- Ekström, T.; Bernardo, R.; Blomsterberg, Å. Cost-effective passive house renovation packages for Swedish single-family houses from the 1960s and 1970s. Energy Build. 2018, 161, 89–102. [Google Scholar] [CrossRef]
- Colli, C.; Bataille, A.; Antczak, E.; Buyle-Bodin, F. Life Cycle Assessment of a French Single-Family House Refurbishment: The “Bat-Eco2” Case Study. Procedia CIRP 2018, 69, 160–165. [Google Scholar] [CrossRef]
- Azizi, S.; Nair, G.; Olofsson, T. Adoption of Energy Efficiency Measures in Renovation of Single-Family Houses: A Comparative Approach. Energies 2020, 13, 6042. [Google Scholar] [CrossRef]
- Roberti, F.; Oberegger, U.F.; Lucchi, E.; Gasparella, A. Energy retrofit and conservation of built heritage using multi-objective optimization: Demonstration on a medieval building. Build. Simul. Appl. 2015, 2015, 189–197. [Google Scholar]
- Lucchi, E.; Tabak, M.; Troi, A. The “Cost Optimality” Approach for the Internal Insulation of Historic Buildings. Energy Procedia 2017, 133, 412–423. [Google Scholar] [CrossRef]
- Bjørneboe, M.G.; Svendsen, S.; Heller, A. Evaluation of the renovation of a Danish single-family house based on measurements. Energy Build. 2017, 150, 189–199. [Google Scholar] [CrossRef] [Green Version]
- Bjørneboe, M.G.; Svendsen, S.; Heller, A. Initiatives for the energy renovation of single-family houses in Denmark evaluated on the basis of barriers and motivators. Energy Build. 2018, 167, 347–358. [Google Scholar] [CrossRef]
- Dzikuć, M.; Piwowar, A.; Szufa, S.; Adamczyk, J.; Dzikuć, M. Potential and Scenarios of Variants of Thermo-Modernization of Single-Family Houses: An Example of the Lubuskie Voivodeship. Energies 2021, 14, 191. [Google Scholar] [CrossRef]
- Blazy, R.; Błachut, J.; Ciepiela, A.; Łabuz, R.; Papież, R. Thermal Modernization Cost and the Potential Ecological Effect—Scenario Analysis for Thermal Modernization in Southern Poland. Energies 2021, 14, 2033. [Google Scholar] [CrossRef]
- TRNSYS 16 Manual. 2018. Available online: http://web.mit.edu/parmstr/Public/Documentation/05-MathematicalReference.pdf (accessed on 10 October 2020).
- Rucińska, J. Optimization of Annual Energy Costs in a Single-Family House Including Thermal Comfort. Ph.D. Thesis, Warsaw University of Technology, Faculty of Environmental Engineering, Warszawa, Poland, 2013. [Google Scholar]
- PN-EN ISO 15927-4:2007 Hygrothermal Performance of Buildings—Calculation and Presentation of Climatic Data—Part 4: Hourly Data for Assessing the Annual Energy Use for Heating and Cooling. Polish Committee for Standardization 2007. Available online: https://www.iso.org/standard/41371.html (accessed on 23 February 2021).
- Tess Libraries. 2014. Available online: http://www.trnsys.com/tess-libraries/ (accessed on 10 October 2020).
- Skou, M.B.; Kragh, J. Proposal for an Energy Rating System of Windows in EU. 2009. Available online: https://www.buildup.eu/en/practices/publications/proposal-energy-rating-system-windows-eu (accessed on 10 October 2020).
- Rucińska, J.; Panek, A.; Trząski, A. Energy Certification of Windows in Poland. In Proceedings of the International World Sustainable Building Conferencei, Helsinki, Finlandia, 18–21 October 2011. [Google Scholar]
- 2002/91/EC. Directive 2002/91/EC of the European Parliament and of the Council 6 December 2002 on the Energy Performance of Buildings. In Official Journal of the European Union; EU: Brussels, Belgium, 2003; OJ L 1, 4.1.2003; pp. 65–71.
- Fabbri, M.; de Groote, M.; Rapf, O. Building Renovation Passports: Customised Roadmaps towards Deep Renovation and Better Homes; Buildings Performance Institute Europe: Brussels, Belgium, 2016; p. 46. [Google Scholar]
Figure 1.
Plan of stories in the analyzed building.
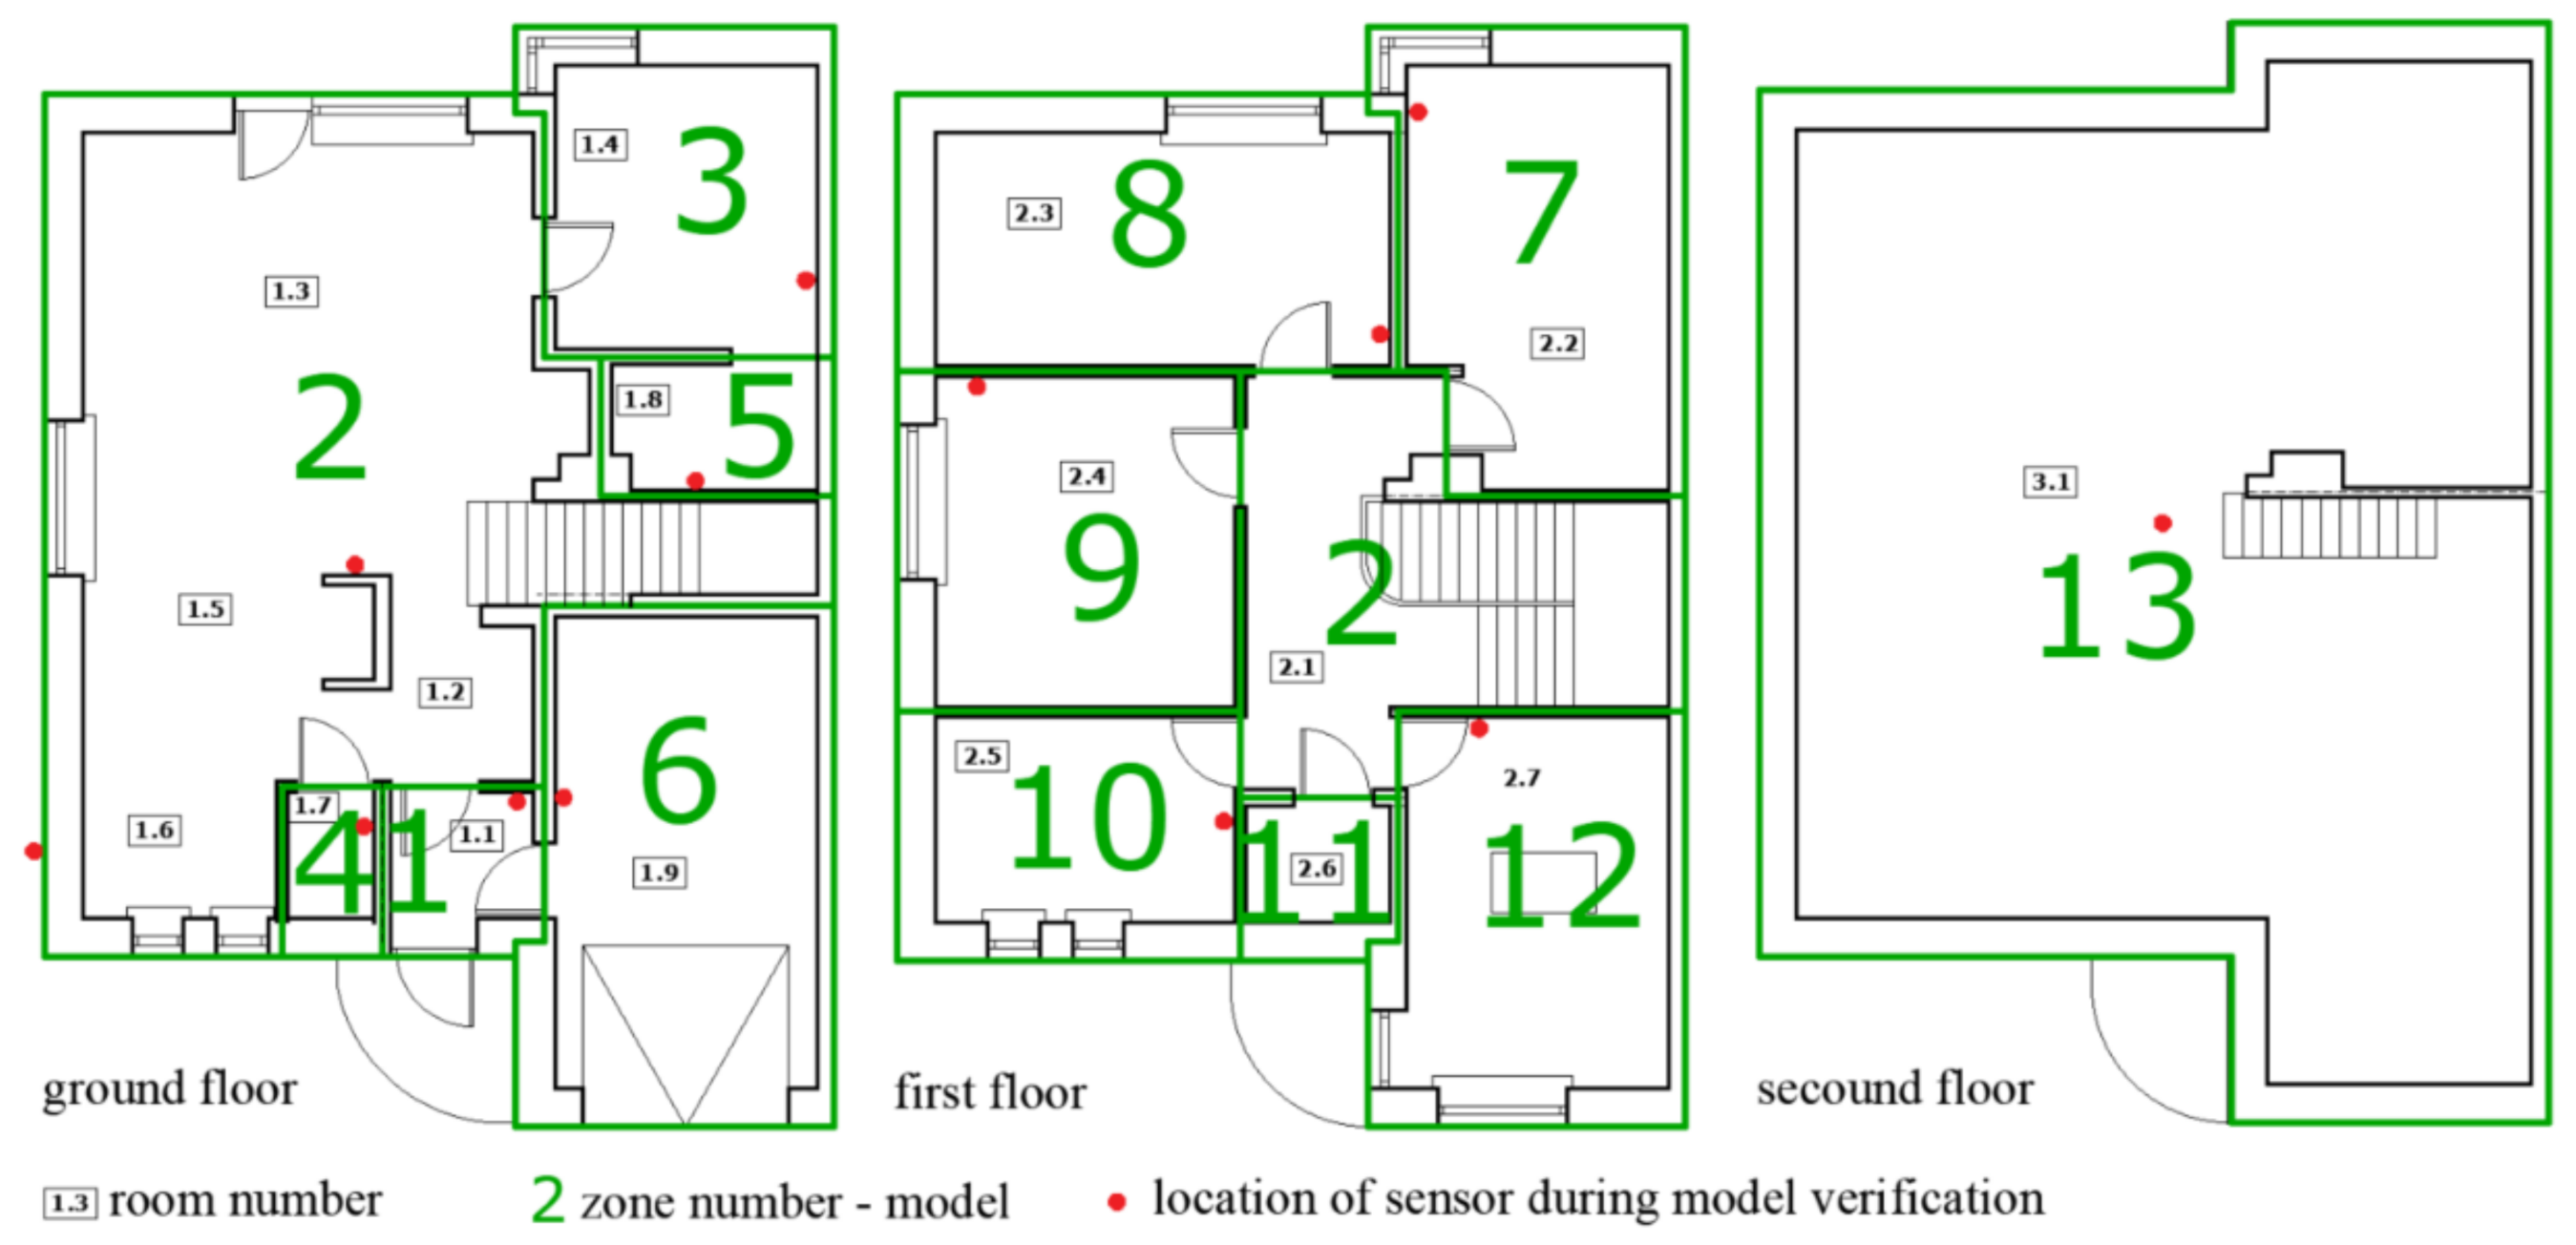
Figure 2.
Air temperature and heat gains in zone 2, 4–11 April.

Figure 3.
Objective functions—methodology of calculation.
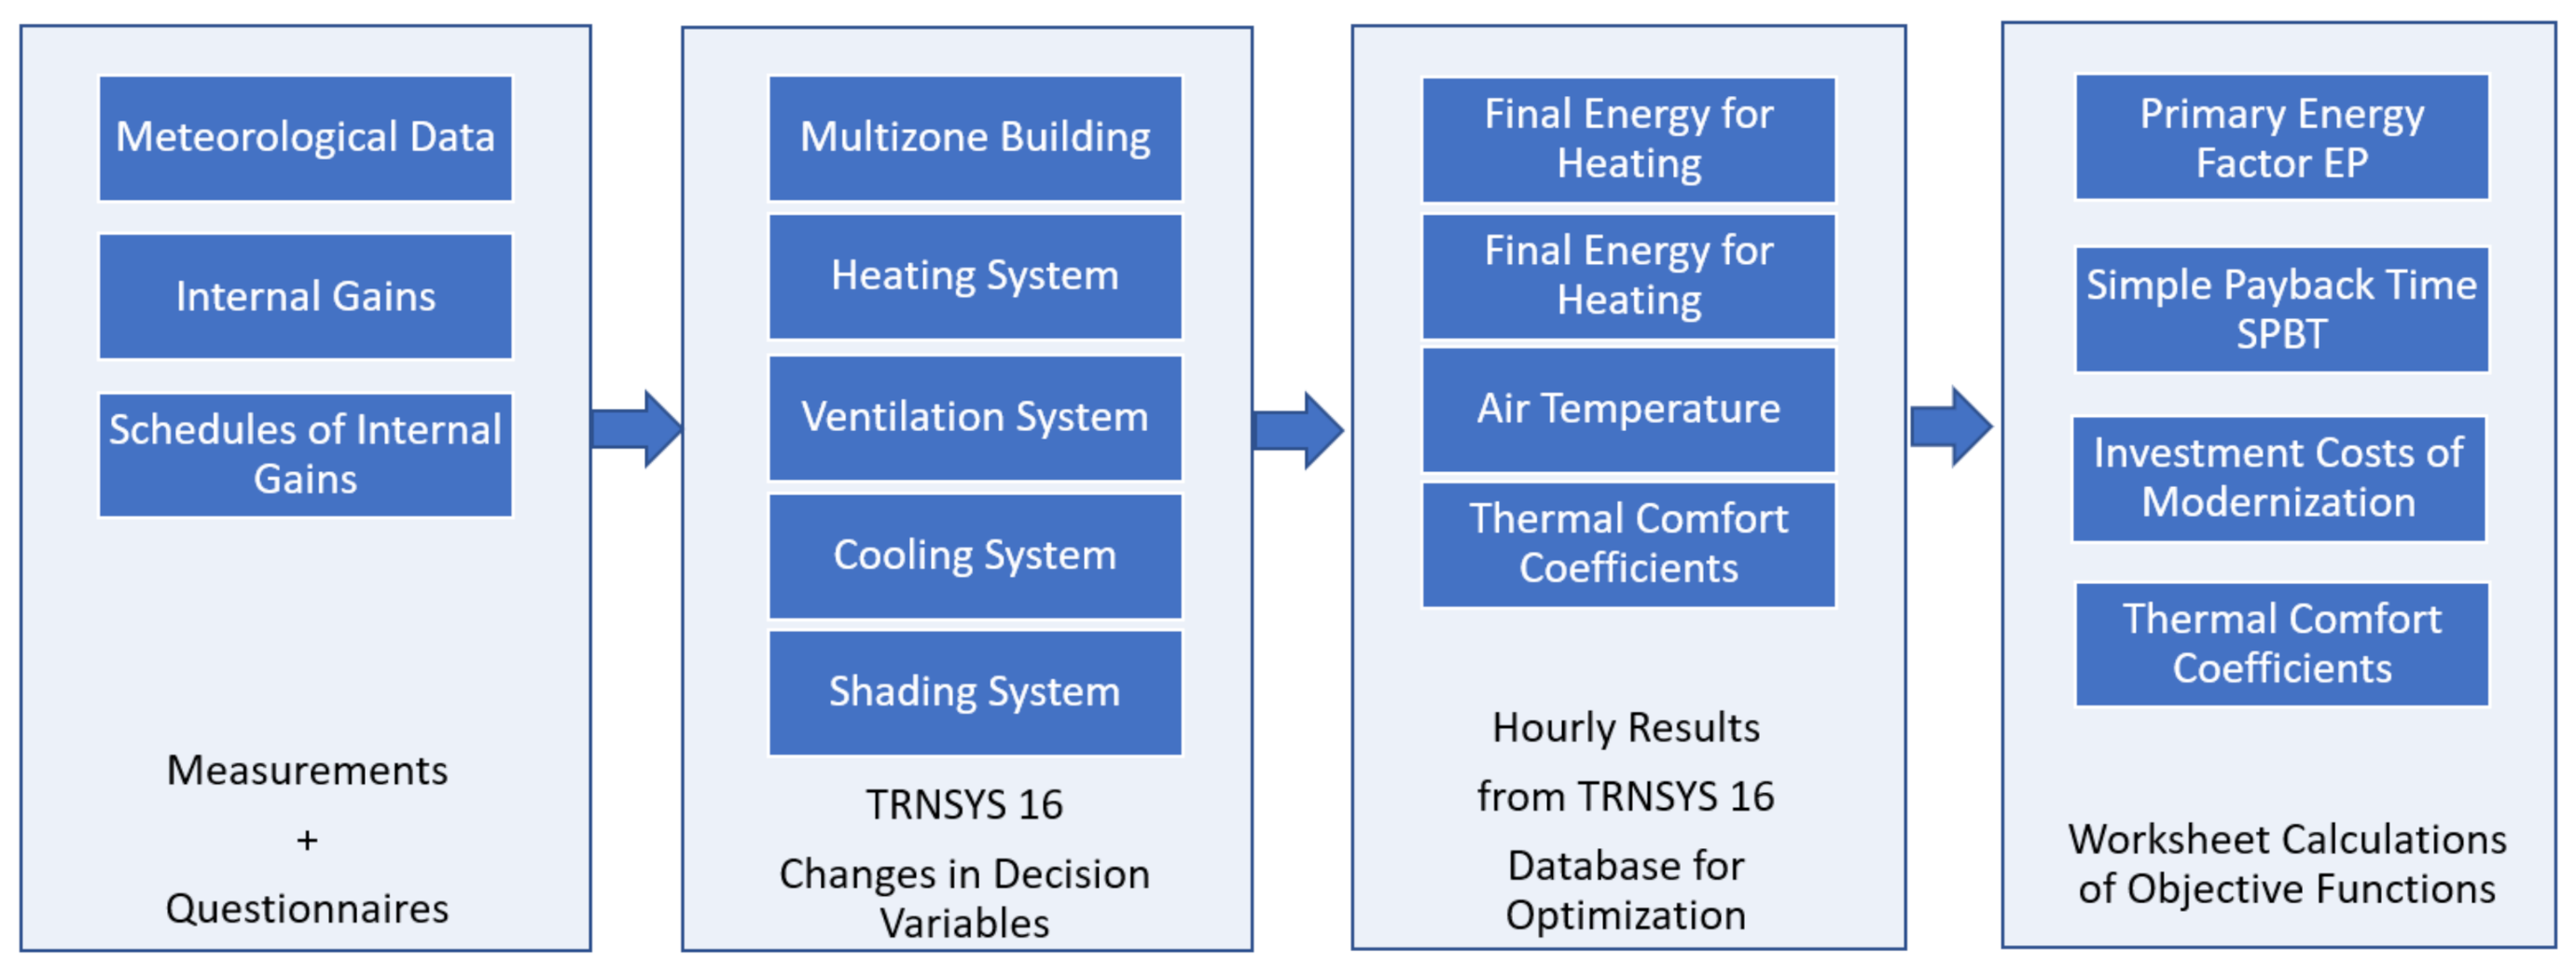
Figure 4.
The values of the EP objective function in the space of decision variables (wall type, window type, and system type).
Figure 4.
The values of the EP objective function in the space of decision variables (wall type, window type, and system type).

Figure 5.
The values of the SPBT objective function in the space of decision variables (wall type, window type, and system type).
Figure 5.
The values of the SPBT objective function in the space of decision variables (wall type, window type, and system type).

Figure 6.
The values of the KRIavg objective function in the space of decision variables (wall type, window type, and system type).
Figure 6.
The values of the KRIavg objective function in the space of decision variables (wall type, window type, and system type).

Figure 7.
The values of the PPDavg objective function in the space of decision variables (wall type, window type and system type).
Figure 7.
The values of the PPDavg objective function in the space of decision variables (wall type, window type and system type).

Table 1.
List of rooms in the analyzed building.
| Room Number | Room Type | Area (m2) | Zone Number | Room Number | Room Type | Area (m2) | Zone Number |
|---|---|---|---|---|---|---|---|
| 1.1 | Hall | 3.07 | 1 | 2.1 | Hall | 9.70 | 2 |
| 1.2 | Hall | 3.31 | 2 | 2.2 | Room | 14.33 | 7 |
| 1.3 | Living room | 28.99 | 2 | 2.3 | Room | 14.47 | 8 |
| 1.4 | Office room | 10.34 | 3 | 2.4 | Room | 13.54 | 9 |
| 1.5 | Kitchen | 11.68 | 2 | 2.5 | Bathroom | 8.43 | 10 |
| 1.7 | Toilet | 1.59 | 4 | 2.6 | Toilet | 2.29 | 11 |
| 1.8 | Boiler room | 3.52 | 5 | 2.7 | Room | 13.50 | 12 |
| 1.9 | Garage | 16.94 | 6 | 3.1 | Attic | 84.54 | 13 |
Table 2.
Thermal parameters.
| Heat Transfer Coefficient U, (W/(m2K)) | |
|---|---|
| External wall | 0.283 |
| Roof | 0.208 |
| Window glazing | 1.4 |
| Doors | 1.6 |
| Garage doors | 1.6 |
| Windows g-value, (-) | 0.48 |
| Thermal bridges, Ψ-value, (W/(mK)) | |
| Corner | −0.11 |
| Floor—external wall | 0.04 |
| Roof—external wall | −0.15 |
| Window/doors—external wall | 0.08 |
| Balcony—external wall | 0.37 |
| Ground—external wall | −0.096 |
| Ground—internal wall | 0.65 |
Table 3.
Characteristic parameters of the heating system.
| Room Number | Room Type | Radiator Type | Radiator Power (W) | Thermostatic Valve Flow Coefficient (m3/h) | Valve Authority |
|---|---|---|---|---|---|
| 1.1 | Hall | floor | 200 | 0.067 | 0.63 |
| 1.2 | Hall | - | - | - | - |
| 1.3 | Living room | compact | 1136 758 | 0.191 0.130 | 0.62 0.59 |
| 1.4 | Office Room | compact | 660 | 0.130 | 0.45 |
| 1.5 and 1.6 | Kitchen with dining room | rail | 258 | 0.070 | 0.24 |
| 1.7 | Toilet | rail | 251 | 0.059 | 0.32 |
| 1.8 | Boiler room | compact | 0 | 0.059 | 0.05 |
| 1.9 | Garage | compact | 630 | 0.130 | 0.41 |
| 2.1 | Hall | compact | 270 | 0.130 | 0.07 |
| 2.2 | Room | compact | 752 | 0.130 | 0.57 |
| 2.3 | Room | compact | 835 | 0.134 | 0.66 |
| 2.4 | Room | compact | 588 | 0.130 | 0.35 |
| 2.5 | Bathroom | floor rail | 443 295 | 0.180 0.054 | 0.41 0.51 |
| 2.6 | Toilet | rail | 232 | 0.070 | 0.19 |
| 2.7 | Room | compact | 877 | 0.176 | 0.42 |
| 3.1 | Attic | - | - | - | - |
Table 4.
Air change rate in the analyzed zones.
| Zone | 1 | 2 | 3 | 4 | 5 | 6 | |
| 1.11–14.03 | 0.55 | 0.60 | 0.75 | 0.85 | 0.40 | 0.55 | |
| 15.03–31.05 15.09–31.10 | 0.95 | 0.95 | 0.75 | 0.85 | 0.40 | 0.95 | |
| 01.06–14.09 | 1.00 | 1.50 | 0.75 | 0.85 | 0.40 | 0.95 | |
| Zone | 7 | 8 | 9 | 10 | 11 | 12 | 13 |
| 1.11–14.03 | 0.40 | 0.40 | 0.40 | 0.40 | 0.40 | 0.50 | 0.40 |
| 15.03–31.05 15.09–31.10 | 0.95 | 0.40 | 0.95 | 0.40 | 0.40 | 0.50 | 0.40 |
| 01.06–14.09 | 1.00 | 1.00 | 1.00 | 0.50 | 1.00 | 1.00 | 0.40 |
Table 5.
Cooling units and air flow.
| Zone Number | 2 | 3 | 7 | 8 | 9 | 12 |
|---|---|---|---|---|---|---|
| Supply air flow, (m3/h) | 820 | 410 | 410 | 410 | 410 | 410 |
| Nominal cooling power, (kW) | 2.0 | 2.0 | 2.0 | 2.0 | 2.0 | 2.0 |
Table 6.
Parameters used in the calculation of PPD index in each zone.
| Period | Clothing Insulation (All Zones) (clo) | Metabolic Rate (Met) | ||||||
|---|---|---|---|---|---|---|---|---|
| 2 | 3 | 7 | 8 | 9 | 12 | |||
| 1.11–14.03 | 22-5 | 1.0 | 1.2 | 1.2 | 0.8 | 1.2 | 0.8 | 0.8 |
| 6-21 | 1.0 | 1.2 | 1.2 | 1.2 | 1.2 | 1.2 | 1.2 | |
| 15.03–31.05 15.09–31.10 | 22-5 | 0.7 | 1.2 | 1.2 | 0.8 | 1.2 | 0.8 | 0.8 |
| 6-21 | 0.7 | 1.2 | 1.2 | 1.2 | 1.2 | 1.2 | 1.2 | |
| 1.06–14.09 | 22-5 | 0.5 | 1.2 | 1.2 | 0.8 | 1.2 | 0.8 | 0.8 |
| 6-21 | 0.5 | 1.2 | 1.2 | 1.2 | 1.2 | 1.2 | 1.2 | |
Table 7.
Meteorological data used for the verification of the simulation model.
| Period | External Air Temperature (°C) | Maximum/Minimum External Air Temperature (°C) | Solar Radiation, (W/m2) | ||||
|---|---|---|---|---|---|---|---|
| H | N | E | S | W | |||
| 26.01–6.02 | 1.00 | 13.83/−6.23 | 45.6 | 15.2 | 30.0 | 94.0 | 39.4 |
| 22.02–6.03 | 1.58 | 12.31/−15.67 | 66.0 | 24.9 | 40.0 | 81.3 | 52.9 |
| 04.04–11.04 | 11.78 | 26.64/0.26 | 131.6 | 43.4 | 75.1 | 111.2 | 86.1 |
| 18.04–24.04 | 10.12 | 28.88/−3.64 | 171.8 | 48.8 | 109.5 | 131.6 | 111.3 |
| 5.07–14.07 | 24.75 | 26.75/22.23 | 247.3 | 73.0 | 140.5 | 133.9 | 142.4 |
Table 8.
Verification results.
| Period | ||||||||||
|---|---|---|---|---|---|---|---|---|---|---|
| Zone | 26.01–6.02. (te,avg * = 1.00 °C) | 22.02–6.03. (te,avg * = 1.58 °C) | 04.04–11.04. (te,avg * = 11.78 °C) | 18.04–24.04. (te,avg * = 10.12 °C) | 05.07–13.07. (te,avg * = 24.75 °C) | |||||
| σ K | ∆t K | σ K | ∆t K | σ K | ∆t K | σ K | ∆t K | σ K | ∆t K | |
| 1 | 1.03 | −0.30 | 0.56 | 0.45 | 0.66 | 0.07 | 0.78 | 0.52 | 0.75 | 0.53 |
| 2 | 0.60 | −0.42 | 0.75 | −0.27 | 1.36 | −0.45 | 1.20 | −0.26 | 1.25 | −0.52 |
| 3 | 0.69 | −0.36 | 0.71 | −0.48 | 1.18 | −0.54 | 0.96 | 0.15 | 0.92 | −0.14 |
| 4 | 1.87 | −0.54 | 1.32 | 0.04 | 1.92 | −0.27 | 1.71 | −0.17 | 1.48 | 0.26 |
| 5 | 0.76 | 0.56 | 1.09 | 1.00 | 0.75 | −0.32 | 0.74 | 0.36 | 0.69 | 0.16 |
| 6 | 0.88 | −0.59 | 0.85 | 0.88 | 0.88 | 0.50 | 0.73 | 0.09 | 1.52 | 1.05 |
| 7 | 0.55 | −0.12 | 0.53 | 0.01 | 0.71 | 0.10 | 0.90 | 0.52 | 1.41 | −0.99 |
| 8 | 0.66 | −0.48 | 0.48 | −0.19 | 0.65 | −0.32 | 0.70 | −0.21 | 1.19 | −0.32 |
| 9 | 0.76 | −0.25 | 0.81 | 0.50 | 1.07 | 0.46 | 1.03 | 0.15 | 1.80 | −1.26 |
| 10 | 0.65 | −0.45 | 0.42 | 0.03 | 0.45 | 0.24 | 0.48 | 0.17 | 0.70 | −0.05 |
| 11 | - | - | - | - | 0.45 | 0.00 | 0.58 | 0.00 | - | - |
| 12 | 0.82 | −0.37 | 0.72 | 0.18 | 0.75 | −0.13 | 1.10 | −0.23 | 1.26 | 0.33 |
| 13 | 1.48 | 0.54 | 1.03 | 0.85 | 1.73 | −0.67 | 1.53 | 0.03 | 1.41 | 0.72 |
| ΔQh,k% | −0.8 | 5.4 | 1.5 | −4.0 | - | |||||
| 0.88 | 0.62 | 1.13 | 1.03 | 1.28 | ||||||
| Δti ** | −0.21 | 0.23 | −0.10 | 0.09 | 0.10 | |||||
| Δti′ *** | −0.36 | 0.03 | −0.09 | 0.07 | −0.07 | |||||
* te,avg—external average temperature during verification period; ** Δti—average difference between the temperature value obtained from the measurements and the simulation model for all zones; *** Δti′—average difference between the temperature value obtained from the measurements and the simulation model for all zones (without zone 13).
Table 9.
The relation between the values of the new decision variable, average thermal insulation of the building, window type, and window area.
Table 9.
The relation between the values of the new decision variable, average thermal insulation of the building, window type, and window area.
| New Variable “Wall Type” | W_2 | W_4 | W_7 | W_10 | ||||||||
|---|---|---|---|---|---|---|---|---|---|---|---|---|
| Al | I | Uavg | Al | I | Uavg | Al | I | Uavg | Al | I | Uavg | |
| - | cm | - | cm | - | cm | - | cm | |||||
| 1 | 0.33 | 10 | 0.218 | 0.33 | 10 | 0.236 | 0.33 | 10 | 0.254 | 0.33 | 10 | 0.272 |
| 2 | 0.50 | 10 | 0.223 | 0.50 | 10 | 0.242 | 0.50 | 10 | 0.261 | 0.50 | 10 | 0.280 |
| 3 | 0.67 | 10 | 0.228 | 0.67 | 10 | 0.248 | 0.67 | 10 | 0.269 | 0.67 | 10 | 0.290 |
| 4 | 0.83 | 10 | 0.233 | 0.83 | 10 | 0.255 | 0.83 | 10 | 0.277 | 0.83 | 10 | 0.299 |
| 5 | 0.33 | 5 | 0.260 | 0.33 | 5 | 0.278 | 0.33 | 5 | 0.296 | 0.33 | 5 | 0.313 |
| 6 | 0.50 | 5 | 0.264 | 0.50 | 5 | 0.283 | 0.50 | 5 | 0.302 | 0.50 | 5 | 0.321 |
| 7 | 0.67 | 5 | 0.269 | 0.67 | 5 | 0.290 | 0.67 | 5 | 0.310 | 0.67 | 5 | 0.331 |
| 8 | 0.83 | 5 | 0.273 | 0.83 | 5 | 0.296 | 0.83 | 5 | 0.318 | 0.83 | 5 | 0.340 |
| 9 | 0.33 | 0 | 0.325 | 0.33 | 0 | 0.343 | 0.33 | 0 | 0.361 | 0.33 | 0 | 0.379 |
| 10 | 0.50 | 0 | 0.329 | 0.50 | 0 | 0.348 | 0.50 | 0 | 0.367 | 0.50 | 0 | 0.386 |
| 11 | 0.67 | 0 | 0.333 | 0.67 | 0 | 0.354 | 0.67 | 0 | 0.375 | 0.67 | 0 | 0.395 |
| 12 | 0.83 | 0 | 0.337 | 0.83 | 0 | 0.359 | 0.83 | 0 | 0.382 | 0.83 | 0 | 0.404 |
Table 10.
Specific parameters of windows: Uw—heat transfer coefficient of windows and g-factor transmittance glazing [43].
Table 10.
Specific parameters of windows: Uw—heat transfer coefficient of windows and g-factor transmittance glazing [43].
| Window Type | 1 | 2 | 3 | 4 | 5 | 6 | 7 | 8 | 9 | 10 | 11 | 12 |
|---|---|---|---|---|---|---|---|---|---|---|---|---|
| Uw (W/(m2K)) | 0.8 | 0.8 | 1.0 | 1.0 | 1.2 | 1.2 | 1.2 | 1.4 | 1.4 | 1.4 | 1.6 | 1.6 |
| gg (–) | 0.21 | 0.28 | 0.28 | 0.35 | 0.32 | 0.35 | 0.42 | 0.35 | 0.42 | 0.48 | 0.35 | 0.42 |
Table 11.
Air flows in the mechanical ventilation system.
| Zone | 1 | 2 | 3 | 4 | 5 | 6 | 7 | 8 | 9 | 10 | 11 | 12 | 13 | Σ |
|---|---|---|---|---|---|---|---|---|---|---|---|---|---|---|
| Supply air (m3/h) | 0 | 100 | 50 | 0 | 0 | 0 | 50 | 50 | 50 | 0 | 0 | 50 | 0 | 350 |
| Exhaust air (m3/h) | 30 | 160 | 0 | 30 | 0 | 30 | 0 | 0 | 0 | 70 | 30 | 0 | 0 | 350 |
Table 12.
The values of the comfort weighting factor.
| Zone | 2 | 3 | 7 | 8 | 9 | 12 |
|---|---|---|---|---|---|---|
| zone area [m2] | 53.7 | 10.3 | 14.3 | 14.5 | 13.5 | 13.5 |
| wPPD_k | 0.45 | 0.09 | 0.12 | 0.12 | 0.11 | 0.11 |
Table 13.
Additional costs—windows.
| Type of Window | W_2 | W_4 | W_7 | W_10 | |
|---|---|---|---|---|---|
| Change of type of windows | Costs, EUR/m2 | 79.55 | 45.45 | 22.73 | 0.00 |
| Change of window area in the living room on the garden façade | Costs, EUR/m2 | 88.64 | 54.55 | 31.82 | 9.09 |
Table 14.
Additional costs—systems.
| System Type | VN + S | VN + C | VN + C + S | VM | VM + S | VM + C | VM + C + S |
|---|---|---|---|---|---|---|---|
| EUR | |||||||
| - | 2442 | 5814 | 6512 | ||||
| Al = 33% | 2244 | 4686 | 8058 | 8755 | |||
| Al = 50% | 2428 | 4870 | 8242 | 8940 | |||
| Al = 67% | 2662 | 5104 | 8476 | 9174 | |||
| Al = 83% | 2882 | 5324 | 8696 | 9393 | |||
Table 15.
Three best modernization solutions according to each criterion.
| Criterion | Variant Number | Value of Decision Variables 0 | EP | SPBT | PPDavg | DTavg | KRIavg | |
|---|---|---|---|---|---|---|---|---|
| - | - | - | - | years | % | K | % | |
| 1 | min EP | w270 w246 w269 | (4,2,5) (3,2,5) (4,1,5) | 103.2 103.3 103.3 | 57.3 56.0 66.2 | 32.10 29.62 20.57 | 4.30 4.04 2.92 | 97.4 94.5 113.6 |
| 2 | min SPBT | w2 w118 w 142 | (5,4,4) (6,4,4) (7,4,4) | 126.3 126.5 126.6 | 14.2 14.9 15.8 | 27.45 30.09 32.65 | 3.94 4.28 4.59 | 1.82 2.04 2.33 |
| 3 | min PPDavg | w197 w198 w218 | (1,2,8) (1,3,8) (2,2,8) | 137.4 141.6 139.4 | NN 1 NN 1 NN 1 | 10.86 10.91 10.93 | 0.58 0.61 0.60 | 75.0 68.1 79.7 |
| 4 | min KRIavg | w4 w5 w6 | (10,4,4) (11,4,4) (12,4,4) | 134.51 134.54 134.57 | NN 1 NN 1 NN 1 | 28.47 30.90 33.14 | 4.10 4.41 4.69 | 0.23 0.51 0.78 |
| 5 | min KRIEavg 3 | w3 w208 w232 | (1,4,4) (2,4,4) (3,4,4) | 121.1 121.8 122.0 | 18.3 18.9 19.6 | 28.44 31.17 33.81 | 4.05 4.38 4.70 | −9.5 2 −9.0 2 −8.5 2 |
| 6 | min PPDavgSPBT < 70 EP < 134,5 | w191 w210 w192 | (1,2,1) (2,2,1) (1,3,1) | 119.6 119.7 120.4 | 60.4 65.9 56.2 | 14.7 15.28 15.73 | 2.01 2.11 2.19 | 45.0 49.8 38.1 |
| 7 | min EP SPBT < 70 PPDavg < 20% | w245 w221 w199 | (3,1,5) (2,1,5) (1,1,5) | 103.5 103.6 103.8 | 63.8 61.3 59.4 | 19.33 18.88 17.58 | 2.76 2.58 2.40 | 108.6 103.3 99.1 |
0 Value of decision variables means (wall type, window type, system type); 1 values SPBT = NN means that the costs of modernization will not be refunded; 2 concern costs KRIEavg, negative values mean that the total investment and operating costs will be lower than in the existing building (they amount to 90.5 ÷ 91.5% of operating costs); 3 definition in the text.
Publisher’s Note: MDPI stays neutral with regard to jurisdictional claims in published maps and institutional affiliations. |
© 2021 by the authors. Licensee MDPI, Basel, Switzerland. This article is an open access article distributed under the terms and conditions of the Creative Commons Attribution (CC BY) license (https://creativecommons.org/licenses/by/4.0/).
Share and Cite
MDPI and ACS Style
Zawada, B.; Rucińska, J. Optimization of Modernization of a Single-Family Building in Poland Including Thermal Comfort. Energies 2021, 14, 2925. https://doi.org/10.3390/en14102925
AMA Style
Zawada B, Rucińska J. Optimization of Modernization of a Single-Family Building in Poland Including Thermal Comfort. Energies. 2021; 14(10):2925. https://doi.org/10.3390/en14102925
Chicago/Turabian StyleZawada, Bernard, and Joanna Rucińska. 2021. "Optimization of Modernization of a Single-Family Building in Poland Including Thermal Comfort" Energies 14, no. 10: 2925. https://doi.org/10.3390/en14102925
Note that from the first issue of 2016, this journal uses article numbers instead of page numbers. See further details here.