
Machine Learning and GIS Approach for Electrical Load Assessment to Increase Distribution Networks Resilience


Abstract
:1. Introduction
2. Machine Learning for Electrical Load Assessment
2.1. Unsupervised Learning
2.2. Supervised Learning
- Root: the starting point of the tree which contains all the considered samples. The root has only outgoing arrows.
- Nodes: groups of samples created by dividing the samples of a previous node. Nodes have incoming and outgoing arrows.
- Leaves: terminal nodes of the tree, where a decision is finally made. Leaves only have incoming arrows.
- Branch: a smaller tree containing only a part of the whole tree.
- Parent/child: a node is the child of the upper node and the parent of the lower node.
- Pruning: the process of removing a portion of the tree starting from the leaves. It is usually done to avoid overfitting.
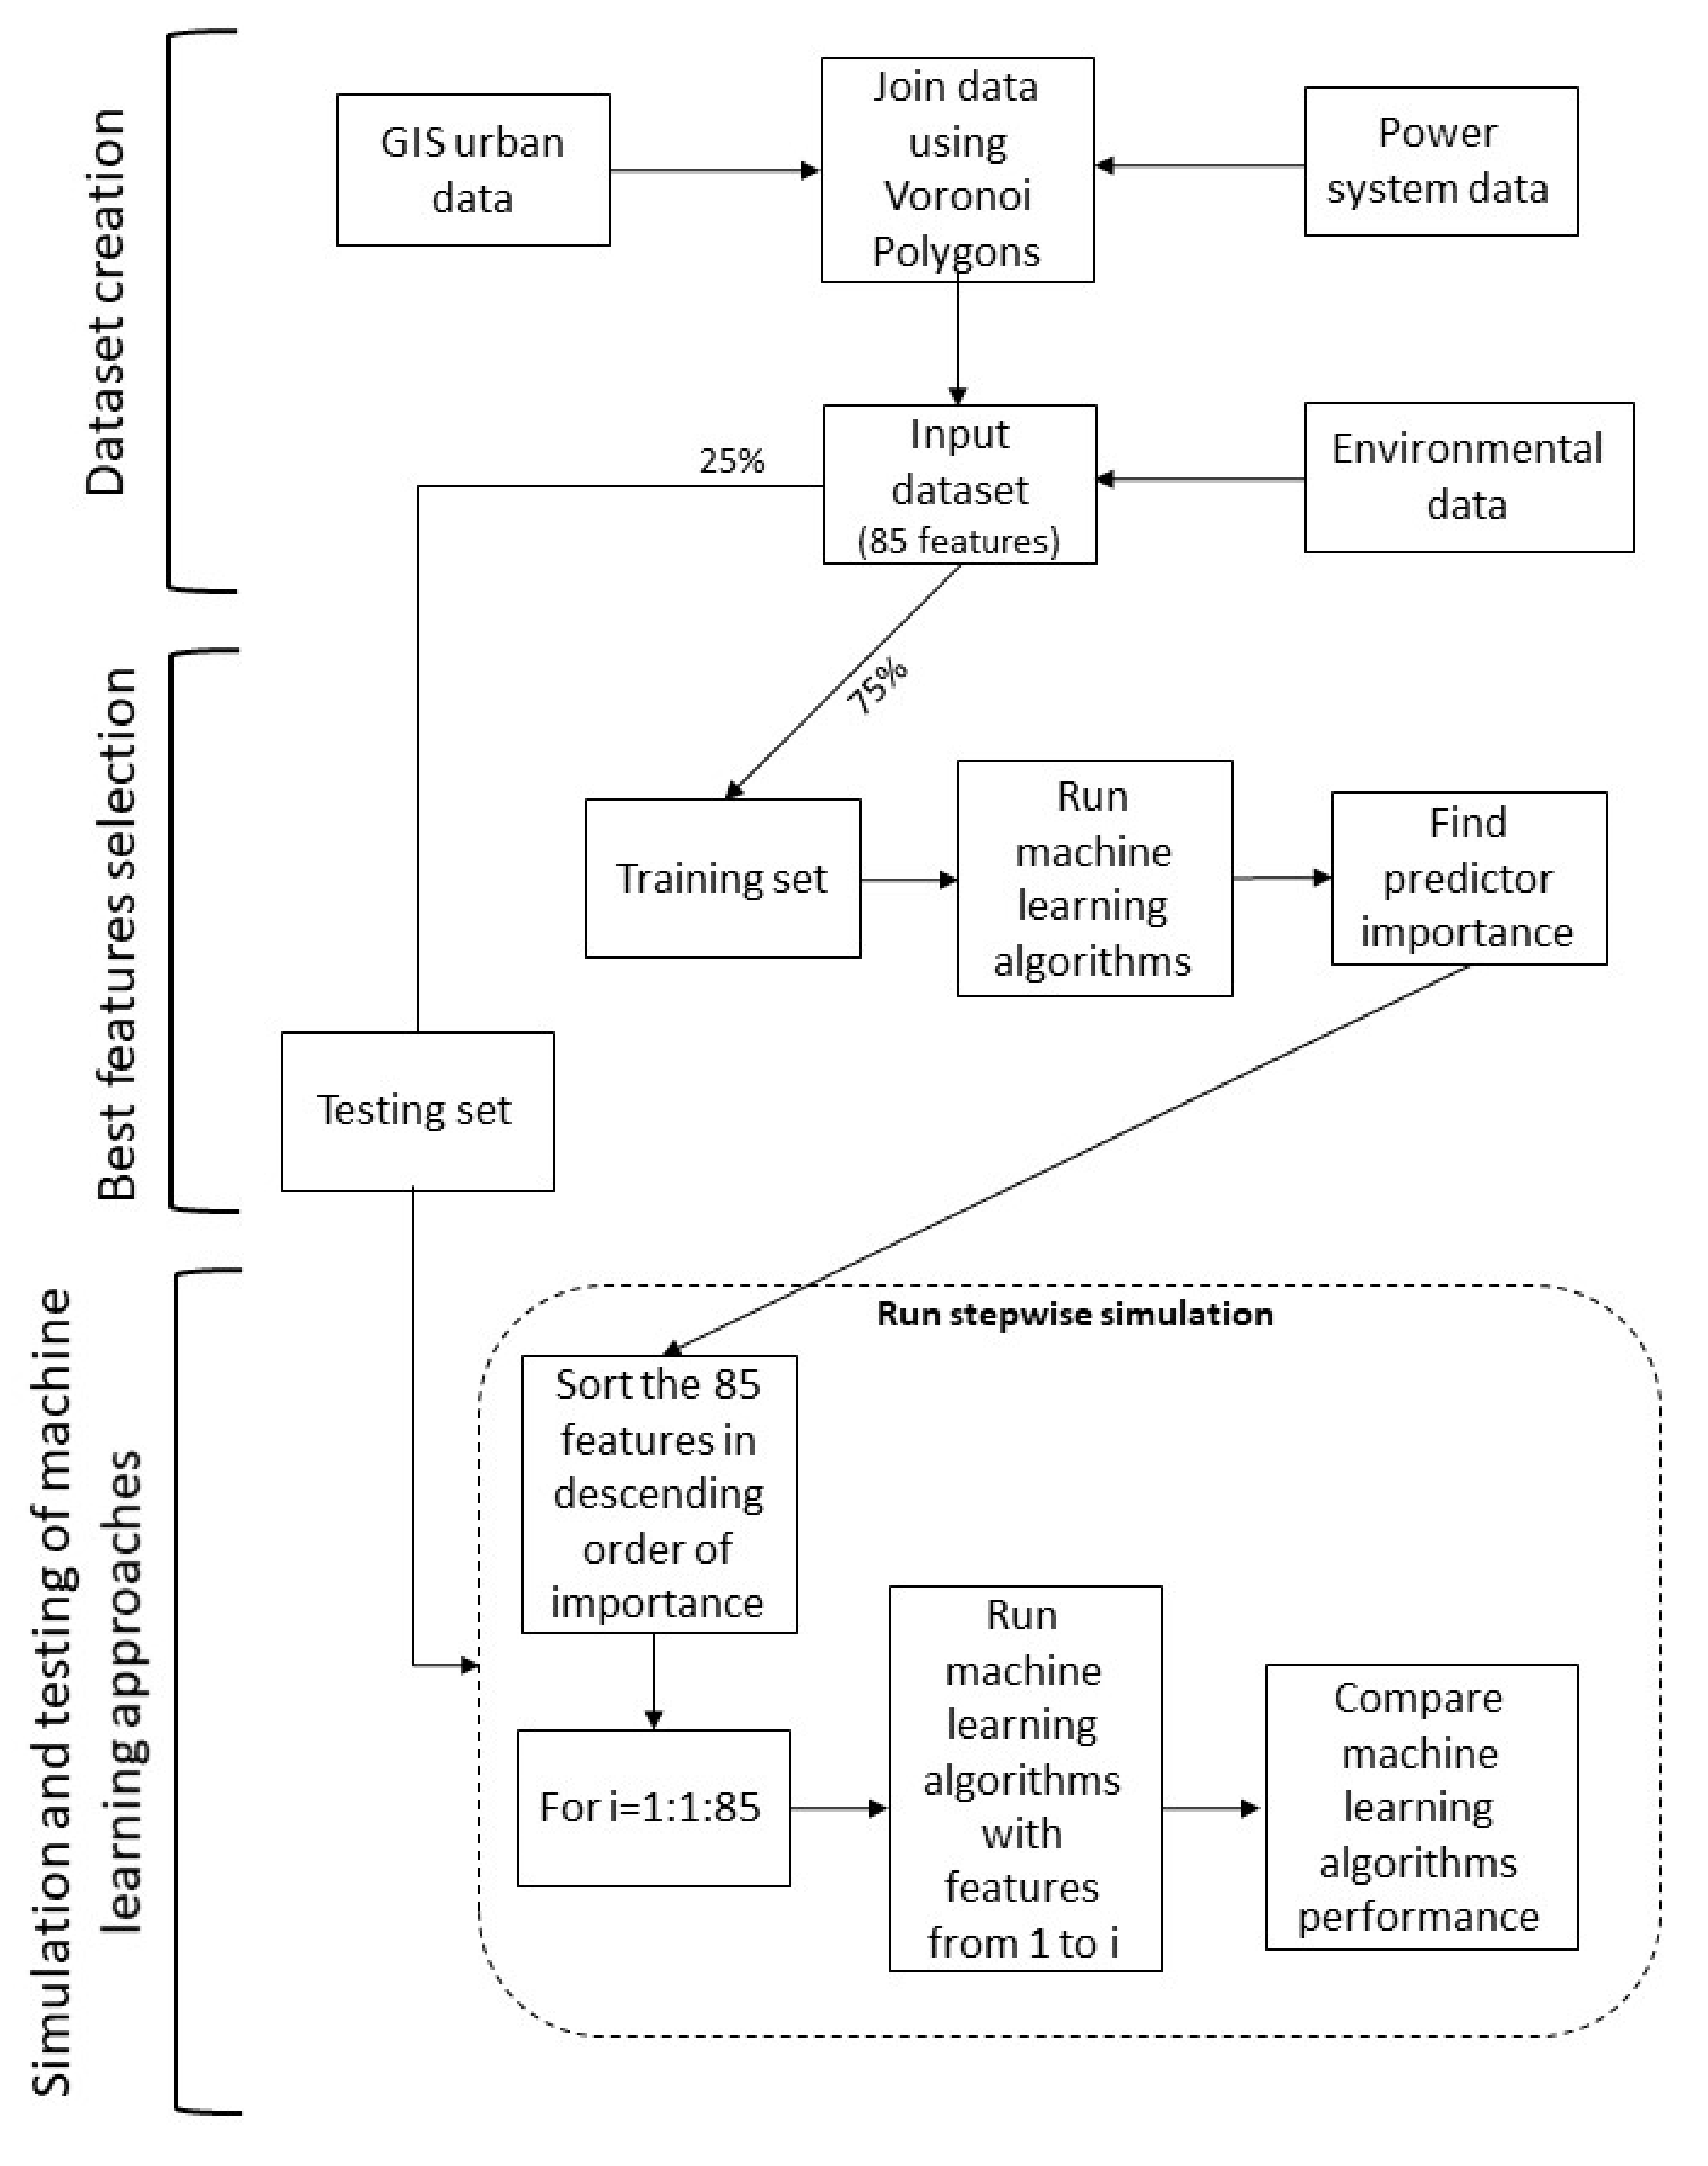
3. Proposed Approach
- Dataset creation: we collect georeferenced and power system data, joining them to create the input dataset. Since machine learning techniques are “garbage in–garbage out” approaches, an accurate check of the data must be done at every stage of the process. A clustering using Voronoi polygons [27] is also carried out to assign the georeferenced data to the corresponding secondary substation.
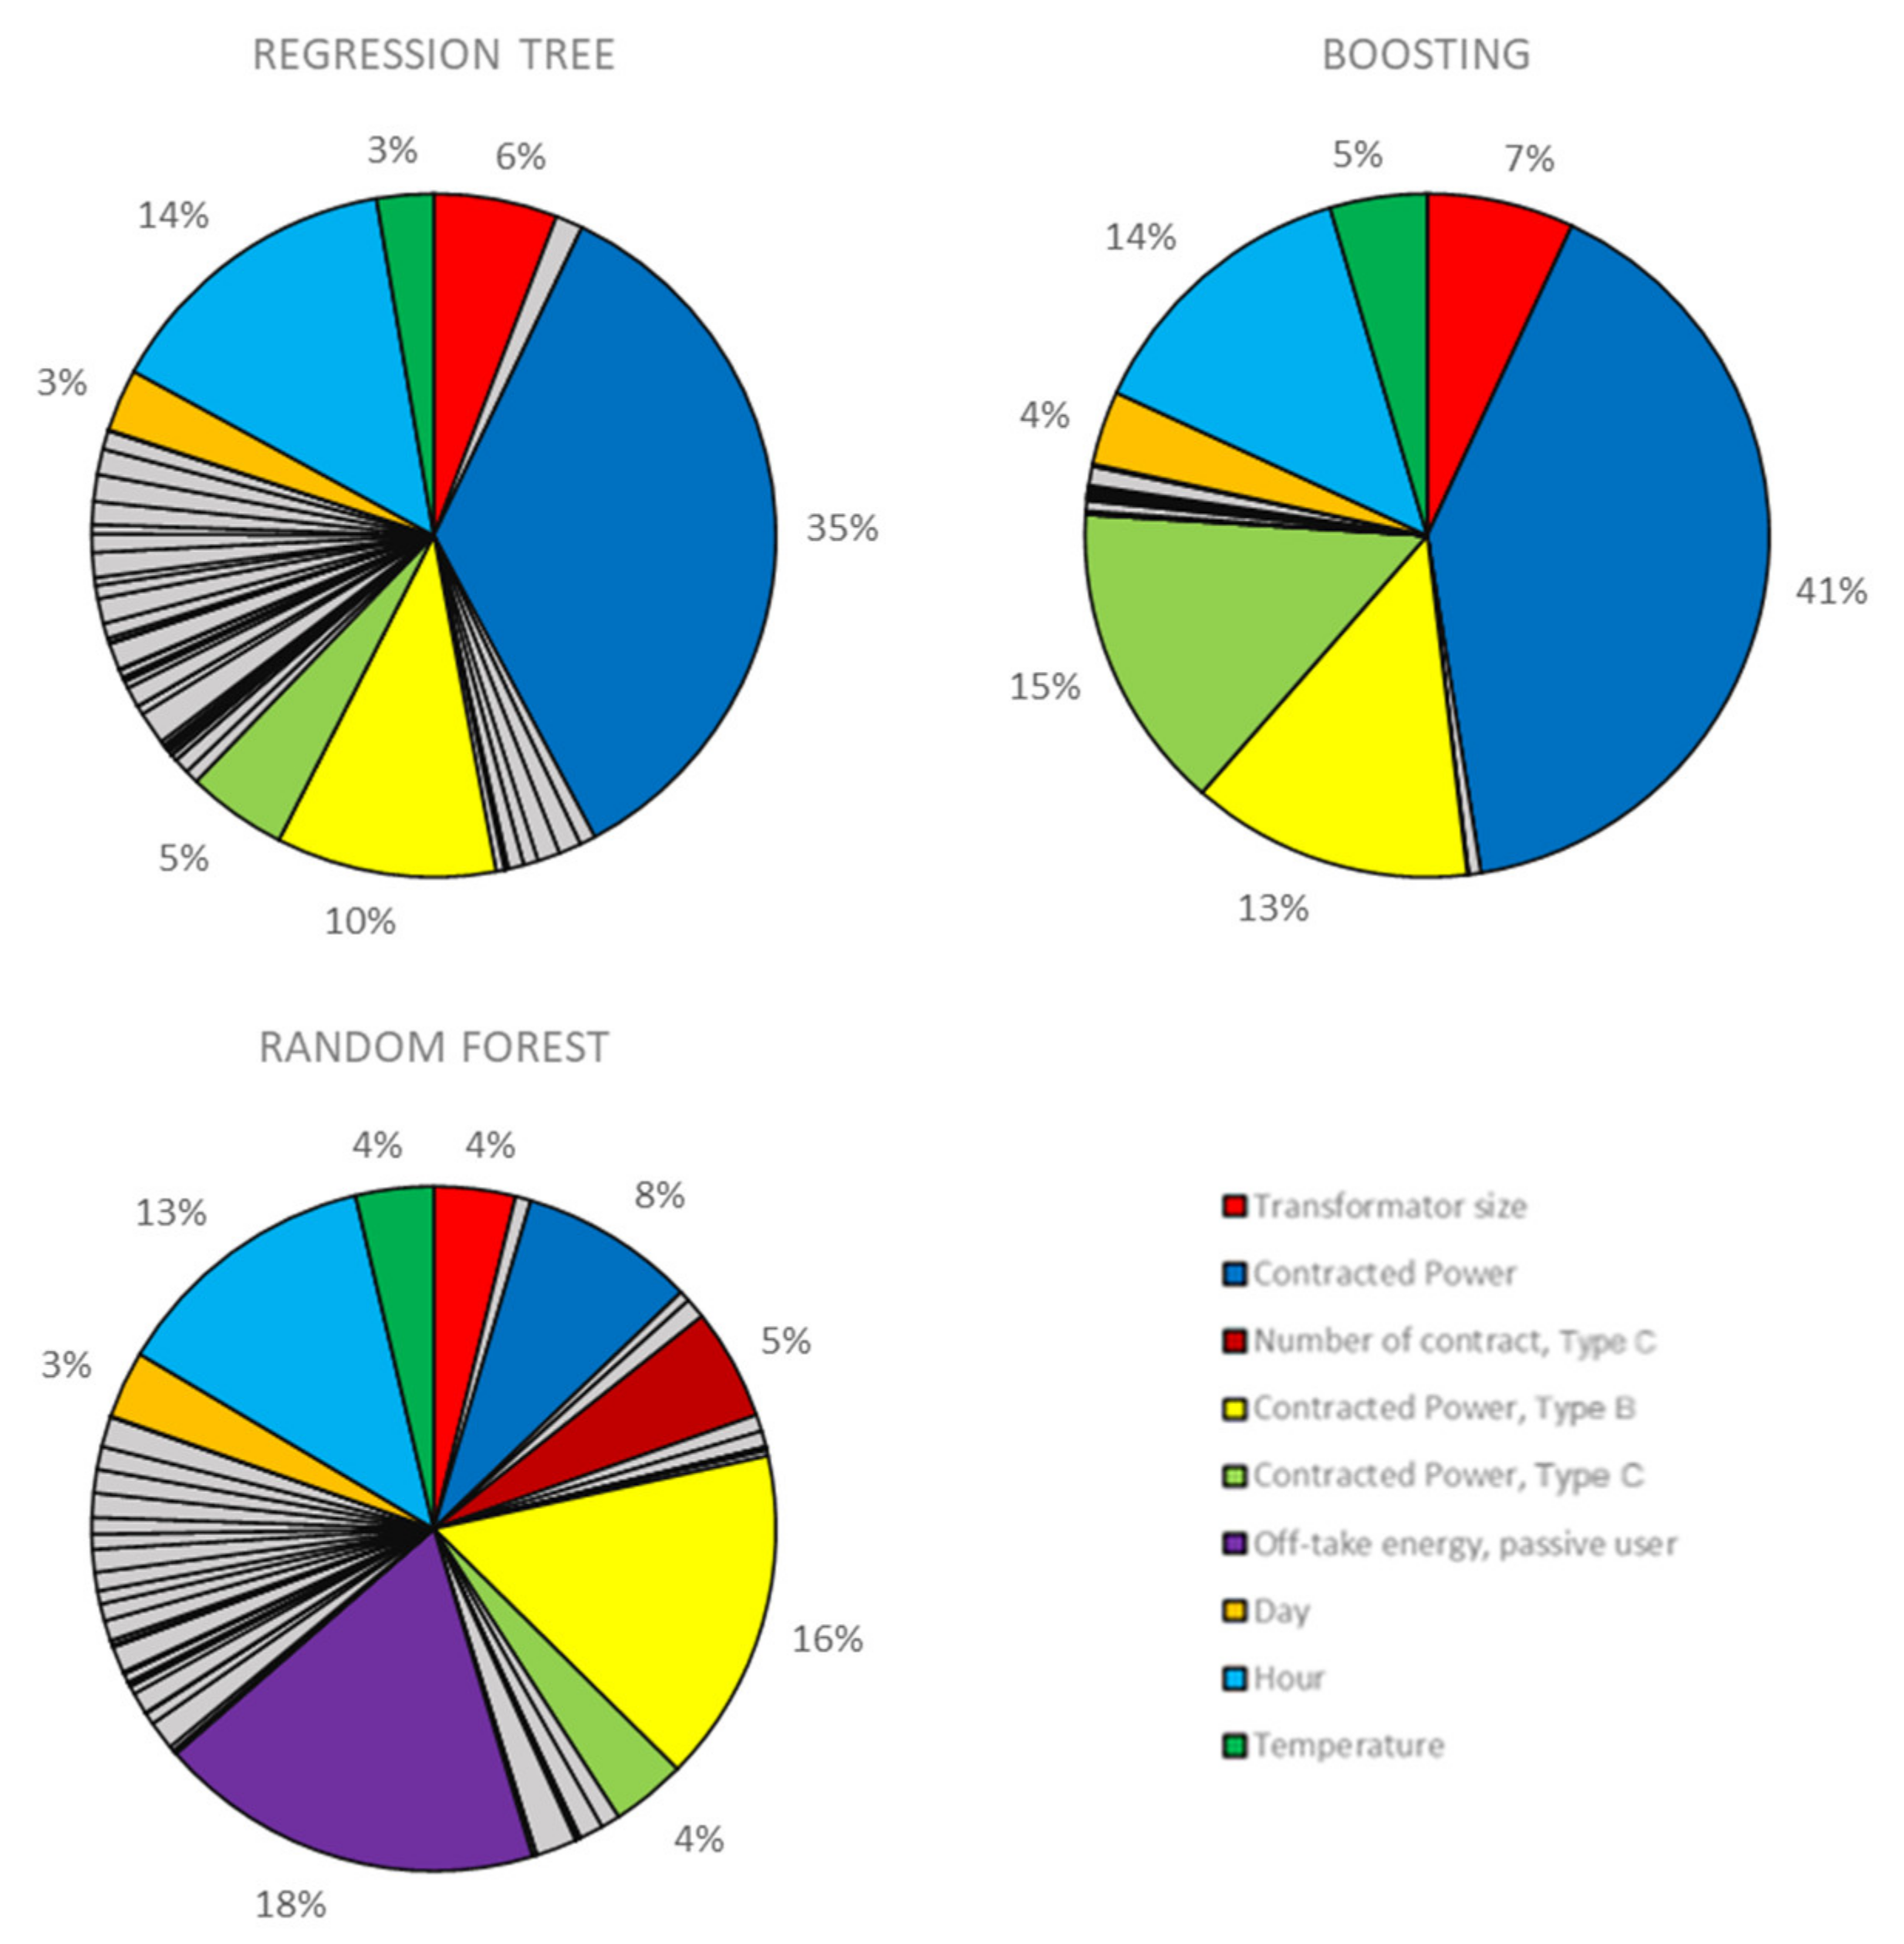
- Best features selection: we consider all the available features estimating the predictor importance to gain information on which features are more promising, impacting the machine learning targets.
- Simulation and testing of machine learning approach: based on the results of the feature selection, a recursive approach is developed, which progressively adds features, testing the performances of three different machine learning approaches: regression tree, least-squares boosting, and random forest. The simulation results are collected and evaluated using different parameters to compare the machine learning methods considered.
3.1. Dataset Creation
3.2. Feature Selection
3.3. Proposed Machine Learning Approach
4. Input Data
4.1. Power System Data
- Subscription power and number of LV customers supplied.
- Number of contracts by type: the customers are divided into 15 clusters among which 5 represent more than 95% of the power contracts.
- Number of users by type: active user, passive user, prosumer.
- Rated power and type of distributed power plants connected to the LV network, i.e., photovoltaic, hydro, thermal, biogas.
4.2. GIS Urban Data
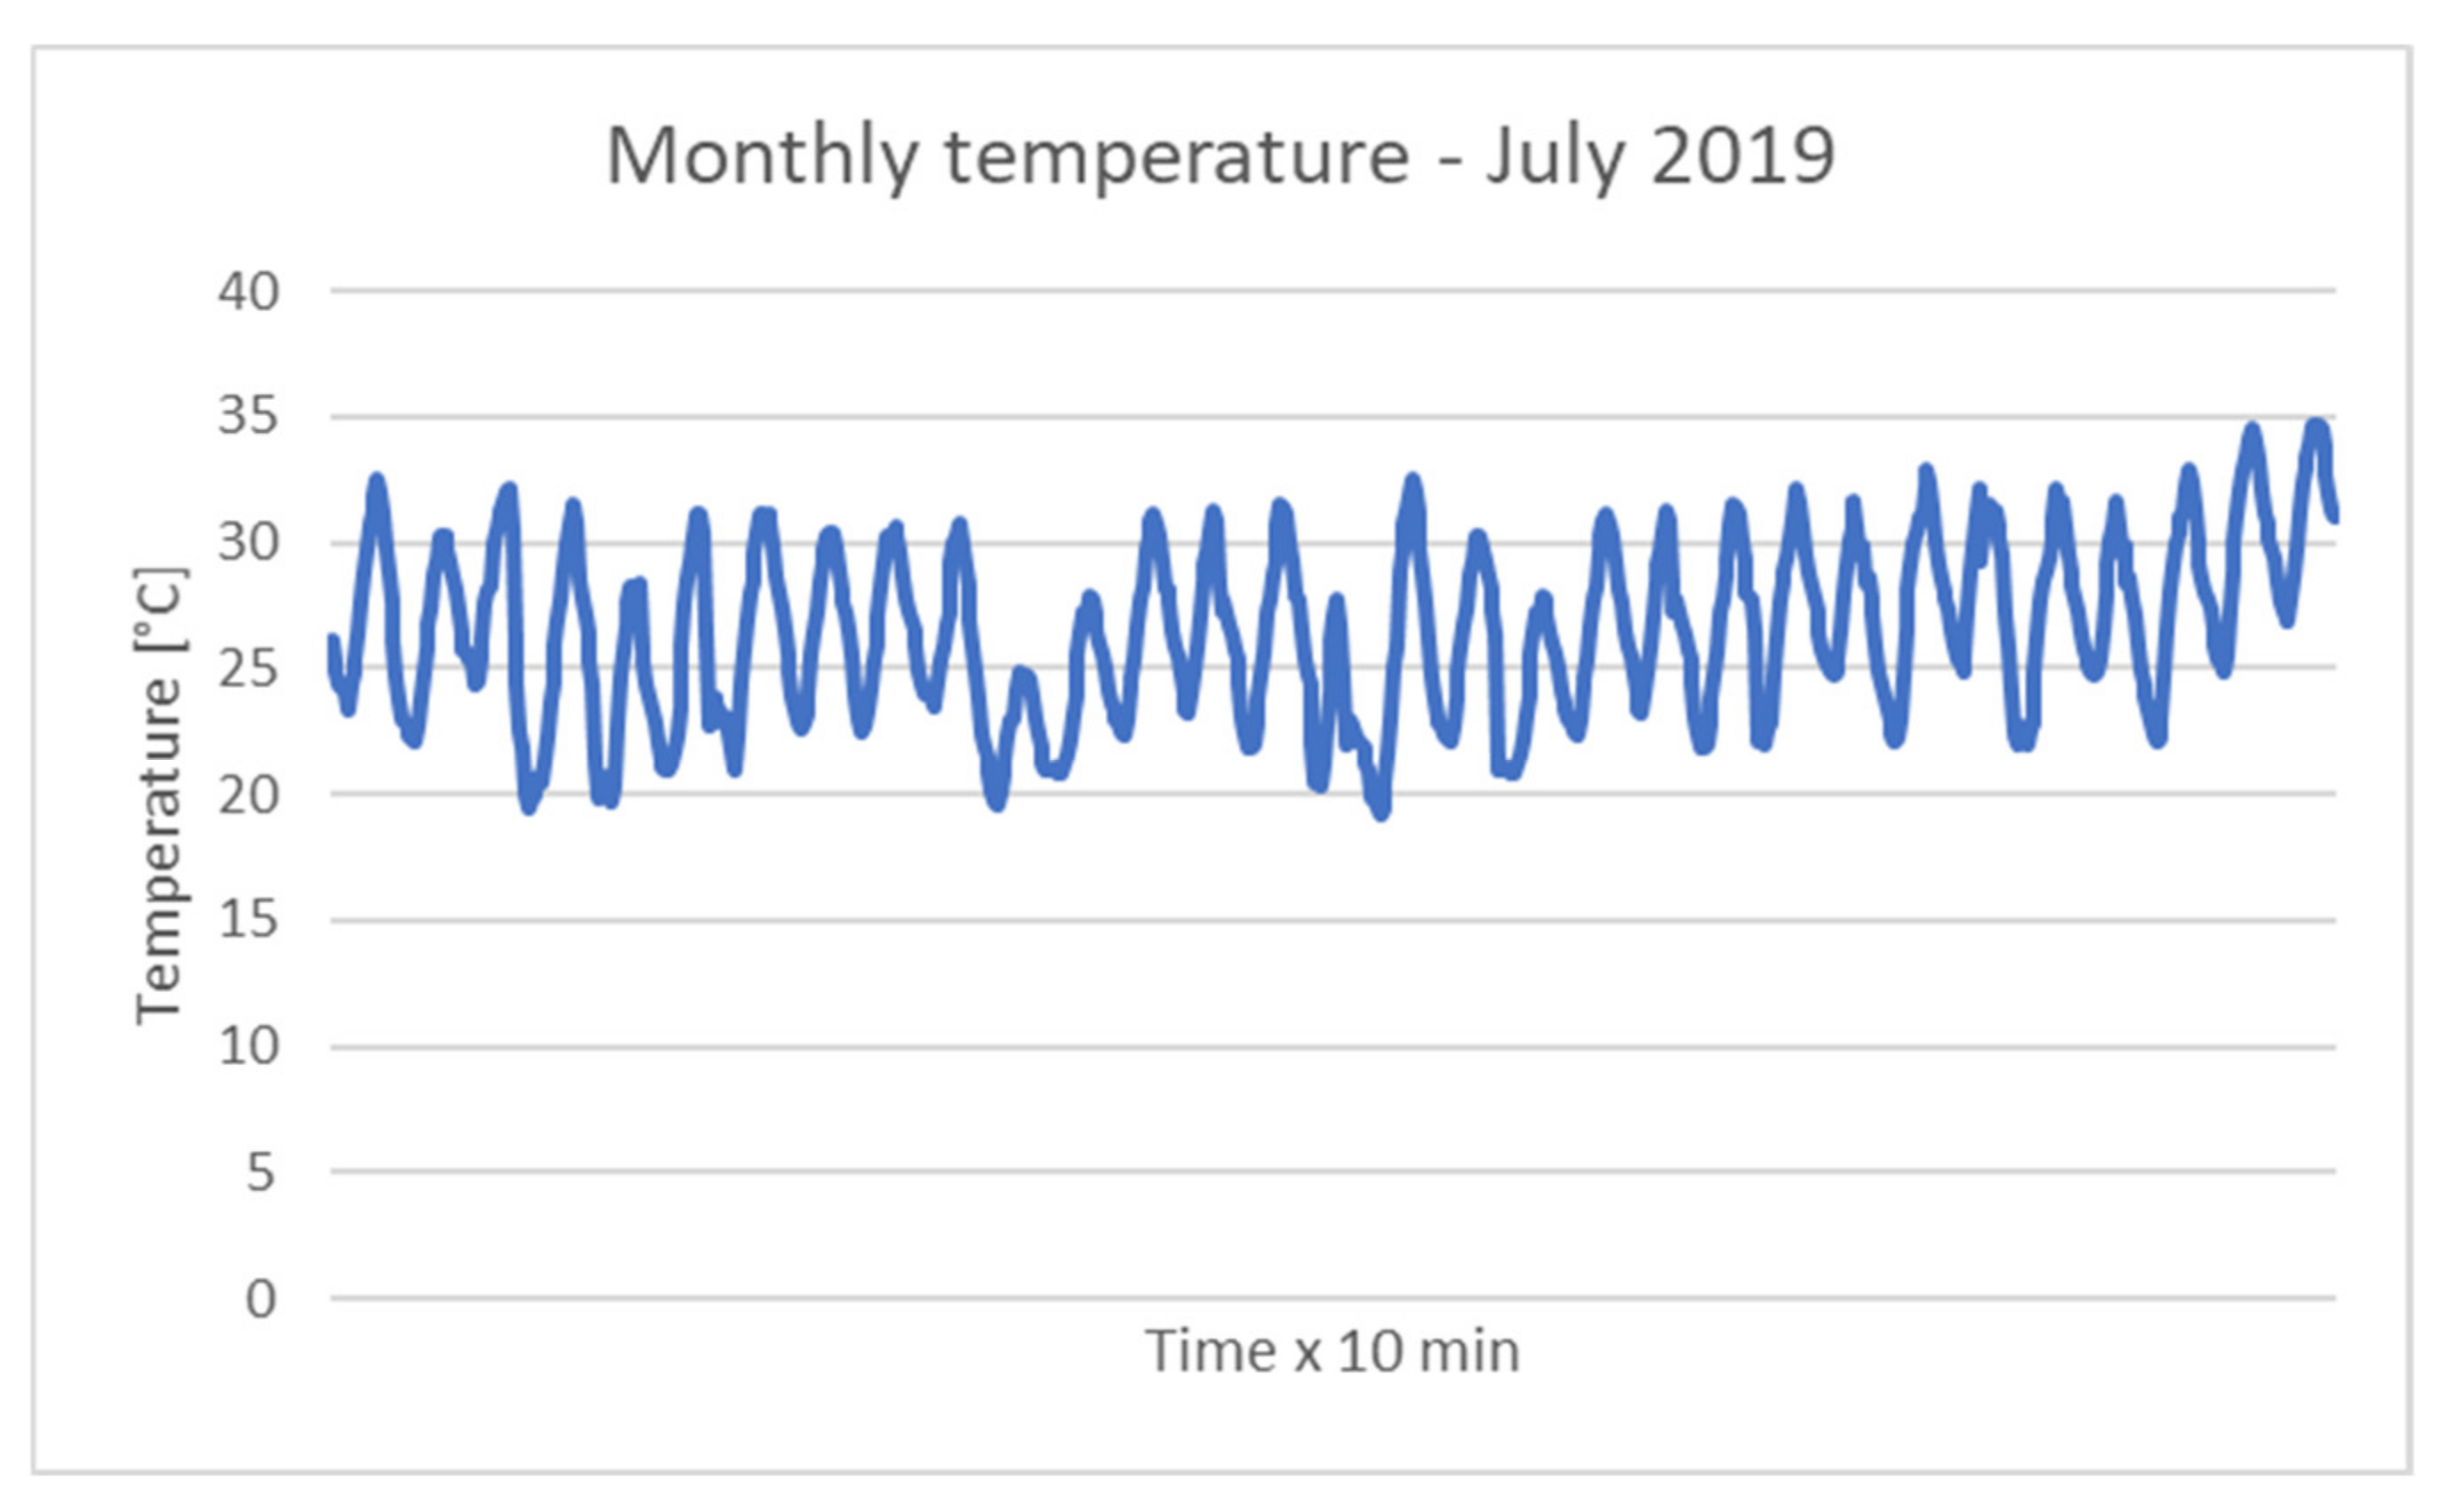
4.3. Environmental Data
5. Simulation Results and Discussion
5.1. Feature Selection
5.2. Stepwise Simulation
6. Conclusions
Author Contributions
Funding
Institutional Review Board Statement
Informed Consent Statement
Acknowledgments
Conflicts of Interest
Appendix A

| Feature | Origin |
|---|---|
| Secondary substation X coordinates (Gauss–Boaga reference system) | Local DSO |
| Secondary substation Y coordinates (Gauss–Boaga reference system) | Local DSO |
| Secondary substation latitude | Local DSO |
| Secondary substation longitude | Local DSO |
| Secondary substation transformer size | Local DSO |
| Number of users connected to the secondary substation | Local DSO |
| Contracted power | Local DSO |
| Number of contracts, Type A | Local DSO |
| Number of contracts, Type B | Local DSO |
| Number of contracts, Type C | Local DSO |
| Number of contracts, Type D | Local DSO |
| Number of contracts, Type E | Local DSO |
| Number of contracts, Type F | Local DSO |
| Number of contracts, Type G | Local DSO |
| Number of contracts, Type H | Local DSO |
| Number of contracts, Type I | Local DSO |
| Number of contracts, Type J | Local DSO |
| Number of contracts, Type K | Local DSO |
| Number of contracts, Type L | Local DSO |
| Number of contracts, Type M | Local DSO |
| Number of contracts, Type N | Local DSO |
| Number of contracts, Type O | Local DSO |
| Contracted power, Type A | Local DSO |
| Contracted power, Type B | Local DSO |
| Contracted power, Type C | Local DSO |
| Contracted power, Type D | Local DSO |
| Contracted power, Type E | Local DSO |
| Contracted power, Type F | Local DSO |
| Contracted power, Type G | Local DSO |
| Contracted power, Type H | Local DSO |
| Contracted power, Type I | Local DSO |
| Contracted power, Type J | Local DSO |
| Contracted power, Type K | Local DSO |
| Contracted power, Type L | Local DSO |
| Contracted power, Type M | Local DSO |
| Contracted power, Type N | Local DSO |
| Contracted power, Type O | Local DSO |
| Number of customers | Local DSO |
| Off-take energy, passive user | Local DSO |
| Off-take energy and release, user that can release | Local DSO |
| Off-take energy, EV charging station | Local DSO |
| Off-take energy and release, EV charging station | Local DSO |
| Off-take energy, EHPs | Local DSO |
| Off-take energy, public lights | Local DSO |
| Off-take energy, distribution network self-consumption | Local DSO |
| Energy production from biogas power plants | Local DSO |
| Energy production from PV power plants | Local DSO |
| Energy production from hydropower plants | Local DSO |
| Energy production from thermal power plants | Local DSO |
| Sum of the energy production | Local DSO |
| DUSAF, area covered by industrial, commercial, public, military, and private units | GIS [37] |
| DUSAF, area covered by airports | GIS [37] |
| DUSAF, area covered by arable land (annual crops) | GIS [37] |
| DUSAF, Area covered by construction sites | GIS [37] |
| DUSAF, area covered by continuous urban fabric (S.L.: >80%) | GIS [37] |
| DUSAF, area covered by discontinuous dense urban fabric (S.L.: 50%-80%) | GIS [37] |
| DUSAF, area covered by discontinuous low-density urban fabric (S.L.: 10%-30%) | GIS [37] |
| DUSAF, area covered by discontinuous medium-density urban fabric (S.L.: 30%-50%) | GIS [37] |
| DUSAF, area covered by discontinuous very low-density urban fabric (S.L.: <10%) | GIS [37] |
| DUSAF, area covered by fast transit roads and associated land | GIS [37] |
| DUSAF, area covered by forests | GIS [37] |
| DUSAF, area covered by green urban areas | GIS [37] |
| DUSAF, area covered by isolated structures | GIS [37] |
| DUSAF, area covered by land without current use | GIS [37] |
| DUSAF, area covered by mineral extraction and dump sites | GIS [37] |
| DUSAF, area with no data (clouds and shadows) | GIS [37] |
| DUSAF, area covered by other roads and associated land | GIS [37] |
| DUSAF, area covered by pastures | GIS [37] |
| DUSAF, area covered by railways and associated land | GIS [37] |
| DUSAF, area covered by sports and leisure facilities | GIS [37] |
| DUSAF, area covered by water | GIS [37] |
| Number of residents | GIS [36] |
| Number of people not residents | GIS [36] |
| Number of streets, number of residents | GIS [36] |
| Number of streets, number of commercial activities | GIS [36] |
| Number of activities | GIS [36] |
| NIL | GIS [38] |
| Census track ID | GIS [38] |
| Residential building volume | GIS [39] |
| Commercial building volume | GIS [39] |
| Voronoi polygon area | GIS-computed |
| Month | Intrinsic |
| Day | Intrinsic |
| Hour | Intrinsic |
| Temperature | Meteo station [43] |
References
- Delfanti, M.; Falabretti, D.; Fiori, M.; Merlo, M. Smart Grid on field application in the Italian framework: The A.S.SE.M. project. Electr. Power Syst. Res. 2015, 120, 56–69. [Google Scholar] [CrossRef]
- Berizzi, A.; Bovo, C.; Falabretti, D.; Ilea, V.; Merlo, M.; Monfredini, G.; Subasic, M.; Bigoloni, M.; Rochira, I.; Bonera, R. Architecture and functionalities of a smart Distribution Management System. In Proceedings of the 2014 16th International Conference on Harmonics and Quality of Power (ICHQP), Bucharest, Romania, 25–28 May 2014; pp. 439–443. [Google Scholar]
- Falabretti, D.; Moncecchi, M.; Mirbagheri, M.; Bovera, F.; Fiori, M.; Merlo, M.; Delfanti, M. San Severino Marche smart grid pilot within the InteGRIDy project. Energy Procedia 2018, 155, 431–442. [Google Scholar] [CrossRef]
- Bosisio, A.; Berizzi, A.; Morotti, A.; Pegoiani, A.; Greco, B.; Iannarelli, G. IEC 61850-based smart automation system logic to improve reliability indices in distribution networks. In Proceedings of the 2019 AEIT International Annual Conference, Florence, Italy, 18–20 September 2019. [Google Scholar]
- Gulotta, F.; Rossi, A.; Bovera, F.; Falabretti, D.; Galliani, A.; Merlo, M.; Rancilio, G. Opening of the Italian Ancillary Service Market to Distributed Energy Resources: Preliminary Results of UVAM project. In Proceedings of the HONET 2020—IEEE 17th International Conference on Smart Communities: Improving Quality of Life using ICT, IoT and AI, Charlotte, NC, USA, 14–16 December 2020; pp. 199–203. [Google Scholar]
- Barreto, C.; Koutsoukos, X. Design of Load Forecast Systems Resilient Against Cyber-Attacks. In Lecture Notes in Computer Science; Including Subseries Lecture Notes in Artificial Intelligence and Lecture Notes in Bioinformatics; Springer: Berlin/Heidelberg, Germany, 2019; Volume 11836, pp. 1–20. [Google Scholar]
- Zhou, X.; Li, Y.; Barreto, C.A.; Li, J.; Volgyesi, P.; Neema, H.; Koutsoukos, X. Evaluating Resilience of Grid Load Predictions under Stealthy Adversarial Attacks. In Proceedings of the 2019 Resilience Week, RWS 2019, San Antonio, TX, USA, 4–7 November 2019; pp. 206–212. [Google Scholar]
- Panteli, M.; Mancarella, P. The grid: Stronger, bigger, smarter? Presenting a conceptual framework of power system resilience. IEEE Power Energy Mag. 2015, 13, 58–66. [Google Scholar] [CrossRef]
- Wang, Y.; Chen, C.; Wang, J.; Baldick, R. Research on Resilience of Power Systems under Natural Disasters—A Review. IEEE Trans. Power Syst. 2016, 31, 1604–1613. [Google Scholar] [CrossRef]
- Panteli, M.; Trakas, D.N.; Mancarella, P.; Hatziargyriou, N.D. Power Systems Resilience Assessment: Hardening and Smart Operational Enhancement Strategies. Proc. IEEE 2017, 105, 1202–1213. [Google Scholar] [CrossRef] [Green Version]
- Shah, I.; Iftikhar, H.; Ali, S. Modeling and Forecasting Medium-Term Electricity Consumption Using Component Estimation Technique. Forecasting 2020, 2, 163–179. [Google Scholar] [CrossRef]
- Ahmad, A.; Javaid, N.; Mateen, A.; Awais, M.; Khan, Z.A. Short-Term load forecasting in smart grids: An intelligent modular approach. Energies 2019, 12, 164. [Google Scholar] [CrossRef] [Green Version]
- Amjady, N.; Keynia, F. Mid-term load forecasting of power systems by a new prediction method. Energy Convers. Manag. 2008, 49, 2678–2687. [Google Scholar] [CrossRef]
- Essallah, S.; Khedher, A. A comparative study of long-term load forecasting techniques applied to Tunisian grid case. Electr. Eng. 2019, 101, 1235–1247. [Google Scholar] [CrossRef]
- Lindberg, K.B.; Seljom, P.; Madsen, H.; Fischer, D.; Korpås, M. Long-term electricity load forecasting: Current and future trends. Util. Policy 2019, 58, 102–119. [Google Scholar] [CrossRef]
- Chemetova, S.; Santos, P.; Ventim-Neves, M. Load forecasting in electrical distribution grid of medium voltage. In Proceedings of the 7th IFIP WG 5.5/SOCOLNET Advanced Doctoral Conference on Computing, Electrical and Industrial Systems, DoCEIS 2016, Costa de Caparica, Portugal, 11–13 April 2016; Springer: New York, NY, USA, 2016; Volume 470, pp. 340–349. [Google Scholar]
- Gao, Z.; Shi, J.; Li, H.; Chen, C.; Tan, J.; Liu, L. Substation Load Characteristics and Forecasting Model for Large-scale Distributed Generation Integration. In IOP Conference Series: Materials Science and Engineering; Institute of Physics Publishing: Bristol, UK, 2020; Volume 782, p. 032044. [Google Scholar]
- Veeramsetty, V.; Deshmukh, R. Electric power load forecasting on a 33/11 kV substation using artificial neural networks. SN Appl. Sci. 2020, 2, 1–10. [Google Scholar] [CrossRef] [Green Version]
- Abu-Shikhah, N.; Elkarmi, F. Medium-term electric load forecasting using singular value decomposition. Energy 2011, 36, 4259–4271. [Google Scholar] [CrossRef] [Green Version]
- Abu-Shikhah, N.; Elkarmi, F.; Aloquili, O.M. Medium-Term Electric Load Forecasting Using Multivariable Linear and Non-Linear Regression. Smart Grid Renew. Energy 2011, 2, 126–135. [Google Scholar] [CrossRef] [Green Version]
- Bunnoon, P.; Chalermyanont, K.; Limsakul, C. Mid term load forecasting of the country using statistical methodology: Case study in Thailand. In Proceedings of the 2009 International Conference on Signal Processing Systems, ICSPS 2009, Singapore, 15–17 May 2009; pp. 924–928. [Google Scholar]
- Su, F.; Xu, Y.; Tang, X. Short-and mid-term load forecasting using machine learning models. In Proceedings of the CIEEC 2017—2017 China International Electrical and Energy Conference, Beijing, China, 25–27 October 2017; pp. 406–411. [Google Scholar]
- Bosisio, A.; Berizzi, A.; Le, D.-D.; Bassi, F.; Giannuzzi, G. Improving DTR assessment by means of PCA applied to wind data. Electr. Power Syst. Res. 2019, 172, 193–200. [Google Scholar] [CrossRef]
- Mosavi, A.; Salimi, M.; Ardabili, S.F.; Rabczuk, T.; Shamshirband, S.; Varkonyi-Koczy, A.R. State of the art of machine learning models in energy systems, a systematic review. Energies 2019, 12, 1301. [Google Scholar] [CrossRef] [Green Version]
- Ringwood, J.V.; Bofelli, D.; Murray, F.T. Forecasting electricity demand on short, medium and long time scales using neural networks. J. Intell. Robot. Syst. Theory Appl. 2001, 31, 129–147. [Google Scholar] [CrossRef]
- Zhukov, A.; Tomin, N.; Kurbatsky, V.; Sidorov, D.; Panasetsky, D.; Foley, A. Ensemble methods of classification for power systems security assessment. Appl. Comput. Inform. 2019, 15, 45–53. [Google Scholar] [CrossRef] [Green Version]
- Bosisio, A.; Berizzi, A.; Amaldi, E.; Bovo, C.; Morotti, A.; Greco, B.; Iannarelli, G. A GIS-based approach for high-level distribution networks expansion planning in normal and contingency operation considering reliability. Electr. Power Syst. Res. 2021, 190, 106684. [Google Scholar] [CrossRef]
- Marbate, M.P.; Gupta, M.R. Fortune’s Method: An Efficient Method For Voronoi Diagram Construction. Int. J. Adv. Res. Comput. Commun. Eng. 2013, 2, 4808–4814. [Google Scholar]
- Reddy, D.; Jana, P.K. Initialization for K-means Clustering using Voronoi Diagram. Procedia Technol. 2012, 4, 395–400. [Google Scholar] [CrossRef] [Green Version]
- Su, P.; Scot Drysdale, R.L. A comparison of sequential Delaunay triangulation algorithms. Comput. Geom. Theory Appl. 1997, 7, 361–385. [Google Scholar] [CrossRef] [Green Version]
- Wang, S.; Lu, Z.; Ge, S.; Wang, C. An improved substation locating and sizing method based on the weighted voronoi diagram and the transportation model. J. Appl. Math. 2014, 2014. [Google Scholar] [CrossRef]
- Ge, S.; Lu, Z.; Wang, C.; Wang, S. Substation planning method based on the weighted Voronoi diagram using an intelligent optimisation algorithm. IET Gener. Transm. Distrib. 2014, 8, 2173–2182. [Google Scholar] [CrossRef]
- Bosisio, A.; Giustina, D.D.; Fratti, S.; Dede, A.; Gozzi, S. A metamodel for multi-utilities asset management. In Proceedings of the 2019 IEEE Milan PowerTech, PowerTech 2019, Milan, Italy, 23–27 June 2019. [Google Scholar]
- Chang, K.-T. Introduction to Geographic Information Systems; Tata McGraw-Hill: New York, NY, USA, 2008; ISBN 0070658986. [Google Scholar]
- Portale Open Data. Comune di Milano. Available online: https://dati.comune.milano.it/ (accessed on 4 June 2021).
- OpenStreetMap. Available online: https://www.openstreetmap.org/#map=5/42.088/12.564 (accessed on 4 June 2021).
- Home—Geoportale della Lombardia. Available online: https://www.geoportale.regione.lombardia.it/ (accessed on 4 June 2021).
- Geoportale SIT. Comune di Milano. Available online: https://geoportale.comune.milano.it/sit/ (accessed on 4 June 2021).
- Open Data. Sistemi Territoriali S.r.l. Available online: http://www.sister.it/sistemi-territoriali/open-data (accessed on 4 June 2021).
- Colombo, A.F.; Etkin, D.; Karney, B.W.; Colombo, A.F.; Etkin, D.; Karney, B.W. Climate Variability and the Frequency of Extreme Temperature Events for Nine Sites across Canada: Implications for Power Usage. J. Clim. 1999, 12, 2490–2502. [Google Scholar] [CrossRef]
- Hekkenberg, M.; Benders, R.M.J.; Moll, H.C.; Schoot Uiterkamp, A.J.M. Indications for a changing electricity demand pattern: The temperature dependence of electricity demand in the Netherlands. Energy Policy 2009, 37, 1542–1551. [Google Scholar] [CrossRef]
- Yee Yan, Y. Climate and residential electricity consumption in Hong Kong. Energy 1998, 23, 17–20. [Google Scholar] [CrossRef]
- Agenzia Regionale per la Protezione dell’Ambiente della Lombardia. Available online: https://www.arpalombardia.it/Pages/ARPA_Home_Page.aspx (accessed on 4 June 2021).
- ARERA. Testo Integrato del Dispacciamento elettrico (TIDE)—Orientamenti Complessivi—Consultazione 23 Luglio 2019 322/2019/R/eel. Available online: https://www.arera.it/it/docs/19/322-19.htm# (accessed on 4 June 2021).


| Feature | R. Tree | Boosting | R. Forest | Origin |
|---|---|---|---|---|
| Hour | X | X | X | Intrinsic |
| Day | X | X | X | Intrinsic |
| Temperature | X | X | X | Meteo station [43] |
| Contracted power | X | X | X | Local DSO |
| Contracted power, Type C | X | X | X | Local DSO |
| Contracted power, Type B | X | X | X | Local DSO |
| Contracted power, Type E | X | Local DSO | ||
| Number of contracts, Type C | X | X | Local DSO | |
| Number of contracts, Type B | X | X | Local DSO | |
| Number of contracts, Type E | X | Local DSO | ||
| Number of contracts, Type D | X | Local DSO | ||
| Off-take energy, passive user | X | Local DSO | ||
| Off-take energy and release, user that can release | X | X | Local DSO | |
| Secondary substation transformer size | X | X | X | Local DSO |
| Number of users connected to the secondary sub. | X | X | Local DSO | |
| Number of activities | X | X | GIS [36] | |
| DUSAF, area covered by other roads and associated land | X | X | GIS [37] | |
| Census track ID | X | GIS [38] | ||
| Voronoi polygon area | X | GIS-computed | ||
| Monthly RMSE on training set [kW] | 11.90 | 37.52 | 13.45 | |
| Monthly RMSE [kW] | 51.53 | 42.91 | 41.73 | |
| Monthly Relative RMSE [%] | 11.26 | 9.23 | 8.96 |
| Algorithm | Index | Working Days | Holidays |
|---|---|---|---|
| Regression tree | RMSE | 52.55 kW | 49.31 kW |
| RMSE% | 11.60% | 10.51% | |
| Boosting | RMSE | 44.28 kW | 39.87 kW |
| RMSE% | 9.54% | 8.54% | |
| Random forest | RMSE | 42.65 kW | 39.73 kW |
| RMSE% | 9.20% | 8.44% |
| Algorithm | Index | Mon | Tue | Wed | Thu | Fri | Sat | Sun |
|---|---|---|---|---|---|---|---|---|
| Regression tree | RMSE | 53.38 kW | 53.06 kW | 52.95 kW | 51.89 kW | 51.68 kW | 50.34 kW | 48.26 kW |
| RMSE% | 11.68% | 11.68% | 11.65% | 11.46% | 11.54% | 10.65% | 10.37% | |
| Boosting | RMSE | 44.90 kW | 45.14 kW | 44.94 kW | 43.71 kW | 42.99 kW | 40.45 kW | 39.28 kW |
| RMSE% | 9.67% | 9.65% | 9.61% | 9.44% | 9.38% | 8.56% | 8.52% | |
| Random forest | RMSE | 43.26 kW | 43.05 kW | 42.79 kW | 42.17 kW | 42.10 kW | 40.27 kW | 39.18 kW |
| RMSE% | 9.31% | 9.26% | 9.20% | 9.12% | 9.15% | 8.51% | 8.36% |
Publisher’s Note: MDPI stays neutral with regard to jurisdictional claims in published maps and institutional affiliations. |
© 2021 by the authors. Licensee MDPI, Basel, Switzerland. This article is an open access article distributed under the terms and conditions of the Creative Commons Attribution (CC BY) license (https://creativecommons.org/licenses/by/4.0/).
Share and Cite
Bosisio, A.; Moncecchi, M.; Morotti, A.; Merlo, M. Machine Learning and GIS Approach for Electrical Load Assessment to Increase Distribution Networks Resilience. Energies 2021, 14, 4133. https://doi.org/10.3390/en14144133
Bosisio A, Moncecchi M, Morotti A, Merlo M. Machine Learning and GIS Approach for Electrical Load Assessment to Increase Distribution Networks Resilience. Energies. 2021; 14(14):4133. https://doi.org/10.3390/en14144133
Chicago/Turabian StyleBosisio, Alessandro, Matteo Moncecchi, Andrea Morotti, and Marco Merlo. 2021. "Machine Learning and GIS Approach for Electrical Load Assessment to Increase Distribution Networks Resilience" Energies 14, no. 14: 4133. https://doi.org/10.3390/en14144133