Abstract
Liquid fuels obtained in refining crude oil are one of the most important energies in economic activity. The domestic wholesale market for liquid fuels is of decisive importance for price formation in the national economy. The noncompetitive behavior of the market players at this level of the distribution chain can significantly affect all downstream price levels and the producer–consumer surplus balance. Therefore, the competitiveness of this market should be screened and assessed regularly, especially when significant external factors change. This article attempts to evaluate the impact of structural changes on the global market of crude oil and energy products after the outbreak of the COVID-19 pandemic on the competitiveness of the wholesale fuel market in Poland. Using asymmetry of the reaction of product prices to changes in the prices of inputs as a marker of noncompetitive behavior and the NARDL model as a test specification, the price paths of market players before and after the occurrence of structural changes in the inputs’ processes were examined. Significant changes in the competitive behavior of players were revealed after the occurrence of structural changes at the beginning of the pandemic period in the year 2020. These changes may indicate enhanced competition and mitigation of potential market power abuse.
1. Introduction
Liquid fuels obtained in the process of refining crude oil are one of the most essential energies in economic activity. Especially critical are fuels used in transportation. Due to the mass character of the product and a large share in the operating costs of many sectors of the economy, the prices of liquid fuels have a significant impact on the level of welfare of both enterprises and households. Moreover, due to the oligopolistic or even monopolistic structure of many domestic markets on the refining/wholesale level on one hand and relative ease of observation of price movements on the other, the liquid fuel market is under constant scrutiny of the public opinion, which is very sensitive to any abuse of market power or uncompetitive behavior. The domestic wholesale market for liquid fuels is of decisive importance for price formation in the national economy. The uncompetitive behavior of the market players at this level of the distribution chain can significantly affect all downstream price levels and the producer–consumer surplus balance. Therefore, the competitiveness of this market should be screened and assessed frequently, especially when significant external factors change.
Empirical detection of competition distortion in any industry is not an easy task. General discussion of the quantitative methods and approaches to competition and antitrust analysis could be found in [1,2] and in a broad spectrum of guidelines and documents produced by domestic competition authorities, advisory organizations, and consulting companies. One of the most popular empirical approaches to competition analysis is the use of behavioral screens or markers [3,4]. Screens are generally designed to flag firms’ behavior or market outcomes which may raise suspicions that firms have, in fact, abused market power or colluded. The screen takes as inputs observable economic data and information (such as information on various product and market characteristics, data on costs, prices, market shares, multiple aspects of firm behavior, etc.) and flags (marks) markets that may have been affected by competition’s distortion. One of the markers most often used in liquid fuel markets is a marker of asymmetric reaction of product prices to changes in main cost factors, called an asymmetric pass-through or APT in short.
The relevant market for the research is a Polish wholesale market for liquid motor fuels. Two goals are pursued during the study: to check whether structural changes were, in fact, observed in the analyzed processes in the first year of the pandemic and examine the possible differences in the symmetry of prices’ response in the period 2015–2020 and in the subsample of the year 2020. As the first year of the pandemic was characterized by structural changes in many economic processes, the research hypothesis, which is subject to verification, states that the APT analysis could provide evidence of changes in price competition in a wholesale market in that period as the reaction to that turbulence.
2. Literature Review
The studies of pass-through of the prices of the main inputs to the prices of the final or semi-final products or services constitute a well-established strain in economic literature. An especially significant result was detecting various kinds of temporal asymmetry in the transmission of input’s (upstream) prices to prices of the outputs (downstream prices). An important study of Bacon [5] started a widespread discussion of the “rockets and feathers” phenomenon in observable price series and established terminology used in this particular domain. Peltzman [6] analyzed 165 producer goods and 77 consumer goods and concluded that the “rockets and feathers” pattern could be found in two-thirds of these markets. In many studies, asymmetries in the adjustment of downstream prices to upstream prices’ change have extensively been investigated using different empirical models in a wide range of commodity markets ([7,8,9]).
The phenomenon of the asymmetric transmission of costs (inputs, upstream prices) to the price of product or service (downstream price) can be considered as:
- magnitude asymmetry, in which the amount of downward price change differs depending on the direction of upstream price change, observed in a long-run horizon (Figure 1).
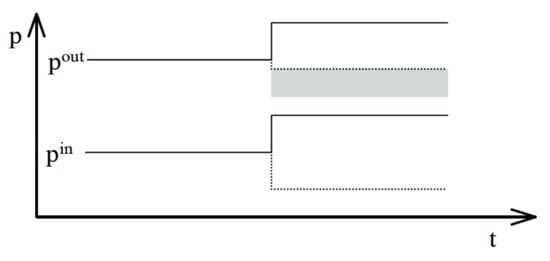 Figure 1. Magnitude asymmetry.
 - pattern asymmetry, in which the speed of downward price change differs depending on the direction of upstream price change, detected in the short-run horizon (Figure 2).
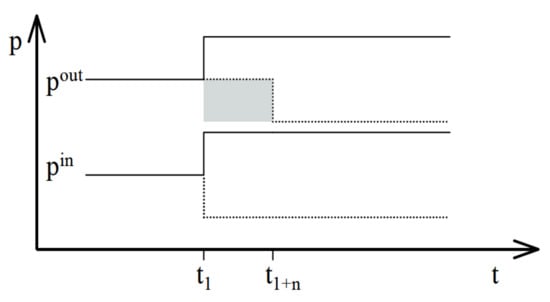 Figure 2. Pattern asymmetry.
The asymmetric pass-through of different shocks at a macro or a microeconomic level has received particular attention in the markets of crude-derived fuels. The APT is not limited to the liquid fuel markets, but it was the study [5] focusing on crude gasoline asymmetric pass-through that impacted widespread studies on that topic. Moreover, that study focused on the specific direction of asymmetry, positive asymmetry, showing and underlining that kind of APT to the public. That kind of APT, called “downward sticky pricing” or “rocket and feather” behavior of prices, means that downstream prices react “faster” to upstream prices’ increase than to decrease. One can consider a pass-through of crude oil prices to the prices of refined petroleum products and other commodities as the most extensively examined so far. The studies, especially connected with prices’ paths of gasoline and motor diesel oil in the retail and wholesale level of a market, seem to be of special importance. A brief summary of the essential articles shows Table 1.

Table 1.
Selected APT studies on liquid fuel markets.
Studies conducted so far point to a few primary sources of APT. One of them can be customer’s imperfect information and search costs in retail markets [31]. The other is connected with asymmetric short-run costs of changes in inventories or asymmetric valuation of inventories enhanced by FIFO accounting ([32,33]).
However, the most important hypothesis of the source of positive APT is the significant market power of the players in a concentrated and imperfectly competitive industry ([13,19,34] support this claim). When exogenous events raise market prices generally, and the market price moves from one competitive price to another, the lack of competition in the transition period or short term affords sellers with market power the opportunity to raise prices quickly. When markets decline, the lack of competitive pressures permits sellers to delay the reduction in prices. Consequently, purchasers with market power will delay price increases as long as they can. When exogenous events occur that lower prices, they will choose among competitive sellers to force a price decline as quickly as possible.
Positive APT in the fuel supply chain means that “the prices of downstreams rise faster than fall.” Such an observation motivated, apart of scientific research, competition authorities’ sector inquiries and decisions on oil refineries and petroleum markets (for official competition inquires see [35,36,37,38,39,40]. Positive APT is not explicitly listed as an anticompetitive practice in the European or USA competition legislation but is commonly treated as one of the markers of anticompetitive behavior ([2,41]) often used in market’s screening. As such, positive APT can be seen as a sign of potential anticompetitive horizontal practices, namely exploitation of market power and tacit collusion. Those practices are frequently connected with another circumstantial evidence of concerted practice, which is parallel pricing. One can conclude that if the structure and parameters of a relevant market under investigation foster potential abuse of competition, APT can be treated as the first proxy of a competition’s status.
3. Materials and Methods
The detailed analysis of the Polish refining industry, the liquid fuels’ wholesale market, and the price creation policy contains [42]. It is worth recapitulating briefly the most important factors supporting the APT examination. The refining industry in Poland is a pure duopoly with players: Orlen Group (PKN Orlen, or PKN for short) and LOTOS Group (LOTOS in short). The Polish liquid fuel market at the wholesale level is a nearly duopolistic market with two major players: PKN, with an approximate market share of 60%, LOTOS with a share of 30%, and a small fringe of independent suppliers. The refining industry and wholesale level of a market is highly concentrated with the HHI index for refining on a level of 0.52 in the year 2020 and for the wholesale fuel market on a level of about 0.5. (In general, the assessment of the value of an HHI index should be market-specific and depends on the purpose of its calculation. As a point of reference for its values in the sense of the degree of concentration, the USA Department of Justice’s merger guidelines are often used, where the value of the HHI index greater than 0.180 indicates high market concentration.) There exist capacity constraints for domestic production and high barriers to entry (due to logistic infrastructure and regulations). The key refined products are homogenous motor fuels (according to E.U. regulations, there are: unbranded diesel oil for road transport 10 ppm Sulphur, unbranded unleaded 95 octane gasoline 10 ppm Sulphur). A second important factor that directly influenced APT research is an implied mechanism of price creation at the wholesale level. Based on the author’s previous research [42,43], one can assume that the pricing mechanism of the players corresponds to the well-known import parity pricing (IPP in short) formula. The IPP is based on the assumption that fuel for road use is a tradable good, and the ex-refinery price depends indirectly on the price of crude and the costs of refining at domestic refineries but directly on the price that the purchaser has to pay for this product in a relevant hub plus transport costs and other relevant spreads for the site chosen for storage. Theoretically, the IPP is the maximum level that the domestic producers’ wholesale price can reach if there are no obstacles to import. In the context of the APT study, the IPP schema allows inclusion as a price determinant (cost factor) a properly chosen benchmark price for each wholesale product. That reference price could be an equally important price determinant as crude price or exchange rate (especially in the short term, say a week), and hence, a pass-through of that reference price to the wholesale prices should be examined.
To summarize, it should be stated that the market under examination is a duopolistic one with high concentration and homogenous products. Demand for products is relatively inelastic. Prices of the downstream products are strategic variables for the players and are fully transparent. Both industry and market exhibit high barriers to entry (capital, logistical, and political). There are capacity constraints for domestic production.
All of the factors are considered as fostering collusion in an industry. That statement is based on noncooperative game theory models of the competition showed in [2], and listed factors belong to the so-called “plus factors” set, used in antitrust litigation ([44,45]). This supports the hypothesis of possible anticompetitive behavior of the players in a market and potential abuse of market power by them. It allows for direct connection to APT examinations with the assessment of the competitiveness of the Polish liquid fuel market, as possible APT is an effect of anticompetitive behavior of the players.
The presented study is performed for the sample covering the period 2015–2020. The downstream prices under examination for APT were: wholesale price of an unleaded standard 95 octane gasoline reported by PKN in PLN per m3, the wholesale price of an unleaded standard 95 octane gasoline reported by LOTOS in PLN per m3, the wholesale price of standard diesel oil for road transport (brand name of PKN: Ekodiesel) reported by PKN in PLN per m3, the wholesale price of standard diesel oil for road transport (brand name of LOTOS: Eurodiesel) reported by LOTOS in PLN per m3.
As important cost factors or IPP determinants of downstream prices, the following inputs are used: Brent crude oil spot price, published by EIA, in USD per m3, New York Harbor Regular Gasoline spot price, published by EIA, in USD per m3 (possible IPP benchmark price), New York Harbor Ultra-Low Sulfur No 2 Diesel spot price, in USD per m3 (possible IPP benchmark price), USD/PLN average exchange rate, reported by Polish Central Bank.
All of the series are observed daily. They have undergone the necessary transformations. The series have been synchronized to a five-working-day regular daily series. The units of measure have been unified to 1 m3. All of the series have been logarithmically transformed to allow interpretation of the multiplayer as a percent change. Transformed variables are named as: L_Diesel, L_Gas95, O_Diesel, O_Gas95, Brent, NYH_Gas, NYH_Diesel, USD_PLN, where prefix L stands for Lotos and O stands for Orlen. Domestic prices are not transformed to USD to allow examination of asymmetry in reaction to depreciation/appreciation of domestic currency (PLN). A similar approach was used in [46] and [47]. The phenomenon under examination is connected with inherently dynamic processes, though the author only focused on dynamic modeling. As a process-generating theoretical model, the nonlinear, autoregressive-distributed lag (NARDL) specification is used. The NARDL model was proposed in [46]. NARDL approach was used in a context of APT research previously (e.g., [24,26,27,30,47]). A NARDL unrestricted specification and bound testing of cointegration allow for asymmetries in both the short- and long-run parameters. The ability to simultaneously estimate both long and short-run asymmetries in a computationally simple and tractable manner is a very flexible approach and provides a straightforward means of testing both long- and short-run symmetry restrictions. In a visual layer, one can assess the asymmetry of dynamic adjustment using asymmetric, dynamic multipliers graph calculated on the basis of estimation of NARDL parameters.
The structure of NARDL (p, q) model derives from the ARDL (p, q) model ([48,49]):
The NARDL (p, q) model can be understood as an extension of the model (1). Its specification is based on an approach to modeling asymmetric cointegration based on partial sum decompositions, which has been applied in [50]. The starting point is the following asymmetric long-run regression equation:
where yt is a scalar I(1) variable; xt is a k × 1 vector of regressors defined such that and ; and are partial sum processes of positive and negative changes in xt around known threshold zero.
In the NARDL (p, q) in-levels, model (2) is embedded into (1), and the final equation is written as follows:
where yt is a scalar dependent variable; xt is a k × 1 vector of regressors decomposed as ; ‘s are the autoregressive parameters; and are the asymmetrically distributed lag parameters; and is an iid process with zero mean and constant variance .
The key role in APT examination plays conditional error correction form (conditional ECM, sometimes called CECM; see [48], [46]):
where is the nonlinear error correction term, with and being the asymmetric long-run parameters (long run multipliers); parameters capture short-run asymmetries; and is an error correction coefficient.
The APT examination based on CECM (4) involves falsifying hypotheses of cointegration existence, detailed tests of symmetry restrictions, and visual exploration of adjustment’s paths.
For cointegration testing, two tests for the existence of a stable long-run levels relationship may be used. The tBDM statistic proposed by Banerjee et al. in [51] tests:
- H0:
- (no long-run level relationship)
- H1:
and the FPSS statistics by Pesaran, Shin and Smith, described in [48], tests:
- H0:
- H1:
- .
The asymptotic distributions of tBDM and FPSS test statistics are nonstandard under their respective null hypotheses, and their exact asymptotic distributions are generally complicated to derive. Therefore, Pesaran et al. in [48] proposed the “bound testing” approach for cointegration testing in ARDL/NARDL specification.
Tests for asymmetry of pass-through can be divided into long-run and short-run asymmetry tests. The NARDL model in the form (4) allows for three general forms of asymmetry:
- long-run amount or “reaction asymmetry”, associated with ;
- short-run amount or “impact asymmetry”, associated with the inequality of the coefficients on the contemporaneous first differences and ;
- speed asymmetry or “adjustment asymmetry”, captured by the patterns of adjustment from initial equilibrium to the new equilibrium following an economic perturbation (i.e., the dynamic multipliers). Adjustment asymmetry derives from the interaction of impact and reaction asymmetries in conjunction with the error correction coefficient, .
The null and alternative hypotheses for long-run asymmetry have a form:
- H0:
- (restriction of long-run symmetric reaction)
- H1:
Short-run asymmetry is tested by testing a restriction:
- H0:
- (additive symmetry)
against alternatives of inequality.
Another form of restriction to be tested in short-run cases is the so-called “impact multipliers symmetry restriction”:
- H0:
which can be tested to capture a one-period asymmetry reaction.
All symmetry restrictions (both long and short-run) can be tested by the Wald test.
Speed asymmetry could be inferred from NARDL on the basis of dynamic multipliers calculation.
As [46] showed, it is possible to derive asymmetric dynamic multipliers associated with unit changes in and , respectively, on yt. The cumulative dynamic multipliers can be calculated as follows from the NARDL-in-levels representation (3) or from CECM (4):
In addition to the main research tool, which is the NARDL model and set of statistical tests connected, standard integration tests such as the ADF test ([52]), KPSS test ([53]), and Zivot–Andrews test [54] being used.
4. Results
The study begins with a visual and statistical analysis of time series. The graphs of the series and descriptive statistics are reported in Figure 3 and Table 2.
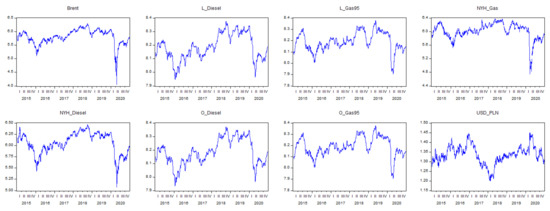
Figure 3.
Time series under examination.
Table 2.
Descriptive statistics.
Visual exploration of the time series leads to three conclusions: First, at the beginning of 2020, a structural disturbance resulted in a significant drop in prices. This disturbance hit Brent, NYH_Gas, and NYH_Diesel particularly hard. Secondly, the prices of wholesale products also collapsed during the period, but a similar collapse took place at the beginning of 2016, which is especially visible in the case of diesel oil. Thirdly, the price’s response to the disruption of 2020 is different for a class of products (gasoline, diesel oil) but similar for both players by products.
Table 2 shows that empirical distributions are lightly or moderately negatively skewed, except for Brent and NYH_Gas series, which have substantial long left tails. It confirms the conclusion from visual examination to some extent. Both of the series are significantly more leptokurtic than others, as well. The normality of distributions is rejected in all of the cases.
For the bound testing for cointegration based on (4), the key step is an integration’s order testing. This approach yields consistent estimates of the long-run coefficients that are asymptotically normal irrespective of whether the underlying regressors are I(1) or I(0), but the bound test could lead to spurious results in the presence of I(2) variables. Therefore, the unit root tests—Augmented Dickey–Fuller (ADF) and Kwiatkowski–Phillips–Schmidt–Shin (KPSS) are carried out to check the stationarity and number of integration order of the variables. As visual exploration shows a high possibility of structural breaks in a series, the Zivot–Andrews unit root test with automatically detected breaks is performed, as well. Results of ADF and KPSS tests show Table 3 and Table 4.
Table 3.
ADF test results—levels and first differences.
Table 4.
KPSS test statistics.
Given the results in Table 3, we will reject the null at all significance levels, since the p-value is 0 for each of the differenced series under consideration and the null hypothesis is a unit root. In particular, since the test is conducted under first differences, it shows that there are no unit roots in first differences, and so each of the series must be either I(0) or I(1). The results of the KPSS test (Table 4) confirm the stationarity of differenced series. As there is a high possibility of structural breaks in the series, the next step deals with that problem. Figure 4 depicts Zivot–Andrews test statistics with estimated structural break date.
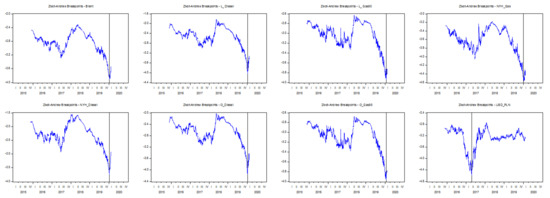
Figure 4.
Zivot–Andrews breakpoints (marked by vertical, grey line).
One can observe that the most significant break in almost all of the series (except USD_PLN series) is detected at the beginning of the 2020 year. The exact dates of estimated breakpoints and test for integration in the presence of those breaks are contained in Table 5.
Table 5.
Zivot–Andrews unit root test.
Values of the Zivot–Andrews test statistics are higher than the critical value for 10% significance level (except USD_PLN series), which implies integration of variables of order at least one. The same test repeated for the first differences showed no higher level integration. The test confirms that the beginning of a pandemic in 2020 caused the most important structural breaks in a whole sample period for all of the series besides exchange rate (where the break is located in the 2017 year).
The second and the main objective of the study is to find out how the COVID-19 outbreak affected the price behavior of market players. As structural changes in all of the series (except USD/PLN exchange rate) that took place at the beginning of 2020 were confirmed, it was therefore justified to move to the next stage of the study. This stage consisted of three steps: The first step was an APT examination of the 2015–2020 sample period; the second step was APT research in a subsample of the 2020 year, only; and the final step was a comparison of the results of two previous steps. General research assumption considers the empirical model of a form:
the wholesale price of a product of player i = f (exchange rate USD/PLN, upstream price)
As there are two players, two downstream products, and two possible upstream inputs (the price of crude or price of an appropriate benchmark), there are eight pass-through models to examine. Each model consists of an independent variable and two regressors. A testable model using NARDL specification, derived from (4) had a form:
where = L_Diesel, L_Gas95, O_Diesel, O_Gas95 (downstream prices); ust = USD_PLN (important cost factor); and xt = Brent, NYH_Gas, NYH_Diesel (upstream prices). Following (6), , , , and are the asymmetric long-run parameters; parameters capture short-run asymmetries, especially , the impact parameters; and ρ is an error correction coefficient.
To check for the existence of asymmetric pass-through, we estimate the unrestricted NARDL models (6) with a maximum order of lags chosen based on the AIC information criterion for all of the possible empirical specifications. Cointegration tests and symmetry tests were performed next, on the basis of estimation. The naming convention of symmetry restriction is as follows: W_LR_u denotes the test of restrictions imposed on long-run multipliers associated with a positive and negative change in the exchange rate; W_LR_x denotes the test of restrictions imposed on long-run multipliers associated with positive and negative changes in the regressor x; W_SRa_u and W_SRa_x denote short-run additive symmetry restrictions (exchange rate, regressor x); and W_SRi_u and W_SRi_x denote short-run impact symmetry restriction (exchange rate, regressor x). The values of test statistics for symmetry restrictions are Wald’s test t-statistics. Table 6 reports the most important results of the estimation and testing phase.
Table 6.
NARDL estimation results—whole sample.
Considering the results presented in Table 6, one can see that, in all cases, the estimated coefficients of the error correction term, the asymmetric long-run parameters, and the impact parameters (capturing the most direct short run asymmetric transmission) are significant at 1% level in all of the estimated models. The values of statistics FPSS and tBDM of the cointegrations tests allow us to reject the null hypothesis of non-cointegration in all of the cases. That implies that the USD/PLN exchange rate and the prices of Brent crude oil, NYH_Gasoline, and NYH_Diesel are important drivers for wholesale fuel prices in the Polish market in the long run. The models with IPP benchmark prices perform slightly better in terms of R2 and Akaike criteria. The long-run coefficient values are all below 0.5 for both players, which indicates that wholesale consumers are fairly insulated from fluctuations in the prices of inputs in the long run. The estimated error correction term values are consistent with the theoretical structure of a model (all are negative). Speed of adjustment toward the long-run equilibrium is about 1.4 to 1.8 % in the case of crude oil and about 2.3 to 2.6 % in the case of benchmarks. This supports the possible IPP schema of pricing.
APT evaluation in a given sample period consisted of testing symmetry restriction and visual exploration of the graphs of asymmetric multipliers. Figure 5, Figure 6, Figure 7 and Figure 8 contain multipliers’ graphs for each of the players and wholesale price as a reaction to change in upstream price and USD/PLN exchange rate. The name of a regressor x is given in parenthesis in the graphs of multipliers for an exchange rate.
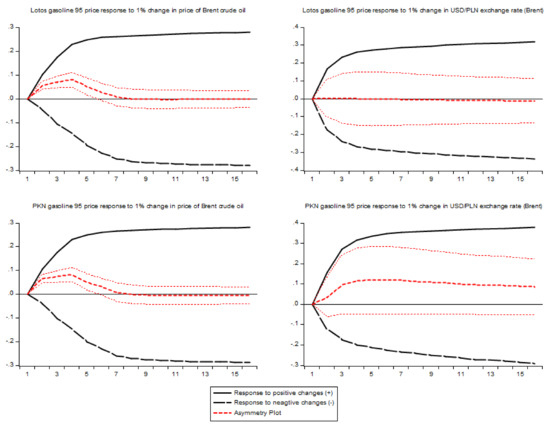
Figure 5.
Dynamic multipliers—whole sample, wholesale Gasoline 95, and Brent crude.
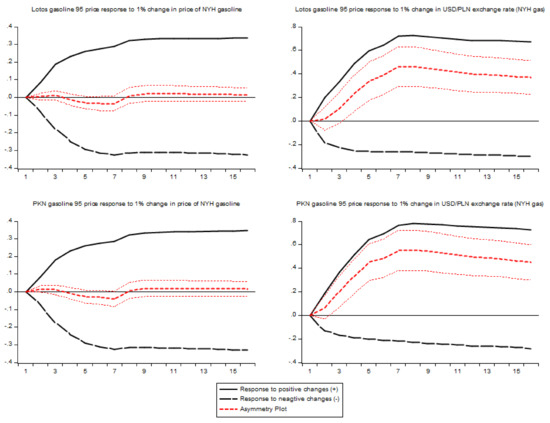
Figure 6.
Dynamic multipliers—whole sample, wholesale Gasoline 95, and NYH_Gasoline.
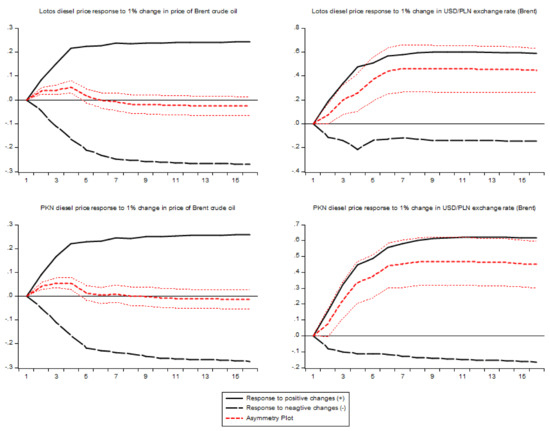
Figure 7.
Dynamic multipliers—whole sample, wholesale diesel, and Brent crude.
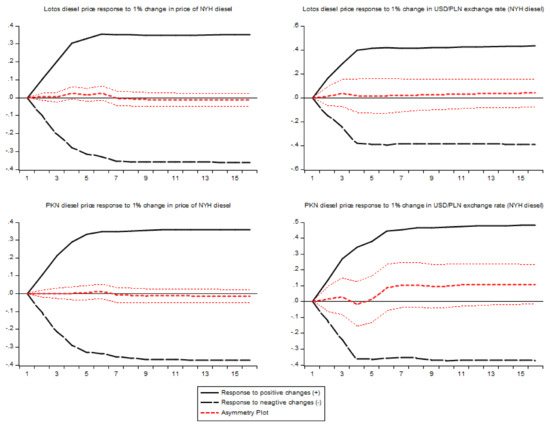
Figure 8.
Dynamic multipliers—whole sample, wholesale diesel, and NYH_Diesel.
Tests of restrictions imposed on long-run multipliers associated with positive and negative changes in the regressor x and USD/PLN exchange rate shows that the difference between long-run multipliers of negative and positive changes is statistically significant in the case of the price of diesel oil (for both of the players). However, positive APT took place in the case of exchange rate pass-through, only. It means that, in the long run, Brent or NYH_Gasoline prices’ reduction has a greater impact on wholesale prices than its increase, and, on the other hand, the reaction of wholesale prices to a depreciation of Polish national currency is significantly stronger than to appreciation. This result is similar to the findings in [47], where negative long-run asymmetry was found in the case of crude and a positive one in the case of the exchange rate. Figure 7 and Figure 8 confirm the strong, positive asymmetric long-term impact of USD/PLN exchange rate in the case of Lotos and PKN when Brent price is the second regressor in a model and moderate positive asymmetry when NYH_Diesel price is in a model.
Given that the study is conducted on daily data, the short-term effects are more important than the long-term asymmetry. Taking the short-run asymmetric effects into account, one should analyze the results of W_SRa_u and W_SRa_x (additive symmetry) and W_SRi_u and W_SRi_x (impact symmetry) restrictions’ tests.
Significant immediate asymmetric effect (impact) is detected in the case of wholesale Gasoline 95 price and Brent price (both players) and wholesale diesel oil price and Brent price (both players). As values of estimated, positive impact parameters are greater than negative ones, and the asymmetry is positive. Additive short-run asymmetry is confirmed in the case of Gasoline 95 price and USD/PLN exchange rate (both players, with NYH_Gasoline price as a second regressor) and in the case of wholesale diesel oil price and USD/PLN exchange rate (both players, with Brent price as a second regressor). Table 7 exposes the type of additive short-run asymmetry.
Table 7.
Aggregates of significant positive and negative short-run multipliers of USD/PLN exchange rate.
In the next step, APT examination in a subsample of the 2020 year is undertaken. The same methodology is utilized in that step to maintain comparability with the study of a whole sample, although with the limitation regarding the length of the sample. One-year sample and daily data are not sufficient to obtain reliable information about the long-term direction of adjustments. Therefore, the study of asymmetry in the short run was the main objective for the year 2020.
Table 8 shows the most important results of the estimation and testing phase for the year 2020, and Figure 9, Figure 10, Figure 11 and Figure 12 contain multipliers’ graphs for each of the players and wholesale price in a comparative form for the whole sample and for the year 2020.
Table 8.
NARDL estimation results—subsample 2020.
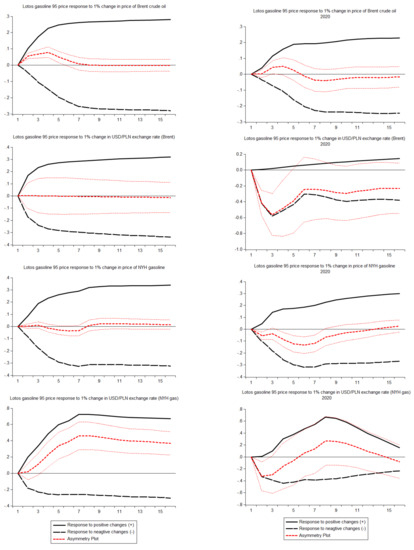
Figure 9.
Dynamic multipliers for Lotos Gasoline 95 (a) whole sample; (b) year 2020.
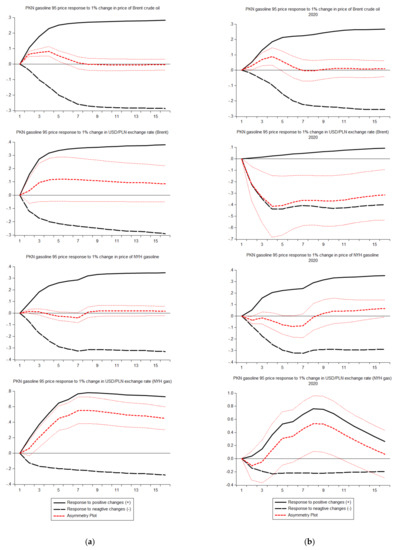
Figure 10.
Dynamic multipliers for PKN Orlen Gasoline 95 (a) whole sample; (b) year 2020.
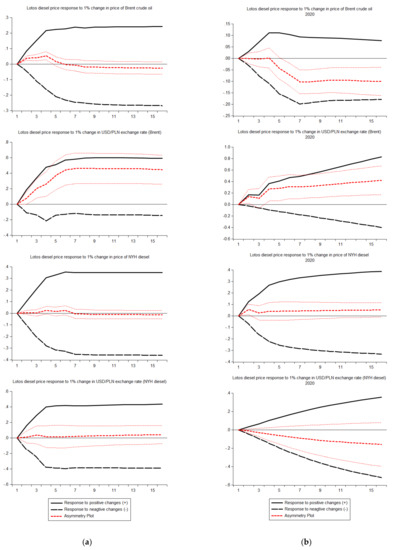
Figure 11.
Dynamic multipliers for Lotos Diesel (a) whole sample; (b) year 2020.
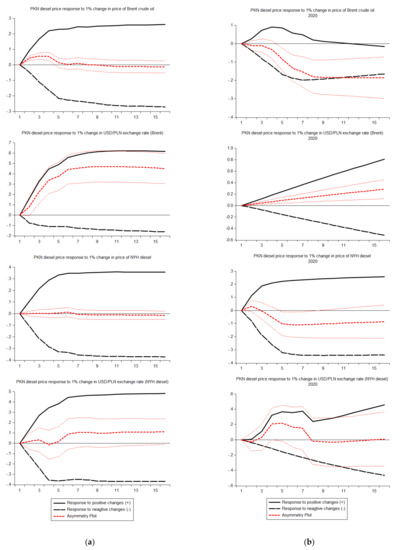
Figure 12.
Dynamic multipliers for PKN Orlen Diesel (a) whole sample; (b) year 2020.
Analysis of Figure 9, Figure 10, Figure 11 and Figure 12 starts the final step of stage two of the research, which is the comparison of APT in a whole sample and a subsample of the year 2020. In these figures, the multipliers for a specific type of product and player for the entire sample (panel a) and for the year 2020 (panel) are presented next to each other.
The analysis of the potential effects of the pandemic on APT is carried out simultaneously on the basis of Table 8 and Figure 9, Figure 10, Figure 11 and Figure 12 and broken down by individual players to capture possible differences in price behavior. Only the differences in APT in the impact (next day effect) and short-run (few days) are assessed. In order to facilitate the evaluation of the research results, they are presented in tabular form. Table 9 summarizes the results.
Table 9.
Comparison of the effects of impact and short-run APT—whole sample and 2020 subsample.
Results contained in Table 9 show clearly that the outbreak of the pandemic did have an impact on a short-run APT and, hence, on competition in a wholesale fuel market in Poland. In 5 of the 16 analyzed cases, the positive asymmetry detected for the entire sample is replaced in 2020 by a negative asymmetry or no asymmetry. Moreover, in five cases, a negative asymmetry is detected in 2020, where there was no significant asymmetry in the entire sample. Only in three cases did positive APT remain unchanged, and in one case, positive impact asymmetry is detected in 2020 when there is no APT in a whole sample.
5. Discussion
The research shows that the first pandemic season of the year 2020 caused structural breaks, which were the most important in a sample period under consideration for almost all of the examined time series. Therefore, the question of the impact of the changes observed that year on the intensity of market competition is completely justified. The paper tries to answer that question on the basis of a well-established connection between positive APT and a possibility of anticompetitive behavior on a relevant market. The results of the research are obtained by an examination of APT in reference sample (whole sample period of 5 years) and comparison with the research done on the subsample of the year 2020. Individual price data of the two major players (with a cumulative market share of 90%) in a Polish market on a wholesale level of distribution are utilized.
Although this study has different goals than those previously encountered in the field of APT research, it is necessary to briefly discuss the results in the context of other studies of the relevant or similar market. In [18], the authors attempted to determine whether an APT can be identified in the Polish wholesale gasoline and diesel motor oil price data from the dominant player PKN Orlen. Using weekly data, they found that the wholesale price response to crude oil price increase was faster than the response to crude oil price decrease in every case. Wholesale price’s response to the increase in the price of regular gasoline was found more intensive than to the decrease with a distinct maximum in the second week. The period of full adjustment was asymmetric in total length—in the case of upward movement of regular gasoline price, it lasted approximately three weeks. In the case of downward change, it lasted about five weeks. The study [30], encompassing the period 2006–2016, revealed significant short-run asymmetries in the transmission of all downstream price determinants and showed that the USD/PLN exchange rate was the main driver underlying a positive asymmetry in the wholesale prices’ paths. In that work, dynamic price adjustment paths for the major players were also compared and common patterns detected (this kind of analysis was not a subject of the current paper). That suggests a strong possibility of parallel pricing, which supports the claim about competitions distortions on the market. The current examination of a whole sample (2015–2020) showed that positive long-term APT in a reference sample took place in a case of exchange rate pass-through. It means that, in the long horizon, reaction of wholesale prices to a depreciation of Polish national currency is significantly stronger than to appreciation. Figure 7 and Figure 8 confirm a strong, positively asymmetric, long-term impact of USD/PLN exchange rate in the case of Lotos and PKN when Brent price is the second regressor in a model and moderate positive asymmetry in when NYH_Diesel price enters a model. It confirms the results of [30] and is in line with [46], where authors showed that Korean gasoline prices are more sensitive to exchange rate depreciations than to appreciations. The author’s finding seems to confirm very clearly, using individual major players’ price series, that positive asymmetry in a national currency exchange rate versus USD pass-through is a common pricing practice. This finding is coherent with the conclusion in [47] that fluctuation of an exchange rate is “less clearly perceived” and therefore may encourage players to use “rocket and feathers” pricing. It is further consistent with empirical results from [26]. The results of the study also confirm the existence of IPP price creation schema, as models with benchmarks (NYH_Gas and NYH_Diesel quotations) are slightly better fitted in terms of the Akaike criterion.
For the realization of the study’s main objective, most important was the study of the reaction asymmetry in a short horizon. There are at least three reasons why short-run asymmetry is more important: At first, the comparative analysis with the subsample of 2020 was justified only for short-run asymmetry measures. Second, the wholesale price levels are announced publicly daily, which encourages exploring short-term price behavior. At third, using high-frequency data and concentrating on short-run pricing policy, one can eliminate justification of positive APT proposed in [13], saying that inventory policy may result in differences in pass-through. The author noticed that refineries might find it difficult to increase production in response to cost decreases, whereas the possibility to cut output through the accumulation of inventories can be implemented immediately. This mechanism, however, includes rather mid- or long-term reactions to change in demand–cost condition, not day-by-day pricing reactions according to some IPP schema.
In the present research, a significant positive impact asymmetric effect is detected analyzing a whole sample in a case of transmission of Brent price to Gasoline 95 price and transmission of Brent price to the wholesale diesel oil price. Additive short-run asymmetry is confirmed in the case of Gasoline 95 price and USD/PLN exchange rate (with NYH_Gasoline price as a second regressor) and in the case of wholesale diesel oil price and USD/PLN exchange rate (with Brent price as a second regressor). These results are in line with the results in [30].
The most important result of the study is the comparison of the 2020 subsample to the entire sample in terms of the presence of short-run APT. After positively verifying the hypothesis that significant structural changes in the analyzed processes (all except USD_PLN) were observed in 2020, it became reasonable to ask whether such turbulences, caused undoubtedly by the COVID-19 pandemic, contributed to the weakening or strengthening of competition on the market under examination. Assuming that positive asymmetry of price reduces end-user’s welfare and could be connected with abuse of market power of the players, the study revealed (Table 9) that rapid changes in the economic environment observed at the beginning of the COVID-19 pandemic did mitigate this potential abuse of market power. The conclusion from this study could be stated as an implication: a significant positive APT had been observed in a history of a market; then, in the economic environment, major perturbations occurred, as a consequence of which the positive asymmetry of the reaction was largely eliminated. The word “consequence” should be treated with caution in this context, meaning correlative rather than causative effect. However, it must be stressed that the author’s results showed the positive asymmetry is not the necessary element of price creation mechanism on the wholesale market, and, in some conditions (demand shocks, increased uncertainty in running a core business, global market instability), this positive APT could almost vanish. It implies that the market became more competitive. This conclusion is somehow similar to results presented in [29], where gasoline pricing in Hungary was investigated. At the wholesale level of the Hungarian market, there exists the dominant player MOL. The pricing practices of that player were investigated by Hungarian Competition Authority. During its investigation, the Hungarian Competition Authority scrutinized the market behavior of MOL under E.U. and Hungarian legal provisions on the prohibition of abuse of dominant position. Authors of [29] detected positive short-run APT in wholesale pricing of MOL in a period before the Authority’s investigation. In a period directly after the conclusion of the investigation, the company’s pricing on the wholesale market becomes more symmetric. Similar to this paper’s results, it means that “rocket and feathers” pricing patterns are not an intrinsic property of the liquid fuel pricing mechanism and may be eliminated by external factors.
6. Conclusions
The empirical investigation of asymmetric pass-through in the Polish wholesale fuel market reveals a significant change in the short-run pass trough of inputs to wholesale prices in the first year of the COVID-19 pandemic. These changes may signal that players could not use market power, and the market became more competitive. Moreover, it means that downward sticky pricing patterns are not necessarily determined by the technological or business properties of the market but are maybe dependent on the deliberate pricing policy of the players. In the author’s opinion, the results confirm a positive relationship between market power and pass-through asymmetry. From the policy perspective, there are two implications that are important. At first, as direct evidence of market power abuse is hard to obtain, such indirect markers as APT should be used to monitor the firms’ behavior. Second, monitoring should be done frequently, especially whenever there are significant changes in the structure of a market or macroeconomic environment. This is especially true for the Polish refining industry at the moment, as there is the merger of PKN and LOTOS planned. The postmerger pricing behavior of the dominant player should be a subject of the subsequent study. This study should account for the retail level of the market as Orlen and Lotos are owners of about 30% of filling stations in Poland. The following open questions to consider are, “how persistent the players’ change in behavior will be” and “what can be a theoretical mechanism generating such a change”. The answers to these questions should be the subject of further studies, as well.
Funding
This research received no external funding.
Institutional Review Board Statement
Not applicable.
Informed Consent Statement
Not applicable.
Data Availability Statement
Data available publicly at: https://www.quandl.com (accessed on 26 February 2021) (Brent crude, NYH_Gasoline, NYH_Diesel), symbols: EIA/PET_RBRTE_D, EIA/PET_EER_EPMRU_PF4_Y35NY_DPG_D, EIA/PET_EER_EPD2DXL0_PF4_Y35NY_DPG_D)—using API of Quandl, https://www.orlen.pl/PL/DlaBiznesu/HurtoweCenyPaliw/ (accessed on 26 February 2021) (wholesale prices of Gasoline 95 and diesel oil), https://www.lotos.pl/ (accessed on 26 February 2021) (wholesale prices of Gasoline 95 and diesel oil), http://api.nbp.pl/api/exchangerates/rates/ (accessed on 26 February 2021) (USD/PLN exchange rate)—using API of NBP.
Conflicts of Interest
The author declare no conflict of interest.
References
- Davis, P.; Garcés, E. Quantitative Techniques for Competition and Antitrust Analysis; Princeton University Press: Princeton, NJ, USA, 2010. [Google Scholar]
- Bejger, S. Detection, Measurement and Assessment of Strategic, Horizontal Anticompetitive Behavior of Market Players—Quantitative Analysis; Wydawnictwo UMK: Toruń, Poland, 2016. [Google Scholar]
- Abrantes-Metz, R.; Bajari, P. Screens for conspiracies and their multiple applications. Antitrust 2019, 24, 66. [Google Scholar]
- Harrington, J.E. Behavioral Screening and the Detection of Cartels. In European Competition Law Annual; Hart Publishing: Oxford, UK, 2006. [Google Scholar]
- Bacon, R.W. Rockets and feathers: The asymmetric speed of adjustment of U.K. retail gasoline prices to cost changes. Energy Econ. 1991, 13, 211–218. [Google Scholar] [CrossRef]
- Peltzman, S. Prices rise faster than they fall. J. Polit. Econ. 2000, 108, 466–502. [Google Scholar] [CrossRef]
- Meyer, J.; Cramon-Taubadel, S. Asymmetric price transmission: A Survey. J. Agric. Econ. 2004, 55, 581–611. [Google Scholar] [CrossRef]
- Frey, G.; Manera, M. Econometric models of asymmetric price transmission. J. Econ. Surv. 2007, 21, 349–415. [Google Scholar] [CrossRef]
- Karagiannis, S.; Panagopoulos, Y.; Vlamis, P. Are unleaded gasoline and diesel price adjustments symmetric? A comparison of the four largest E.U. retail fuel markets. Econ. Model. 2015, 48, 281–291. [Google Scholar] [CrossRef]
- Karrenbrock, J.D. The behavior of retail gasoline prices: Symmetric or not? Fed. Reserve Bank St. Louis Rev. 1991, 7, 19–29. [Google Scholar] [CrossRef]
- Kirchgässner, G.; Kübler, K. Symmetric or asymmetric price adjustment in the oil market: An empirical analysis of the relations between international and domestic prices in the Federal Republic of Germany 1972–1989. Energy Econ. 1992, 14, 171–185. [Google Scholar] [CrossRef]
- Shin, D. Do product prices respond symmetrically to changes in crude prices? Am. Pet. Inst. Res. Study 1992, 68, 137–157. [Google Scholar] [CrossRef]
- Borenstein, S.; Cameron, C.; Gilbert, R. Do gasoline prices respond asymmetrically to crude oil price changes. Q. J. Econ. 1997, 112, 305–341. [Google Scholar] [CrossRef]
- Duffy-Deno, K.T. Retail price asymmetries in local gasoline markets. Energy Econ. 1996, 18, 81–92. [Google Scholar] [CrossRef]
- Reilly, B.; Witt, R. Petrol price asymmetries revisited. Energy Econ. 1998, 20, 297–308. [Google Scholar] [CrossRef]
- Asplund, M.; Eriksson, R.; Friberg, R. Price adjustments by a gasoline retail chain. Scand. J. Econ. 2000, 102, 101–121. [Google Scholar] [CrossRef]
- Eckert, A. Empirical studies of gasoline retailing: A guide to the literature. J. Econ. Surv. 2013, 27, 140–166. [Google Scholar] [CrossRef]
- Bejger, S.; Bruzda, J. Identification of market power using test for asymmetric pricing—An example of Polish petrochemical industry. Dyn. Econ. Models 2002, 5, 135–146. [Google Scholar]
- Radchenko, S. Oil price volatility and the asymmetric response of gasoline prices to oil price increases and decreases. Energy Econ. 2005, 27, 708–730. [Google Scholar] [CrossRef]
- Oladunjoye, O. Market structure and price adjustment in the U.S. wholesale gasoline markets. Energy Econ. 2008, 30, 937–961. [Google Scholar] [CrossRef]
- Meyler, A. The pass through of oil prices into euro area consumer liquid fuel prices in an environment of high and volatile oil prices. Energy Econ. 2009, 31, 867–881. [Google Scholar] [CrossRef]
- Clerides, S. Retail fuel price response to oil price shocks in E.U. countries. Cyprus Econ. Policy Rev. 2010, 4, 25–45. [Google Scholar]
- Polemis, M.L. Competition and price asymmetries in the Greek oil sector: An empirical analysis on gasoline market. Empir. Econ. 2012, 43, 789–817. [Google Scholar] [CrossRef]
- Greenwood-Nimmo, M.; Shin, Y. Taxation and the asymmetric adjust-ment of selected retail energy prices in the U.K. Econ. Lett. 2013, 121, 411–416. [Google Scholar] [CrossRef]
- Lamotte, O.; Porcher, T.; Schalck, C.; Silvestre, S. Asymmetric gasoline price responses in France. Appl. Econ. Lett. 2013, 20, 457–461. [Google Scholar] [CrossRef]
- Atil, A.; Lahiani, A.; Nguyen, D.K. Asymmetric and nonlinear pass-through of crude oil prices to gasoline and natural gas prices. Energy Policy 2014, 65, 567–573. [Google Scholar] [CrossRef]
- Chattopadhyay, M.; Mitra, S. Exploring asymmetric behavior pattern from Indian oil products prices using NARDL and GHSOM approaches. Energy Policy 2015, 86, 262–272. [Google Scholar] [CrossRef]
- Siok, S.K. Impact of oil price changes on domestic price inflation at disaggregated levels: Evidence from linear and nonlinear ARDL modeling. Energy 2017, 130, 204–217. [Google Scholar] [CrossRef]
- Farkas, R.; Yontcheva, B. Price transmission in the presence of a vertically integrated dominant firm: Evidence from the gasoline market. Energy Policy 2019, 126, 223–237. [Google Scholar] [CrossRef]
- Bejger, S. Wholesale fuel price adjustment in Poland: Examination of competitive performance. Econ. Law 2019, 18, 385–412. [Google Scholar] [CrossRef]
- Tappata, M. Rockets and feathers: Understanding asymmetric pricing. RAND J. Econ. 2009, 40, 673–687. [Google Scholar] [CrossRef]
- Kaufmann, R.K.; Laskowski, C. Causes for an asymmetric relation between the price of crude oil and refined petroleum product. Energy Policy 2005, 33, 1587–1596. [Google Scholar] [CrossRef]
- Balke, N.S.; Brown, S.P.A.; Yücel, M.K. Crude oil and gasoline pric-es:an asymmetric relationship? Econ. Financ. Policy Rev. 1998, 1, 2–11. [Google Scholar]
- Perdiguero-García, J. Symmetric or asymmetric oil prices? A meta-analysis approach. Energy Policy 2013, 57, 389–397. [Google Scholar] [CrossRef]
- Australian Competition and Consumer Commission. Petrol Prices and Australian Consumers: Report of the ACCC Inquiry into the Price of Unleaded Petrol. 2007. Available online: https://www.accc.gov.au/publications/petrol-prices-and-australian-consumers-report-of-the-accc-inquiry-into-the-price-of-unleaded-petrol (accessed on 11 March 2021).
- Portuguese Competition Authority. Detailed Analysis of the Liquid Fuel and Bottled Gas Sectors in Portugal Final Report. 2009. Available online: http://www.concorrencia.pt/vEN/Estudos_e_Publicacoes/Estudos_Economi-cos/Energia_e_Combustiveis/Documents/Final_Report_on_Liquid_and_Gas_Fuels_March_2009_English_version.pdf (accessed on 11 March 2021).
- Bundeskartellamt. Fuel Sector Inquiry, Final Report. May 2011. Available online: https://www.bundeskartellamt.de/SharedDocs/Publikation/EN/Sector%20Inquiries/Fuel%20Sector%20Inquiry%20-%20Final%20Report.html?nn=4143316 (accessed on 11 March 2021).
- Bundeskartellamt. Fuel Sector Inquiry, Interim Report. June 2009. Available online: https://www.bundeskartellamt.de/SharedDocs/Publikation/EN/Sector%20Inquiries/Fuel%20Sector%20Inquiry%20-%20Interim%20Report.html?nn=4143316 (accessed on 11 March 2021).
- Hungarian Competition Authority. Commitment Decision of Hungarian Competition Authority Vj/50-722/2010. 2014. Available online: https://www.gvh.hu/en/resolutions/resolutions_of_the_gvh/resolutions_2010/vj_50_2010_722 (accessed on 11 March 2021).
- Italian Competition Authority. Cognitive Survey on the Italian Energy Market. 2012. Available online: http://www.agcm.it/component/joomdoc/doc_download/3448-ic44-testo-indagine-28-dic-2012.html (accessed on 11 March 2021).
- Harrington, J.E. Detecting Cartels. In Handbook of Antitrust Economics; Paolo, B., Ed.; The MIT Press: Cambridge, MA, USA, 2008; pp. 213–258. [Google Scholar]
- Bejger, S. Investigation of the nature of strategic interactions in the Polish wholesale fuel market: Statistical analysis of a market structure and a price mechanism. Acta Univ. Nicolai. Copernici. Ekonomia 2015, 46. [Google Scholar] [CrossRef]
- Bejger, S. Theoretical model of pricing behavior on the polish Wholesale fuel market. Folia Oecon. Stetin. 2016, 16, 286–300. [Google Scholar] [CrossRef][Green Version]
- Posner, R.A. Antitrust Law, 2nd ed.; University of Chicago Press: Chicago, IL, USA, 2001. [Google Scholar]
- Kovacic, W.E.; Marshall, R.C.; Marx, L.M.; White, H.L. Plus factors and agreement in antitrust law. Mich. Law Rev. 2011, 110, 393–420. [Google Scholar]
- Shin, Y.; Yu, B.; Greenwood-Nimmo, M. Modelling Asymmetric Coin-tegration and Dynamic Multipliers in a Nonlinear ARDL Framework. In Festschrift in Honor of Peter Schmidt; Horrace, W.C., Sickles, R.C., Eds.; Springer Science & Business Media: New York, NY, USA, 2013. [Google Scholar]
- Bagnai, A.; Ospina, C.A.M. Long- and short-run price asymmetries and hysteresis in the Italian gasoline market. Energy Policy 2015, 78, 41–50. [Google Scholar] [CrossRef]
- Pesaran, H.M.; Shin, Y.C.; Smith, J.R. Bounds testing approaches to the analysis of level relationships. J. Appl. Econ. 2001, 16, 289–326. [Google Scholar] [CrossRef]
- Pesaran, M.H.; Shin, Y. An autoregressive distributed lag modelling approach to cointegration analysis. In Econometrics and Economic Theory in the 20th Century: The Ragnar Frisch Centennial Symposium; Strom, S., Ed.; Cambridge University Press: Cambridge, MA, USA, 1999. [Google Scholar]
- Schorderet, Y. Revisiting Okun’s Law: An Hysteretic Perspective; Mimeo; University of California San Diego, Department of Economics: San Diego, CA, USA, 2001; Available online: https://escholarship.org/uc/item/2fb7n2wd (accessed on 11 March 2021).
- Banerjee, A.; Dolado, J.; Mestre, R. Error-correction mechanism tests for cointegration in a single-equation framework. J. Time Ser. Anal. 1998, 19, 267–283. [Google Scholar] [CrossRef]
- Dickey, D.A.; Fuller, W.A. Distribution of the Estimators for Autoregressive Time Series with a Unit Root. J. Am. Stat. Assoc. 1979, 74, 427–431. [Google Scholar] [CrossRef]
- Kwiatkowski, D.; Phillips, P.C.B.; Schmidt, P.; Shin, Y. Testing the null hypothesis of stationary against the alternative of a unit root. J. Econ. 1992, 54, 159–178. [Google Scholar] [CrossRef]
- Zivot, E.; Andrews, D.W.K. Further evidence on the great crash, the oil-price shock and the unit-root hypothesis. J. Bus. Econ. Stat. 1992, 10, 251–270. [Google Scholar] [CrossRef]
- MacKinnon, J.G. Numerical distribution functions for unit root and cointe-gration tests. J. Appl. Econ. 1996, 11, 601–618. [Google Scholar] [CrossRef]


Publisher’s Note: MDPI stays neutral with regard to jurisdictional claims in published maps and institutional affiliations. |
© 2021 by the author. Licensee MDPI, Basel, Switzerland. This article is an open access article distributed under the terms and conditions of the Creative Commons Attribution (CC BY) license (https://creativecommons.org/licenses/by/4.0/).