Article

Electric Heating Load Forecasting Method Based on Improved Thermal Comfort Model and LSTM

1
State Grid Inner Mongolia Eastern Electric Power Co., Ltd., Economic and Technical Research Institute, Hohhot 010011, China
2
School of Electrical and Electronic Engineering, North China Electric Power University, Beijing 102206, China
*
Author to whom correspondence should be addressed.
Energies 2021, 14(15), 4525; https://doi.org/10.3390/en14154525
Submission received: 14 July 2021 / Revised: 20 July 2021 / Accepted: 23 July 2021 / Published: 27 July 2021
(This article belongs to the Special Issue Situation Awareness for Smart Distribution Systems)

Abstract

:
The accuracy of the electric heating load forecast in a new load has a close relationship with the safety and stability of distribution network in normal operation. It also has enormous implications on the architecture of a distribution network. Firstly, the thermal comfort model of the human body was established to analyze the comfortable body temperature of a main crowd under different temperatures and levels of humidity. Secondly, it analyzed the influence factors of electric heating load, and from the perspective of meteorological factors, it selected the difference between human thermal comfort temperature and actual temperature and humidity by gray correlation analysis. Finally, the attention mechanism was utilized to promote the precision of combined adjunction model, and then the data results of the predicted electric heating load were obtained. In the verification, the measured data of electric heating load in a certain area of eastern Inner Mongolia were used. The results showed that after considering the input vector with most relative factors such as temperature and human thermal comfort, the LSTM network can realize the accurate prediction of the electric heating load.

1. Introduction

Electric heating is a clean, efficient, and flexible form of heating equipment. In recent years, coal-fired heating has been gradually replaced by electric heating in northern China. In order to control urban haze pollution and improve the quality of life of residents, in recent years, the relevant departments of the state have launched the policies of “electricity instead of coal” and “electricity instead of oil” [1]. These policies promote the process of clean energy gradually replacing polluting energy and greatly improve the effect of reducing pollutant emissions. With the continuous improvement of residents’ requirements for indoor comfort, the scale of electric heating in winter is increasing year by year, and electric heating is used more and more frequently. Meanwhile, the daily maximum load in winter is also increasing.
Electric heating equipment can be divided into centralized (direct heating electric boiler, regenerative electric boiler, etc.) and distributed (heating cable, electric heating film, carbon crystal heating, etc.). Because electric heating in operation will not produce pollution gas and noise, it is very clean and environmentally protective. The typical characteristics of electric heating are high power, concentrated load, easy-to-produce peak load, and large peak valley difference, and thus it has a great impact on distribution lines [2]. Therefore, accurate load forecasting of electric heating load has great practical significance.
The influence of meteorological factors on short-term load forecasting cannot be ignored. The relevant literature mainly analyzes the factors such as temperature, humidity, wind, and precipitation. The article [3] studies the influence of meteorological time series characteristics on urban power consumption and proposes a prediction method different from traditional methods. Articles [4,5] analyzed the prediction model of meteorological sensitive load under the influence of temperature, humidity, snowfall, and other meteorological factors, and put forward the strategy of data processing.
Electric heating load is a kind of temperature control load [6]. In recent years, scholars from all over the world have carried out research work on temperature-controlled load characteristics. The authors of [7,8] predicted the dispatchable capacity and the ability to respond to grid dispatching from the perspective of temperature-controlled load providing auxiliary services for the power system. In the study of [9], the characteristic law of typical microgrid temperature-controlled load is analyzed, and a physical model and a rough scheme for optimal scheduling is established. The authors of [10,11] analyzed and modeled the typical temperature control load characteristics in the centralized area, evaluated the load more accurately in the multi-state situation, and proposed a real-time management and control scheme for the temperature control load.
Load forecasting is based on historical load and weather data in order to analyze the possible influence of historical load data on future load changes, so as to achieve accurate load forecasting in a certain period of time in the future [12]. Short-term load forecasting only forecasts the data of each period in the next few days. The classical load forecasting algorithms generally include artificial neural network (ANN) [13], support vector machine (SVM) [14], and gray neural network [15]. For the learning of time series data, the long-short term memory (LSTM) network algorithm is more mature. In the study of [16], the convergent cross mapping (CCM) method was used to study the internal relationship between power consumption and temperature, wind speed, and other factors. The LSTM neural network model was established, and the urban power consumption was predicted. The results show that the accuracy was good. In [17], different training steps of electric heating load forecasting are compared on the basis of the LSTM network. The results show that LSTM network can achieve accurate electric heating load forecasting in different time scales.
The research on the influence of absolute temperature on power load forecasting has been relatively mature. Few studies have considered the influence of users’ thermal comfort temperature in different environments, taking the difference between users’ thermal comfort temperature and air temperature as the input of load forecasting model.
On the basis of the analysis of electric heating load characteristics in distribution network, this paper focused on the analysis of meteorological factors and the comfort temperature of a main crowd. Firstly, the interfering factors of electric heating load were studied by gray relational analysis method. Then, the thermal comfort temperature model of residents was constructed. Finally, the historical data of electric heating load were connected with the traditional influencing factors and the difference between thermal comfort temperature and air temperature, and the electric heating load was predicted by the improved LSTM network. Meanwhile, the proposed model was compared with other models. The results showed that the prediction effect of the proposed method was better.
This paper proposes an electric heating load forecasting method based on improved human thermal comfort model and improved LSTM neural network. The main contributions of this paper are as follows:
  • Modeling the thermal comfort of the human body.
  • The difference between the user’s thermal comfort temperature and the temperature is introduced, rather than the absolute temperature value as the input in the network model.
  • On the basis of LSTM network, we added attention mechanism and dropout layer.

2. Thermal Comfort Model of the Human Body

The use of electric heating devices in heating areas in China (such as eastern Inner Mongolia) has gradually become mature, and its comfort is very important to the user experience. In the use of decentralized electric heating, human thermal comfort will affect the heating time, heating temperature, and other factors, thus affecting the electric heating load data. As the most important driving force of user response, thermal comfort should be considered in load forecasting.
Indoor environment quality will directly affect the physical and mental health and work efficiency of human body. It is very important and fundamental for people in a heated area to achieve a comfortable indoor temperature. Thermal comfort is used to indicate that most people are satisfied with the objective thermal environment, both physically and psychologically. It is mainly affected by physical conditions, physiological conditions, and psychological conditions [18]. The physical conditions include the heat transfer performance and shading coefficient of the walls and windows of the building where people live, the internal disturbance of lighting and equipment, the growth rate of indoor microorganism, and so on, which are not affected by the human body’s own activities. Physiological conditions include the change of perspiration rate caused by the roughness or cracking of human skin, the intensity of exercise when carrying out routine activities, and the regulation of local or overall sensation of radiation temperature. Psychological conditions refer to the deviation between the factors and psychological expectation in the thermal environment, which are closely related to subjective feeling.
At present, the thermal comfort of people’s environment is usually analyzed according to the ISO 7730 thermal comfort model [19], which is proposed by the international standards organization. The calculation results are expressed by predicted mean vote (PMV), and the formula is as follows [20,21]:
P M V = [ 0.303 × e 0.036 M + 0.028 ] × { ( M W ) 3.05 × 10 3 × [ 5733 6.99 × ( M W ) P a ] 0.42 × [ ( M W ) 58.15 ] 1.7 × 10 5 × M × ( 5867 P a ) 0.0014 × M × ( 34 t a ) 3.96 × 10 8 × f c l × [ ( t c l + 273 ) 4 ( t r + 273 ) 4 ] f c l × h c × ( t c l t a ) }
where M is metabolic rate of human body, W / m 2 ; W is the mechanical power consumed by the human body, W / m 2 ; P a is partial pressure of water vapor in ambient air around human body, Pa; t a is air temperature around human body, °C; t r is average radiation temperature, °C; f c l is the ratio of clothing area covered by human body to bare area; t c l is the temperature of outer surface for clothing, °C; and h c is the heat transfer coefficient, W / ( m 2 · K ) .
ISO 7730 thermal comfort model has a high accuracy in obtaining the user comfort temperature range, but it is difficult to obtain the real-time environmental data required by the model. Therefore, the ISO 7730 model can be simplified properly without affecting the accuracy. In [22], the Rohles simplified model was improved, and the results were extended to a wider range of clothing insulations. Only the indoor air temperature and relative humidity in the test environment were used as the input parameters, and therefore the thermal comfort parameters can be easily evaluated. The results show that the method is very close to ISO 7730 thermal comfort model and is easy to operate and greatly enhanced. The simplified and improved model is as follows:
I P M V = a T a + b P v c
where I P M V is index value of PMV; T a is indoor temperature; P v is relative humidity, %; and a, b, and c are known parameters.
When the indoor temperature and relative humidity are on the high side or on the low side, they will interfere with people’s core temperature. At present, people’s heating temperature is increasing day by day, and therefore the temperature of people’s thermal comfort zone will also rise as a whole, and the regulation ability of cold and heat stimulation of people who stay in the thermal comfort zone for a long time will be weakened. In the end, peoples’ sensitivity and reaction time to adjust the temperature will become longer.
When the indoor temperature is not the expected thermal comfort temperature, people will adjust the temperature setting to achieve the expected value. Therefore, in order to consider the impact of users’ thermal comfort temperature, we used the difference between the air temperature and human thermal comfort temperature to improve the input data of LSTM neural network prediction model.

3. Analysis of Factors Affecting Electric Heating Load

3.1. Load Characteristics of Electric Heating

Electric heating load is different from general electric load, and it has obvious seasonal climate characteristics. Taking the electric heating data of a certain year in eastern Inner Mongolia as an example, from the change trend of annual load curve, we found that the electric heating load in northern region is more intensive in winter (December to March of the next year), in which December to January are the months with the lowest average temperature. From the daily load curve, we found that electric heating load also has obvious characteristics of daily type. From Monday to Friday, the load of office buildings is higher, while the load of weekends and holidays is lower, but the load of commercial and residential electric heating is higher, and the overall trend of daily change is not large. It can be seen from Figure 1 that the typical daily load curve of electric heating in eastern Inner Mongolia presents the characteristics of morning peak, afternoon trough, and evening peak. In terms of electricity consumption, this is mainly due to the start-up of industrial and commercial electric heating in the morning, the general rise of temperature in the afternoon, and the start-up of residential load gathering in the evening.
The key areas of electric energy substitution in eastern Inner Mongolia are distributed electric heating and centralized electric heating, and electric heating accounts for more than 50% of the proportion of electric energy substitution in eastern Inner Mongolia. With the increasing application of electric heating and large-scale access to the power grid, the impact on the operation of the power system is to further narrow the gap between the winter and summer load.

3.2. Correlation Analysis of Electric Heating Load and Influencing Factors

The idea of association analysis is to compare the similarity degree of data series, so as to clarify the association degree and regular pattern between each series. It belongs to an effective and practical method of gray system theory to analyze the correlation degree of various factors in the research object system [5,23]. In order for the variation characteristics of electric heating load in winter in eastern Inner Mongolia to be studied, the relationship between the meteorological factors such as temperature difference (the difference between human thermal comfort temperature and actual temperature), relative humidity, wind speed and snow falling, and electric heating load should be analyzed. The calculation steps of correlation analysis method are as follows:
Step 1: Construct electric heating load characteristic sequence and influence factor sequence. The electric heating load sequence is expressed as X 0 , and the related influencing factor sequence is expressed as X i ; the complete sequence is as follows:
X 0 = ( x 0 ( 1 ) x 0 ( 2 ) x 0 ( k ) x 0 ( n ) )
X i = ( x i ( 1 ) x i ( 2 ) x i ( k ) x i ( n ) )
where k is serial number; n is number of samples, k = 1 , 2 , , n ; and i is the number of related factors, i = 1 , 2 , , m .
Step 2: Obtain the correlation degree.
(a) Each sequence is dimensionless as the initial value, as shown in the following formula:
X i = X i x i ( 1 ) = ( x i ( 1 ) x i ( 2 ) x i ( n ) )
where i = 1 , 2 , , m , and X i is initial value after processing.
(b) Determine the difference between electric heating load sequence and each influencing factor Δ i .
Δ i ( k ) = | x 0 ( k ) x i ( k ) |
Δ i = ( Δ i ( 1 ) Δ i ( 2 ) Δ i ( k ) Δ i ( n ) )
Record the minimum value of all sequence differences as a, the minimum range is b.
{ a = min { Δ i ( 1 ) , Δ i ( 2 ) , , Δ i ( k ) , , Δ i ( n ) } b = max { Δ i ( 1 ) , Δ i ( 2 ) , , Δ i ( k ) , , Δ i ( n ) } i = 1 , 2 , , m
(c) Find the correlation coefficient of each sample in the sequence γ i ( k ) .
γ i ( k ) = a + ε b Δ i ( k ) + ε b
where γ i ( k ) is the correlation coefficient between the k-th parameter of the i-th subsequence and the k-th parameter of the electric heating load sequence, and ε is the resolution coefficient, usually 0.5.
(d) Calculate the average correlation coefficient as the following:
γ i = 1 n k = 1 n γ i ( k )
where i = 1 , 2 , , m .
Step 3: Analyze the correlation coefficient.
Obtain the correlation coefficient between the electric heating load data series X 0 and each related factor series X i . The larger the correlation coefficient, the greater the influence of the factor series on the electric heating load data series. Therefore, the correlation coefficient between electric heating load and various factors can be calculated, as shown in Table 1.
It can be seen from the data in Table 1 that temperature difference and humidity are the most influential factors on electric heating load data, while snowfall and wind speed are relatively less influential. This is mainly because temperature difference and humidity will affect human thermal comfort to a greater extent. Although snowfall and wind speed will also affect people’s psychological expectation and feeling of temperature and humidity, their influence is relatively small relative to temperature difference and humidity.
After the most relevant factors of electric heating load are analyzed, in addition to the historical electric heating load data, temperature difference data and humidity also become the main source data of electric heating load prediction.

4. Improved LSTM Neural Network Prediction Model

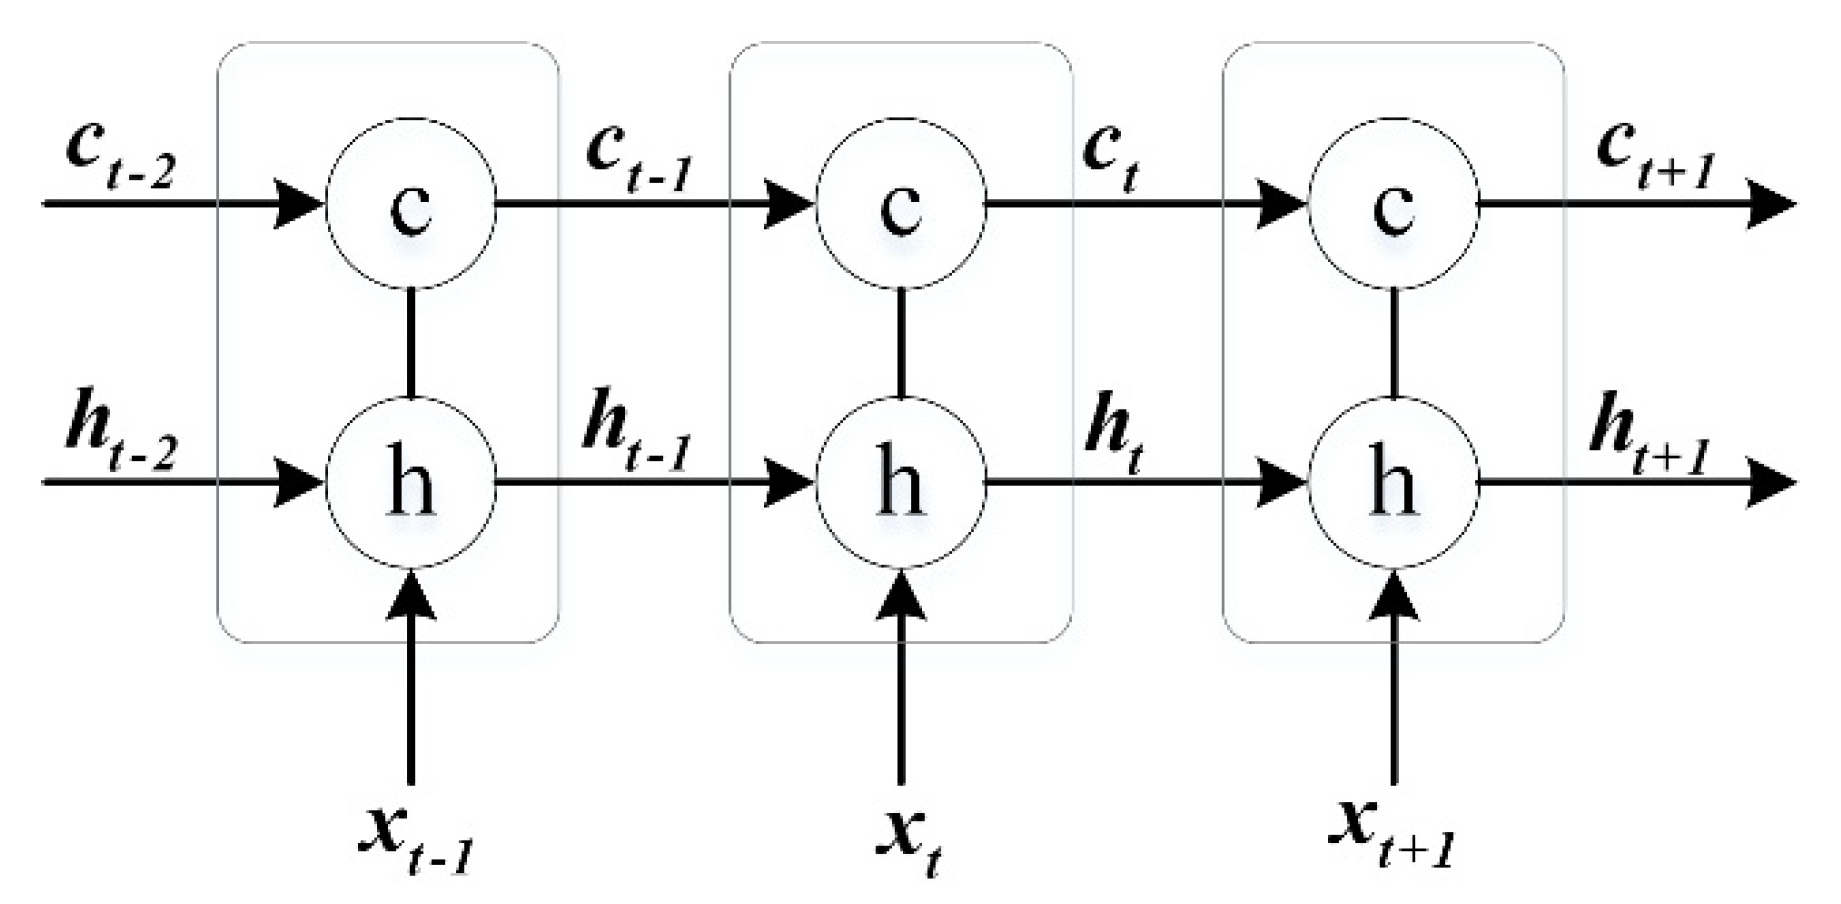
4.1. Long Short-Term Memory Network

Due to the inherent time series of load data, the selected forecasting model must have a good ability to express the time series characteristics. In this paper, the long short-term memory network (LSTM) was taken as the main body and improved as the model to study its applicability for short-term load forecasting modeling of electric heating load in eastern Inner Mongolia.
LSTM is a kind of special recurrent neural network (RNN). It can use the information learned at the last moment to learn at the current moment and can set gradient threshold to prevent the gradient disappearing or exploding in RNN training. LSTM algorithm adds cell state C to the original RNN hidden layer to keep the long-term state, thus solving the long-term dependence problem of RNN. Therefore, LSTM is superior to other neural network models. Figure 2 is the schematic diagram of LSTM expansion structure.
In Figure 2, the input of LSTM consists of three parts: the input value at the current time x t , the output value at the previous time h t 1 , and the cell state at the previous time c t 1 . The output of LSTM consists of the output unit state c t and the output value of hidden layer h t .
Compared with RNN, LSTM redesigns the internal memory unit while maintaining its basic structure. The architecture diagram of each unit of LSTM is shown in Figure 3. The key of every LSTM cell is the control of cell state c . There are three control gates in the unit state, which are forgetting gate f t , input gate i t , and output gate o t . Through these gates, information can be filtered or added to achieve a new unit state.
According to Figure 3, from left to right, it can be seen that the unit state of the previous time c t 1 and the output value of the hidden layer of the previous time h t 1 together memorize the historical information of the sequence data. Step-by-step analysis of LSTM architecture can be divided into three parts.
The first step is to filter the information selectively. The forgetting gate removes the information in the last unit according to h t 1 and x t , that is, it removes the useless part of the information learned at the last moment. The forgetting gate is as follows:
f t = σ ( w f · [ h t 1 , x t ] + b f )
where σ ( · ) is Sigmoid activation function, w f is the weight of forgetting gate, and b f is the bias of forgetting gate.
The second step is to generate new information that needs to be updated. This part is combined by input gate i t and candidate value C ˜ t . h t 1 and x t use sigmoid function to obtain the data that need to be input into the cell state (i.e., input gate) and create a new candidate state through tanh layer. The formula is as follows:
i t = σ ( w i · [ h t 1 , x t ] + b i )
C ˜ t = tanh ( w c · [ h t 1 , x t ] + b c )
where i t is information to memorize, that is, input gate; C ˜ t is the candidate value to update the original cell state; w i and w c represent the weight of input gate and candidate value, respectively; and b i and b c represent the bias of input gate and candidate value, respectively.
The third step is to generate new cell state c t and hidden layer outputs h t . By multiplying the input gate i t and the candidate value C ˜ t and adding them to the forgetting gate f t , one can obtain the updated cell state value c t , as shown in the following formula:
c t = f · c t 1 + i t · k t
The new cell state c t is processed by a tanh function, and then multiplied by the output gate o t to obtain the output value of the hidden layer h t :
o t = σ ( w o · [ h t 1 , x t ] + b o )
h t = o t · tanh ( c t )
where w o is the weight of output gate, and b o is the bias of output gate.
Through the analysis of LSTM structure system, we can see that using LSTM to replace neurons in RNN to build load forecasting model can solve the problem of long-term dependence and we can learn the hidden historical operation law in power load forecasting.

4.2. Improved LSTM with Attention Mechanism

For different times, the brain will focus on the areas that need to be focused on and reduce or ignore the attention to other areas. This kind of attention allocation mechanism can help people to obtain important and detailed information and reduce the influence of other irrelevant information.
Attention mechanism refers to the idea of human brain attention resource allocation [24]. By assigning different probabilities to generate different attention distribution coefficients, the model can better learn the information in the input sequence and improve the accuracy of the model.
The attention structure is shown in Figure 4, where x t ( t [ 1 , n ] ) is the input to the hidden layer of the LSTM model, h t ( t [ 1 , n ] ) is the hidden layer output through the LSTM corresponding to each input, α t ( t [ 1 , n ] ) is the probability distribution value of the attention mechanism output to hidden layer, and y is the LSTM output value with attention mechanism.
The formulas of attention weight matrix and eigenvector in attention mechanism are as follows:
e t = u s tanh ( w s h t + b s )
α t = exp ( e t ) n = 1 t e n
V = t = 1 n α t h t
where e t is the non-normalized weight matrix, and w s , b s , and u s represent randomly initialized attention mechanism weight matrix, bias vector, and time series matrix, respectively.
To sum up, the structure of the improved LSTM electric heating load forecasting model designed in this paper is shown in Figure 5, which is mainly composed of input layer, LSTM layer, attention layer, dropout layer, and output layer. The function of dropout layer is to prevent over learning and set the discard rate, so that some neurons extracted from the model can be “discarded” (do not participate in network training).
Considering the climate characteristics of northern China, according to the results of correlation analysis, we took the historical electric heating load data from January to March l , the difference between human thermal comfort temperature and air temperature Δ t , and relative humidity p v as the original sample set of the prediction model. The sample data were standardized by 0-1 as the input matrix X s of the model. The data of temperature and relative humidity were from the National Meteorological Data Center.
The input data X s of the input layer was simply extracted with feature vectors, and the neural network unit was controlled by three “gates” structures. The output data of LSTM layer was the matrix H = [ h 1     h i     h n ] , which represents the output value of electric heating load of this layer. The input of attention mechanism was the output matrix H of LSTM layer, and the feature vectors V were obtained by different attention weights.

5. Case Study

5.1. Date Preprocessing

The data used in this paper are the historical data of 66 days of electric heating load from January to the first week of March in 2018 in an area of eastern Inner Mongolia. At the same time, the thermal comfort of 300 individuals of different ages was investigated, and the model parameters were fitted by Equation (2), and the thermal comfort temperature of the main population was obtained. Among the 300 individuals, there were 150 men and 150 women, mainly young people aged about 20 years old and middle-aged and old people aged about 60 or 70 years old.
The thermal comfort questionnaire survey was conducted on the subjects, and the temperature and relative humidity during the survey were investigated. The model parameters of the same user under different clothing and activity intensity were obtained by fitting (see Table 2).
It can be seen from Table 2 that users had different adaptability to temperature under different clothes and different activity intensities. In order to make the model more universal, we took the average value of 23.275 °C as the thermal comfort temperature of the human body.

5.2. Parameter Setting and Analysis

The input data were divided into training set and test set. The first 90% of the input samples were taken as the training set for the data samples of model fitting; the last 10% of the input sample was taken as the test set to evaluate the accuracy of the final model, that is, the training prediction of the prediction day. We set the initial learning rate as 0.05, learning decay rate as 0.6, and data training cycle as 250. In addition, the dropout layer discard rate was set to 0.25.
The number of hidden layers of the LSTM network and the number of LSTM units in each hidden layer had an impact on the accuracy of electric heating load forecasting. Under-learning or over-learning will affect the accuracy of the model. The enumeration method was used to record the training effect of different hidden layers and different number of neurons in each layer, so as to determine the optimal network structure. Firstly, the number of hidden layers was set to 1, and different numbers of neurons were set one by one to train and record MAPE; then, we kept the optimal number of neurons in the first layer, set the number of hidden layers to 2, continued to set the number of different units one by one for training, and so on. In this paper, the maximum number of hidden layers was set to 3, and the performance of each training is shown in Table 3.
According to the results in Table 3, when the number of hidden layers was 1 and the number of neurons in each layer was 5, the minimum e M A P E was 4.2486%; when the number of hidden layers was 2, the number of neurons in the first layer was fixed to 5, and the number of neurons in the second layer was set to 20, and the minimum e M A P E was 5.0683%. When the hidden layer was 3, the first two layers were fixed with the optimal number. When the number of neurons in the third layer was 10, the minimum e M A P E was 5.0794%.

5.3. Test Results and Analysis

In order to verify the performance of the thermal comfort model and the improved LSTM neural network method proposed in this paper, we selected the optimal prediction model (one hidden layer, five neurons per layer). In addition, the hourly load from January to early March 2018 was used as the dataset to test the prediction performance of the model, which was compared with the other three cases.
Figure 6 shows the mean absolute percentage error (MAPE) of the prediction results of the proposed method. Figure 7 shows the comparison curve between the actual electric heating load and the load predicted by each method. The curve LSTM-T-A represents the prediction result of the LSTM model with thermal comfort temperature and attention mechanism added, the curve LSTM-T represents the prediction result with thermal comfort temperature added only, and the curve LSTM-A represents the prediction result with attention mechanism added only. The curve LSTM represents the LSTM prediction results without thermal comfort temperature and attention mechanism. It can be seen from Figure 7 that compared with the other three methods, LSTM-T-A had little change in amplitude compared with the real value, and the curve characteristics were closest to the real value.
The MAPE (Mean Absolute Percentage Error), MAE (Mean Absolute Error), and RMSE (Root Mean Square Error) of the above four models are shown in Table 4. In addition to comparing the improved part of LSTM, the errors of SVM and ANN are also compared.
It can be seen from Figure 7 and Table 4 that for the LSTM model, the improvement after adding human thermal comfort temperature and attention mechanism will significantly improve the prediction accuracy of electric heating load. LSTM-T-A prediction curve fitted the real value best, and the selected error index values were the smallest, which showed a better prediction effect.

6. Conclusions

According to the load of electric heating in northern China, we analyzed the load characteristics of electric heating in winter and constructed the thermal comfort temperature model of the human body. The main meteorological factors affecting electric heating load were screened out by the gray correlation analysis method. Meanwhile, the difference between thermal comfort temperature and actual temperature of main users was analyzed and considered. Attention mechanism and dropout layer were added to improve the LSTM neural network, and the optimal number of hidden layers and hidden neurons were obtained.
The actual electric heating load data were used to verify the model and were compared with several models. The results show that:
  • Comprehensive historical data showed that the shape of the typical daily load curve of electric heating load fluctuated greatly, and the peak valley difference was large. Moreover, the electric heating load had a strong time correlation, which was closely related to temperature, relative humidity, and thermal comfort temperature.
  • It is necessary to find the optimal number of hidden layers and neurons in order to mine more data information and improve the prediction accuracy of improved LSTM network.
  • As far as the improvement of LSTM prediction method is concerned, considering human thermal comfort temperature and attention mechanism accuracy, the training effect is the best. When considering the difference between thermal comfort temperature and air temperature in the model input, we found that the conclusion was more accurate and performed better than SVM, ANN, and other algorithms, and thus it is a more suitable electric heating load forecasting method.

Author Contributions

Methodology, J.S.; investigation and data curation, J.W.; resources, Y.S. (Yonghui Sun); project administration, M.X.; supervision, Y.S. (Yong Shi); writing—original draft preparation, X.W.; writing—review and editing, Z.L. All authors have read and agreed to the published version of the manuscript.

Funding

This work was supported in part by State Grid Inner Mongolia East Electric Power Co., Ltd.; the project number is KH20010229.

Informed Consent Statement

Informed consent was obtained from all subjects involved in the study.

Data Availability Statement

Data are contained within the article. Data sharing is not applicable to this article.

Conflicts of Interest

The authors declare no conflict of interest.

References

  1. China Development and Reform Energy No. 2100. Winter Clean Heating Planning in Northern China (2017–2021). 2017. Available online: http://www.gov.cn/xinwen/2017-12/20/5248855/files/7ed7d7cda8984ae39a4e9620a4660c7f.pdf (accessed on 25 February 2021).
  2. Fan, S.; Jia, K.; Guo, B.; Jiang, L.; Wang, Z.; He, G. Collaborative Optimal Operation Strategy for Decentralized Electric Heating Loads. Autom. Electr. Power Syst. 2017, 41, 20–29. [Google Scholar]
  3. Wei, X.; Wang, X. Prediction of Urban Electricity Load Based on Meteorological Big Data. Electr. Meas. Instrum. 2021, 58, 90–95. [Google Scholar]
  4. Shi, J.; Zhang, J. Load Forecasting Based on Multi-model by Stacking Ensemble Learning. Proc. CSEE 2019, 39, 4032–4041. [Google Scholar]
  5. Guo, Z.; Zhang, Z.; Zhou, X.; Hu, S.; Ma, G.; He, C. Study on Forecasting Method of Electric Heating Load Considering Meteorological Factors. Electr. Meas. Instrum. 2021. Available online: http://kns.cnki.net/kcms/detail/23.1202.TH.20200818.1113.010.html (accessed on 30 March 2021).
  6. Huang, Y.; Zhu, Y.; Mu, G.; Ding, D.; Cui, Y. Evaluation of Adjustable Capacity of Household Electrical Heating Load Based on Temperature Forecast. Power Syst. Technol. 2018, 42, 2487–2493. [Google Scholar]
  7. Yu, Y.; Quan, L.; Jia, Y.; Mi, Z. Improved model predictive control of aggregated thermostatically controlled load for power fluctuation suppression of new energy. Electr. Power Autom. Equip. 2021, 41, 92–99. [Google Scholar]
  8. Wang, X. Forecast and Application of Schedulable Capacity of TCLs Based on Big Data Analysis Method. Master’s Thesis, Hefei University of Technology, Hefei, China, 2018. [Google Scholar]
  9. Liu, Q. Research on Control Strategy of Thermostatically Controlled Loads in Microgrid. Master’s Thesis, Beijing Jiaotong University, Beijing, China, 2018. [Google Scholar]
  10. Kevin, P.S.; Sortomme, E.; Venkata, S. Evaluating the Magnitude and Duration of Cold Load Pick-up on Residential Distribution Feeders Using Multi-State Load Models. IEEE Trans. Power Syst. 2016, 31, 3765–3774. [Google Scholar]
  11. Saeid, B.; Hosam, K. Modeling and Control of Aggregate Air Conditioning Loads for Robust Renewable Power Management. IEEE Trans. Control Syst. Technol. 2013, 21, 1318–1327. [Google Scholar]
  12. Xiao, B.; Zhou, C.; Mu, G. Review and Prospect of the Spatial Load Forecasting Methods. Proc. CSEE 2013, 33, 78–92. [Google Scholar]
  13. Wang, L.; Wang, Y.; Wei, Z. Short Term Load Forecasting Based on Regression Analysis and Neural Network. Electrotech. Appl. 2007, 26, 37–39. [Google Scholar]
  14. Lu, N.; Wu, B.; Liu, Y. Application of Support Vector Machine Model in Load Forecasting Based on Adaptive Particle Swarm Optimization. Power Syst. Prot. Control 2011, 39, 43–46. [Google Scholar]
  15. Jiao, R.; Su, C.; Lin, B. Short term load forecasting by grey model with weather factor based correction. Power Syst. Technol. 2013, 37, 721–724. [Google Scholar]
  16. Xu, Y.; Fang, L.; Zhao, D. Electricity Consumption Prediction Based on LSTM Beural Betworks. Power Syst. Big Data 2017, 20, 25–27. [Google Scholar]
  17. Li, X.; Ma, L.; Zhao, X.; Zhu, J.; Xu, Z. Research on Electric Heating Load Forecasting Method Based on Multi-Scale Time and Long-term Memory Network. Proc. CSU-EPSA 2020. Available online: http://kns.cnki.net/kcms/detail/12.1251.TM.20200526.0944.001.html (accessed on 13 April 2021).
  18. Peng, W.; Chen, L.; Lei, J.; Hu, X. Research on Human Thermal Comfort Prediction Model for Machining Workshop in Natural Ventilation. Eng. J. Wuhan Univ. 2020, 53, 261–267. [Google Scholar]
  19. ISO. ISO 7730. Ergonomics of the Thermal Environment-Analytical Determination and Interpretation of Thermal Comfort Using Calculation of the PMV and PPD Indices and Local Thermal Comfort Criteria; ISO: Geneva, Switzerland, 2005. [Google Scholar]
  20. Zhu, Y. Building Environment Science; China Construction Industry Press: Beijing, China, 2005. [Google Scholar]
  21. Fanger, P. Thermal Comfort; McGraw-Hill Company: New York, NY, USA, 1970. [Google Scholar]
  22. Buratti, C.; Ricciardi, P.; Vergoni, M. HVAC systems testing and check: A Simplified Model to Predict Thermal Comfort Conditions in Moderate Environments. Appl. Energy 2013, 104, 117–127. [Google Scholar] [CrossRef]
  23. Zhao, P.; Dai, Y. Power Load Forecasting of SVM Based on Real-time Price and Weighted Grey Relational Projection Algorithm. Power Syst. Technol. 2020, 44, 1325–1332. [Google Scholar]
  24. Zhao, B.; Wang, Z.; Ji, W.; Gao, X.; Li, X. A Short-term Power Load Forecasting Method Based on Attention Mechanism of CNN-GRU. Power Syst. Technol. 2019, 43, 4370–4376. [Google Scholar]
Figure 1. Typical electric heating load curve of a coal to electricity area in eastern Inner Mongolia.
Energies 14 04525 g001
Figure 2. Network deployment structure of LSTM.
Energies 14 04525 g002
Figure 3. Network deployment structure of LSTM.
Energies 14 04525 g003
Figure 4. Structure of attention mechanism.
Energies 14 04525 g004
Figure 5. Improved LSTM short term forecast model of electric heating load.
Energies 14 04525 g005
Figure 6. MAPE of the LSTM-T-A prediction results.
Energies 14 04525 g006
Figure 7. Forecast results of electric heating load.
Energies 14 04525 g007
Table 1. Coefficient of correlation between electric heating load and meteorological factors.
Influence FactorCorrelation CoefficientInfluence FactorCorrelation Coefficient
Temperature difference 10.9601Snowfall0.8326
Humidity0.9416Wind speed0.7952
1 Table notes: In this paper and Table 1, “temperature difference” refers to the difference between human thermal comfort temperature and actual temperature.
Table 2. Thermal comfort model parameters of users.
Clothing Fever/cloActivity Intensity/metabcThermal Comfort Temperature/°C
0.5Weak 0.60.2630.4566.57626.5
Strong 1.20.2670.3786.24323.7
1Weak 0.60.145−0.1272.82322.6
Strong 1.20.114−0.1352.21120.3
Table 3. Forecasting performance of different LSTM network structures.
Number of Hidden Units 1   Hidden   Layer e M A P E / % 2   Hidden   Layers e M A P E / % 3   Hidden   Layers e M A P E / %
54.24868.59617.3803
108.51217.6075.0794
156.76766.444210.6352
204.43615.06839.1701
257.50997.49189.3492
306.72869.74429.7862
358.74445.67556.7193
4010.738610.21548.7017
Table 4. Prediction performance comparison of different neural network algorithms.
Models e M A P E / % e M A E / MW e R M S E / MW
LSTM-T-A4.2486109.3525141.2577
LSTM-T9.5517228.4801297.6025
LSTM-A11.3527293.5961358.2558
LSTM12.7182311.0858399.6952
SVM13.6543346.7190424.6283
ANN14.7216384.1764457.4381
Publisher’s Note: MDPI stays neutral with regard to jurisdictional claims in published maps and institutional affiliations.

