Abstract
Research on enhancing power system resilience against extreme events is attracting significant attention and becoming a top global agenda. In this paper, a preventive augmented power dispatch model is proposed to provide a resilient operation. In the proposed model, a new N-1-1 security criterion is proposed to select disruptive N-1-1 contingency cases that might trigger cascading blackouts, and an iterative contingency assessment process based on the line outage distribution factor is proposed to deal with security constraints. In terms of optimization objectives, two objectives related to power flow on the transmission line are considered to reduce the possibility of overload outages. Controllable series compensation devices are also considered in the model to improve the power flow distribution. Case studies conducted on the modified IEEE 30-bus, 118-bus and Polish 2382-bus systems show that the power flow solution of the proposed power dispatch model can avoid some branches from undertaking excessively heavy loads, especially lines forecasted to be affected by extreme events. The results of blackout simulations through a hidden failure cascading outage simulation model show that the average power losses of the proposed model are reduced by around 40% in some cases as compared to the classical economic dispatch model.
1. Introduction
1.1. Background and Motivation
Blackouts caused by extreme weather events have been occurring with increasing frequency in the past few decades and have caused considerable economic losses to electric power utilities and society in general [1,2,3]. Research on enhancing power system resilience against these extreme events is attracting significant attention and becoming a top global agenda [4,5]. Resilience is defined as the ability of a power system to withstand extreme events, adapt its operation and structure for preventing or mitigating their impact, and recover quickly after its exposition to such events [6]. Generally, approaches to enhance power system resilience can be summarized into two categories, namely infrastructure hardening measures and operational resilience enhancement strategies [7,8]. Infrastructure hardening measures might be more effective than the operational ones but are less economical and hard to implement [9]. Operational strategies could take advantage of incoming information about extreme events, applying specific actions that are adaptive to the prevailing conditions [10]. This paper focuses on enhancing the operational resilience of a power grid and proposes an augmented power dispatch model to offer a preventive resilient generation dispatch solution for power system operators.
1.2. Related Works and Research Gap
The contribution of preventive scheduling of power generation resources to system resilience has been well recognized [11]. Several studies have been carried out based on the classical unit commitment and economic dispatch problems. In [12], a proactive resource allocation model based on a stochastic unit commitment problem was proposed to minimize the restoration cost and improve the operational resilience of electrics power grids against hurricanes. Reference [13] proposed a resilience-constrained unit commitment model considering the impact of microgrids in which contingency scenarios with higher weather-related failure probability were considered. In general, microgrids can keep the system stable operation and minimize blackout. Reference [14] applied the mean-variance Markowitz theory and value-at-risk to assess the risk of system cost variability due to the presence of high penetration of renewables such as PV. The risk of system cost can further be reduced through energy storage participation. Reference [15] proposed a day-ahead two-stage stochastic unit commitment optimization framework to offer a preventive operation strategy to power system operators. Reference [16] presented a day-ahead and intraday multi-objective dispatch model for an integrated biomass concentrated solar system considering the conditional value-at-risk. Reference [17] developed a sequentially proactive operation strategy in which a Markov process was used to model the uncertain sequential transition of system states due to damages caused by extreme events. The transition probabilities were evaluated according to weather-dependent failure rates. Our previous work [18] proposed a resilience-constrained unit commitment framework in which a proportional hazard model was used to calculate the forced outage rate of transmission lines affected by extreme weather events. Reference [19] proposed a two-stage robust unit commitment taking into account the weather-related failure probability of transmission lines.
The main difference between the above resilience-based generation dispatch optimization models and the traditional ones is the considered contingency set. Contingency cases with higher failure probability related to extreme events are considered in the security constraints in resilience-based models. Fragility curves of system components in different extreme events are considered to model the impact of the forecasted extreme event on component outages in the above papers. However, fragility curves presented in the literature are difficult to implement in practice since it is hard to obtain accurate parameters of the curve. Moreover, it is also difficult to forecast or measure the specific impact of extreme events on every electrical component. For example, it is not easy to get the wind speed and angle acting on a transmission line during a hurricane. What we can know from current extreme weather events prediction and waring service system in power grids are the areas or components that will be affected and the general hazard level for the event. This gives challenges in real operation to access the efficacy of the above methods. Another problem of the existing works is that most of the studies only focus on changing the security constraint to provide a resilient operation strategy. The security constraints only ensure that the operation is safe for the defined contingency set. The system might be violated if other high-order contingency cases occur.
1.3. Contributions of This Paper
In this paper, both security constraints and the objective function of the optimization model are modified to offer a resilient generation dispatch solution. As for the security constraints, two types of contingency sets are considered. The first type is the N-1 contingency of all transmission lines. The second type is the proposed N-1-1 contingency set. Given that heavily loading lines have a high probability of overload outages or hidden failures [20], transmission lines with heavy post-contingency power flow of N-1 outage are selected as N-1-1 contingency sets in this work. By considering the security constraint of these N-1-1 contingency cases, the further propagation of N-1 contingency cases caused by the extreme event might be reduced. It can be imagined that the number of the defined N-1-1 contingency cases is affected by the generation dispatch solution. In turn, the dispatch solution may be changed after considering the contingency constraints. Therefore, an iterative process is needed to address this issue. The iterative contingency filtering process proposed in [21] is extended in this paper to generate the defined N-1-1 contingency cases and incorporate the security constraints of the N-1 and N-1-1 contingency sets into the optimization model.
The security constraints mentioned above only ensure that the operation is safe for the defined contingency set. The system might be violated if other high-order contingency cases occur (for example, the N-3 contingency case). Of course, we can avoid this situation by considering higher-order security constraints in the optimization model, but considering higher-order security constraints may lead to unsolvable problems.
In this paper, we try to cope with this situation by adjusting the optimization criteria of the objective function. A key reason why initial failures of a few components caused by extreme events develop into cascading failures that eventually lead to blackouts is the massive power flow transfer in the grid after the initial failure [22]. If we can improve the power flow distribution in the network to prevent massive power flow transfer after disturbances, the probability of blackouts caused by cascading failures could be reduced [23]. Referring to our previous study [24], two objectives related to power flow are considered in this paper to improve the power flow distribution in the transmission system. However, improving the distribution of power flow by simply adjusting the generation of generators is limited in some cases because the line flow is limited by the impedance and capacity of the transmission line. In this paper, the adjustment of transmission line reactance by controllable series compensation devices is considered in the optimization model. Controlled series compensation devices are already part of the transmission network in many countries, and it is expected that the number of controlled series compensation devices installed in the grid will increase significantly in the future with advances in control methods [25]. This paper focuses on devices that compensate for the reactance of the line they are installed in [26], such as static synchronous series compensators (SSSC) and thyristor-controlled series capacitors (TCSC). The main difficulty in incorporating series compensation devices into the DC power flow-based security-constrained economic dispatch problem is the computational complexity caused by the flexibility of line reactance. Reference [27] reformulated this nonlinear programming problem as a mixed-integer linear programming problem by using the big M relaxation technique. A more computationally efficient method was proposed in [28] based on the PTDF-based power flow model. Referring to the above study, this paper jointly optimizes the generator output and the reactance adjustment value of the transmission line by a controllable series compensation device to improve the power flow distribution in the transmission system. The main contributions of this paper are summarized below:
- A new N-1-1 security criterion is defined to select the disruptive contingency cases that might trigger cascading failures. It is defined from the perspective of preventing further propagation of N-1 contingency. The security constraints of the defined contingency set are formulated by using the line outage distribution factors and are taken into account in the proposed power dispatch model through an iterative contingency filtering process.
- Two objectives related to active power flow on transmission lines are considered in the dispatch model to avoid full or heavy loads on lines in the transmission system, thus reducing the probability of massive power flow transfer and overload cascading outages after the initial outage. The adjustment of transmission line reactance by controllable series compensation devices is considered in the optimization model.
- The proposed augmented power dispatch model is nonlinear due to the line flow-related objective function and the consideration of controllable series compensation devices. Linear relaxation techniques are introduced to convert the model into a mixed-integer linear program. Although MILP is less challenging compared to the original nonlinear programming, it is not preferred, especially for large-scale real power systems. A computationally efficient two-stage solution is proposed to further reduce computational complexity.
The remainder of the paper is organized as follows: section two introduces the proposed augmented power dispatch optimization model and its solution methodology. Section three presents the simulation results of the case studies conducted on the IEEE 30-bus, 118-bus, and Polish 2383-bus systems. Section four presents the discussions. Conclusions are given in section five.
2. The Proposed Augmented Power Dispatch Model and Solution Methodology
2.1. Definition of the Defined N-1-1 Contingency Set
The classical security-constrained economic dispatch mainly considers the N-1 security constraints and is not resilient enough to ensure the safe operation of the grid. However, since there is a large number of transmission lines in the grid, it is impractical to have a solution that satisfies the security constraints for all N-k contingencies [29]. Contingency selection is often employed to reduce computational complexity.
As mentioned in the introduction, two types of contingency sets are considered in this paper. The first type is the N-1 contingency of all lines. The second type is the proposed N-1-1 contingency set. It is defined from the point of preventing the further propagation of N-1 contingency cases. Although the N-1 security constraints have already ensured that the loss of any single line does not result in power flow violation of the remaining online lines, there exist some lines whose post-contingency power flows exceed steady-state operating limits and are close to the emergency operating limits. These lines have a high probability of hidden failure and are also susceptible to cascading outages if disturbances occur. Therefore, in this work, these lines are considered as potentially disruptive N-1-1 contingency cases. By considering these contingency cases in the optimal power dispatch problem, the further propagation of N-1 contingency cases caused by an extreme event might be reduced.
Since the selection of the defined N-1-1 contingency cases is based on the analysis of the post-contingency power flow for each N-1 contingency case, the number of N-1-1 contingency cases is affected by the power dispatch solution. In turn, the solution may be changed after considering the security constraints of these contingency cases. We will first introduce the power dispatch optimization model in the next section and then the method for handling the security constraints of the defined contingency set.
2.2. Mathematical Formulation of the Proposed Power Dispatch Optimization Model
The security constraints of the defined contingency set only ensure that the power flow solution is secure for specific contingency cases. If other high-order contingency cases occur, such as the N-3 contingency case, the system might be violated. As mentioned in the introduction, the optimal criteria of the generation dispatch optimization model are modified in this paper to improve the resilience of the solution. Two objectives related to power flow are considered in this paper to reduce the probability of overload outage of N-k contingency cases. Firstly, the disaster forecast information is used to select the lines that will be affected by the upcoming extreme events. It can be seen that only the forecasted information about whether a component is affected by an extreme weather event is needed, which makes it more applicable for system operators. The first objective is to reduce the loading rate of lines that are forecast to be affected by extreme weather events, as these lines have a higher probability of outages. The second one minimizes the difference in the loading rate of all transmission lines. These two objectives interact with each other. By optimizing both objectives in the optimal power flow problem [30], not only the loading rate of the transmission line can be reduced, but also the overall utilization of the grid can be improved. By defining the loading rate as the ratio of the active power flow on a transmission line to its transmission capacity, the detailed mathematical representation for each objective is given below.
where is the active power flow of line . is the active power flow capacity of line in the normal operating state. , , and are set of transmission lines that are forecast to be affected by an extreme weather event, all lines, and generators. is the number of the line. is the active power output of generator . are quadratic, linear, and no-load cost coefficients of generator , respectively.
The first objective is created based on the sum of the loading rate of the lines affected by an extreme event, and the second objective is created based on the mean absolute deviation of the loading rate of all transmission lines. The second objective reflects how close the loading rate of a transmission line is to the average loading rate. It provides a measure of the homogeneity of power flow distribution. The difference in the power flow on all lines is reduced when this measure becomes smaller. With the cooperation of these two objectives, the loading rate of every transmission line is optimized to be in equilibrium at a low level. The last objective is the total production cost of all generators, and the production cost of a generator is usually a quadratic function of generation. Considering the above three objectives and the adjustment of transmission line reactance through controllable series compensation devices, we propose an augmented power dispatch model to improve the power flow distribution in the transmission system and minimize generation costs, thus improving the resilience of the power system under extreme weather events, as follows:
where are coefficients of the considered three optimization objective terms. are the minimum and maximum active power output of generator . is the active power demand at the bus . is the set of buses. is the element located in row and column of the bus-generator incidence matrix . is the element located in row and column of bus-line incidence matrix . is the initial active power flow on the transmission line without considering the control of controllable series compensation. is the active power flow on the transmission line injected by the controllable series compensation. is the active power injected to bus . are the minimum and maximum relative adjustment of the susceptance of line . is the initial susceptance of line . are the minimum and maximum adjustment of the susceptance of line . is the set of lines with controllable series compensation. represents the direction of power flow and takes a value of 0 for positive power flows and a value of 1 for negative power flows. is the set of lines equipped with controllable series compensation devices. is a sufficiently large positive number. is the shift factor between line and bus , which denotes a change in the power flow on line when one unit of power is injected to bus . Since the classical DC power flow model is used in the proposed model, the following equation can calculate the shift factor matrix of a given transmission network topology.
where is the shift factor matrix with the size of . is in row and column of matrix . is a diagonal matrix with elements representing the reactance of all lines with the size of . is a bus-lines incidence matrix with the size of . is a reduced identity matrix with the size of . , and are the number of all lines and all buses.
Constraints in (6) limit the minimum and maximum output of all generators. Equations in (7) ensure power balance for each bus. Active power flow on a transmission line is calculated by constraints (8) to (16), and limited by (17). In this paper, reactance control of series compensation devices is modelled as power flow injection to keep the initial shift factor matrix of the transmission network without compensation devices unchanged, thus improving the computational efficiency. The detailed model is shown below. Assuming that the susceptance adjustment range of a line equipped with a series compensation device is , the active power flow on the line can be calculated by separating the effect of the series compensation device and the initial power flow of the line as follows [28]:
where and are the voltage angle of the from bus and to bus of line , respectively. are the susceptance adjustment of line by the control of the series compensation in line . is the relative adjustment of the susceptance of line .
The equation in (22) includes the production of adjustment variable and line flow . It needs further reformulation to avoid computational complexity. By using the big reformulation technique and variable representing the direction of line flow , this equation can be reformulated as a set of mixed-integer linear constraints shown, as in (11) to (16).
The modelling of an augmented power dispatch model with controllable series compensation devices has been completed. However, it is difficult to solve the optimization model directly due to the absolute value terms in the objective function in (5) and the constraints in (18).
According to optimization theory with absolute values, the objective and constraints with absolute values can be reformulated as linear or mixed-integer linear by introducing some auxiliary variables. First, to linearize (18), the binary variable used in (11) to (13) and two new continuous variables and are introduced to reformulate each absolute value constraint as a set of linear constraints (23) to (26). To linearize the second objective term in (5), only two additional constraints (27) and (28), and one auxiliary variable , are needed for each term. As for the quadratic cost functions, they can be approximated by a set of piecewise linear functions along with constraints (29) and (30). Thus, the proposed nonlinear problem can be reformulated as a mixed-integer linear programming problem (MILP) as follows:
s.t. (6) to (17)
where,
where is the active power output of generator at segment . is the maximum active power output of generator at segment .
Although MILP is less challenging compared to the original nonlinear program problems, it is not preferred, especially for large-scale real power systems. As mentioned before, the binary variables in the proposed problem determine the flow direction of the lines. Assuming that the power flow direction of each line is known, the binary variables can be fixed and the proposed problem will become a linear problem. Based on the above analysis, a computationally efficient two-stage solution method is introduced for large-scale real power systems. The first stage solves the classical economic dispatch model without the two proposed objectives and controllable series compensation devices and initializes the direction of the power flows for the second stage. The second stage enforces the power flows in the initial direction of the first stage; that is, the binary variables in (11) to (13) and (25) to (26) are fixed. The proposed power dispatch model becomes a linear problem. It can be easily solved. Though the solution may or may not be globally optimal, the significance of this method does not vanish in the absence of optimality; the algorithm can very quickly find a solution with a significantly lower cost and line loading rate.
2.3. Iterative Contingency Filtering Process
As described in Section 2.1, the defined N-1-1 contingency set is created after getting the optimal power flow dispatch solution, and the security constraints in turn affect the solution of the optimization model. Therefore, the iterative contingency filtering process proposed in [21] is extended in this paper to generate the defined N-1-1 contingency cases and incorporate the security constraints of the N-1 and N-1-1 contingency sets into the optimization model. The line outage distribution factor is used to calculate the post-contingency power flow on each online line as well as to create security constraints for active N-1 contingency and N-1-1 contingencies cases in the process. The post-contingency power flow is calculated by using the line outage distribution factor (LODF) of the DC power flow. The LODF is defined as the incremental active power flow on the monitored transmission line caused by the outage of a contingent line with a pre-contingency active power flow of one unit [31]. LODF under a single-line outage or multi-line outage can be generalized by using the power transfer distribution factor (PTDF) of a pre-contingency network with the following equations [32,33].
where is a line outage distribution factor matrix with the size of . and are power transfer distribution factor matrices with the size of and , respectively. is an identity matrix with the size of . and are diagonal matrices with elements representing the reactance of monitored lines and outaged lines with the size of and , respectively. and are bus to monitored lines and bus to outaged lines incidence matrices with the size of and , respectively. and the number of monitored lines and outaged lines in a contingency. are the number of all buses.
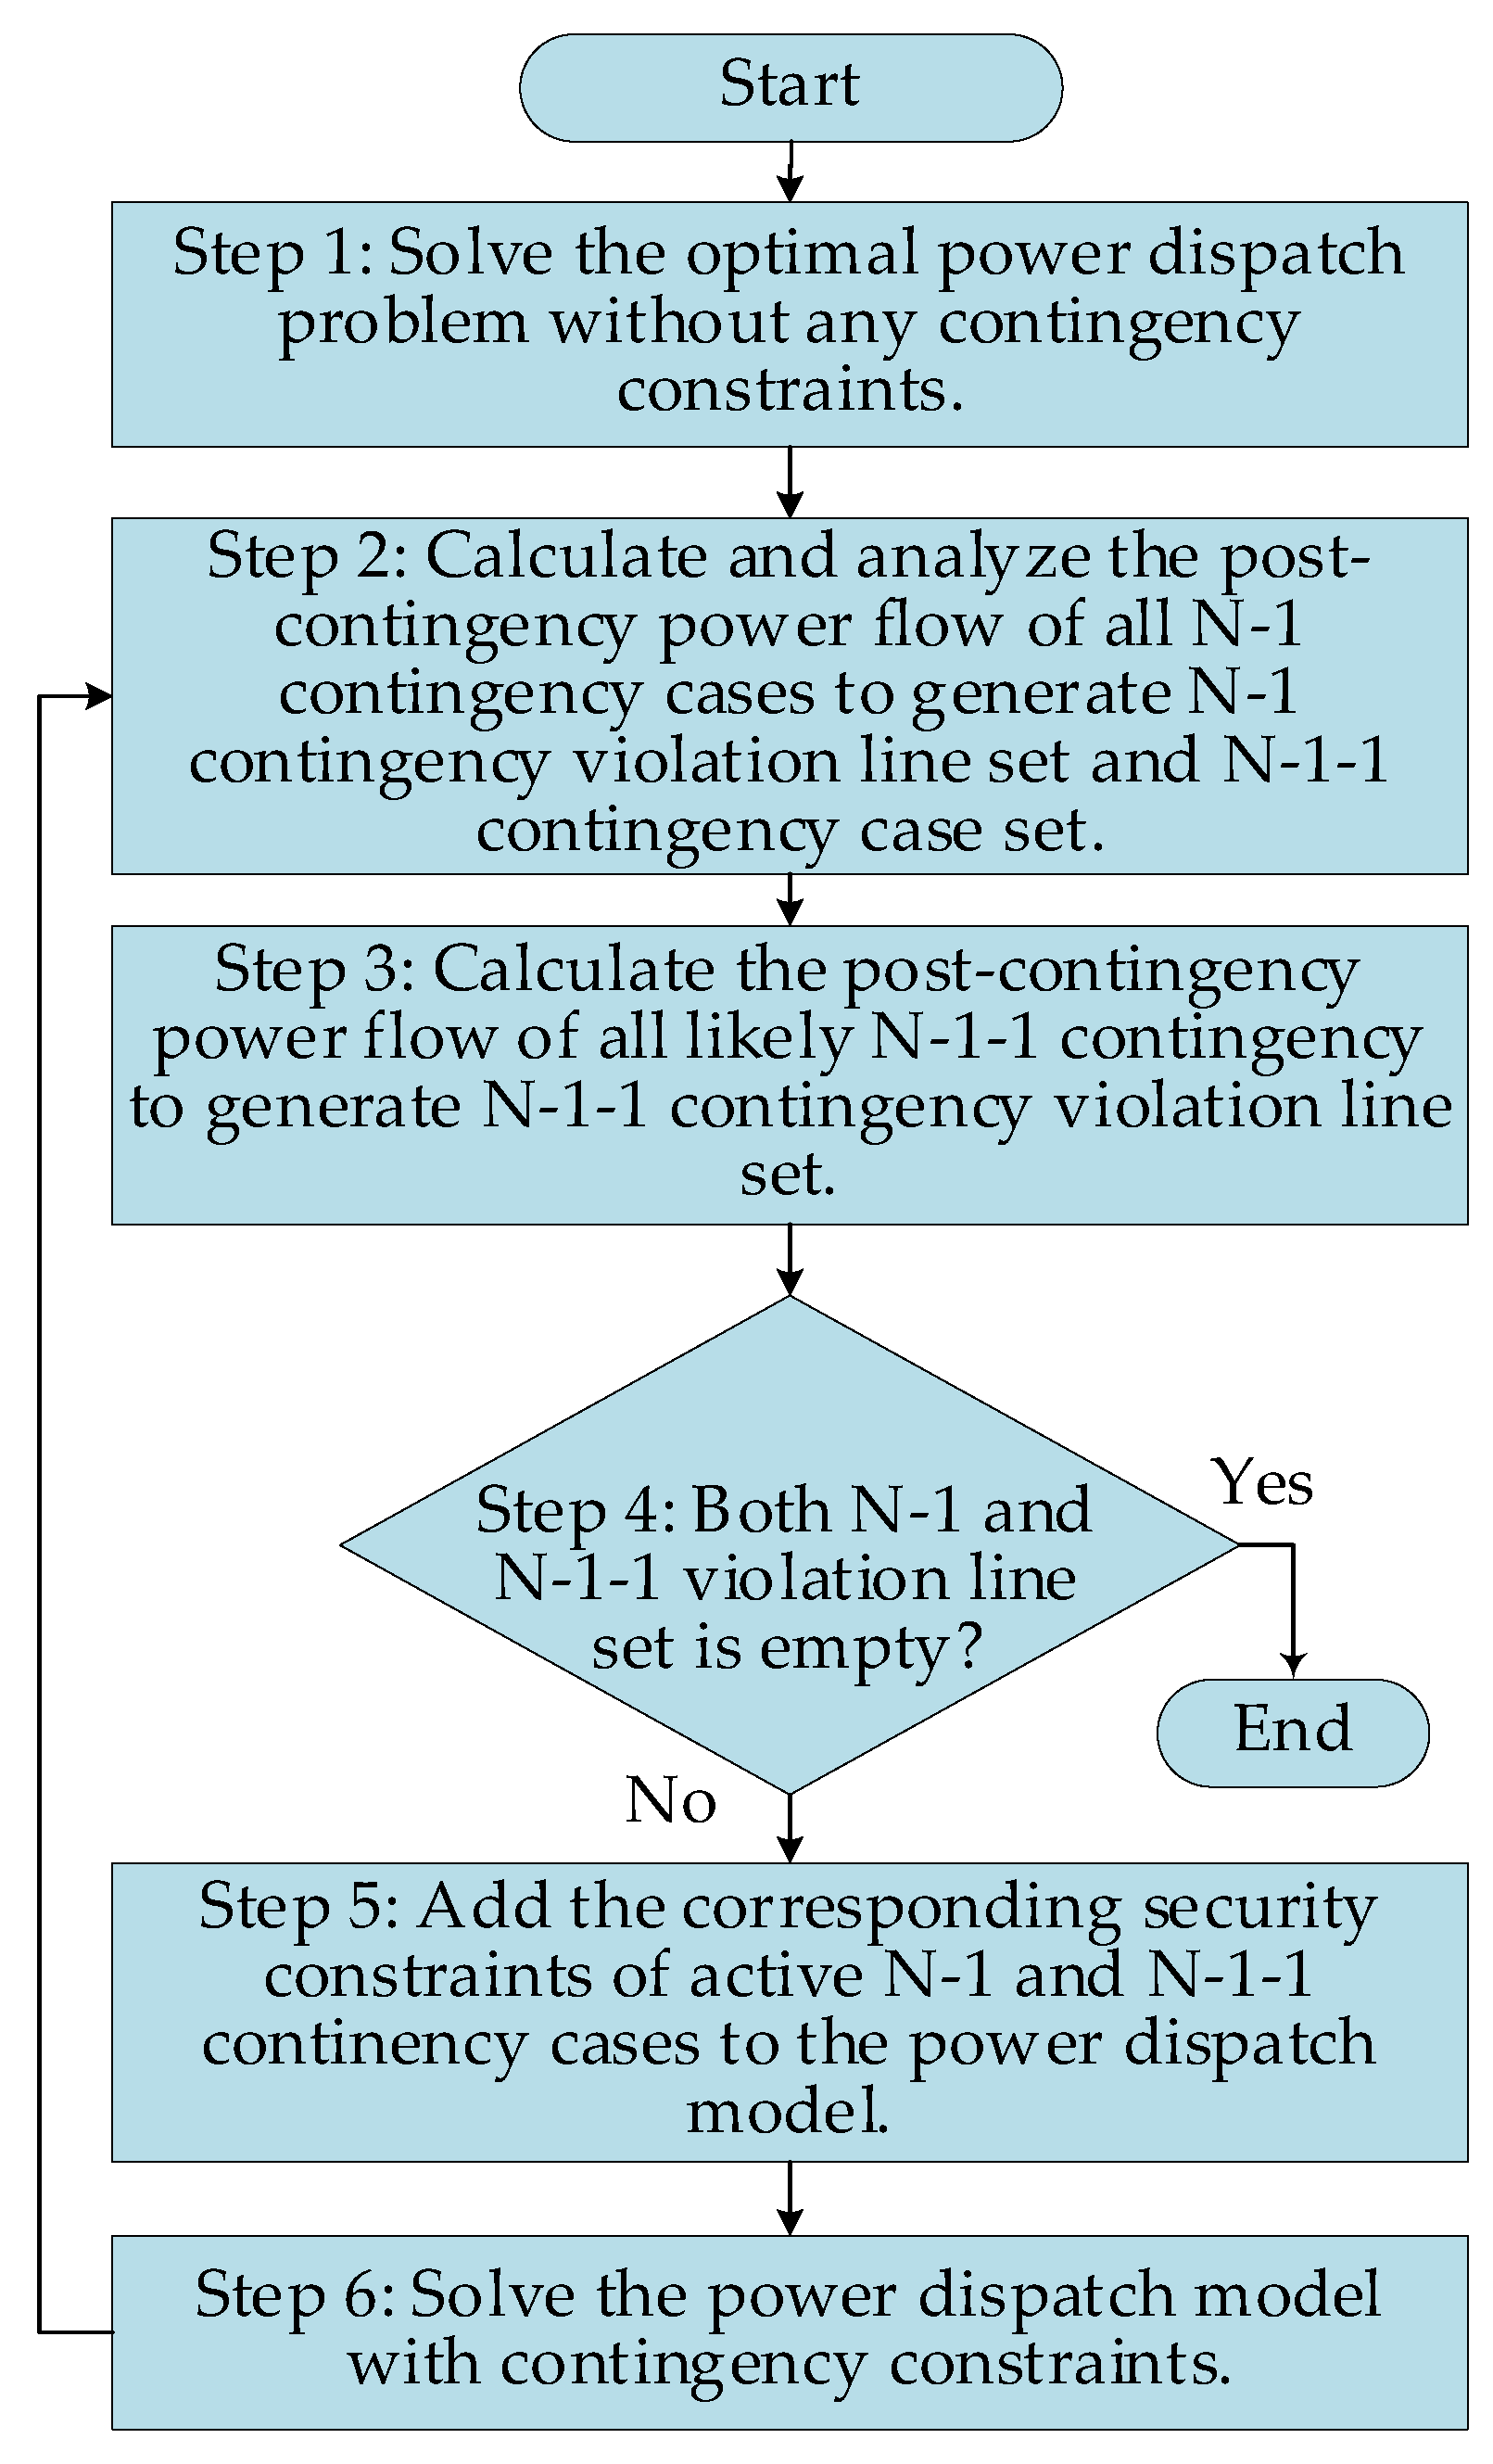
Figure 1 shows the flowchart of this iterative contingency filtering process. The detailed mathematical equations for each step are presented below:
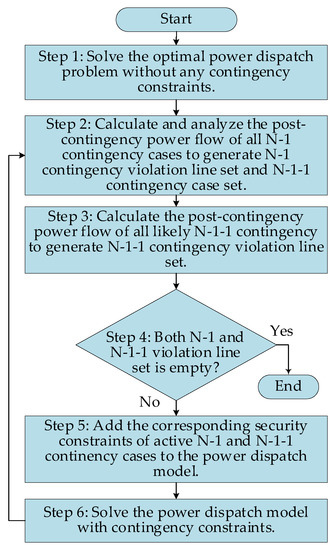
Figure 1.
Flowchart of the proposed iterative contingency filtering process.
Step 1: Solve the power dispatch problem without contingency constraints and obtain the power flow solution. The classical DC power flow model is used in this paper.
Step 2: Calculate and analyze the post-contingency power flow of all N-1 contingency cases to generate a set of N-1 contingency violation lines set and a set of the defined N-1-1 contingency cases. For example, for a given N-1 contingency case of the outage of line , the post-contingency power flow of any monitored line calculated by using LODF can be represented as follows [32]:
where and are the active power flow on transmission lines and before contingency. is the LODF between lines and when line is on an N-1 contingency.
After getting the post-contingency power flow, if is bigger than the emergency operating limits , line will be marked as a violation line of line and saved to the N-1 contingency violation lines set , which will be used to create N-1 security constraints later. If is smaller than emergency operating limits but bigger than the steady-state operating limits , line is marked as a potential N-1-1 contingency line following the outage of line . Lines and are saved to the disruptive N-1-1 contingency line set . The above N-1 post-contingency power flow analysis is conducted for all N-1 contingency cases in the set of . Note that N-1 and N-1-1 contingency cases that will split the system are not considered.
Step 3: Calculate the post-contingency power flow of all N-1-1 contingency cases selected in Step 2. For example, for an N-1-1 contingency case of lines and , the post-contingency power flow of any monitored line calculated by using LODF can be directly represented as follows:
where and are the LODF between line and lines and when lines and are on outage together or in sequence.
Equation (38) can be further simplified. By substituting (37) into (38) and given that is equal to zero after the outage of line , there is:
According to the LODF calculation equation shown in (34)
It can be further proved that:
By substituting (44) into (39), and a more simplified equation could be obtained to calculate the post-contingency power flow of an N-1-1 contingency case as below, which is the same as an N-2 contingency case [32]:
After getting , if is bigger than , line will be marked as a violation line of N-1-1 contingency of lines and , and it is added into the violation lines set . The above N-1-1 post-contingency power flow analysis for all N-1-1 contingencies cases in the set of is conducted.
Step 4: Check if both N-1 and N-1-1 violation line sets are empty. If they are empty, stop. Otherwise, continue.
Step 5: Create N-1 and N-1-1 security constraints of the active contingency scenarios for the optimization model. With the obtained violation line sets and , the N-1 and N-1-1 security constraints for each contingency case in the above two sets can be formulated as follows:
where , , and are optimization variables of the optimal power dispatch model which represent the power flow on a line in normal operating state, N-1, and N-1-1 contingency cases, respectively.
Step 6: Add the above constraints (46)–(49) to the proposed augmented power dispatch problem and re-optimize and solve the problem until all security checks are satisfied. If security constraints could not be ensured, a load shedding variable is needed in the model to guarantee a feasible solution [34].
For the final power dispatch solution derived through the contingency assessment process described above, any N-1 contingency on all affected transmission lines would not result in a violation. In addition, there will be no disruptive N-1-1 contingency cases, and if there are, these contingency cases will be inactive. This means that their outages will not cause other lines to be overloaded.
Overall, with the consideration of the proposed optimization objective and security constraints, a power dispatch solution with better power flow distribution can be obtained as compared with the classical economic dispatch optimization model. The possibility of cascading failures is reduced, and the power system resilience is enhanced.
3. Case Studies
To evaluate the effectiveness of the proposed model and solution techniques, simulation studies on the modified IEEE 30-bus, IEEE 118-bus, and Polish 2383-bus systems were carried out.
3.1. IEEE 30-Bus System
Three cases were studied to test the effectiveness of the power dispatch solution obtained from the proposed model in enhancing power system resilience to extreme weather events.
Case 1 studies generation costs and power flow solutions for different power dispatch models. In this case, three different power dispatch models without considering the security constraints of contingency cases are studied. Model 1 is a classical single-objective economic dispatch model in which only the generation cost is considered as the optimization objective. Model 2 is the resilience-constrained economic dispatch model proposed in our previous work [24], where objectives related to power flows are considered, but the adjustment of transmission line reactance by controllable series compensation devices is not considered. Model 3 is the proposed augmented power dispatch model considering the control of series compensation devices. For the sake of brevity, in the following discussion Models 1 through 3 are denoted as ED, RCED, and APD, respectively.
Case 2 studies the effectiveness of the proposed N-1-1 security criterion and the contingency assessment process. In this case, the pre-contingency and post-contingency power flows of different models are analyzed and compared.
Case 3 studies the reliability and resilience performances of the above models by using a modified cascading collapse assessment with the consideration of hidden failure [20]. The probability distribution curve of the blackout size will be used to show the resilience performance of a power system in this case.
Detailed data for the test system are in Appendix A. is formed by assuming lines 10, 16, 22, 29, 30, 33, 35, 37, and 38, which are affected by an extreme weather event. Assuming that all lines are equipped with controllable series compensation devices, the maximum adjustment value of line susceptance is set to 90% of the initial value. In all cases, for power dispatch models considering line flow adjustment objectives, the coefficients of the different objective terms are set to , , and , which are determined according to the order of magnitude of the different objective terms. In Cases 2 and 3, the emergency limit is set to 120% of the steady-state operation limit. All cases were tested in MATLAB 2016a using the Gurobi solver on a personal computer with a 3.20 GHz i5 processor and 8 GB RAM.
3.1.1. Case 1
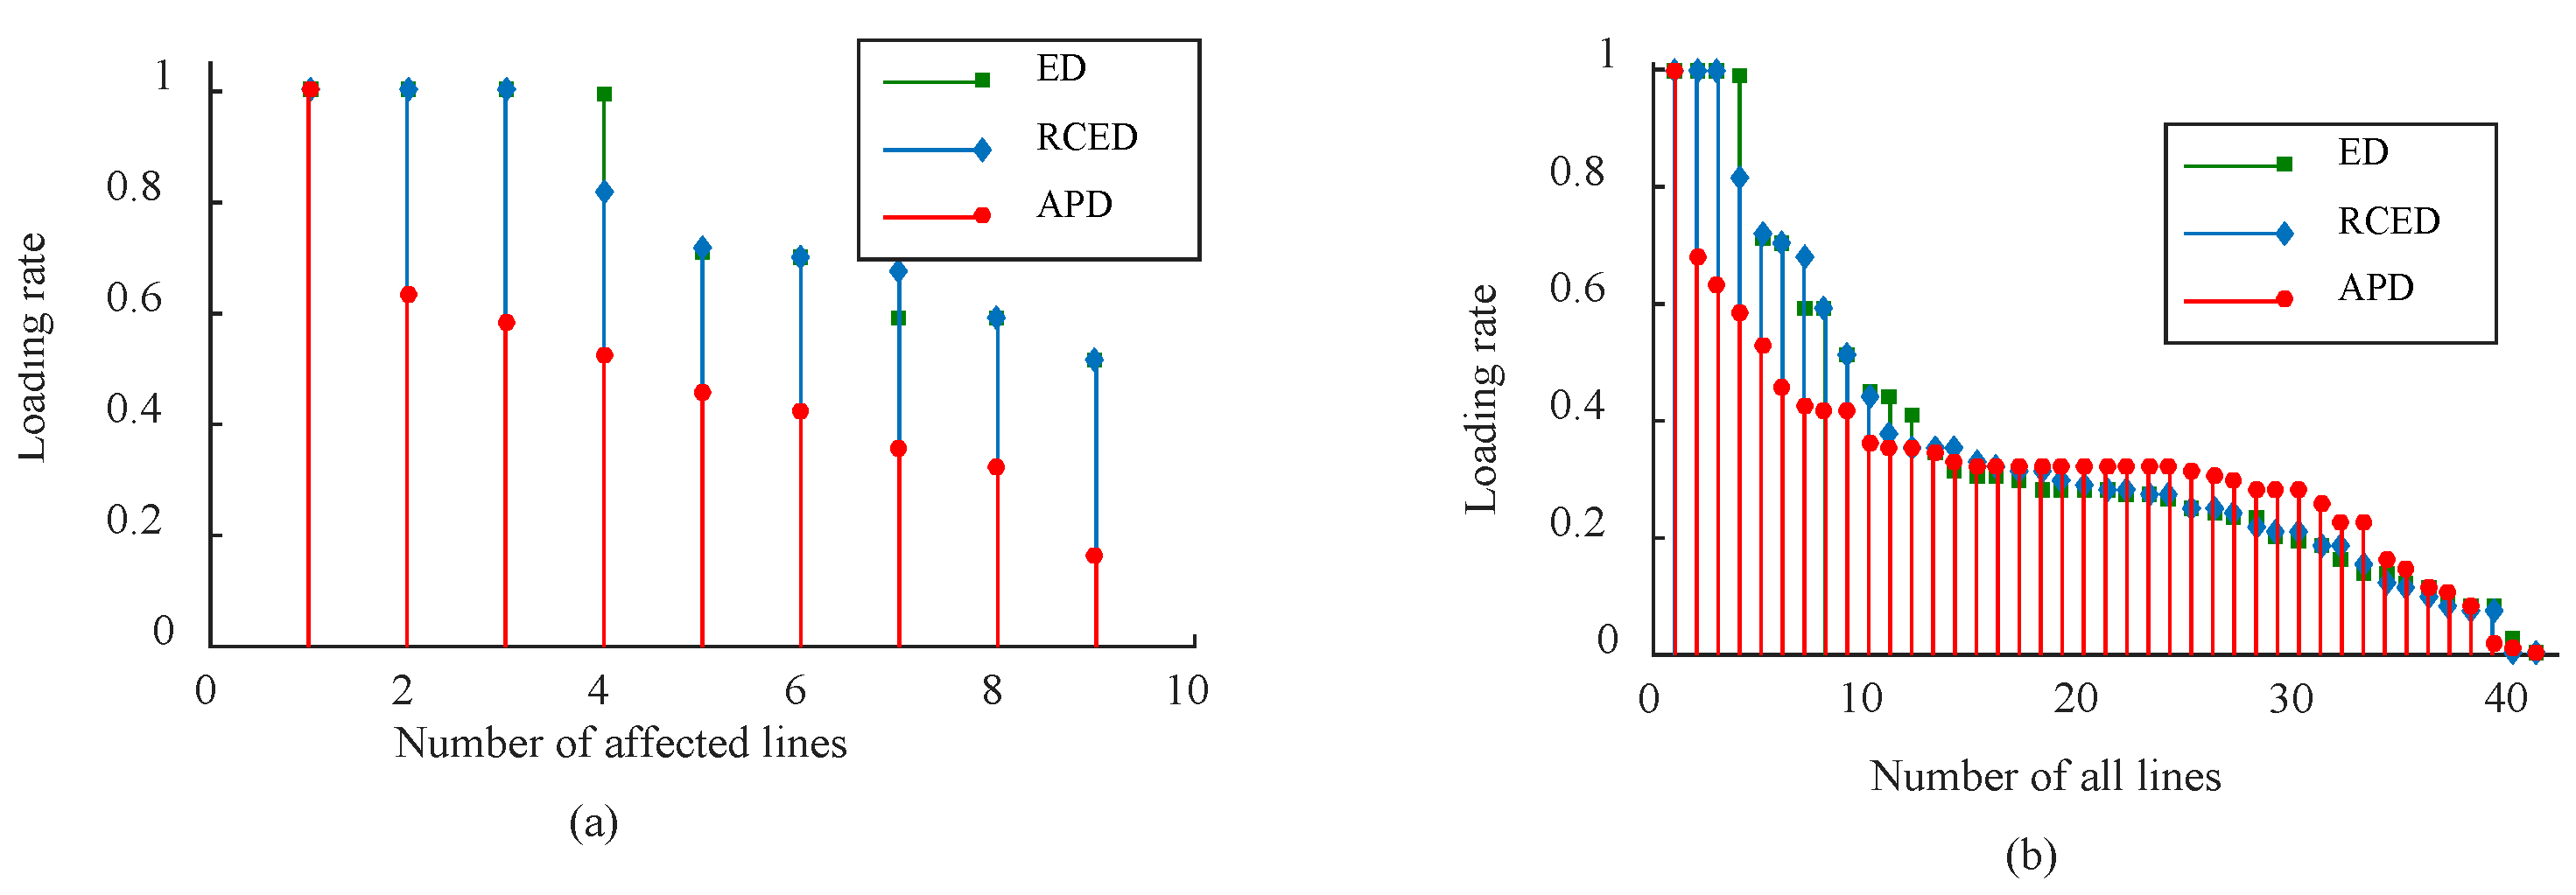
Since the first and second objectives are introduced to minimize the active power flow in the transmission system, taking into account the series compensation devices, first the active power distribution in the transmission system was studied to investigate the effectiveness of the proposed objectives and the joint control action. Figure 2a,b show the loading rate distribution of affected lines and all lines, respectively. As shown in Figure 2, the loading rate of the affected lines and all lines of the RCED are similar to those of the ED. This indicates that, in some cases, the power flow distribution cannot be improved by controlling outputs of generators alone, even when the objectives related to power flow adjustment are considered. One reason for this result is that as load demand increases, the number of units committed to generation increases and the dispatch capacity to adjust power flows decreases. With the adjustment of transmission line impedance by controllable series compensation devices, the proposed augmented power flow dispatch model APD has good performance in improving the power flow distribution on the line. The loading rates of the affected lines in the APD are much lower than the others. The loading rates of all lines in the proposed model are also smoother than those of the other two models. That is, the inhomogeneity of power flow on the branches is small and the power flow distribution in the transmission system is uniform. In addition, the relatively small number of heavy and light load lines in the APD means that not only can heavily loading lines be avoided, ensuring safe system operation during extreme weather events but also light loading lines can be reduced, improving the overall utilization of transmission capacity.

Figure 2.
Loading rates for (a) lines affected by extreme weather and (b) all lines ranked from highest to lowest.
To quantify the power flow distribution in the transmission system, we calculated seven indices, including the average loading rate (Ave.) and (Ave.), the variance of the loading rate (Var.), the maximum loading rate (Max.), and the number of heavily loading lines (Num. , Num. and Num. ). The obtained results are shown in Table 1 below.

Table 1.
Comparison of power flow distribution indices of different power dispatch models tested on the IEEE 30-bus system.
As shown in Table 1, the classical economic dispatch model ED has the worst results. Four lines operate at their operating limits (Num.). These lines are more likely to experience overload outages or hidden failure outages when power flows fluctuate. Outages on these fully loading lines will also result in large-scale power flow transfers, which may result in cascading failure outages. As for the proposed model APD, the power flow distribution is significantly improved compared to the other two models, thanks to the adjustment of the transmission line reactance by the series compensation device. The average loading rate and loading rate variance for all lines, as well as the average loading rate for the affected lines, were significantly reduced (by almost half compared to the other models). As for the heavily loaded lines, only one transmission line operates at its capacity in the proposed model, while in the ED and RCED models there are four and three, respectively. As the loading rate decreases, the probability of relay malfunction is also greatly reduced, which will make the power system more secure. Compared with RCED, APD has a lower generation cost (that is, the proposed model can achieve a better power flow distribution with less cost). In summary, the simulation results obtained in this case validate the effectiveness of the proposed augmented power dispatch model and the solution.
3.1.2. Case 2
Case 2 investigates the effectiveness of the proposed N-1-1 security criteria and the contingency assessment process. In this case, security constraints for the defined N-1 and N-1-1 contingency cases are considered in the proposed augmented power dispatch model. In the following discussion, the model with security constraints is denoted as SCAPD. In this case, the pre-contingency and post-contingency power flow distributions of the different models are compared. The analysis of Case 1 shows that the APD has a good power flow distribution state when the power system is in steady-state operation. However, since it does not take into account the security constraints of any contingency case, the system may experience load shedding when transmission line failure occurs. To study this problem, first N-1 and N-1-1 contingency analyses are performed on the generation scheduling schemes obtained from different models to see how many power flows exceed the operating limits. The analysis results are shown in Table 2. S1 denotes the number of scenarios in which the post-contingency power flow exceeds the emergency limit for N-1 contingency cases. S2 denotes the number of scenarios in which the post-contingency power flow exceeds the steady-state operating limit but is less than the emergency limit for N-1 contingency cases. These scenarios are used to generate the proposed N-1-1 contingency cases. S3 denotes the number of scenarios in which the post-contingency power flow exceeds the emergency limit for the proposed N-1-1 contingency cases.
Table 2.
Comparison of the pre-contingency and post-contingency power flow distributions for different models tested on the IEEE 30-bus system.
As can be seen from Table 2, scenario S1 for APD is much smaller than that for ED. However, in the APD model, there are still five lines with post-contingency power flows exceeding the emergency limit under the N-1 contingency. For example, when line 10 is out of service, the post-contingency loading rates of lines 40 and 41 are 1.282 and 1.296, respectively, which means that lines 40 and 41 will be out of service immediately after Line 10 is out of service. N-1 security constraints should be added to lines 40 and 41 to ensure the security of system operation. Scenarios S2 for APD shows that there are 21 scenarios in which the post-contingency power flow exceeds the steady-state operating limit but is less than the emergency limit of the transmission line. For example, when line 15 fails, line 10 has a post-contingency loading rate of 1.016. When there is a disturbance in the system, line 10 may experience an overload outage. If line 10 fails, two lines will be overloaded and this will develop into a cascading failure outage. Therefore, the proposed N-1-1 security constraint for preventing cascading blackouts should be considered in the power dispatching problem, especially in extreme weather conditions.
The proposed N-1-1 security constraints are added in the APD by using the iterative contingency assessment process described in Section 2.3. The model converged after two iterations. This validates the computational efficiency of the LODF-based contingency assessment process. the power flow distribution indices of SCAPD are shown in row three of Table 2. The SCAPD model has no overloaded lines in all N-1 and N-1-1 contingency analyses due to the security constraints of the N-1 and N-1-1 contingency cases. However, if only the traditional N-1 security constraint is considered in the APD model, there are two lines with post-contingency line flows exceeding the operating limits but under the emergency limits in all N-1 contingency analyses, as shown in the fourth row of Table 2. For example, when line 10 fails, line 41 has a post-contingency loading ratio of 1.2. Lines 10 and 41 will become one scenario in S2. If this N-1-1 contingency case occurs, it will result in three lines being overloaded, which could develop into a cascading outage. Therefore, by considering the security constraints of the defined N-1-1 contingency in the power dispatch model, to a certain extent, the risk of cascading failures in the power system can be reduced, thus improving the operational recovery of the system.
3.1.3. Case 3
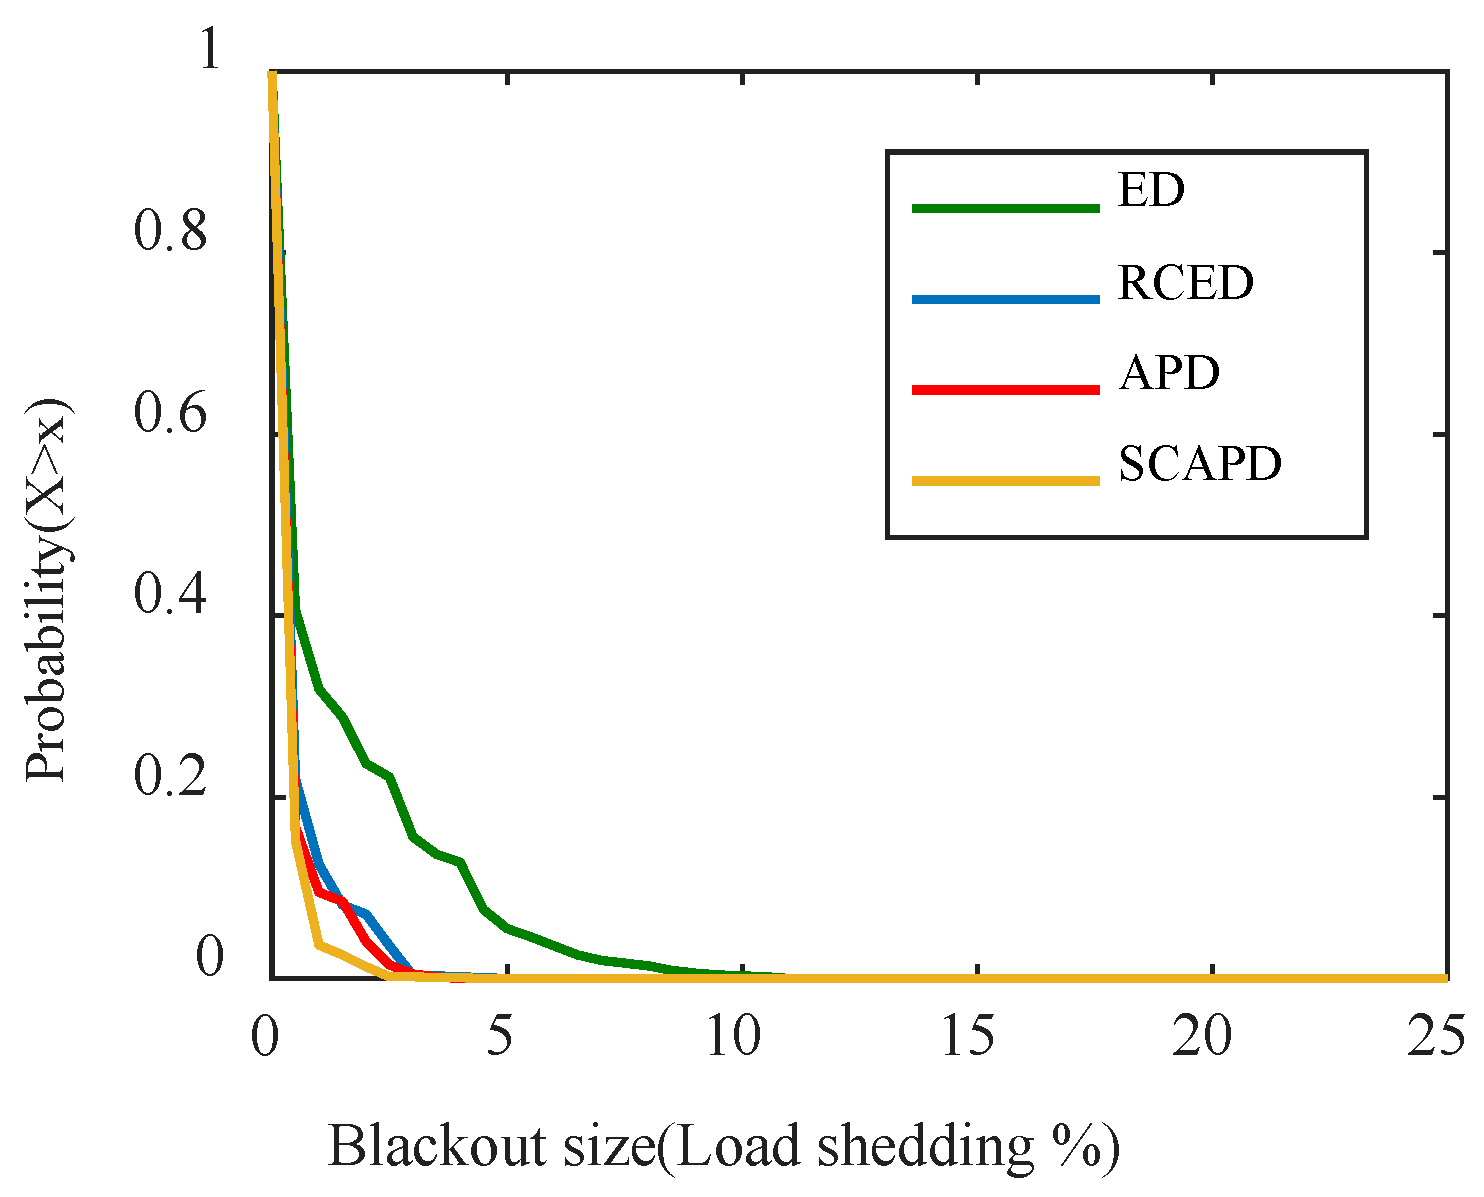
In this case, the reliability and resilience performances of different power dispatch models in an extreme weather event are studied by using a modified cascading collapse assessment considering hidden failure. The initial first step of the cascading simulation procedure presented in [35] was changed to consider an initial trigger event caused by an extreme weather event, which was generated by Monte Carlo sampling. It is assumed that each line has a probability of outage in the initial state, but the affected lines have a higher probability of failure. In this case, for lines affected by the extreme weather event, each line has a probability of failure between 0 and 0.05, which is randomly generated in each simulation. The rest of the lines have a smaller random failure probability between 0 and 0.005. To avoid initial triggering events leading to system disconnections, a maximum of three lines were allowed to fail in the initial event. We performed one thousand simulations and calculated the percentage of load shedding in each simulation to represent the cascading blackout size. The probability distribution curves of the blackout sizes for different models are given in Figure 3, and the detailed results are shown in Table 3.
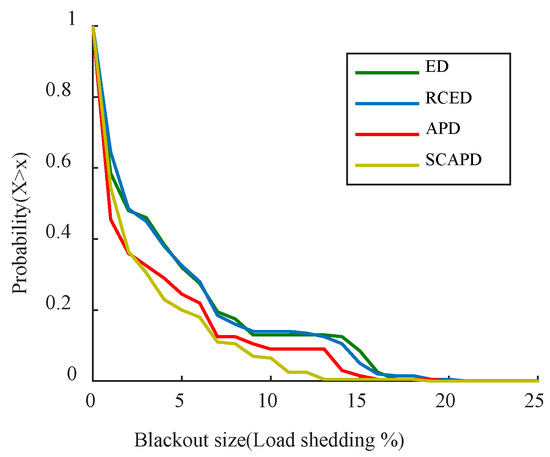
Figure 3.
Probability distribution curves of blackout sizes for different models tested on the IEEE 30-bus system.
Table 3.
Simulation results of cascading failure blackouts for different models tested on the IEEE 30-bus system.
As shown in Figure 3, the proposed augmented power dispatch model with controllable series compensation devices (APD) has a better blackout size distribution than the classical ED and RCED; this result is consistent with the discussion in Case 1 and Case 2. SCAPD is the most resilient strategy among all models due to the consideration of N-1 and the proposed N-1-1 security constraints. Table 3 shows the detailed results of all cascade failure simulations. It can be seen that the average outage lines caused by extreme weather events at the initial trigger (the fifth column) are similar for all four models. This indicates that the different blackout sizes between models are not caused by the initial outage, but by subsequent cascading outages. The sixth column of Table 3 shows the average overload failure lines per simulation for the different models. The ED and RCED models have relatively more overload failures due to weaker power flow distribution conditions. The SCAPD produces the least overload failures. The average load shedding for SCAPD is only 2.57%, which is about 40% less compared to the results for ED and RCED. The probability of outage size exceeding 15% in the SCAPD model is very rare, at 0.005. From these simulation results, it can be seen that the proposed model gives a more secure power dispatch solution that is more resilient in extreme events.
Overall, power flow distribution conditions have a significant impact on the operational security of the system. The fewer highly loaded lines in a system, the lower the probability of overload cascading failures, thus making the system more resilient to extreme events. Considering the security constraints of the disruptive N-1-1 contingency cases in the prevention strategy contributes to the resilience of the power system under extreme weather conditions.
3.2. IEEE 118-Bus and Polish 2383-Bus Systems
Detailed data for the IEEE 118-bus test system are in Appendix A. For the model considering power flow-related objectives, the coefficients of the different objective terms are set as, , , and , depending on the order of magnitude of the different objective terms. It is assumed that lines 1 to 90 are affected by extreme weather events. Assuming that all lines are equipped with controllable compensation devices, and the maximum adjusted value of line susceptibility is set to 90% of the initial value. The limit of the contingency is set to 120% of the steady-state operating limit. Data for the Polish 2383-bus test system are MATPOWER “case2383wp”. It is assumed that lines 300 to 500 are affected by extreme weather events. Lines 1 to 100 are equipped with controllable compensation devices and the maximum adjusted value of line susceptibility is set to 20% of the initial value. The coefficients of the different objective terms are set as, , and . All cases were tested in MATLAB 2016a, using the Gurobi solver, on a PC with a 3.20 GHz i5 processor and 8 GB of RAM. Table 4 shows the results of the iterative contingency filtering process of the SCAPD model tested in the IEEE 118-bus system. Table 5 shows the results of the iterative contingency filtering process of the SCAPD model tested in the Polish 2383-bus system. Total iterations and computation time for solving SCAPD in different test systems are demonstrated in Table 6.
Table 4.
Results of the iterative contingency filtering process of the SCAPD model tested on the IEEE 118-bus system.
Table 5.
Results of the iterative contingency filtering process of the SCAPD model tested on the Polish 2383-bus system.
Table 6.
Total iterations and computation time for solving SCAPD in different test systems.
As shown in Table 4 and Table 5, as the number of iterations increases, the number of N-1 and N-1-1 violations decreases. Case studies on the IEEE 118-bus system converge after three iterations. Case studies on the Polish 2383-bus system converge after four iterations. Table 6 summarizes the total iteration and computation time for the three test systems used in the paper. It can be seen that with the increase of the system size, the computation time increases. However, the largest computation time is still within the acceptable range. These results illustrate the computational efficiency of the proposed two-stage and iterative contingency filtering solution techniques.
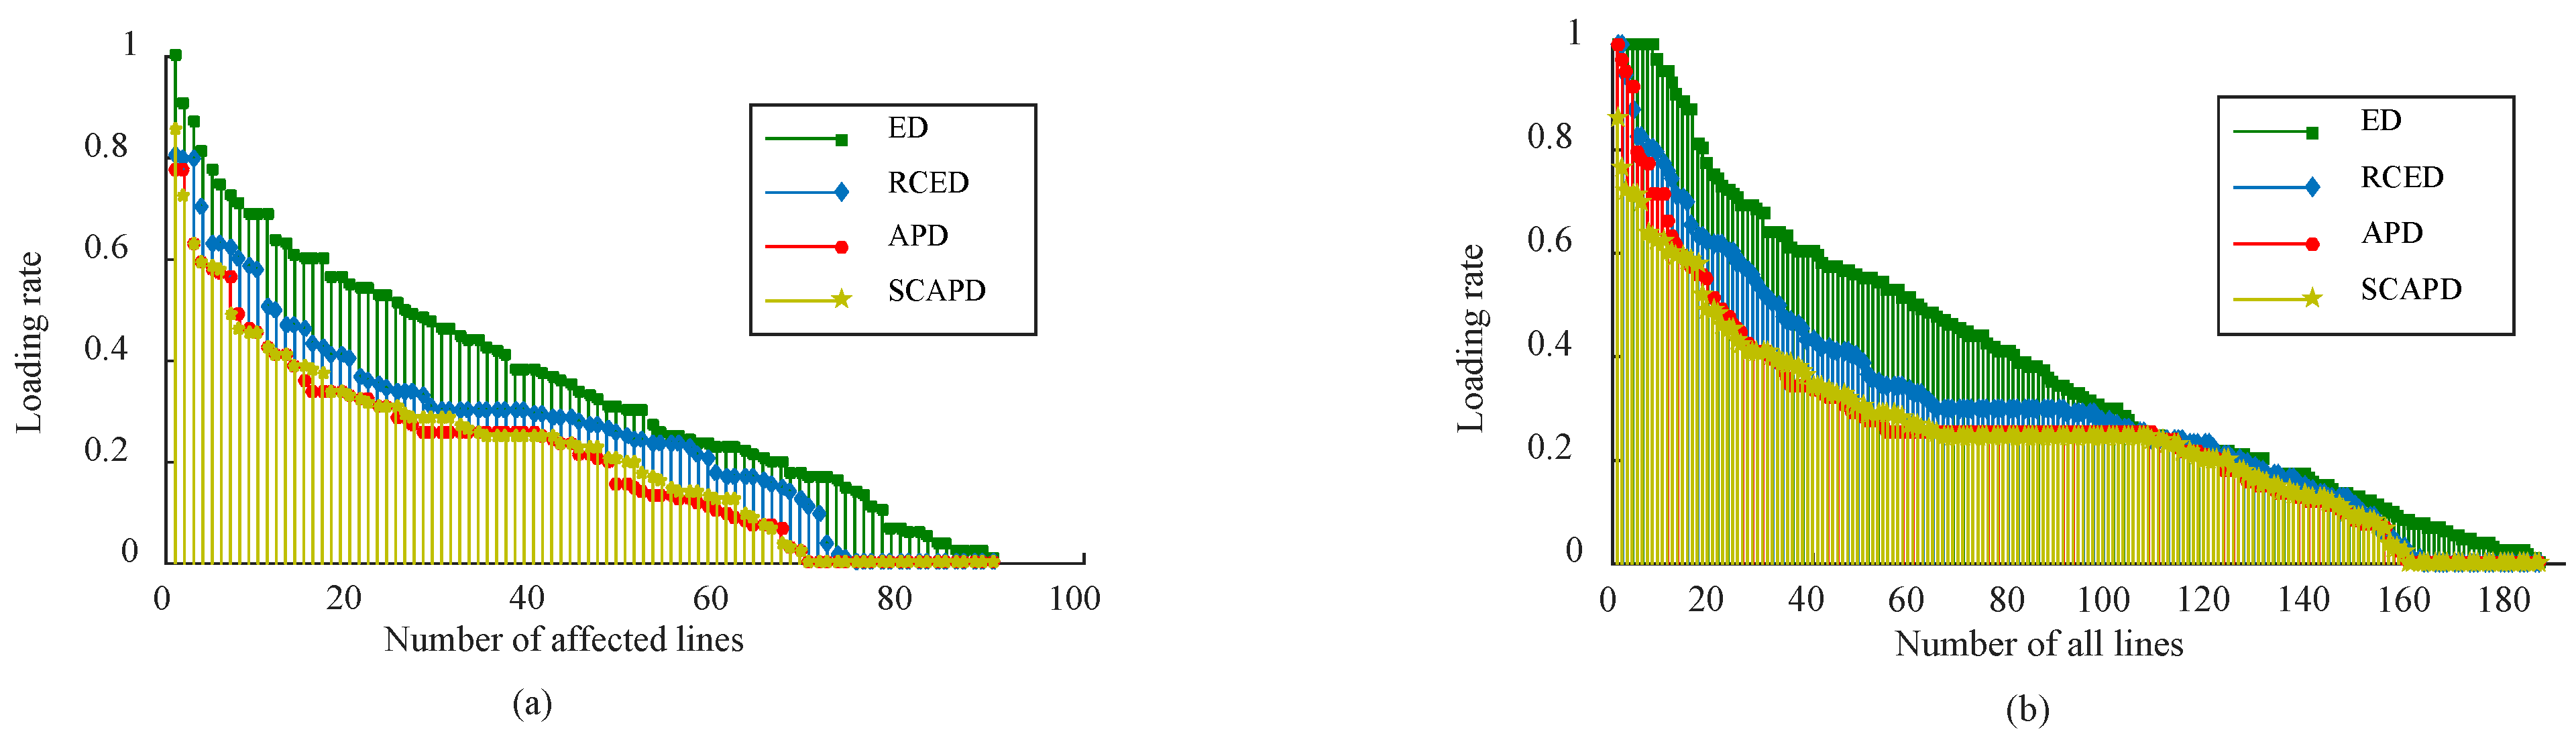
As for the effectiveness of the proposed power dispatch model, we will discuss the results of case studies for different power dispatch models in the IEEE 118-bus system in detail. Figure 4a,b show the loading rates of the lines affected by extreme weather events and all lines in the four models mentioned above. Figure 5 shows the probability distribution curves of blackout sizes obtained from 1000 cascading blackout simulations. The detailed generation cost, power flow distribution index, and cascading outage simulation results are shown in Table 7.

Figure 4.
Loading rates for (a) lines affected by extreme weather and (b) all lines ranked from highest to lowest of the IEEE 118-bus system.
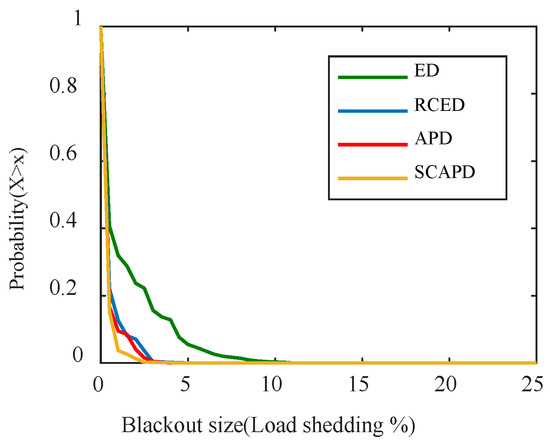
Figure 5.
Probability distribution curves of blackout sizes for different models tested on the IEEE 118-bus system.
Table 7.
Pre-contingency and post-contingency power flow distribution indices and cascade blackout simulation results for different models tested on the IEEE 118-bus system.
As shown in Figure 4a,b, in the study conducted for the IEEE 118-bus system, as with the IEEE 30-bus system, the loading rates of the affected lines in APD and SCAPD are lower than in the other models because of the objective one. The loading rates of all lines in APD and SCAPD are also smoother than the other models because of objective two. As can be seen in Table 7, the average loading rate in SCAPD is very small; no lines operate on the operating limit. The number of heavily loaded lines is only one-third of that of ED; this indicates that the joint control of generators and controllable compensation devices in collaboration with objectives one and two can reduce the overall loading rate of the transmission system.
For security and resilience performance, it can be seen from Table 7 that the classical ED model has 44 violations in the N-1 contingency analysis, while the proposed APD model only has 10. The classical ED model has 535 N-1-1 contingency cases, and these contingency cases would result in 719 violations. However, APD has only 57 potential N-1-1 contingencies, which is much smaller than ED. SCAPD has no violations in both N-1 and N-1-1 contingency analysis. The power system would operate more safely with a smaller number of violations. Figure 5 shows the probability distribution curves of outage sizes obtained from the 1000 cascading outage simulations.
As shown in Figure 5, the probability distribution curves of APD and SCAPD are much better than that of ED because of the lower loading rate. SCAPD gives the most resilient strategy among all models due to the consideration of N-1 and the proposed N-1-1 security constraints. The maximum load shedding percentage is only 3.86%, which is about 60% lower compared to ED. The average number of overload and hidden failure lines in each simulation is only 1.57 compared to 9.35 in ED. This indicates that security constraints of the N-1 and N-1-1 contingency cases effectively prevent the propagation of initial outages caused by extreme weather events. In summary, the proposed objective function and the adjustment of the transmission line reactance by a controllable series compensation device help to improve the power flow distribution. By considering the proposed N-1-1 security criteria and contingency assessment process, the power system operation scheme is more resilient to extreme weather events. The proposed model and solution methodology can be effectively applied to large-scale power systems.
4. Discussions
This paper proposes an augmented power dispatch model that takes into account controllable series compensation devices and disruptive N-1-1 contingency security constraints to provide a resilient operating scheme for power system operators to mitigate damage from extreme events.
Compared with the conventional economic dispatch model that only considers generation cost as the optimization objective, the proposed augmented power dispatch model aims to optimize the power flow distribution in the transmission system to reduce the loading rate of the transmission lines. Compared with the resilience-constrained economic dispatch proposed by [24], the adjustment of transmission line reactance by controllable series compensation devices is considered in this paper. Figure 2 and Figure 4 demonstrate the loading rate distribution of the above models in the two test systems. Table 1 and Table 7 show the comparison of operation cost and power flow distribution indices of these models. It can be seen that the average loading rate of the proposed model is smaller than the other two models and the number of heavy loading lines is reduced in the proposed model. The power dispatch model considering the defined N-1-1 and N-1 security constraints is compared with the model considering only the conventional N-1 security constraints. Table 2 shows the comparison of the pre-contingency and post-contingency power flow distributions for these models. The results indicate that the proposed N-1-1 security constraints have an impact on mitigating the further propagation of N-1 contingency cases and reducing the risk of overload cascade failures. However, it can be imagined that the considered security constraints cannot ensure the safe operation of the system for high order contingency cases. This is one of the reasons that the objective for power flow improvement is considered in the optimization model, which makes the proposed model much different from the existing related studies. Figure 3 and Figure 5 show the probability distribution curves of the blackout sizes for different models, which reflect the reliability and resilience performances of the models. Table 3 shows simulation results of cascading failure blackouts for different models tested on the IEEE 30-bus system. From the simulation results, it can be seen that the proposed model gives a more secure power dispatch solution that is more resilient in extreme events. Table 4 shows the results of the iterative contingency filtering process of the SCAPD model tested in the IEEE 118-bus system. Table 5 shows the results of the iterative contingency filtering process of the SCAPD model tested in the Polish 2383-bus system. Table 6 shows the total iterations and computation time for solving SCAPD in different test systems. These results illustrate the computational efficiency of the proposed two-stage and iterative contingency filtering solution techniques.
In future work, AC power flow models are considered to obtain more practical solutions for power system operators. Renewable energy and energy storage systems will also be considered to increase the application of the model.
5. Conclusions
In this paper, an augmented power dispatch model is proposed to provide a resilient operating scheme for power system operators to mitigate damage from extreme events. The major findings are summarized below:
- By controlling series compensation devices to adjust the impedance of transmission lines, the proposed augmented power dispatch model can avoid some lines from taking excessive loads, especially those lines affected by extreme weather events.
- The reduction of power flow on lines can reduce the possibility of overload cascade faults, thus reducing load shedding under extreme weather events and improving the resilience of the power system.
- The proposed N-1-1 security criteria have an impact on mitigating the further propagation of N-1 contingency cases and reducing the risk of overload cascade failures.
- The proposed iterative contingency assessment process enables us to solve the security-constrained power dispatch problem iteratively, reducing the problem size and computation time.
Author Contributions
L.L.L., C.S.L. and G.Y. guided the framework of the paper and provided professional guidance. L.H. did the simulation and wrote the paper. Z.H., Z.Z., N.T. and X.W. provided academic assistance and revised the manuscript. All authors have read and agreed to the published version of the manuscript.
Funding
This work was supported by the Education Department of Guangdong Province: New and Integrated Energy System Theory and Technology Research Group [Project Number 2016KCXTD022]; National Natural Science Foundation of China (51907031); Brunel University London BRIEF Funding.
Institutional Review Board Statement
Not applicable.
Informed Consent Statement
Not applicable.
Data Availability Statement
The data presented in this study are available on request from the author: Liping Huang (e-mail address: 2111604002@mail2.gdut.edu.cn).
Conflicts of Interest
The authors declare no conflict of interest.
Appendix A
The system data of the modified IEEE 30-bus and 118-bus test systems used in the paper is shown in Table A1, Table A2, Table A3, Table A4, Table A5, Table A6.
Table A1.
Generator data of the modified IEEE 30-bus system.
Table A1.
Generator data of the modified IEEE 30-bus system.
| U | Bus No. | Unit Cost Coefficients | Pmax (MW) | Pmin (MW) | ||
|---|---|---|---|---|---|---|
| a (MBtu) | b (MBtu/MW) | c (MBtu/MW2) | ||||
| G1 | 1 | 0 | 2.0000 | 0.0200 | 120 | 0 |
| G2 | 2 | 0 | 1.7500 | 0.0175 | 120 | 0 |
| G3 | 22 | 0 | 1.0000 | 0.0625 | 75 | 0 |
| G4 | 27 | 0 | 3.2500 | 0.0083 | 82.5 | 0 |
| G5 | 23 | 0 | 3.0000 | 0.0250 | 45 | 0 |
| G6 | 13 | 0 | 3.0000 | 0.0250 | 60 | 0 |
Table A2.
Bus data of the modified IEEE 30-bus system.
Table A2.
Bus data of the modified IEEE 30-bus system.
| Bus No. | d(MW) | Bus No. | d(MW) | Bus No. | d(MW) | Bus No. | d(MW) |
|---|---|---|---|---|---|---|---|
| 1 | 0 | 9 | 0 | 17 | 11.7 | 25 | 0 |
| 2 | 28.21 | 10 | 7.54 | 18 | 4.16 | 26 | 4.55 |
| 3 | 3.12 | 11 | 0 | 19 | 12.35 | 27 | 0 |
| 4 | 9.88 | 12 | 14.56 | 20 | 2.86 | 28 | 0 |
| 5 | 0 | 13 | 0 | 21 | 22.75 | 29 | 3.12 |
| 6 | 0 | 14 | 8.06 | 22 | 0 | 30 | 13.78 |
| 7 | 29.64 | 15 | 10.66 | 23 | 4.16 | ||
| 8 | 39 | 16 | 4.55 | 24 | 11.31 |
Table A3.
Line data of the modified IEEE 30-bus system.
Table A3.
Line data of the modified IEEE 30-bus system.
| Line No. | From Bus | To Bus | X (pu) | Flow Limit (MW) | Line No. | From Bus | To Bus | X (pu) | Flow Limit (MW) |
|---|---|---|---|---|---|---|---|---|---|
| 1 | 1 | 2 | 0.06 | 123.5 | 22 | 15 | 18 | 0.22 | 15.2 |
| 2 | 1 | 3 | 0.19 | 123.5 | 23 | 18 | 19 | 0.13 | 15.2 |
| 3 | 2 | 4 | 0.17 | 61.75 | 24 | 19 | 20 | 0.07 | 30.4 |
| 4 | 3 | 4 | 0.04 | 123.5 | 25 | 10 | 20 | 0.21 | 30.4 |
| 5 | 2 | 5 | 0.2 | 123.5 | 26 | 10 | 17 | 0.08 | 30.4 |
| 6 | 2 | 6 | 0.18 | 61.75 | 27 | 10 | 21 | 0.07 | 30.4 |
| 7 | 4 | 6 | 0.04 | 85.5 | 28 | 10 | 22 | 0.15 | 30.4 |
| 8 | 5 | 7 | 0.12 | 66.5 | 29 | 21 | 22 | 0.02 | 30.4 |
| 9 | 6 | 7 | 0.08 | 123.5 | 30 | 15 | 23 | 0.2 | 15.2 |
| 10 | 6 | 8 | 0.04 | 30.4 | 31 | 22 | 24 | 0.18 | 15.2 |
| 11 | 6 | 9 | 0.21 | 61.75 | 32 | 23 | 24 | 0.27 | 15.2 |
| 12 | 6 | 10 | 0.56 | 30.4 | 33 | 24 | 25 | 0.33 | 15.2 |
| 13 | 9 | 11 | 0.21 | 61.75 | 34 | 25 | 26 | 0.38 | 15.2 |
| 14 | 9 | 10 | 0.11 | 61.75 | 35 | 25 | 27 | 0.21 | 15.2 |
| 15 | 4 | 12 | 0.26 | 61.75 | 36 | 28 | 27 | 0.4 | 61.75 |
| 16 | 12 | 13 | 0.14 | 61.75 | 37 | 27 | 29 | 0.42 | 15.2 |
| 17 | 12 | 14 | 0.26 | 30.4 | 38 | 27 | 30 | 0.6 | 15.2 |
| 18 | 12 | 15 | 0.13 | 30.4 | 39 | 29 | 30 | 0.45 | 15.2 |
| 19 | 12 | 16 | 0.2 | 30.4 | 40 | 8 | 28 | 0.2 | 30.4 |
| 20 | 14 | 15 | 0.2 | 15.2 | 41 | 6 | 28 | 0.06 | 30.4 |
| 21 | 16 | 17 | 0.19 | 15.2 |
Table A4.
Generator data of the modified IEEE 118-bus system.
Table A4.
Generator data of the modified IEEE 118-bus system.
| Unit | Bus No. | Unit Cost Coefficients | Pmax (MW) | Pmin (MW) | U | Bus No. | Unit Cost Coefficients | Pmax (MW) | Pmin (MW) | ||||
|---|---|---|---|---|---|---|---|---|---|---|---|---|---|
| a (MBtu) | b (MBtu/MW) | c (MBtu/MW2) | a (MBtu) | b (MBtu/MW) | c (MBtu/MW2) | ||||||||
| 1 | 1 | 0 | 40 | 0.010 | 300 | 0 | 28 | 65 | 0 | 20 | 0.026 | 1473 | 0 |
| 2 | 4 | 0 | 40 | 0.010 | 300 | 0 | 29 | 66 | 0 | 20 | 0.026 | 1476 | 0 |
| 3 | 6 | 0 | 40 | 0.010 | 300 | 0 | 30 | 69 | 0 | 20 | 0.019 | 2415.6 | 0 |
| 4 | 8 | 0 | 40 | 0.010 | 300 | 0 | 31 | 70 | 0 | 40 | 0.010 | 300 | 0 |
| 5 | 10 | 0 | 20 | 0.022 | 1650 | 0 | 32 | 72 | 0 | 40 | 0.010 | 300 | 0 |
| 6 | 12 | 0 | 20 | 0.118 | 555 | 0 | 33 | 73 | 0 | 40 | 0.010 | 300 | 0 |
| 7 | 15 | 0 | 40 | 0.010 | 300 | 0 | 34 | 74 | 0 | 40 | 0.010 | 300 | 0 |
| 8 | 18 | 0 | 40 | 0.010 | 300 | 0 | 35 | 76 | 0 | 40 | 0.010 | 300 | 0 |
| 9 | 19 | 0 | 40 | 0.010 | 300 | 0 | 36 | 77 | 0 | 40 | 0.010 | 300 | 0 |
| 10 | 24 | 0 | 40 | 0.010 | 300 | 0 | 37 | 80 | 0 | 20 | 0.021 | 1731 | 0 |
| 11 | 25 | 0 | 20 | 0.045 | 960 | 0 | 38 | 85 | 0 | 40 | 0.010 | 300 | 0 |
| 12 | 26 | 0 | 20 | 0.032 | 1242 | 0 | 39 | 87 | 0 | 20 | 2.500 | 312 | 0 |
| 13 | 27 | 0 | 40 | 0.010 | 300 | 0 | 40 | 89 | 0 | 20 | 0.016 | 2121 | 0 |
| 14 | 31 | 0 | 20 | 1.429 | 321 | 0 | 41 | 90 | 0 | 40 | 0.010 | 300 | 0 |
| 15 | 32 | 0 | 40 | 0.010 | 300 | 0 | 42 | 91 | 0 | 40 | 0.010 | 300 | 0 |
| 16 | 34 | 0 | 40 | 0.010 | 300 | 0 | 43 | 92 | 0 | 40 | 0.010 | 300 | 0 |
| 17 | 36 | 0 | 40 | 0.010 | 300 | 0 | 44 | 99 | 0 | 40 | 0.010 | 300 | 0 |
| 18 | 40 | 0 | 40 | 0.010 | 300 | 0 | 45 | 100 | 0 | 20 | 0.040 | 1056 | 0 |
| 19 | 42 | 0 | 40 | 0.010 | 300 | 0 | 46 | 103 | 0 | 20 | 0.250 | 420 | 0 |
| 20 | 46 | 0 | 20 | 0.526 | 357 | 0 | 47 | 104 | 0 | 40 | 0.010 | 300 | 0 |
| 21 | 49 | 0 | 20 | 0.049 | 912 | 0 | 48 | 105 | 0 | 40 | 0.010 | 300 | 0 |
| 22 | 54 | 0 | 20 | 0.208 | 444 | 0 | 49 | 107 | 0 | 40 | 0.010 | 300 | 0 |
| 23 | 55 | 0 | 40 | 0.010 | 300 | 0 | 50 | 110 | 0 | 40 | 0.010 | 300 | 0 |
| 24 | 56 | 0 | 40 | 0.010 | 300 | 0 | 51 | 111 | 0 | 20 | 0.278 | 408 | 0 |
| 25 | 59 | 0 | 20 | 0.065 | 765 | 0 | 52 | 112 | 0 | 40 | 0.010 | 300 | 0 |
| 26 | 61 | 0 | 20 | 0.063 | 780 | 0 | 53 | 113 | 0 | 40 | 0.010 | 300 | 0 |
| 27 | 62 | 0 | 40 | 0.010 | 300 | 0 | 54 | 116 | 0 | 40 | 0.010 | 300 | 0 |
Table A5.
Bus data of the modified IEEE 118-bus system.
Table A5.
Bus data of the modified IEEE 118-bus system.
| Bus No. | D (MW) | Bus No. | D (MW) | Bus No. | D (MW) | Bus No. | D (MW) |
|---|---|---|---|---|---|---|---|
| 1 | 153 | 31 | 129 | 61 | 0 | 91 | 30 |
| 2 | 60 | 32 | 177 | 62 | 231 | 92 | 195 |
| 3 | 117 | 33 | 69 | 63 | 0 | 93 | 36 |
| 4 | 117 | 34 | 177 | 64 | 0 | 94 | 90 |
| 5 | 0 | 35 | 99 | 65 | 0 | 95 | 126 |
| 6 | 156 | 36 | 93 | 66 | 117 | 96 | 114 |
| 7 | 57 | 37 | 0 | 67 | 84 | 97 | 45 |
| 8 | 84 | 38 | 0 | 68 | 0 | 98 | 102 |
| 9 | 0 | 39 | 81 | 69 | 0 | 99 | 126 |
| 10 | 0 | 40 | 198 | 70 | 198 | 100 | 111 |
| 11 | 210 | 41 | 111 | 71 | 0 | 101 | 66 |
| 12 | 141 | 42 | 288 | 72 | 36 | 102 | 15 |
| 13 | 102 | 43 | 54 | 73 | 18 | 103 | 69 |
| 14 | 42 | 44 | 48 | 74 | 204 | 104 | 114 |
| 15 | 270 | 45 | 159 | 75 | 141 | 105 | 93 |
| 16 | 75 | 46 | 84 | 76 | 204 | 106 | 129 |
| 17 | 33 | 47 | 102 | 77 | 183 | 107 | 150 |
| 18 | 180 | 48 | 60 | 78 | 213 | 108 | 6 |
| 19 | 135 | 49 | 261 | 79 | 117 | 109 | 24 |
| 20 | 54 | 50 | 51 | 80 | 390 | 110 | 117 |
| 21 | 42 | 51 | 51 | 81 | 0 | 111 | 0 |
| 22 | 30 | 52 | 54 | 82 | 162 | 112 | 204 |
| 23 | 21 | 53 | 69 | 83 | 60 | 113 | 18 |
| 24 | 39 | 54 | 339 | 84 | 33 | 114 | 24 |
| 25 | 0 | 55 | 189 | 85 | 72 | 115 | 66 |
| 26 | 0 | 56 | 252 | 86 | 63 | 116 | 552 |
| 27 | 213 | 57 | 36 | 87 | 0 | 117 | 60 |
| 28 | 51 | 58 | 36 | 88 | 144 | 118 | 99 |
| 29 | 72 | 59 | 831 | 89 | 0 | ||
| 30 | 0 | 60 | 234 | 90 | 489 |
Table A6.
Line data of the modified IEEE 118-bus system.
Table A6.
Line data of the modified IEEE 118-bus system.
| Line No. | From Bus | To Bus | X (pu) | Flow Limit (MW) | Line No. | From Bus | To Bus | X (pu) | Flow Limit (MW) |
|---|---|---|---|---|---|---|---|---|---|
| 1 | 1 | 2 | 0.0999 | 176 | 94 | 55 | 56 | 0.0151 | 176 |
| 2 | 1 | 3 | 0.0424 | 176 | 95 | 55 | 59 | 0.2158 | 176 |
| 3 | 2 | 12 | 0.0616 | 176 | 96 | 56 | 57 | 0.0966 | 176 |
| 4 | 3 | 5 | 0.108 | 176 | 97 | 56 | 58 | 0.0966 | 176 |
| 5 | 3 | 12 | 0.16 | 176 | 98 | 56 | 59 | 0.251 | 176 |
| 6 | 4 | 5 | 0.00798 | 352 | 99 | 56 | 59 | 0.239 | 176 |
| 7 | 4 | 11 | 0.0688 | 176 | 100 | 59 | 60 | 0.145 | 176 |
| 8 | 5 | 6 | 0.054 | 176 | 101 | 59 | 61 | 0.15 | 176 |
| 9 | 5 | 11 | 0.0682 | 176 | 102 | 60 | 61 | 0.0135 | 352 |
| 10 | 6 | 7 | 0.0208 | 176 | 103 | 60 | 62 | 0.0561 | 176 |
| 11 | 7 | 12 | 0.034 | 176 | 104 | 61 | 62 | 0.0376 | 176 |
| 12 | 8 | 9 | 0.0305 | 880 | 105 | 62 | 66 | 0.218 | 176 |
| 13 | 8 | 5 | 0.0267 | 704 | 106 | 62 | 67 | 0.117 | 176 |
| 14 | 8 | 30 | 0.0504 | 176 | 107 | 63 | 59 | 0.0386 | 352 |
| 15 | 9 | 10 | 0.0322 | 880 | 108 | 63 | 64 | 0.02 | 352 |
| 16 | 11 | 12 | 0.0196 | 176 | 109 | 64 | 61 | 0.0268 | 176 |
| 17 | 11 | 13 | 0.0731 | 176 | 110 | 64 | 65 | 0.0302 | 352 |
| 18 | 12 | 15 | 0.0707 | 176 | 111 | 65 | 66 | 0.037 | 176 |
| 19 | 12 | 17 | 0.0834 | 176 | 112 | 65 | 68 | 0.016 | 176 |
| 20 | 12 | 117 | 0.14 | 176 | 113 | 66 | 67 | 0.1015 | 176 |
| 21 | 13 | 15 | 0.2444 | 176 | 114 | 68 | 69 | 0.037 | 352 |
| 22 | 14 | 15 | 0.195 | 176 | 115 | 68 | 81 | 0.0202 | 176 |
| 23 | 15 | 17 | 0.0437 | 352 | 116 | 68 | 116 | 0.00405 | 352 |
| 24 | 15 | 19 | 0.0394 | 176 | 117 | 69 | 70 | 0.127 | 352 |
| 25 | 15 | 33 | 0.1244 | 176 | 118 | 69 | 75 | 0.122 | 352 |
| 26 | 16 | 17 | 0.1801 | 176 | 119 | 69 | 77 | 0.101 | 176 |
| 27 | 17 | 19 | 0.0505 | 176 | 120 | 70 | 71 | 0.0355 | 176 |
| 28 | 17 | 31 | 0.1563 | 176 | 121 | 70 | 74 | 0.1323 | 176 |
| 29 | 17 | 113 | 0.0301 | 176 | 122 | 70 | 75 | 0.141 | 176 |
| 30 | 18 | 19 | 0.0493 | 176 | 123 | 71 | 72 | 0.18 | 176 |
| 31 | 19 | 20 | 0.117 | 176 | 124 | 71 | 73 | 0.0454 | 176 |
| 32 | 19 | 34 | 0.247 | 176 | 125 | 74 | 75 | 0.0406 | 176 |
| 33 | 20 | 21 | 0.0849 | 176 | 126 | 75 | 77 | 0.1999 | 176 |
| 34 | 21 | 22 | 0.097 | 176 | 127 | 75 | 118 | 0.0481 | 176 |
| 35 | 22 | 23 | 0.159 | 176 | 128 | 76 | 77 | 0.148 | 176 |
| 36 | 23 | 24 | 0.0492 | 176 | 129 | 76 | 118 | 0.0544 | 176 |
| 37 | 23 | 25 | 0.08 | 352 | 130 | 77 | 78 | 0.0124 | 176 |
| 38 | 23 | 32 | 0.1153 | 176 | 131 | 77 | 80 | 0.0485 | 352 |
| 39 | 24 | 70 | 0.4115 | 176 | 132 | 77 | 80 | 0.105 | 176 |
| 40 | 24 | 72 | 0.196 | 176 | 133 | 77 | 82 | 0.0853 | 176 |
| 41 | 25 | 27 | 0.163 | 352 | 134 | 78 | 79 | 0.0244 | 176 |
| 42 | 26 | 25 | 0.0382 | 176 | 135 | 79 | 80 | 0.0704 | 176 |
| 43 | 26 | 30 | 0.086 | 528 | 136 | 80 | 96 | 0.182 | 176 |
| 44 | 27 | 28 | 0.0855 | 176 | 137 | 80 | 97 | 0.0934 | 176 |
| 45 | 27 | 32 | 0.0755 | 176 | 138 | 80 | 98 | 0.108 | 176 |
| 46 | 27 | 115 | 0.0741 | 176 | 139 | 80 | 99 | 0.206 | 176 |
| 47 | 28 | 31 | 0.0943 | 176 | 140 | 81 | 80 | 0.037 | 176 |
| 48 | 29 | 31 | 0.0331 | 176 | 141 | 82 | 83 | 0.03665 | 176 |
| 49 | 30 | 17 | 0.0388 | 528 | 142 | 82 | 96 | 0.053 | 176 |
| 50 | 30 | 38 | 0.054 | 176 | 143 | 83 | 84 | 0.132 | 176 |
| 51 | 31 | 32 | 0.0985 | 176 | 144 | 83 | 85 | 0.148 | 176 |
| 52 | 32 | 113 | 0.203 | 176 | 145 | 84 | 85 | 0.0641 | 176 |
| 53 | 32 | 114 | 0.0612 | 176 | 146 | 85 | 86 | 0.123 | 176 |
| 54 | 33 | 37 | 0.142 | 176 | 147 | 85 | 88 | 0.102 | 176 |
| 55 | 34 | 36 | 0.0268 | 176 | 148 | 85 | 89 | 0.173 | 176 |
| 56 | 34 | 37 | 0.0094 | 352 | 149 | 86 | 87 | 0.2074 | 176 |
| 57 | 34 | 43 | 0.1681 | 176 | 150 | 88 | 89 | 0.0712 | 352 |
| 58 | 35 | 36 | 0.0102 | 176 | 151 | 89 | 90 | 0.032 | 528 |
| 59 | 35 | 37 | 0.0497 | 176 | 152 | 89 | 91 | 0.032 | 176 |
| 60 | 37 | 39 | 0.106 | 176 | 153 | 89 | 92 | 0.0505 | 176 |
| 61 | 37 | 40 | 0.168 | 176 | 154 | 90 | 91 | 0.0505 | 528 |
| 62 | 38 | 37 | 0.0375 | 528 | 155 | 91 | 92 | 0.1272 | 176 |
| 63 | 38 | 65 | 0.0986 | 352 | 156 | 92 | 93 | 0.032 | 176 |
| 64 | 39 | 40 | 0.0605 | 176 | 157 | 92 | 94 | 0.158 | 176 |
| 65 | 40 | 41 | 0.0487 | 176 | 158 | 92 | 100 | 0.295 | 176 |
| 66 | 40 | 42 | 0.183 | 176 | 159 | 92 | 102 | 0.0559 | 176 |
| 67 | 41 | 42 | 0.135 | 176 | 160 | 93 | 94 | 0.0732 | 176 |
| 68 | 42 | 49 | 0.323 | 176 | 161 | 94 | 95 | 0.0434 | 176 |
| 69 | 42 | 49 | 0.323 | 176 | 162 | 94 | 96 | 0.0869 | 176 |
| 70 | 43 | 44 | 0.2454 | 176 | 163 | 94 | 100 | 0.058 | 176 |
| 71 | 44 | 45 | 0.0901 | 176 | 164 | 95 | 96 | 0.0547 | 176 |
| 72 | 45 | 46 | 0.1356 | 176 | 165 | 96 | 97 | 0.0885 | 176 |
| 73 | 45 | 49 | 0.186 | 176 | 166 | 98 | 100 | 0.179 | 176 |
| 74 | 46 | 47 | 0.127 | 176 | 167 | 99 | 100 | 0.0813 | 176 |
| 75 | 46 | 48 | 0.189 | 176 | 168 | 100 | 101 | 0.1262 | 176 |
| 76 | 47 | 49 | 0.0625 | 176 | 169 | 100 | 103 | 0.0525 | 352 |
| 77 | 47 | 69 | 0.2778 | 176 | 170 | 100 | 104 | 0.204 | 176 |
| 78 | 48 | 49 | 0.0505 | 176 | 171 | 100 | 106 | 0.229 | 176 |
| 79 | 49 | 50 | 0.0752 | 176 | 172 | 101 | 102 | 0.112 | 176 |
| 80 | 49 | 51 | 0.137 | 176 | 173 | 103 | 104 | 0.1584 | 176 |
| 81 | 49 | 54 | 0.289 | 176 | 174 | 103 | 105 | 0.1625 | 176 |
| 82 | 49 | 54 | 0.291 | 176 | 175 | 103 | 110 | 0.1813 | 176 |
| 83 | 49 | 66 | 0.0919 | 352 | 176 | 104 | 105 | 0.0378 | 176 |
| 84 | 49 | 66 | 0.0919 | 352 | 177 | 105 | 106 | 0.0547 | 176 |
| 85 | 49 | 69 | 0.324 | 176 | 178 | 105 | 107 | 0.183 | 176 |
| 86 | 50 | 57 | 0.134 | 176 | 179 | 105 | 108 | 0.0703 | 176 |
| 87 | 51 | 52 | 0.0588 | 176 | 180 | 106 | 107 | 0.183 | 176 |
| 88 | 51 | 58 | 0.0719 | 176 | 181 | 108 | 109 | 0.0288 | 176 |
| 89 | 52 | 53 | 0.1635 | 176 | 182 | 109 | 110 | 0.0762 | 176 |
| 90 | 53 | 54 | 0.122 | 176 | 183 | 110 | 111 | 0.0755 | 176 |
| 91 | 54 | 55 | 0.0707 | 176 | 184 | 110 | 112 | 0.064 | 176 |
| 92 | 54 | 56 | 0.00955 | 176 | 185 | 114 | 115 | 0.0104 | 176 |
| 93 | 54 | 59 | 0.2293 | 176 |
References
- Jufri, F.; Widiputra, V.; Jung, J. State-of-the-art review on power grid resilience to extreme weather events: Definitions, frameworks, quantitative assessment methodologies, and enhancement strategies. Appl. Energy 2019, 239, 1049–1065. [Google Scholar] [CrossRef]
- Vaccaro, A.; Pisica, I.; Lai, L.L.; Zobaa, A.F. A review of enabling methodologies for information processing in smart grids. Int. J. Electr. Power Energy Syst. 2019, 107, 516–522. [Google Scholar] [CrossRef]
- Lai, C.S.; Jia, Y.; Dong, Z.; Wang, D.; Tao, Y.; Lai, Q.H.; Wong, R.T.K.; Zobaa, A.F.; Wu, R.; Lai, L.L. A review of technical standards for smart cities. Clean Technol. 2020, 2, 19. [Google Scholar] [CrossRef]
- Bie, Z.; Lin, Y.; Li, G.; Li, F. Battling the extreme: A study on the power system resilience. Proc. IEEE 2017, 105, 1253–1266. [Google Scholar] [CrossRef]
- Xu, Z.; Lai, L.L.; Wong K., P.; Pinson, P.; Li, F.X. Guest editorial-special section on emerging informatics for risk hedging and decision making in smart grids. IEEE Trans. Ind. Inform. 2017, 13, 2507–2510. [Google Scholar] [CrossRef]
- Panteli, M.; Mancarella, P. The grid: Stronger, bigger, and smarter? Presenting a conceptual framework of power system resilience. IEEE Power Energy Mag. 2015, 13, 58–66. [Google Scholar] [CrossRef]
- Zhang, G.; Zhang, F.; Zhang, X.; Wu, Q.; Ke, M. A multi-disaster-scenario distributionally robust planning model for enhancing the resilience of distribution systems. Int. J. Electr. Power Energy Syst. 2020, 122, 106161. [Google Scholar] [CrossRef]
- Pepiciello, A.; Vaccaro, A.; Lai, L.L. An interval mathematic-based methodology for reliable resilience analysis of power systems in the presence of data uncertainties. Energies 2020, 13, 6632. [Google Scholar] [CrossRef]
- Tari, A.N.; Sepasian, M.S.; Kenari, M.T. Resilience assessment and improvement of distribution networks against extreme weather events. Int. J. Electr. Power Energy Syst. 2021, 125, 106414. [Google Scholar] [CrossRef]
- Panteli, M.; Trakas, D.N.; Mancarella, P.; Hatziargyriou, N.D. Power systems resilience assessment: Hardening and smart operational enhancement strategies. Proc. IEEE 2017, 105, 1202–1213. [Google Scholar] [CrossRef] [Green Version]
- Mahzarnia, M.; Moghaddam, M.P.; Baboli, P.T.; Siano, P. A review of the measures to enhance power systems resilience. IEEE Syst. J. 2020, 14, 4059–4070. [Google Scholar] [CrossRef]
- Arab, A.; Khodaei, A.; Khator, S.K.; Ding, K.; Emesih, V.A.; Han, Z. Stochastic pre-hurricane restoration planning for electric power systems infrastructure. IEEE Trans. Smart Grid 2015, 6, 1046–1054. [Google Scholar] [CrossRef]
- Eskandarpour, R.; Edwards, G.; Khodaei, A. Resilience-constrained unit commitment considering the impact of microgrids. In Proceedings of the 2016 North American Power Symposium (NAPS), Denver, CO, USA, 18–20 September 2016; pp. 1–5. [Google Scholar]
- Xie, C.; Wang, D.; Lai, C.S.; Wu, R.; Wu, X.; Lai, L.L. Optimal sizing of battery energy storage system in smart microgrid considering virtual energy storage system and high photovoltaic penetration. J. Clean. Prod. 2021, 281, 125308. [Google Scholar] [CrossRef]
- Sahraei-Ardakani, M.; Ou, G. Day-ahead preventive scheduling of power systems during natural hazards via stochastic optimization. In Proceedings of the 2017 IEEE Power & Energy Society General Meeting, Chicago, IL, USA, 16–20 July 2017; p. 1. [Google Scholar]
- Khaloie, H.; Vallee, F.; Lai, C.S.; Toubeau, J.F.; Hatziargyriou, N.D. Day-ahead and intraday dispatch of an integrated biomass-concentrated solar system: A multi-objective risk-controlling approach. IEEE Trans. Power Syst. 2021. [Google Scholar] [CrossRef]
- Wang, C.; Hou, Y.; Qiu, F.; Lei, S.; Liu, K. Resilience enhancement with sequentially proactive operation strategies. IEEE Trans. Power Syst. 2017, 32, 2847–2857. [Google Scholar] [CrossRef] [Green Version]
- Wang, Y.; Huang, L.; Shahidehpour, M.; Lai, L.L.; Yuan, H.; Xu, F.Y. Resilience-constrained hourly unit commitment in electricity grids. IEEE Trans. Power Syst. 2018, 33, 5604–5614. [Google Scholar] [CrossRef]
- Trakas, D.N.; Hatziargyriou, N.D. Resilience constrained day-ahead unit commitment under extreme weather events. IEEE Trans. Power Syst. 2020, 35, 1242–1253. [Google Scholar] [CrossRef]
- Jie, C.; Thorp, J.S.; Dobson, I. Cascading dynamics and mitigation assessment in power system disturbances via a hidden failure model. Int. J. Electr. Power Energy Syst. 2005, 27, 318–326. [Google Scholar]
- Tejada-Arango, D.A.; Sánchez-Martın, P.; Ramos, A. Security constrained unit commitment using line outage distribution factors. IEEE Trans. Power Syst. 2018, 33, 329–337. [Google Scholar] [CrossRef]
- Bao, Z.J.; Cao, Y.J.; Wang, G.Z.; Ding, L.J. Analysis of cascading failure in electric grid based on power flow entropy. Phys. Lett. A 2009, 373, 3032–3040. [Google Scholar] [CrossRef]
- Zhang, S.; Liu, C.C.; Gu, X.; Wang, T. Optimal transmission line switching incorporating dynamic line ratings. In Proceedings of the 2017 IEEE PES Innovative Smart Grid Technologies Conference Europe (ISGT-Europe), Torino, Italy, 26–29 September 2017; pp. 1–5. [Google Scholar]
- Wang, Y.; Huang, L.; Shahidehpour, M.; Lai, L.L.; Zhou, Y. Impact of cascading and common-cause outages on resilience-constrained optimal economic operation of power systems. IEEE Trans. Smart Grid 2020, 11, 590–601. [Google Scholar] [CrossRef]
- Ding, T.; Bo, R.; Li, F.; Sun, H. Optimal power flow with the consideration of flexible transmission line impedance. IEEE Trans. Power Syst. 2016, 31, 1655–1656. [Google Scholar] [CrossRef]
- Singh, A.K.; Pal, B.C. Dynamic Estimation and Control of Power Systems; Academic Press: Cambridge, MA, USA, 2018; p. 5. [Google Scholar]
- Sahraei-Ardakani, M.; Hedman, K.W. Day-ahead corrective adjustment of FACTS reactance: A linear programming approach. IEEE Trans. Power Syst. 2016, 31, 2867–2875. [Google Scholar] [CrossRef]
- Sahraei-Ardakani, M.; Hedman, K.W. Computationally efficient adjustment of FACTS set points in DC optimal power flow with shift factor structure. IEEE Trans. Power Syst. 2017, 32, 1733–1740. [Google Scholar] [CrossRef]
- Jia, Y.; Xu, Z.; Lai, L.L.; Wong, K.P. Risk-based power system security analysis considering cascading outages. IEEE Trans. Ind. Informat. 2016, 12, 872–882. [Google Scholar] [CrossRef]
- Lai, L.L.; Ma, J.T.; Yokoyama, R.; Zhao, M. Improved genetic algorithms for optimal power flow under both normal & contingent operation states. Int. J. Electr. Power Energy Syst. 1997, 19, 287–292. [Google Scholar]
- Liu, M.; Gross, G. Role of distribution factors in congestion revenue rights applications. IEEE Trans. Power Syst. 2004, 19, 802–810. [Google Scholar] [CrossRef]
- Guo, J.; Fu, Y.; Li, Z.; Shahidehpour, M. Direct calculation of line outage distribution factors. IEEE Trans. Power Syst. 2009, 24, 1633–1634. [Google Scholar]
- Guler, T.; Gross, G.; Liu, M. Generalized line outage distribution factors. IEEE Trans. Power Syst. 2007, 22, 879–881. [Google Scholar] [CrossRef]
- Fu, Y.; Shahidehpour, M.; Li, Z. AC contingency dispatch based on security-constrained unit commitment. IEEE Trans. Power Syst. 2006, 21, 897–908. [Google Scholar] [CrossRef]
- Salim, N.A.; Othman, M.M.; Musirin, I.; Serwan, M.S. Cascading collapse assessment considering hidden failure. In Proceedings of the 1st Int Conf Informatics Comput Intell ICI 2011, Bandung, Indonesia, 12–14 December 2011; pp. 318–323. [Google Scholar]

Publisher’s Note: MDPI stays neutral with regard to jurisdictional claims in published maps and institutional affiliations. |
© 2021 by the authors. Licensee MDPI, Basel, Switzerland. This article is an open access article distributed under the terms and conditions of the Creative Commons Attribution (CC BY) license (https://creativecommons.org/licenses/by/4.0/).