
Crude Oil–Brine–Rock Interactions in Tight Chalk Reservoirs: An Experimental Study

 ,
,  , ,
, ,  and
and 
Abstract
:
1. Introduction
2. Materials and Method
2.1. Materials
2.1.1. Oil
2.1.2. Brine
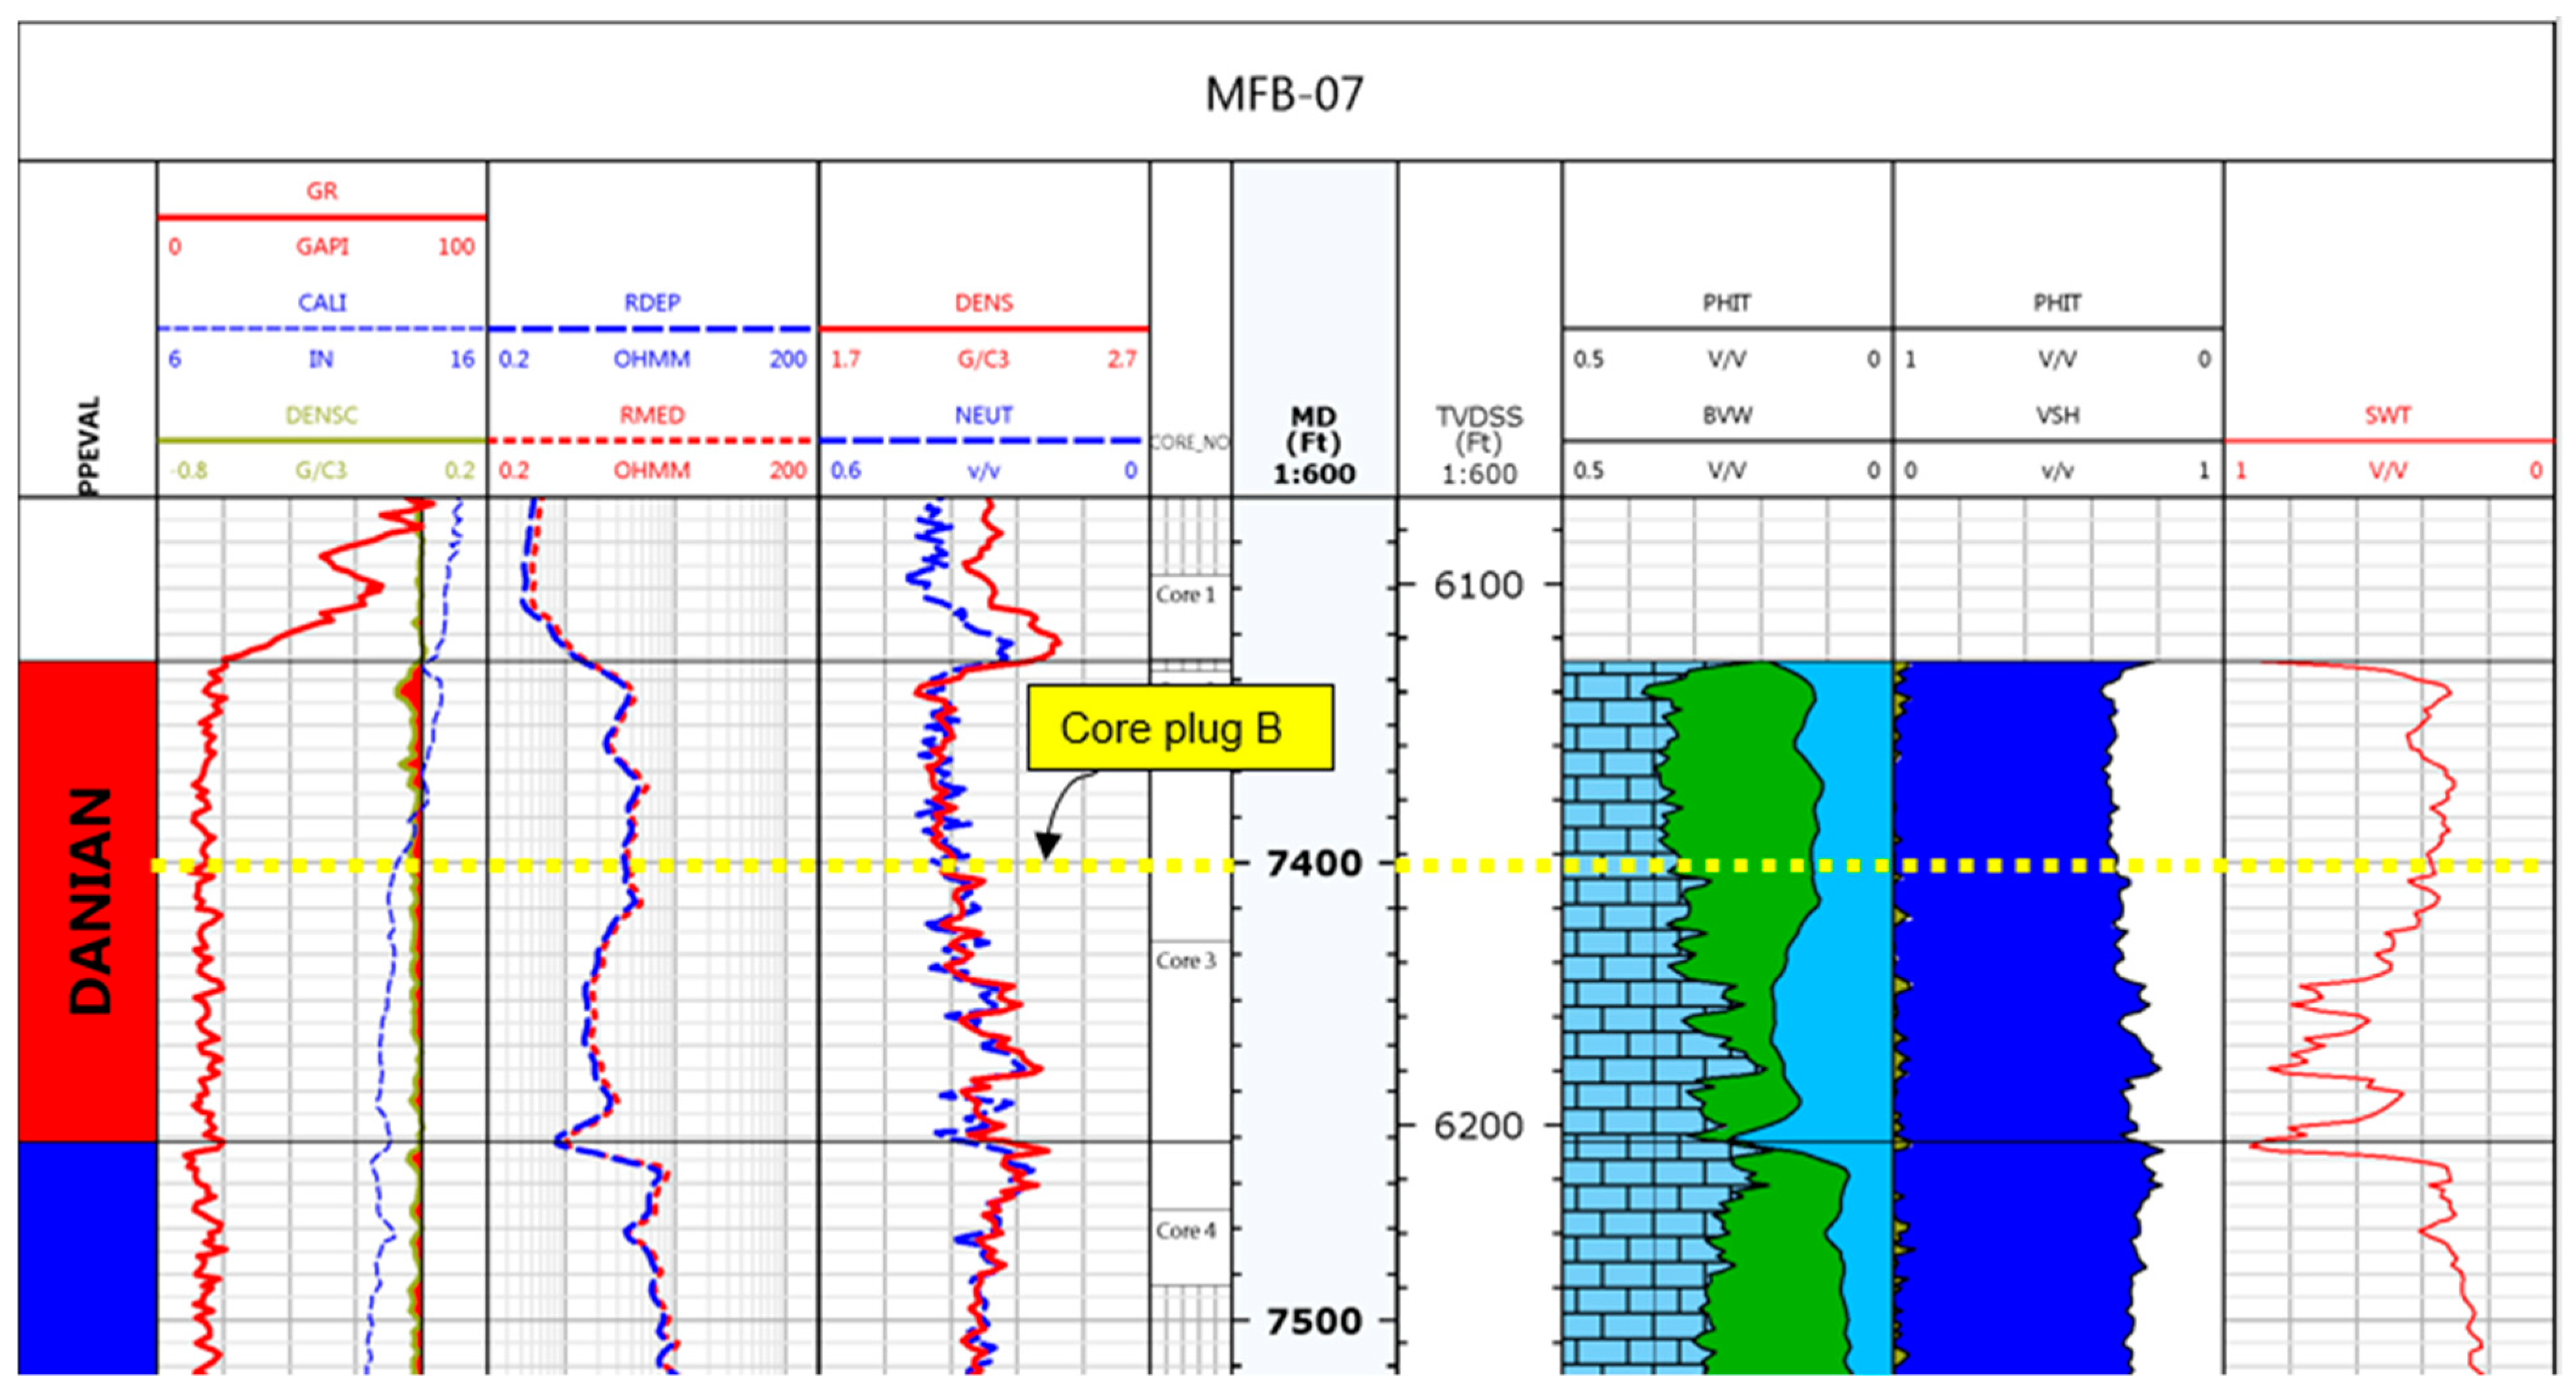
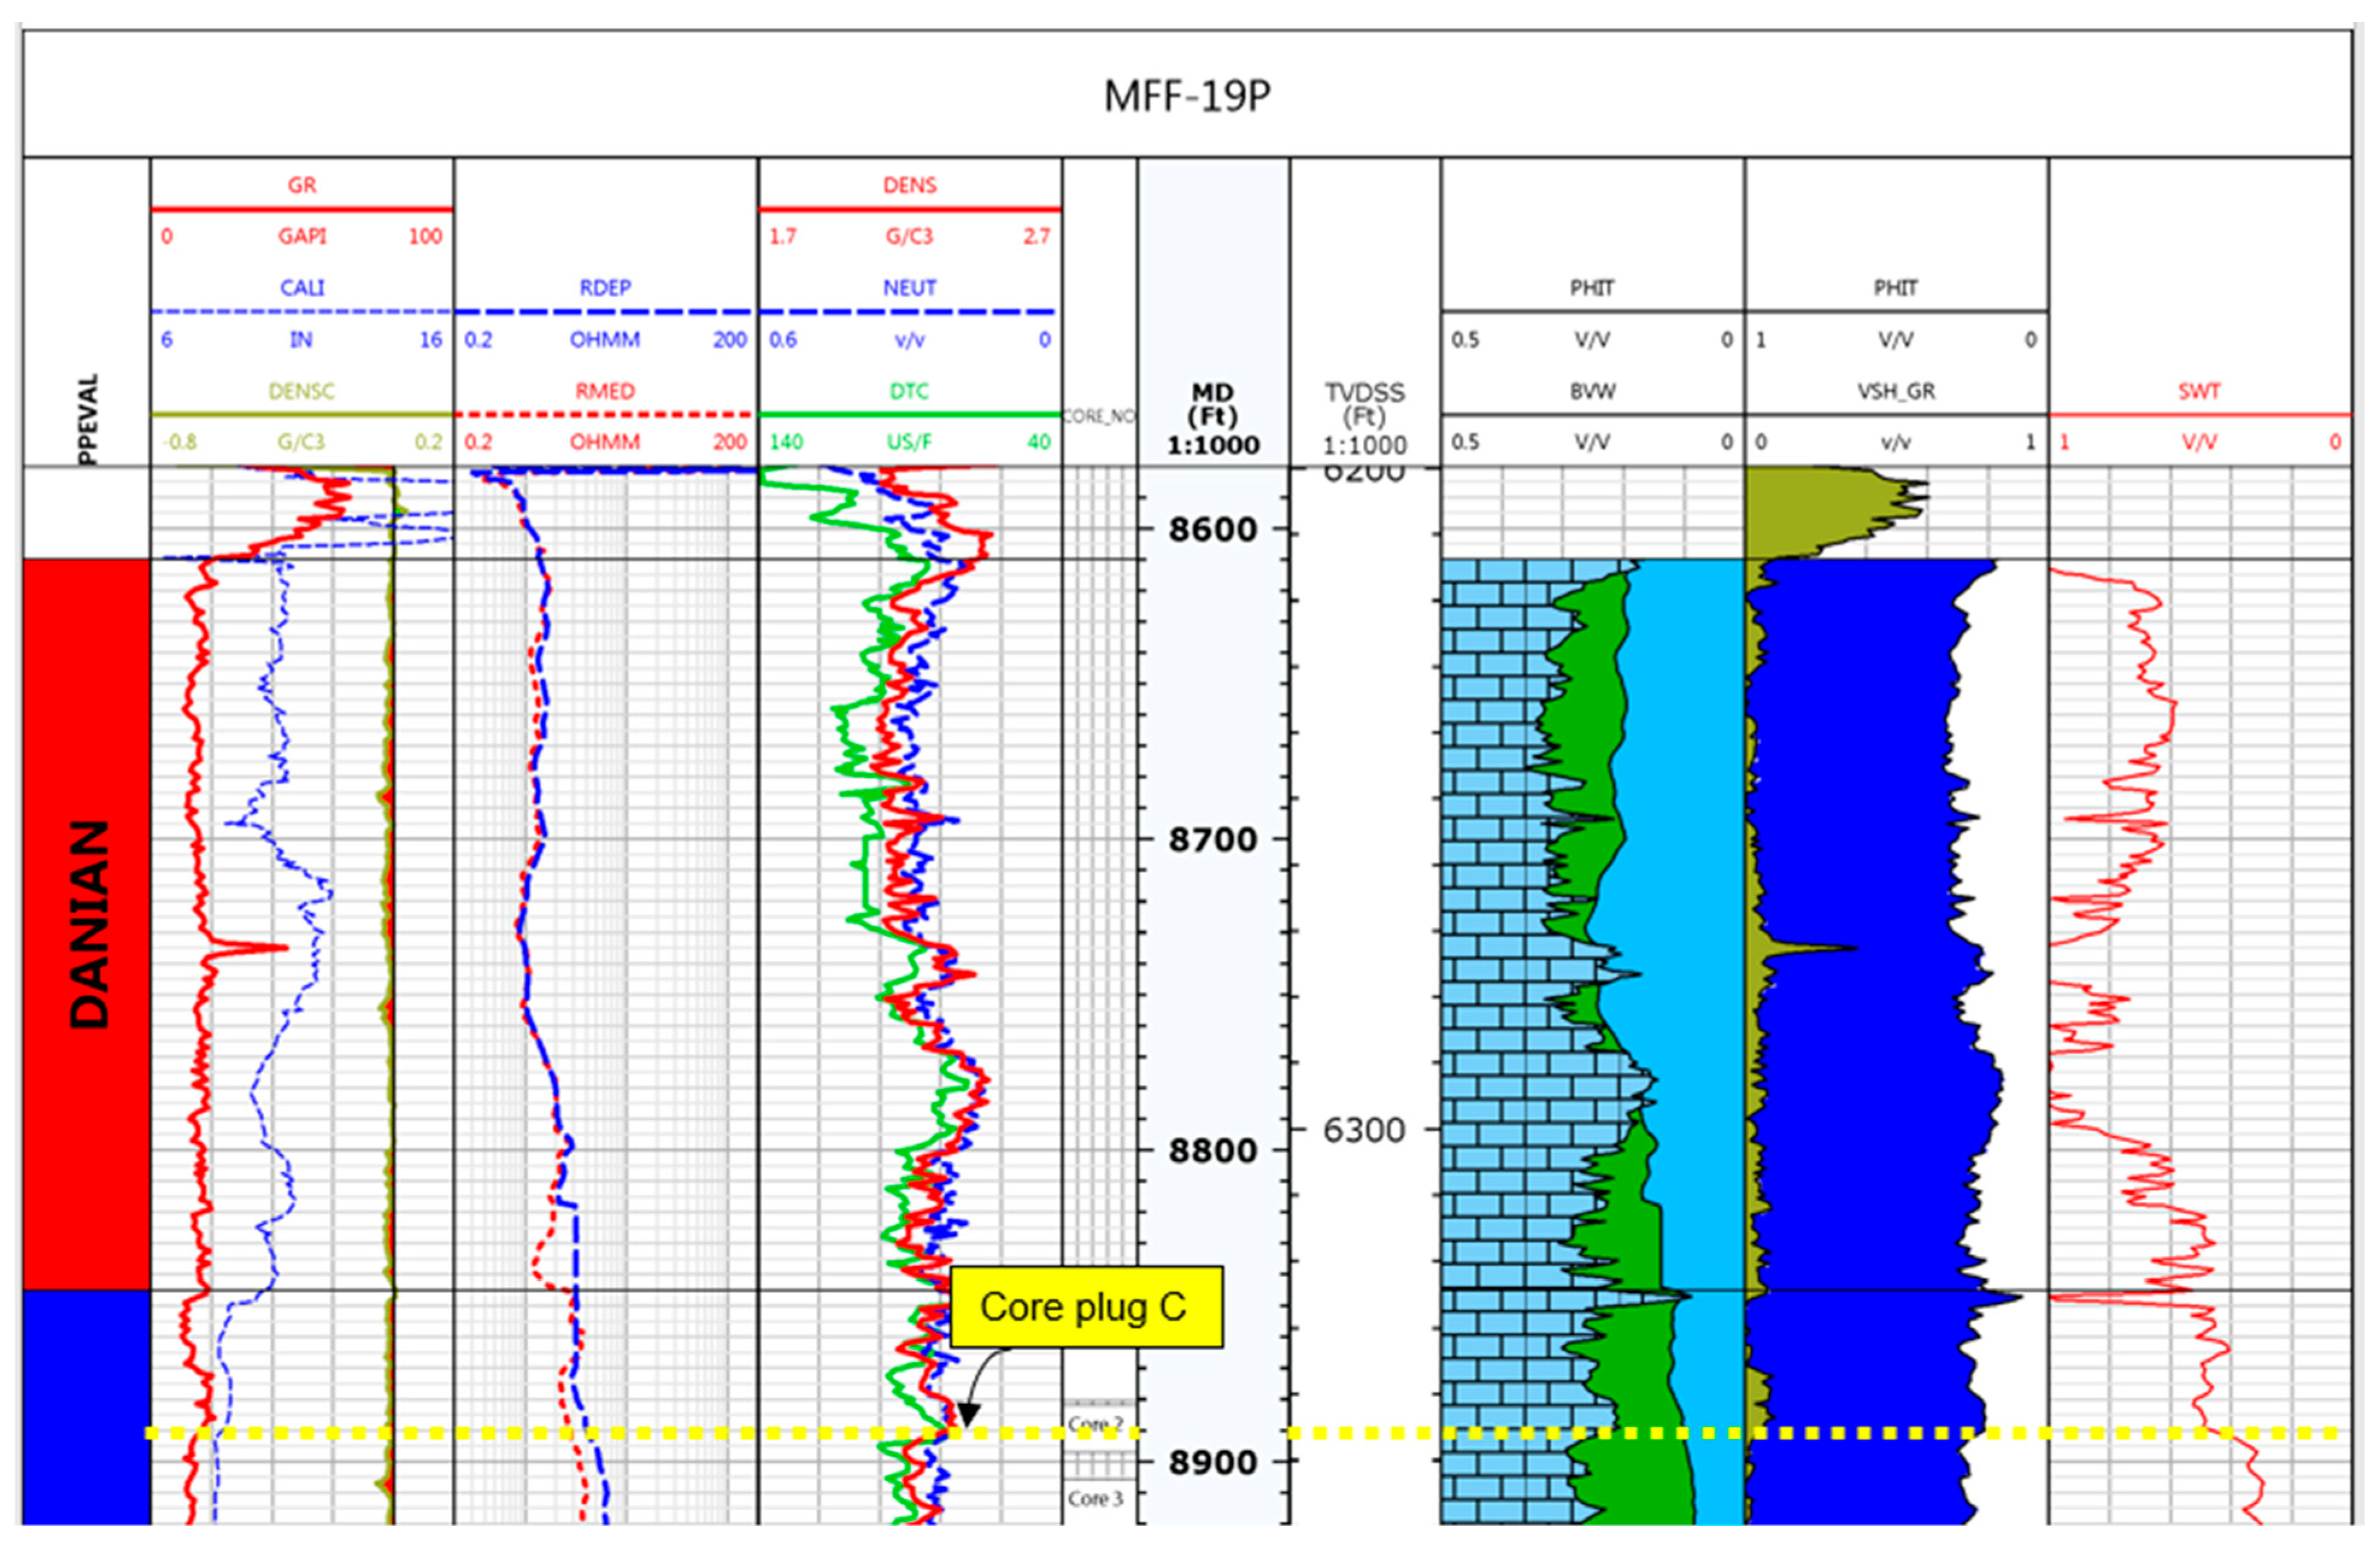
2.1.3. Core Plugs
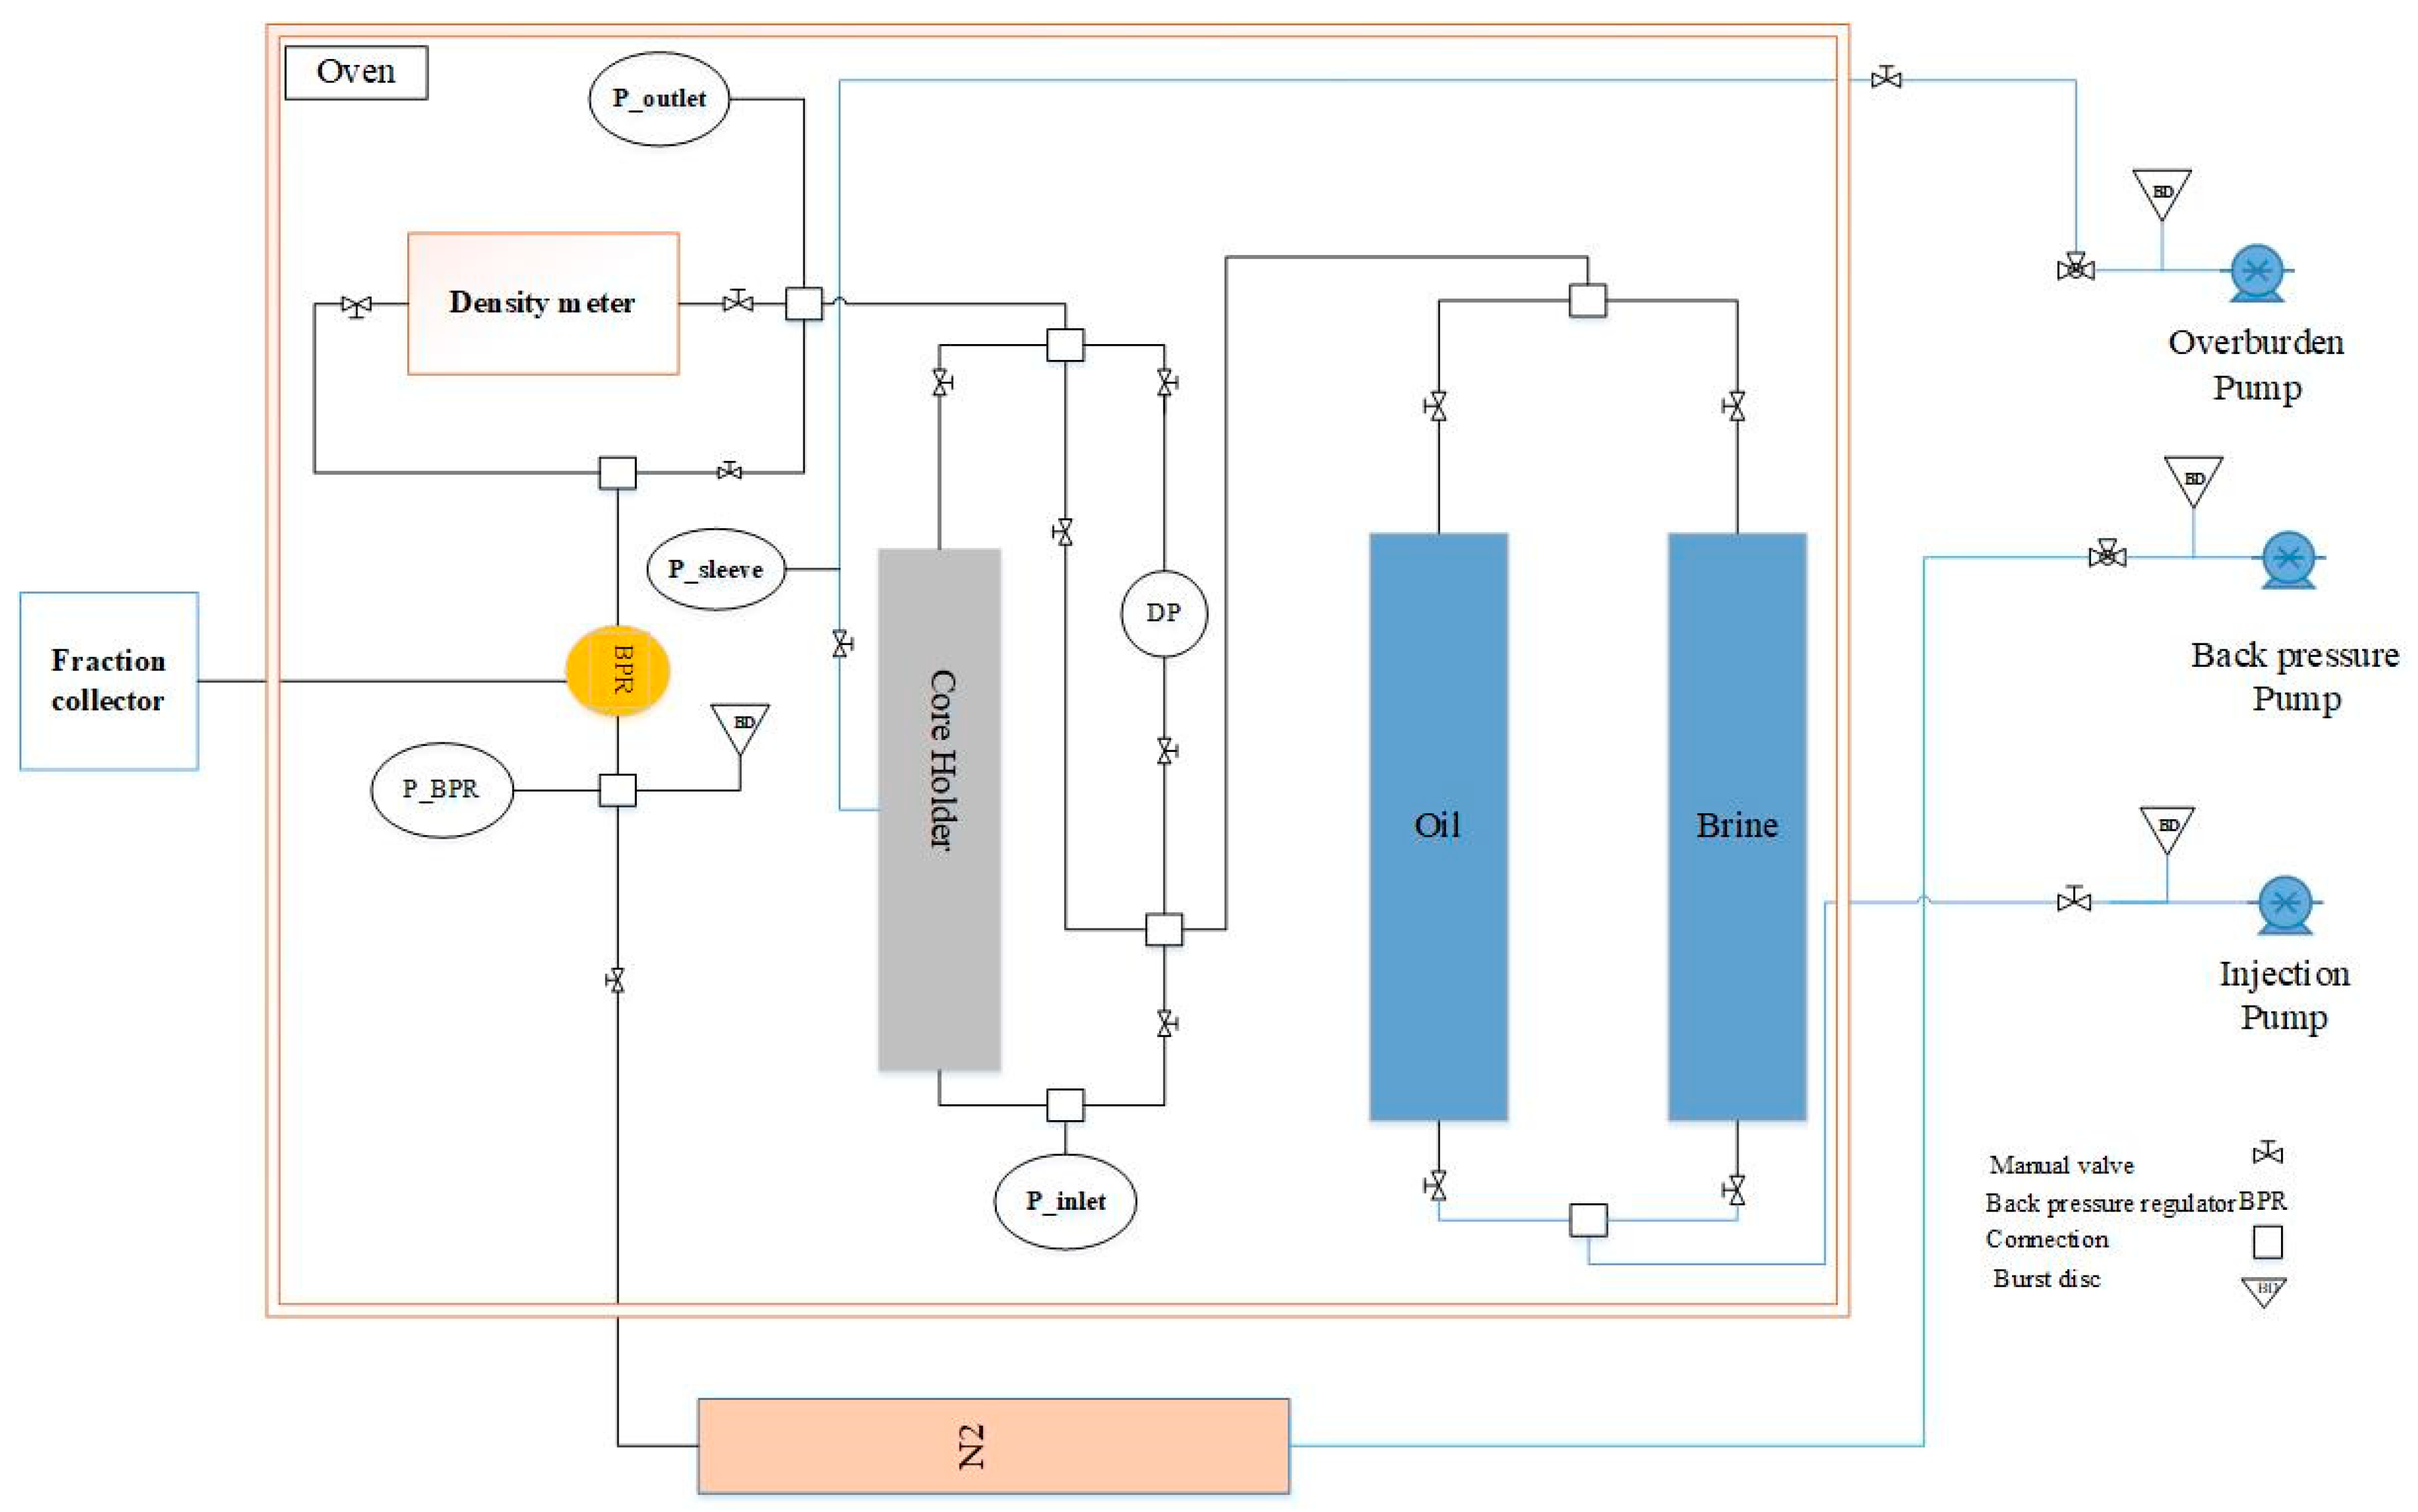
2.2. Core Preparation and Water Flooding
- (1)
- Stevns Klint (outcrop) chalk samples (Experiment 1, 2, and 3). We used a model oil with and without the presence of acid to evaluate the effectiveness of the timeline of the dynamic ageing method and its effect on the core wettability.
- (2)
- Reservoir rocks from the Ekofisk formation (Experiment 4, 5, and 6). We used a dead reservoir crude oil to evaluate the optimum stage of low salinity injection on oil recovery.
- (3)
- Reservoir rock from the Tor formation (Experiment 7, 8, and 9). Similar to the previous step, a dead reservoir crude oil was used. Injection scenarios were designed to complement those previously investigated on the rocks from the Ekofisk formation in the secondary and tertiary stage of flooding.
2.3. Characterization Techniques
2.3.1. Effluent Analysis
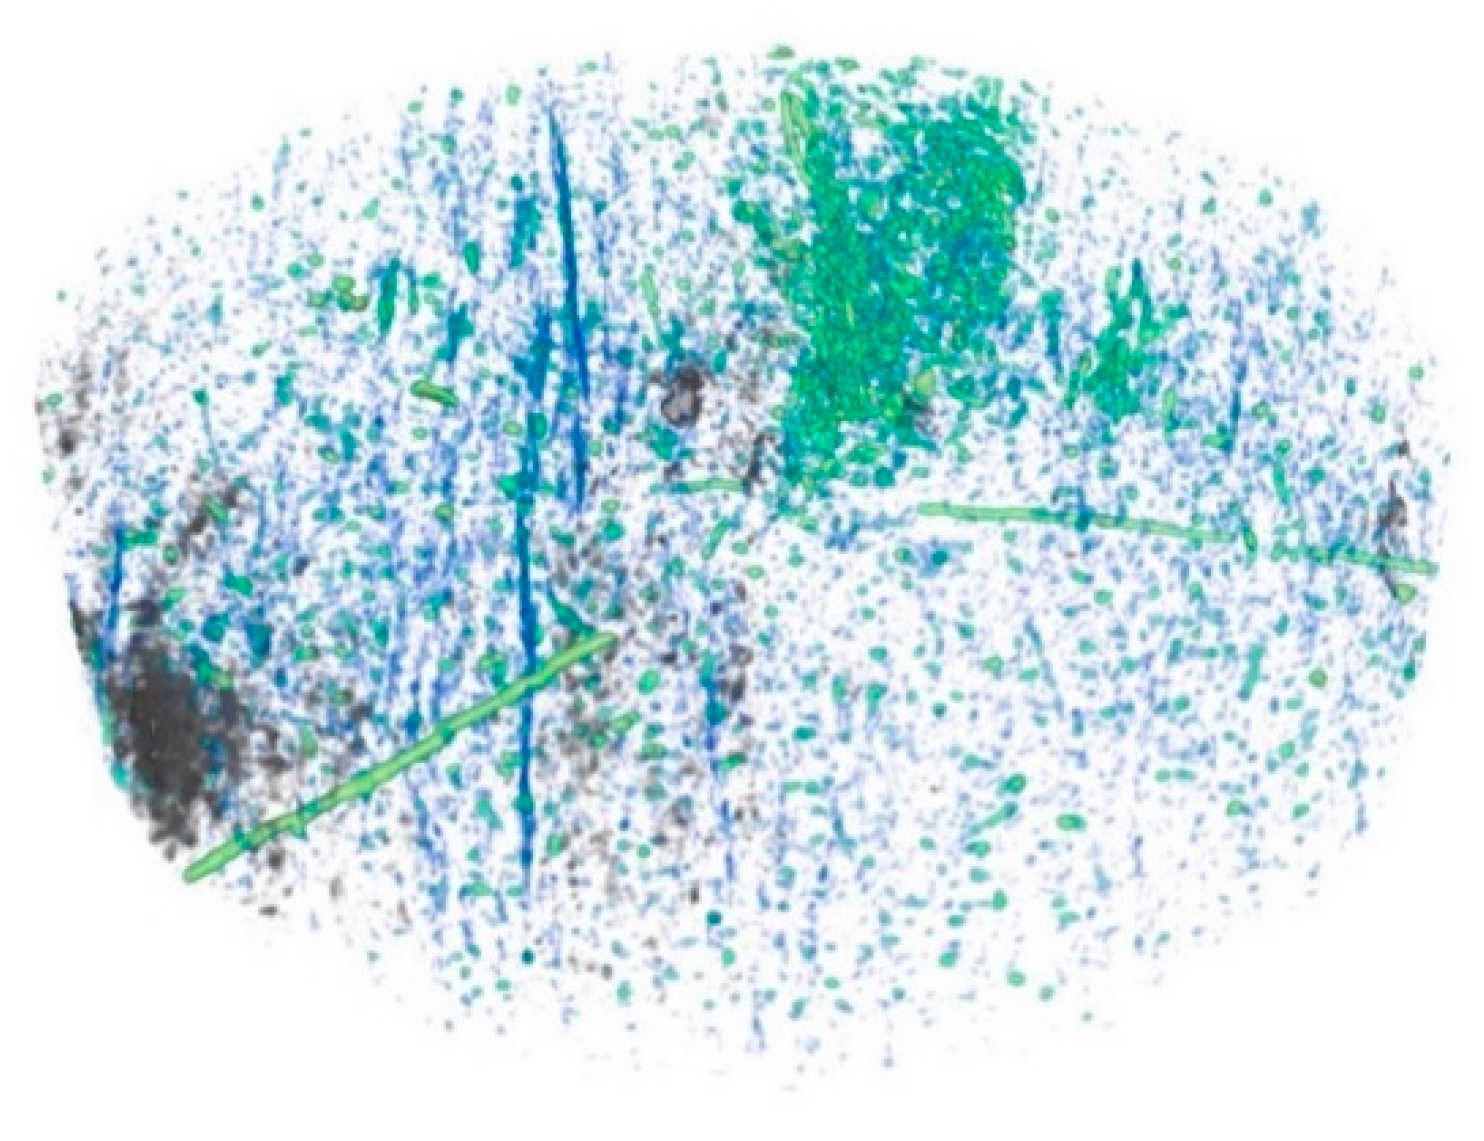
2.3.2. CT Imaging of Core Plugs
3. Results and Discussion
3.1. Oil Effect
3.2. Brine Effect
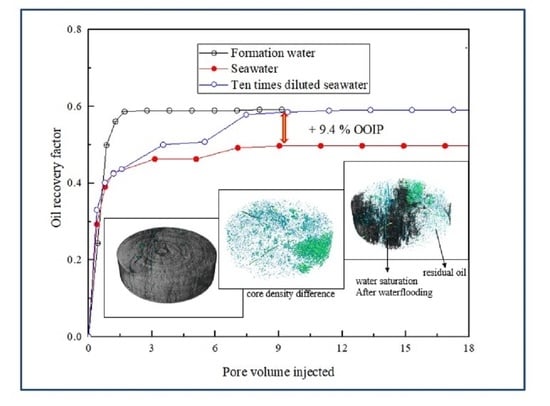
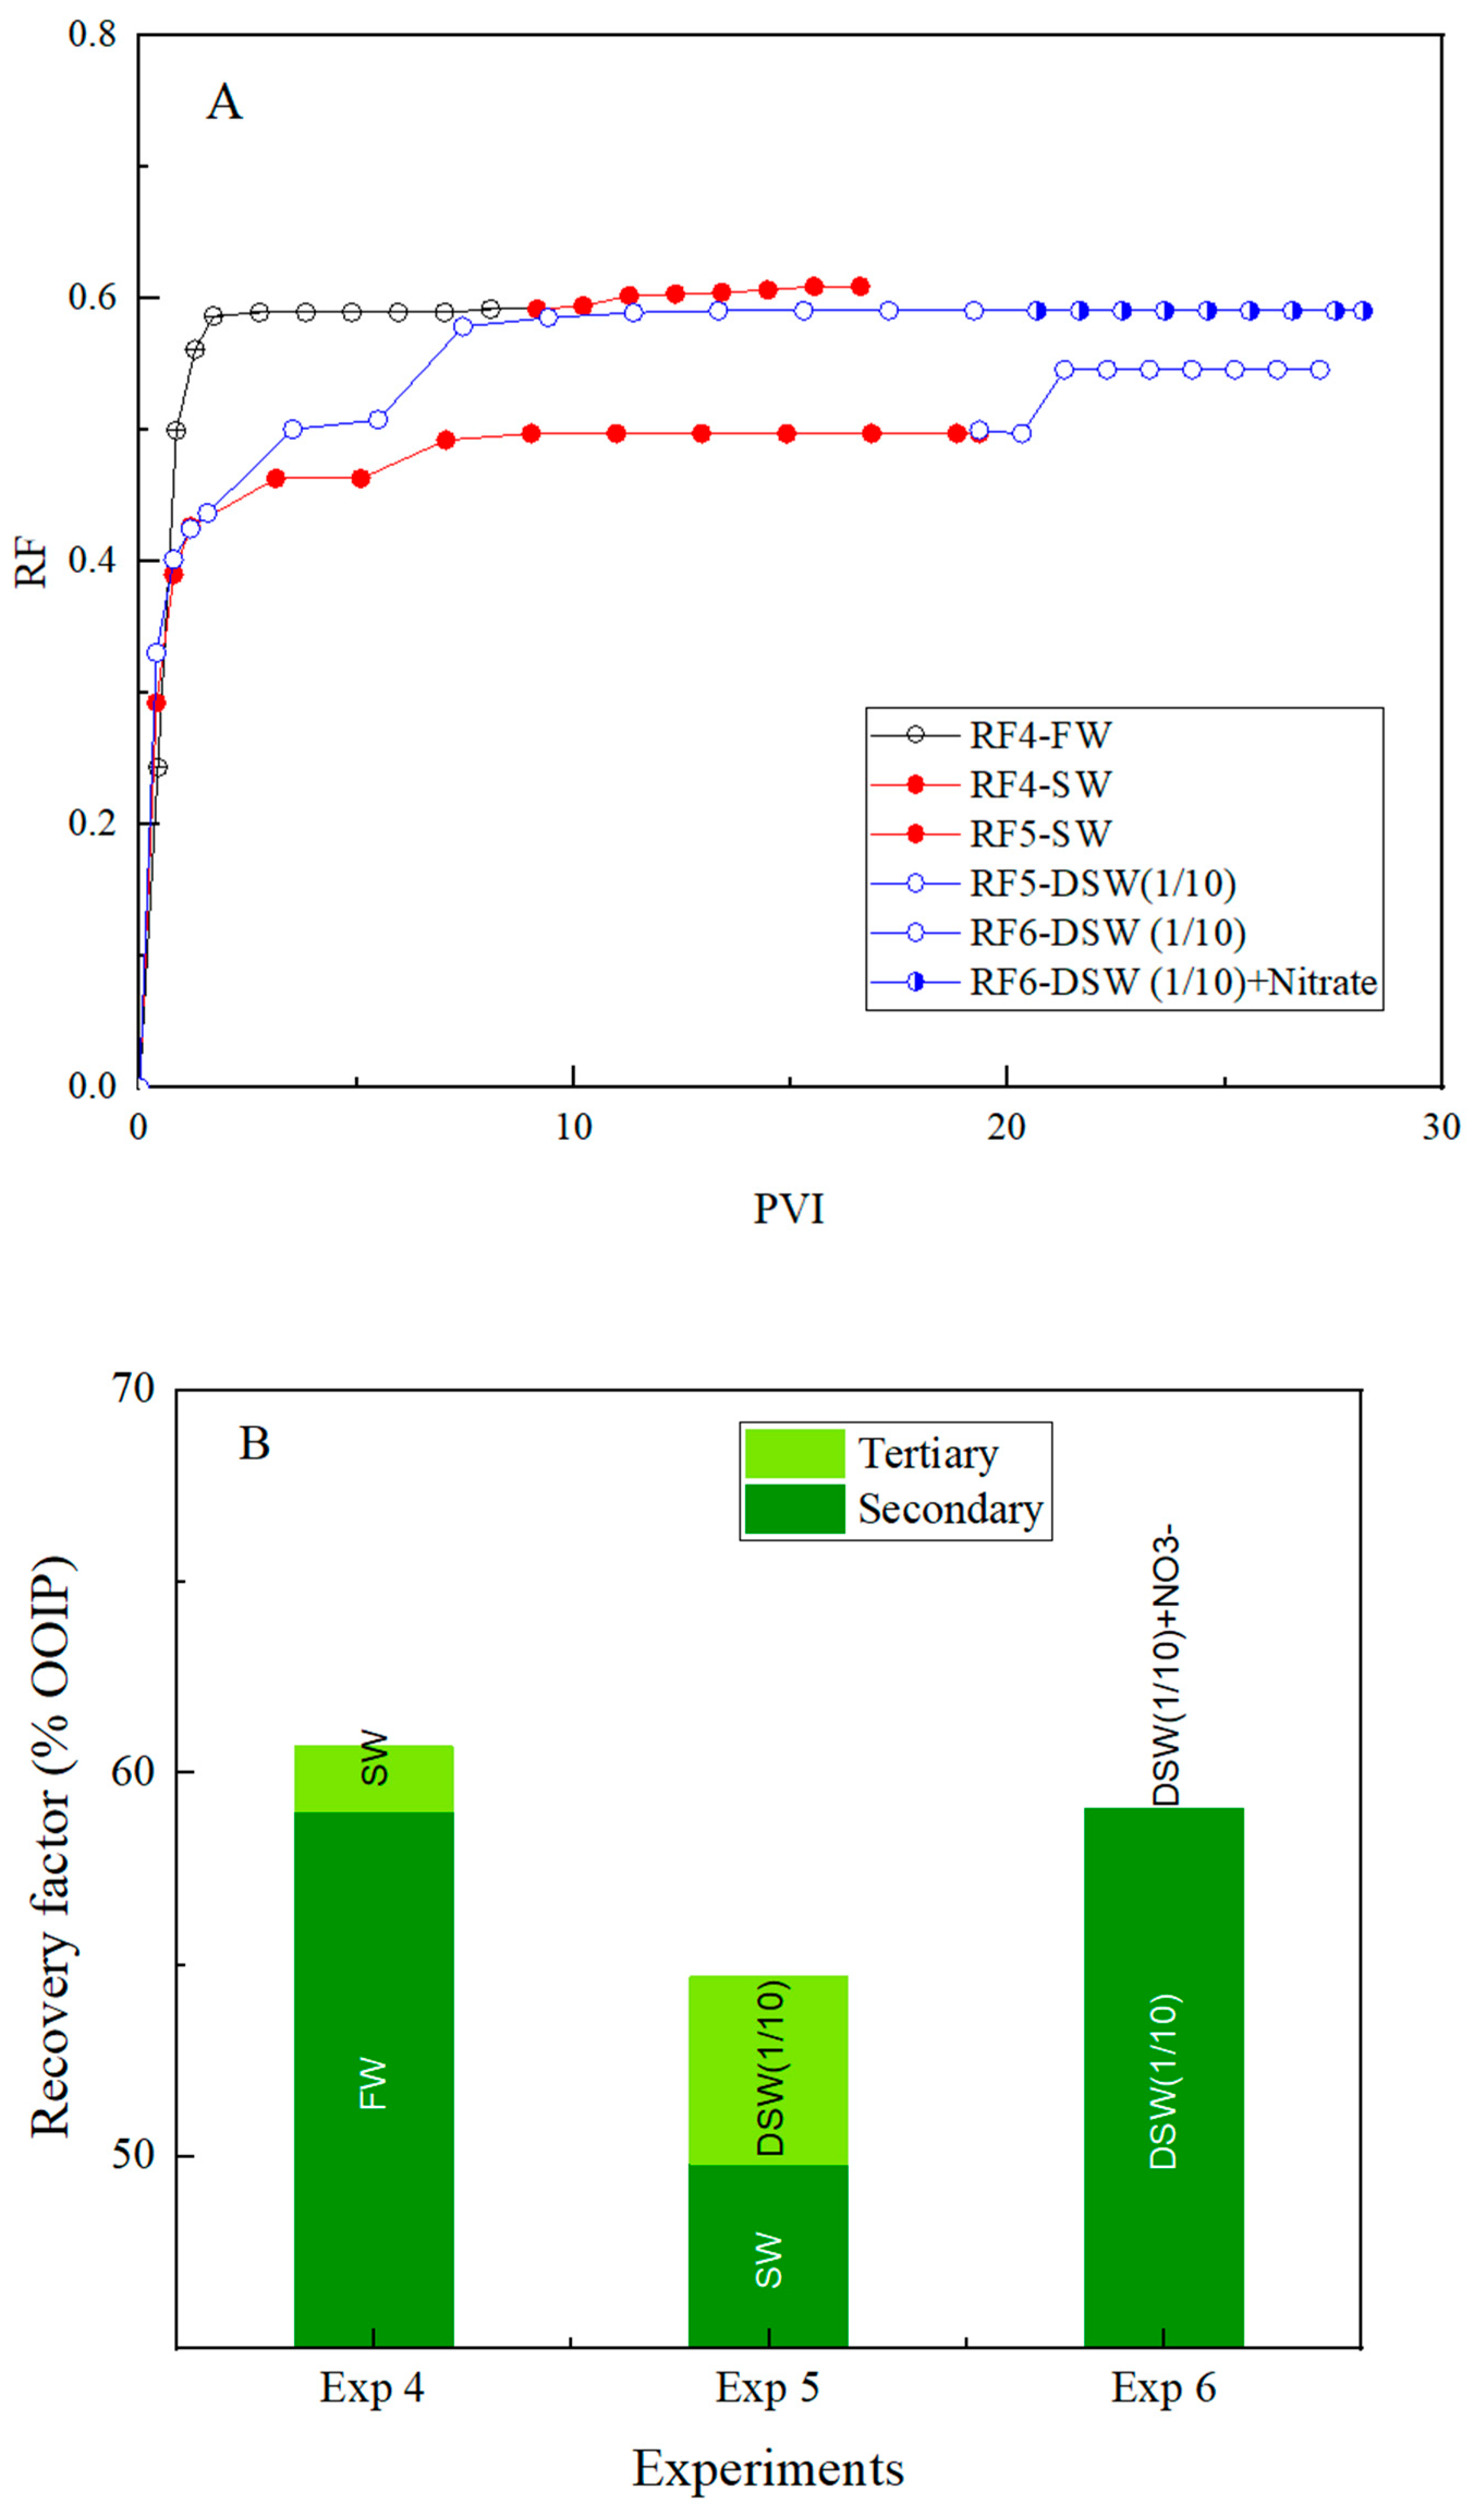
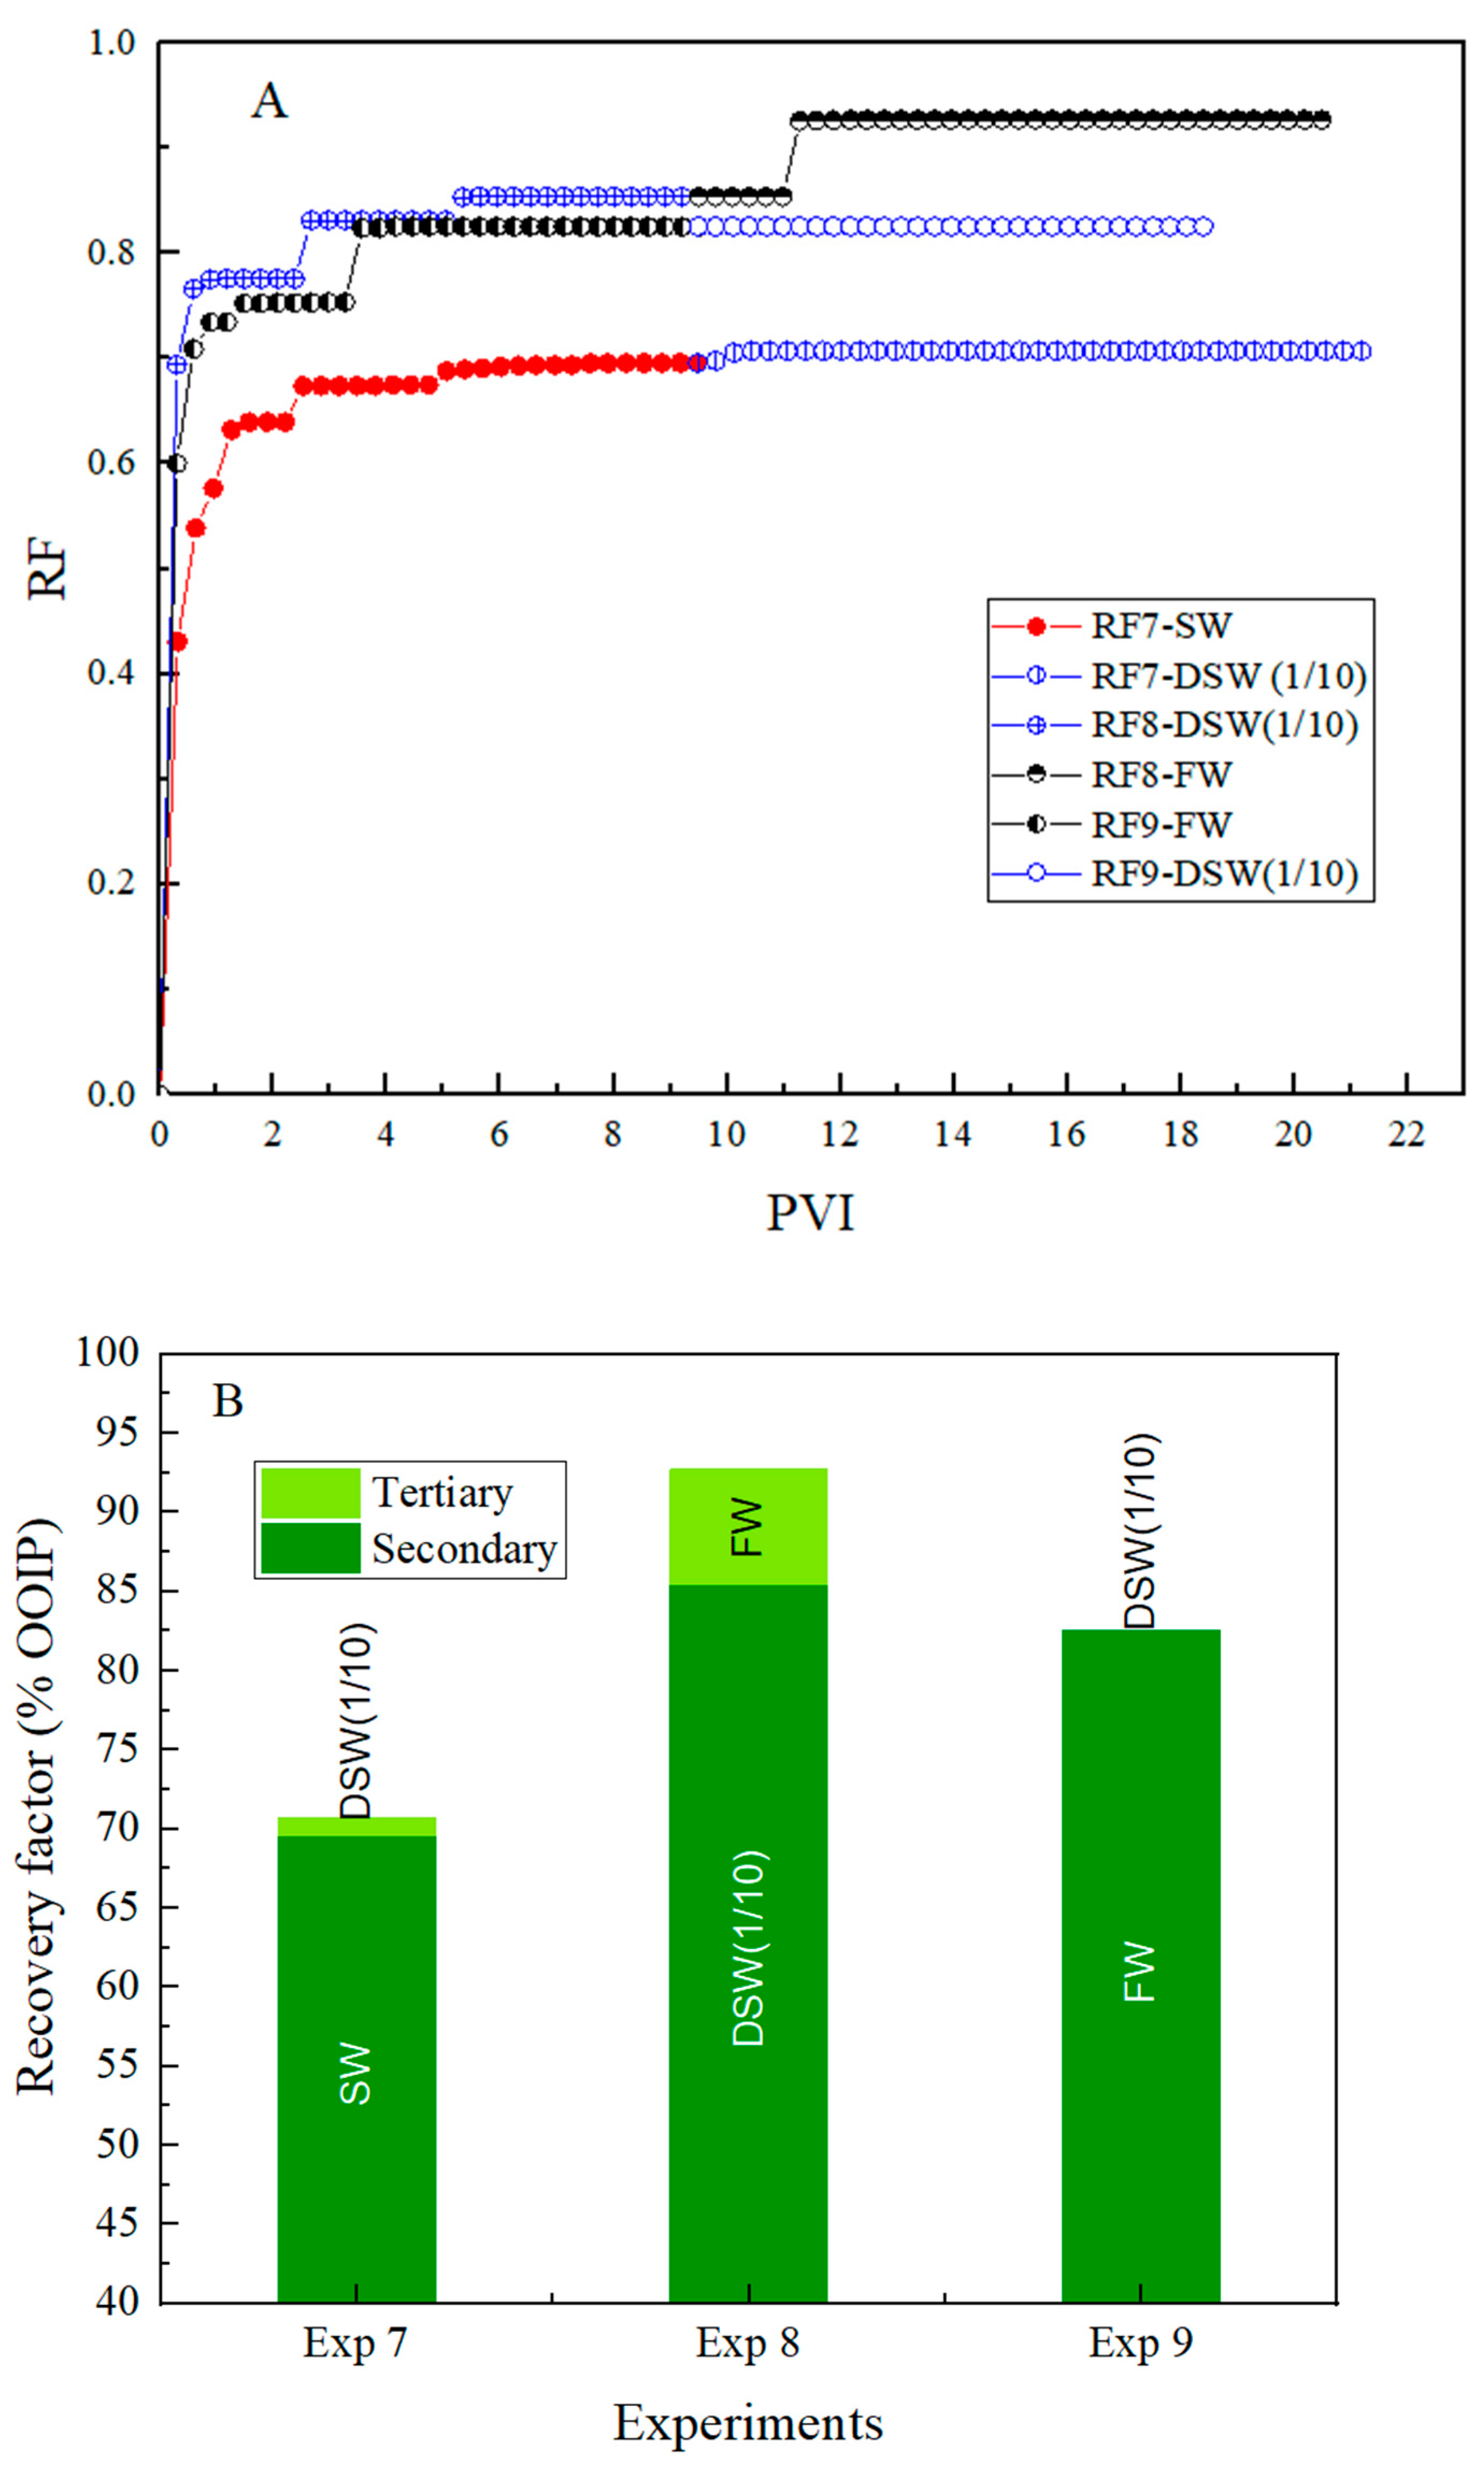
3.2.1. Secondary Water Flooding
3.2.2. Tertiary Water Flooding
3.3. Rock Effect
3.4. Capillary End Effect
4. Conclusions
- (1)
- The presence of polar components in the oil phase has a significant effect on rock wettability during the ageing process. This subsequently affects the oil production during the water flooding stage. A significant difference was observed between a simple synthetic oil and reservoir crude oil, even when the total acid number was kept comparable.
- (2)
- At the secondary injection stage, ten-times-diluted seawater and formation water resulted in higher oil recovery than seawater. This was the case for core samples from both the Ekofisk and Tor formations.
- (3)
- Consistent with the literature, Tor samples had higher oil recoveries when compared to Ekofisk core plugs. The modified flow zone indicator, a measure of rock quality, is likely the main variable responsible for the higher oil recoveries observed in Tor core samples.
- (4)
- Bump flooding studies in Stevns Klint outcrops suggest that capillary end effects play a minor role. This effect, for the reservoir materials, with even lower permeabilities, would be much lower. In addition, CT images of a reservoir core after flooding show that capillary end effects are not significant even in these short core samples.
- (5)
- Different oil recovery factors resulted from reservoir material and outcrop samples (experiment 4 and 3) show the importance of using reservoir core material in the experiments instead of outcrops.
Supplementary Materials
Author Contributions
Funding
Institutional Review Board Statement
Informed Consent Statement
Data Availability Statement
Acknowledgments
Conflicts of Interest
References
- Tang, G.Q.; Morrow, N.R. Influence of Brine Composition and Fines Migration on Crude/Oil/Rock Interactions and Oil Recovery. J. Pet. Sci. Eng. 1999, 24, 99–111. [Google Scholar] [CrossRef]
- Aghaeifar, Z.; Strand, S.; Austad, T.; Puntervold, T.; Aksulu, H.; Navratil, K.; Storås, S.; Håmsø, D. Influence of Formation Water Salinity/Composition on the Low-Salinity Enhanced Oil Recovery Effect in High-Temperature Sandstone Reservoirs. Energy Fuels 2015, 29, 4747–4754. [Google Scholar] [CrossRef]
- Jackson, M.D.; Vinogradov, J.; Hamon, G.; Chamerois, M. Evidence, mechanisms and improved understanding of controlled salinity waterflooding part 1: Sandstones. Fuel 2016, 185, 772–793. [Google Scholar] [CrossRef] [Green Version]
- Mamonov, A.; Kvandal, O.A.; Strand, S.; Puntervold, T. Adsorption of polar organic components onto sandstone rock minerals and its effect on wettability and enhanced oil recovery potential by smart water. Energy Fuels 2019, 33, 5954–5960. [Google Scholar] [CrossRef]
- Mamonov, A.; Puntervold, T.; Strand, S.; Hetland, B.; Andersen, Y.; Wealth, A.; Nadeau, P.H. Contribution of Feldspar Minerals to pH during Smart Water EOR Processes in Sandstones. Energy Fuels 2020, 34, 55–64. [Google Scholar] [CrossRef]
- Mohammadkhani, S.; Shahverdi, H.; Esfahany, M.N. Impact of salinity and connate water on low salinity water injection in secondary and tertiary stages for enhanced oil recovery in carbonate oil reservoirs. J. Geophys. Eng. 2018, 15, 1242–1254. [Google Scholar] [CrossRef] [Green Version]
- Zaeri, M.R.; Hashemi, R.; Shahverdi, H.; Sadeghi, M. Enhanced oil recovery from carbonate reservoirs by spontaneous imbibition of low salinity water. Pet. Sci. 2018, 15, 564–576. [Google Scholar] [CrossRef] [Green Version]
- Derkani, M.H.; Fletcher, A.; Abdallah, W.; Sauerer, B.; Anderson, J.; Zhang, Z. Low Salinity Waterflooding in Carbonate Reservoirs: Review of Interfacial Mechanisms. Colloids Interfaces. 2018, 2, 20. [Google Scholar] [CrossRef] [Green Version]
- Strand, S.; Høgnesen, E.J.; Austad, T. Wettability alteration of carbonates—Effects of potential determining ions (Ca2+and SO42-) and temperature. Colloids Surf. A Physicochem. Eng. Asp. 2006, 275, 1–10. [Google Scholar] [CrossRef]
- Karoussi, O.; Hamouda, A.A. Imbibition of sulfate and magnesium ions into carbonate rocks at elevated temperatures and their influence on wettability alteration and oil recovery. Energy Fuels. 2007, 21, 2138–2146. [Google Scholar] [CrossRef]
- Standnes, D.C.; Austad, T. Wettability alteration in chalk 2. Mechanisms for wettability alteration from oil-wet to water-wet using surfactants. J. Pet. Sci. Eng. 2000, 28, 123–143. [Google Scholar] [CrossRef]
- Austad, T.; Shariatpanahi, S.F.; Strand, S.; Black, C.J.J.; Webb, K.J. Conditions for a low-salinity Enhanced Oil Recovery (EOR) effect in carbonate oil reservoirs. Energy Fuels. 2012, 26, 569–575. [Google Scholar] [CrossRef]
- Hamouda, A.A.; Maevskiy, E. Oil recovery mechanism(s) by low salinity brines and their interaction with chalk. Energy Fuels 2014, 28, 6860–6868. [Google Scholar] [CrossRef]
- Zahid, A.; Sandersen, S.B.; Stenby, E.H.; von Solms, N.; Shapiro, A. Advanced waterflooding in chalk reservoirs: Understanding of underlying mechanisms. Colloids Surf. A Physicochem. Eng. Asp. 2011, 389, 281–290. [Google Scholar] [CrossRef]
- Austad, T. Water-Based EOR in Carbonates and Sandstones: New Chemical Understanding of the EOR Potential Using “Smart Water”. In Enhanced Oil Recovery Field Case Studies; Elsevier: Amsterdam, The Netherlands, 2013. [Google Scholar] [CrossRef]
- Al Shalabi, E.W.; Sepehrrnoori, K.; Delshad, M. Mechanisms behind low salinity water injection in carbonate reservoirs. Fuel 2014, 121, 11–19. [Google Scholar] [CrossRef]
- Zhang, P.; Tweheyo, M.T.; Austad, T. Wettability alteration and improved oil recovery by spontaneous imbibition of seawater into chalk: Impact of the potential determining ions Ca2+, Mg2+, and SO42-. Colloids Surf. Physicochem. Eng. Asp. 2007, 301, 199–208. [Google Scholar] [CrossRef]
- Mahani, H.; Keya, A.L.; Berg, S.; Bartels, W.B.; Nasralla, R.; Rossen, W.R. Insights into the mechanism of wettability alteration by low-salinity flooding (LSF) in carbonates. Energy Fuels 2015, 29, 1352–1367. [Google Scholar] [CrossRef]
- Alameri, W.; Teklu, T.W.; Graves, R.M.; Kazemi, H.; AlSumaiti, A.M. Wettability alteration during low-salinity water-flooding in carbonate reservoir cores. In Proceedings of the SPE Asia Pacific Oil Gas Conference Exhibition, Adelaide, Australia, 14–18 October 2014; pp. 1199–1216. [Google Scholar] [CrossRef]
- Hiorth, A.; Cathles, L.M.; Madland, M.V. The Impact of Pore Water Chemistry on Carbonate Surface Charge and Oil Wettability. Transp. Porous Media 2010, 85, 1–21. [Google Scholar] [CrossRef]
- Al-Sarihi, A.; Russell, T.; Bedrikovetsky, P.; Zeinijahromi, A. Fines Stabilization by Ca Ions and Its Effect on LSW Injection. Energy Fuels 2019, 33, 10775–10786. [Google Scholar] [CrossRef]
- Al-Sarihi, A.; Zeinijahromi, A.; Genolet, L.; Behr, A.; Kowollik, P.; Bedrikovetsky, P. Effects of Fines Migration on Residual Oil during Low-Salinity Waterflooding. Energy Fuels 2018, 32, 8296–8309. [Google Scholar] [CrossRef]
- Mohammadkhani, S.; Shahverdi, H.; Nielsen, S.M.; Esfahany, M.N.; Shapiro, A. Bicarbonate flooding of homogeneous and heterogeneous cores from a carbonaceous petroleum reservoir. J. Pet. Sci. Eng. 2019, 178, 251–261. [Google Scholar] [CrossRef]
- Mokhtari, R.; Ayatollahi, S. Dissociation of polar oil components in low salinity water and its impact on crude oil–brine interfacial interactions and physical properties. Pet. Sci. 2019, 16, 328–343. [Google Scholar] [CrossRef] [Green Version]
- Mokhtari, R.; Ayatollahi, S.; Fatemi, M. Experimental investigation of the influence of fluid-fluid interactions on oil recovery during low salinity water flooding. J. Pet. Sci. Eng. 2019, 106194. [Google Scholar] [CrossRef]
- Chávez-Miyauchi, T.E.; Firoozabadi, A.; Fuller, G.G. Nonmonotonic Elasticity of the Crude Oil–Brine Interface in Relation to Improved Oil Recovery. Langmuir 2016, 32, 2192–2198. [Google Scholar] [CrossRef] [PubMed]
- Mohammadkhani, S.; Shahverdi, H.; Kling, K.I.; Feilberg, K.L.; Esfahany, M.N. Characterization of interfacial interactions and emulsification properties of bicarbonate solutions and crude oil and the effects of temperature and pressure. J. Mol. Liq. 2020, 305, 112729. [Google Scholar] [CrossRef]
- Wang, T.; Andersen, S.I.; Shapiro, A. Coalescence of oil droplets in microchannels under brine flow. Colloids Surf. A Physicochem. Eng. Asp. 2020, 598, 124864. [Google Scholar] [CrossRef]
- Dang, C.; Nghiem, L.; Nguyen, N.; Chen, Z.; Nguyen, Q. Evaluation of CO2 Low Salinity Water-Alternating-Gas for enhanced oil recovery. J. Nat. Gas Sci. Eng. 2016, 35, 237–258. [Google Scholar] [CrossRef]
- Shiran, B.S.; Skauge, A. Enhanced oil recovery (EOR) by combined low salinity water/polymer flooding. Energy Fuels 2013, 27, 1223–1235. [Google Scholar] [CrossRef]
- Shaddel, S.; Tabatabae-Nejad, S.A. Alkali/Surfactant Improved Low-Salinity Waterflooding. Transp. Porous Media. 2015, 106, 621–642. [Google Scholar] [CrossRef]
- Austad, T.; Standnes, D.C. Spontaneous imbibition of water into oil-wet carbonates. J. Pet. Sci. Eng. 2003, 39, 363–376. [Google Scholar] [CrossRef]
- Al-Attar, H.H.; Mahmoud, M.Y.; Zekri, A.Y.; Almehaideb, R.; Ghannam, M. Low-salinity flooding in a selected carbonate reservoir: Experimental approach. J. Pet. Explor. Prod. Technol. 2013, 3, 139–149. [Google Scholar] [CrossRef] [Green Version]
- Goolsby, J.L.; Anderson, R.C. Pilot Water Flooding in a Dolomite Reservoir, The McElroy Field. J. Pet. Technol. 1964, 16, 1345–1350. [Google Scholar] [CrossRef]
- Seyyedi, M.; Tagliaferri, S.; Abatzis, J.; Nielsen, S.M. An integrated experimental approach to quantify the oil recovery potential of seawater and low-salinity seawater injection in North Sea chalk oil reservoirs. Fuel 2018, 232, 267–278. [Google Scholar] [CrossRef]
- Hao, J.; Mohammadkhani, S.; Shahverdi, H.; Esfahany, M.N.; Shapiro, A. Mechanisms of smart waterflooding in carbonate oil reservoirs—A review. J. Pet. Sci. Eng. 2019, 179, 276–291. [Google Scholar] [CrossRef]
- Bartels, W.B.; Mahani, H.; Berg, S.; Hassanizadeh, S.M. Literature review of low salinity waterflooding from a length and time scale perspective. Fuel. 2019, 236, 338–353. [Google Scholar] [CrossRef]
- Shehata, A.M.; Alotaibi, M.B.; Nasr-El-Din, H.A. Waterflooding in Carbonate Reservoirs: Does the Salinity Matter? SPE Reserv. Eval. Eng. 2014, 17, 304–313. [Google Scholar] [CrossRef]
- Jones, S.A.; van der Bent, V.; Farajzadeh, R.; Rossen, W.R.; Vincent-Bonnieu, S. Small Core Flood Experiments for Foam EOR - Screening Surfactant Applications. In Proceedings of the 18th European symposium on Oil Recovery, Dresden, Germany, 14–16 April 2015. [Google Scholar] [CrossRef] [Green Version]
- Ahkami, M.; Chakravarty, K.H.; Xiarchos, I.; Thomsen, K.; Fosbøl, P.L. Determining Optimum Aging Time Using Novel Core Flooding Equipment. In Proceedings of the SPE Bergen One Day Seminar, Bergen, Norway, 20 April 2016. [Google Scholar]
- Fernø, M.A.; Torsvik, M.; Haugland, S.; Graue, A. Dynamic laboratory wettability alteration. Energy Fuels. 2010, 24, 3950–3958. [Google Scholar] [CrossRef]
- Graue, A.; Aspenes, E.; Bogno, T.; Moe, R.W.; Ramsdal, J. Alteration of wettability and wettability heterogeneity. J. Pet. Sci. Eng. 2002, 33, 3–17. [Google Scholar] [CrossRef] [Green Version]
- Gomari, K.A.R.; Hamouda, A.A. Effect of fatty acids, water composition and pH on the wettability alteration of calcite surface. J. Pet. Sci. Eng. 2006, 50, 140–150. [Google Scholar] [CrossRef]
- Yousef, A.A.; Al-Saleh, S.; Al-Kaabi, A.; Al-Jawfi, M. Laboratory investigation of the impact of injection-water salinity and ionic content on oil recovery from carbonate reservoirs. SPE Reserv. Eval. Eng. 2011, 14, 578–593. [Google Scholar] [CrossRef]
- Blinkenberg, K.H.; Anderskouv, K.; Sheldon, E.; Bjerrum, C.J.; Stemmerik, L. Stratigraphically controlled silicification in Danian chalk and its implications for reservoir properties, southern Danish Central Graben. Mar. Pet. Geol. 2020, 115, 104134. [Google Scholar] [CrossRef]
- Fabricius, I.L. Chalk: Composition, diagenesis and physical properties. Bull. Geol. Soc. Den. 2007, 55, 97–128. [Google Scholar] [CrossRef]
- Røgen, B.; Fabricius, I.L. Influence of clay and silica on permeability and capillary entry pressure of chalk reservoirs in the North Sea. Pet. Geo. 2002, 8, 287–293. [Google Scholar] [CrossRef]
- Hao, J.; Feilberg, K.L.; Shapiro, A. Kinetics of Calcite Dissolution and Ca-Mg Ion Exchange on the Surfaces of North Sea Chalk Powders. ACS Omega 2020, 5, 17506–17520. [Google Scholar] [CrossRef]
- Sylte, J.E.; Thomas, L.K.; Rhett, D.W.; Bruning, D.D.; Nagel, N.B. Water Induced Compaction in the Ekofisk Field. In Proceedings of the SPE Annual Techical Conference Exhibition, Houston, TX, USA, 3–6 October 1999. [Google Scholar] [CrossRef]
- Rendel, P.M.; Mohammadkhani, S.; Jensen, A.E.; Feilberg, K.L. An innovative method for the quantification of small amounts of crude oil in water using a multi-wavelength separation analyzer. J. Pet. Sci. Eng. 2021, 200, 108388. [Google Scholar] [CrossRef]
- Green, D.W.; Willhite, G.P. Enhanced Oil Recovery; SPE Textbook Series Vol6; Society of Petroleum Engineers: Richardson, TX, USA, 1998. [Google Scholar]
- Zhang, P.; Austad, T. The Relative Effects of Acid Number and Temperature on Chalk Wettability. In Proceedings of the SPE International Symposium Oilfield Chememistry, The Woodlands, TX, USA, 2–4 February 2005; pp. 3–9. [Google Scholar] [CrossRef]
- Standnes, D.C.; Austad, T. Wettability alteration in chalk 1. Preparation of core material and oil properties. J. Pet. Sci. Eng. 2000, 28, 111–121. [Google Scholar] [CrossRef]
- Mokhtari, R.; Anabaraonye, B.U.; Afrough, A.; Mohammadkhani, S.; Feilberg, K.L. Experimental investigation of low salinity water-flooding in tight chalk oil reservoirs. J. Pet. Sci. Eng. 2021, 109282. [Google Scholar] [CrossRef]
- Hubert, C.; Voordouw, G. Oil Field Souring Control by Nitrate-Reducing Sulfurospirillum spp. Appl. Environ. Microbiol. 2007, 73, 2644–2652. [Google Scholar] [CrossRef] [PubMed] [Green Version]
- Anabaraonye, B.U.; Crawshaw, J.P.; Trusler, J.P.M. Brine chemistry effects in calcite dissolution kinetics at reservoir conditions. Chem. Geol. 2019, 509, 92–102. [Google Scholar] [CrossRef]
- Madland, M.V.; Hiorth, A.; Omdal, E.; Megawati, M.; Hildebrand-Habel, T.; Korsnes, R.I.; Evje, S.; Cathles, L.M. Chemical Alterations Induced by Rock-Fluid Interactions When Injecting Brines in High Porosity Chalks. Transp. Porous Media. 2011, 87, 679–702. [Google Scholar] [CrossRef]
- Alagic, E.; Spildo, K.; Skauge, A.; Solbakken, J. Effect of crude oil ageing on low salinity and low salinity surfactant flooding. J. Pet. Sci. Eng. 2011, 78, 220–227. [Google Scholar] [CrossRef]
- Sylte, J.E.; Hallenbeck, L.D.; Thimas, L.K.; Co, P.P. Ekofisk Formation Pilot Waterflood. In Proceedings of the SPE Annual Technical Conference and Exhibition, Houston, TX, USA, 2–5 October 1988; p. 18276. [Google Scholar]
- Hamon, G. Another look at ekofisk wettability. In Proceedings of the International Symposium of the Society of Core Analysts, Abu Dhabi, United Arab Emirates, 5–9 October 2004; pp. 1–14. [Google Scholar]
- Amaefule, J.O.; Altunbay, M.; Tiab, D.; Kersey, D.G.; Keelan, D.K. Enhanced Reservoir Description: Using Core and Log Data to Identify Hydraulic (Flow) Units and Predict Permeability in Uncored Intervals/Wells. In Proceedings of the SPE Annual Techical Conference Exhibition Society of Petroleum Engineers, Houston TX, USA, 3–6 October 1993. [Google Scholar] [CrossRef]
- Tang, X.; Zhou, W.Y.; Yang, W.L.; Zhang, C.; Zhang, C.M. An improved method in petrophysical rock typing based on mercury-injection capillary pressure data. Energy Sources Part A Recover. Util. Environ. Eff. 2020. [Google Scholar] [CrossRef]
- Mirzaei-Paiaman, A.; Ostadhassan, M.; Rezaee, R.; Saboorian-Jooybari, H.; Chen, Z. A new approach in petrophysical rock typing. J. Pet. Sci. Eng. 2018, 166, 445–464. [Google Scholar] [CrossRef] [Green Version]


| Ion (mg/L) | FW | SW | DSW (1/5) | DSW (1/10) | DSW (1/20) | DSW (1/10) + 2S | DSW (1/10) + 2S + 4Mg | DSW (1/10) + NO32− |
|---|---|---|---|---|---|---|---|---|
| Na+ | 27,290 | 10,750 | 2150 | 1080 | 540 | 1218 | 1218 | 1269 |
| Ca2+ | 1470 | 410 | 82 | 41 | 20.5 | 34 | 34 | 37 |
| Mg2+ | 592 | 1100 | 219 | 109 | 55 | 128 | 512 | 128 |
| K+ | 250 | 400 | 80 | 40 | 20 | 31 | 31 | 40 |
| Ba2+ | 0.56 | 0 | 0 | 0 | 0 | 0 | 0 | 0 |
| Sr2+ | 140 | 20 | 4 | 2 | 1 | 2 | 2 | 2 |
| Cl− | 46,500 | 19,350 | 3870 | 1940 | 970 | 1936 | 3057 | 1934 |
| CO3− | 0 | 0 | 0 | 0 | 0 | 0.4 | 0.4 | 5.2 |
| HCO3− | 0 | 65 | 13 | 6.5 | 3 | 0 | 0 | 0 |
| SO42− | 290 | 2000 | 400 | 200 | 100 | 561 | 561 | 281 |
| NO3− | 0 | 0 | 0 | 0 | 0 | 0 | 0 | 500 |
| TDS (g/L) | 80.68 | 39.34 | 7.87 | 3.93 | 1.97 | 4.52 | 7.73 | 4.80 |
| Ionic strength (mol/L) | 13.8 × 10⁻¹ | 6.65 × 10⁻¹ | 1.33 × 10⁻¹ | 6.66 × 10⁻² | 3.34 × 10⁻² | 7.81 × 10⁻² | 1.26 × 10⁻¹ | 7.77 × 10⁻² |
| Experiment | Reservoir-Formation | Core Plug * | Well Name | Measured Depth (ft) | Geological Position |
|---|---|---|---|---|---|
| 1, 2, 3 | Outcrop-Stevns Klint | A-1, A-2, A-3 | Outcrop | - | - |
| 4, 5, 6 | Dan-Ekofisk | B-1, B-2 | MFB-7 | 7399 | D1A Base |
| 7, 8, 9 | Dan-Tor | C-1 | MFF-19P | 8890 | M1B2 |
| Exp. | Core Plug | L (cm) | D (cm) | K (mD) | Φ (%) | PV (cc) | Swi (%) |
|---|---|---|---|---|---|---|---|
| 1 | A-1 | 1.57 | 3.66 | 3.04 | 47.4 | 07.8 | 22.1 |
| 2 | A-2 | 1.93 | 3.68 | 3.85 | 48.8 | 10.0 | 08.0 |
| 3 | A-3 | 1.58 | 3.65 | 3.77 | 50.8 | 08.4 | 22.4 |
| 4 | B-1 | 1.09 | 3.74 | 0.54 | 39.1 | 04.7 | 17.0 |
| 5 | B-2 | 1.08 | 3.76 | 0.64 | 42.5 | 05.1 | 19.6 |
| 6 | B-2 | 1.08 | 3.76 | 0.49 | 42.5 | 05.1 | 23.5 |
| 7 | C-1 | 1.54 | 3.79 | 1.13 | 36.4 | 06.3 | 21.7 |
| 8 | C-1 | 1.54 | 3.79 | 1.18 | 38.8 | 06.7 | 33.1 |
| 9 | C-1 | 1.54 | 3.79 | 1.27 | 38.8 | 06.7 | 35.1 |
| Core Material | Experiment | Injection Scenario |
|---|---|---|
| Stvens Klint | 1 | FW → SW → DSW (1/10) |
| 2 | FW → SW → DSW (1/5) → DSW (1/10) → DSW (1/20) | |
| 3 | FW → SW → DSW (1/5) → DSW (1/10) → DSW (1/20) | |
| Dan-Ekofisk | 4 | FW → SW → DSW (1/5) → DSW (1/10) → DSW (1/20) |
| 5 | SW → DSW (1/10) → DSW (1/10)+2S → DSW (1/10) + 2S + 4Mg | |
| 6 | DSW (1/10) → DSW (1/10) 500 ppm NO3 → SW → DSW (1/10) 500 ppm NO3 → FW | |
| Dan-Tor | 7 | SW → DSW (1/10) |
| 8 | DSW (1/10) → FW | |
| 9 | FW → DSW (1/10) |
| Formation | Experiment | Secondary Brine | RF (% IOIP) | Tertiary Brine | EOR (%IOIP) |
|---|---|---|---|---|---|
| Ekofisk | 4 | FW | 59.2 | SW | 1.7 |
| 5 | SW | 49.8 | DSW (1/10) | 4.9 | |
| 6 | DSW (1/10) | 59.1 | DSW (1/10) + NO32− | 0.0 | |
| Tor | 7 | SW | 69.6 | DSW (1/10) | 1.1 |
| 8 | DSW (1/10) | 85.4 | FW | 7.3 | |
| 9 | FW | 82.5 | DSW (1/10) | 0.0 |
| Brine | Experiment 5 | Experiment 6 | ||||
|---|---|---|---|---|---|---|
| Na | Mg | Ca | Na | Mg | Ca | |
| SW | 1% | −6% | 13% | 0% | −1% | 11% |
| DSW (1/10) | 7% | −2% | 66% | 2% | −5% | 94% |
| Fluid | Average X-ray Absorption Coefficient (cm−1) | Uncertainty |
|---|---|---|
| Formation water | 0.221 | 0.0045 |
| Crude oil | 0.176 | 0.0045 |
Publisher’s Note: MDPI stays neutral with regard to jurisdictional claims in published maps and institutional affiliations. |
© 2021 by the authors. Licensee MDPI, Basel, Switzerland. This article is an open access article distributed under the terms and conditions of the Creative Commons Attribution (CC BY) license (https://creativecommons.org/licenses/by/4.0/).
Share and Cite
Mohammadkhani, S.; Anabaraonye, B.U.; Afrough, A.; Mokhtari, R.; Feilberg, K.L. Crude Oil–Brine–Rock Interactions in Tight Chalk Reservoirs: An Experimental Study. Energies 2021, 14, 5360. https://doi.org/10.3390/en14175360
Mohammadkhani S, Anabaraonye BU, Afrough A, Mokhtari R, Feilberg KL. Crude Oil–Brine–Rock Interactions in Tight Chalk Reservoirs: An Experimental Study. Energies. 2021; 14(17):5360. https://doi.org/10.3390/en14175360
Chicago/Turabian StyleMohammadkhani, Samira, Benaiah U. Anabaraonye, Armin Afrough, Rasoul Mokhtari, and Karen Louise Feilberg. 2021. "Crude Oil–Brine–Rock Interactions in Tight Chalk Reservoirs: An Experimental Study" Energies 14, no. 17: 5360. https://doi.org/10.3390/en14175360
APA StyleMohammadkhani, S., Anabaraonye, B. U., Afrough, A., Mokhtari, R., & Feilberg, K. L. (2021). Crude Oil–Brine–Rock Interactions in Tight Chalk Reservoirs: An Experimental Study. Energies, 14(17), 5360. https://doi.org/10.3390/en14175360