Article

Concept of an Innovative Autonomous Unmanned System for Bathymetric Monitoring of Shallow Waterbodies (INNOBAT System)

1
Marine Technology Ltd., Wiktora Roszczynialskiego 4–6, 81-521 Gdynia, Poland
2
Department of Geodesy, Gdańsk University of Technology, Gabriela Narutowicza 11–12, 80-233 Gdańsk, Poland
3
Department of Geodesy and Oceanography, Gdynia Maritime University, Morska 81–87, 81-225 Gdynia, Poland
*
Author to whom correspondence should be addressed.
Energies 2021, 14(17), 5370; https://doi.org/10.3390/en14175370
Submission received: 19 July 2021 / Revised: 24 August 2021 / Accepted: 26 August 2021 / Published: 29 August 2021

Abstract

:
Bathymetry is a subset of hydrography, aimed at measuring the depth of waterbodies and waterways. Measurements are taken inter alia to detect natural obstacles or other navigational obstacles that endanger the safety of navigation, to examine the navigability conditions, anchorages, waterways and other commercial waterbodies, and to determine the parameters of the safe depth of waterbodies in the vicinity of ports, etc. Therefore, it is necessary to produce precise and reliable seabed maps, so that any hazards that may occur, particularly in shallow waterbodies, can be prevented, including the high dynamics of hydromorphological changes. This publication is aimed at developing a concept of an innovative autonomous unmanned system for bathymetric monitoring of shallow waterbodies. A bathymetric and topographic system will use autonomous unmanned aerial and surface vehicles to study the seabed relief in the littoral zone (even at depths of less than 1 m), in line with the requirements set out for the most stringent International Hydrographic Organization (IHO) order—exclusive. Unlike other existing solutions, the INNOBAT system will enable the coverage of the entire surveyed area with measurements, which will allow a comprehensive assessment of the hydrographic and navigation situation in the waterbody to be conducted.

1. Introduction

1.1. Effects of a Lack of Bathymetric Monitoring of Shallow Waterbodies

The aquatic environment is among the most rapidly changing regions on Earth. One element of these changes is the seabed relief [1]. This issue is addressed by hydrography, whose tasks include measuring the depth of waterbodies and watercourses. Bathymetric changes in waterbodies are mainly due to the transport of bottom sediments [2], turbidity currents [3], water level fluctuations, changes in the coastal morphology, artificial beach nourishment, coastal accumulation and erosion [4,5]. Knowledge of the current depth of a waterbody is particularly important for navigation in restricted areas, the construction of gas pipelines, the exploration of natural resources, national defense, scientific research, etc. [6,7]. Changes in the seabed relief are particularly noticeable in shallow waterbodies (at depths of several meters) where they can be of significance from the perspective of ship safety and environmental protection [8].
There are many waterbodies in which the impact on the aquatic environment and humans is evident. One of them is a waterbody adjacent to the Sopot pier [9]. An oceanographic phenomenon, unique at a national scale, which causes significant changes in seabed relief, has been noticed in this area. In Italian, the phenomenon is referred to as a “tombolo”, which means a narrow belt connecting the mainland with an island lying near the shore formed as a result of sand and gravel being deposited by sea currents [10]. Figure 1 shows an official bathymetric chart of 2011, which can be found on an electronic navigational chart (ENC), as well as a bathymetric chart of this waterbody developed by the team of the Department of Geodesy and Oceanography at the Gdynia Maritime University (GMU) using spatial data acquired during integrated geodetic, hydrographic and photogrammetric surveys and applying terrestrial laser scanning (TLS) technology [9].
Based on the comparative analysis in Figure 1a,b, it can be concluded that the tombolo oceanographic phenomenon that is taking place near the Sopot pier poses a navigational risk to motorized and sailing vessels moving in this area. As can be seen in Figure 1, in some places the depths are about 1–1.5 m and differ by almost 2 m from the bathymetric data (isobaths) from the 2011 ENC. Such discrepancies between the 2011 and 2019 bathymetric data may lead to inadvertent hull damage and measurement equipment of vessels sailing there. According to the research conducted in November 2018 [9], it was found that the developing tombolo phenomenon poses a threat to tourism in Sopot, and the lack of interference may result in significant changes in the beach structure in the future. Increasingly, the cyanobacteria blooming and other bacteria are noticeable in the resort, especially on the south-west side of the marina. Blooming causes the water to become cloudy and reduces the water clarity. The eutrophication of waterbodies is one of the most serious threats to the proper functioning of the marine ecosystem [11].
Another example of the absence of bathymetric monitoring of shallow waterbodies is the deep formed due to the extension of the beach between Brzeźno and Jelitkowo in Gdańsk in 2019. This was the first beach silting in this region since 2010, which resulted in the beach being extended by approx. 40 m. Based on an image taken by an unmanned aerial vehicle (UAV) and an interview conducted with a volunteer water rescue service (WOPR) lifeguard from the nearby beach, it can be concluded that, in the immediate proximity of the shore, there are sudden seabed faults with a depth of approx. 2.5 m. Despite this fact, the beach was approved for use without being properly marked to make a person entering the water aware of the possible hazard. Such negligence led to a tragedy in which two boys drowned. It appears that this accident probably resulted from the absence of accurate and periodical bathymetric monitoring of this waterbody.
From Poland’s economic and strategic perspective, the construction of the Nowy Świat navigable channel on the Vistula Spit is an important undertaking. The Vistula Spit cross-cut is supposed to enable, inter alia, sailing out to the Baltic Sea from the port in Elbląg without the need to cross the territory of Russia while shortening the existing route by approx. 100 km, and creating new jobs, which will undoubtedly contribute to the economic development of the entire north-eastern region of Poland. The channel is planned to be 1.1 km in length, 20 m in width and 5 m in depth, which will allow vessels of 100 m in length, 20 m in width and with a draft of up to 4 m to pass through it. Since the channel is to be navigated by ships for which the under-keel clearance may be less than 1 m, it is necessary to continuously monitor the seabed relief to ensure marine navigation safety.

1.2. Current State of Knowledge

Until recently, the measurement equipment and methods used commonly in hydrography, with the exception of very expensive bathymetric light detection and ranging (LiDAR) [12,13], were inadequately accurate and characterized by insufficient coverage of the seabed with measurements (Figure 2b). This often resulted in misinterpretation of the seabed relief and the processes taking place in the littoral zone, particularly in ultra-shallow waterbodies (with a depth of less than 1 m), such as accumulation or erosion [14,15]. The following measurement methods are currently used to measure the waterbody depth: analysis of high-resolution satellite images based on pixel radiometric values [16,17,18], depth estimation methods based on the image processing using photogrammetric measurement techniques [19,20,21,22,23,24], geodetic on the basis of real time kinematic (RTK) measurements using a global navigation satellite system (GNSS) receiver in the sea water (Figure 2a) [25,26] and tachymetric [14,27]. Apart from them, a commonly used method with a limited range of operation is the application of hydroacoustic devices, such as echo sounders or sonars, which are mounted on manned hydrographic vessels [11].
In conclusion of justifying the origins of the autonomous unmanned system for bathymetric monitoring, it should be noted that the main limitations in terms of the accurate determination of a shallow waterbody depth with high coverage of the seabed with measurements included:
  • Abandoning the performance of hydroacoustic sounding in ultra-shallow waterbodies using classical manned vehicles. This is due to their excessively deep draft (a minimum of 1 m), while their typical minimum safe operational depth is at a 2 m isobath. This results in the emergence of extensive areas for which no actual measurement data have been collected.
  • The existing methods for determining the bathymetry of waterbodies using high-resolution satellite images have a limited range of operation and can be applied only on medium depths with appropriate water transparency [28]. Moreover, as shown by the results of other studies [1,29], the accuracy of depth measurements using this method is unsatisfactory and amounts to 1–2 m (p = 0.95), therefore it may not meet the requirements provided for the most stringent IHO order—exclusive (horizontal position error ≤ 1 m (p = 0.95), vertical position error ≤ 0.15 m (p = 0.95)) [30].
  • Incorrect bathymetric monitoring of shallow waterbodies can result in an adverse impact on the aquatic environment and humans. This was demonstrated using the example of three waterbodies: one adjacent to the Sopot pier [9,11], the deep formed due to the extension of the beach between Brzeźno and Jelitkowo in Gdańsk and the Nowy Świat navigable channel on the Vistula Spit.
Section 2 describes measurement methods (UAV, unmanned surface vehicle (USV) and LiDAR) that will be used to create an innovative autonomous unmanned system for bathymetric monitoring of shallow waterbodies (INNOBAT system). In addition, this chapter presents how the data recorded by the INNOBAT system will be processed. The results section shows preliminary research, which demonstrated that multi-sensor data integration enabled the performance of bathymetric surveys on shallow waterbodies in an accurate and precise manner. Moreover, Section 3 presents the concept of an innovative autonomous unmanned system for bathymetric monitoring of shallow waterbodies, including a concept of an optoelectronic module dedicated for an UAV, which will allow photogrammetric surveys in the coastal zone to be conducted. In discussion section, existing solutions similar to the INNOBAT system were made, such as Leica Chiroptera 4X Bathymetric & Topographic LiDAR. In Section 5, potential application areas of this system were discussed. Finally, in Appendix A, the hardware configuration of the INNOBAT system meets the accuracy requirements set out for the most stringent International Hydrographic Organization (IHO) order—exclusive, was proposed.

2. Materials and Methods

2.1. Measurement Aspect

To develop a prototype of a system for bathymetric monitoring of shallow waterbodies that uses autonomous unmanned aerial and surface measurement platforms, two main research aspects should be considered:
  • The measurement aspect, which involves the most optimal selection of appropriate techniques for acquiring hydrographic and photogrammetric data to ensure the required accuracy of their implementation [30,31].
  • Data fusion, which includes the whole range of issues related to the analytical processing of measurement data. The data obtained from a few sensors, i.e., an UAV, USV and LiDAR will be integrated [32,33].
Although the scientific part related to the processing of the acquired data will largely determine the scientific value of the system under development, it appears that a much more complex issue is the performance of hydrographic and photogrammetric surveys in the coastal zone, which, as described in Section 1.2, poses a serious performance problem. Hence, it seems justified to make a detailed description of the research planned in this regard.
Over the last few years, there has been a very rapid development of measurement techniques involving the use of both unmanned aerial and surface vehicles (autonomously moving drones characterized by small dimensions). It has become the basis for recognizing that an autonomous unmanned system for bathymetric monitoring of shallow waterbodies can be developed using the currently available research tools. However, bathymetry estimation methods are subject to errors (non-linear distortions) due to the wave refraction phenomenon [34] that occurs in the water environment, so it is necessary to eliminate the refraction effect at the water-air interface in the photogrammetric processing [35]. The decisive solutions enabling a positive conclusion of the proposed study include:
  • The emergence of UAVs equipped inter alia with high-resolution aerial cameras (e.g., Zenmuse Z30 DJI) and precise navigation and positioning systems (e.g., D-RTK GNSS) has enabled the performance of photogrammetric surveys in the coastal zone.
  • The emergence of USVs equipped inter alia with shallow-water miniature MultiBeam EchoSounders (MBESs) (e.g., Picotech PicoMB-120) and GNSS geodetic receivers (e.g., Trimble R10) has enabled the performance of hydrographic surveys in ultra-shallow waterbodies.
  • The development of LiDAR technology has enabled the accurate and rapid surveying of three-dimensional coordinates of the terrain relief. Depending on the application, laser scanning can be divided into three types: airborne laser scanning (ALS), mobile laser scanning (MLS) and TLS. The former two of the above-listed scanning types can be used while performing geodetic and photogrammetric surveys in the coastal zone.
To conduct the proposed study, there are plans to apply and integrate, in measurement terms, two technical solutions whose development began as late as in the second decade of the 21st century, i.e., UAVs, USVs and LiDAR technology. These will enable the bathymetric monitoring of shallow waterbodies with appropriate accuracy and its coverage. It is planned to carry out the measurements in two major geospatial aspects:
  • Photogrammetric—which is aimed at determining the beach surface relief and the coastline course based on 3D land modelling using an UAV and TLS.
  • In the period preceding the introduction of photogrammetry for the needs of geodesy and cartography, the determination of the terrain relief was carried out with the use of classical measurement techniques, which include levelling or tachymetry. Despite the high accuracy of the survey, these methods were characterized by a low (point) coverage of the terrain with measurements [36], as a result of which continuous surface approximations were made in the form of grid or triangulated irregular network (TIN) models [37]. Recently, there has been a rapid development related to the geospatial data acquisition using techniques of ALS, MLS and TLS, as well as aerial, low ceiling and satellite photogrammetry [31]. Thanks to the dense point clouds recorded in this way, it is possible to create three-dimensional models of the environment that accurately reflect the geometry of spatial objects [38]. Particularly noteworthy is the growing interest in UAVs equipped with compact or photogrammetric cameras for examining the terrain relief. Their growing popularity is mainly due to the relatively low cost of measurement equipment compared to e.g., LiDAR [39]. As a result, UAVs have found wide application in many fields of natural science such as: agriculture [40], archeology and architecture [41,42], emergency management [43], environmental monitoring [44], forestry [45], geodesy [46], geology [47], shallow water bathymetry [19,48] as well as traffic monitoring [49].
  • Hydrographic—which is aimed at determining seabed relief. To this end, hydroacoustic sounding should be performed (in an optimal way in terms of the selection of research tools and measurement methods). As regards shallow waterbodies and those with high dynamics of hydromorphological changes, it appears reasonable to use a low-draft USV.
  • Bathymetric surveys on shallow waterbodies which, in hydrographic terms, is a specific waterbody characterized by the presence of very small depths (of less than 1 m) and a great variability of the seabed relief. Hence, the conditions prevailing there can significantly hinder or even prevent the implementation of hydrographic operations [50]. In particular, this applies to manned hydrographic vessels that are too submerged in shallow waters and there is a possibility of damaging the expensive hydroacoustic equipment. For the above reasons, it appears that the use of USVs on shallow waterbodies is optimal [51]. Owing to their unprecedented functionalities, USVs are widely used in numerous measurement applications. These include, among others, autonomous navigation [52], environmental monitoring [53], geology [54], hydrographic surveys of inland and marine waters [55] with depths of less than 1 m [56], military and maritime security operations [57], submarine protection signals, transmission between air and underwater vehicles [58], as well as underwater photogrammetry [59].
  • Depending on the unmanned vehicle’s size and displacement, it is the equipment that plays an important role. It is common to install single beam echo sounder (SBES) transducers, which are small-sized and usually require no use of motion reference units (MRUs), on vehicles of this type. Recently, it has also been possible to install, on a hydrographic drone, a miniature MBES whose swath width is usually 3 to 4 times the depth under the transducer head [60]. In addition to a depth measuring instrument, it is necessary to have a GNSS receiver for determining geographic coordinates for the measured depths. Additional devices that can be installed on USVs include LiDAR, radar, sonar, sound velocity profiler (SVP) and sound velocity sensor (SVS), underwater camera, etc. [61].
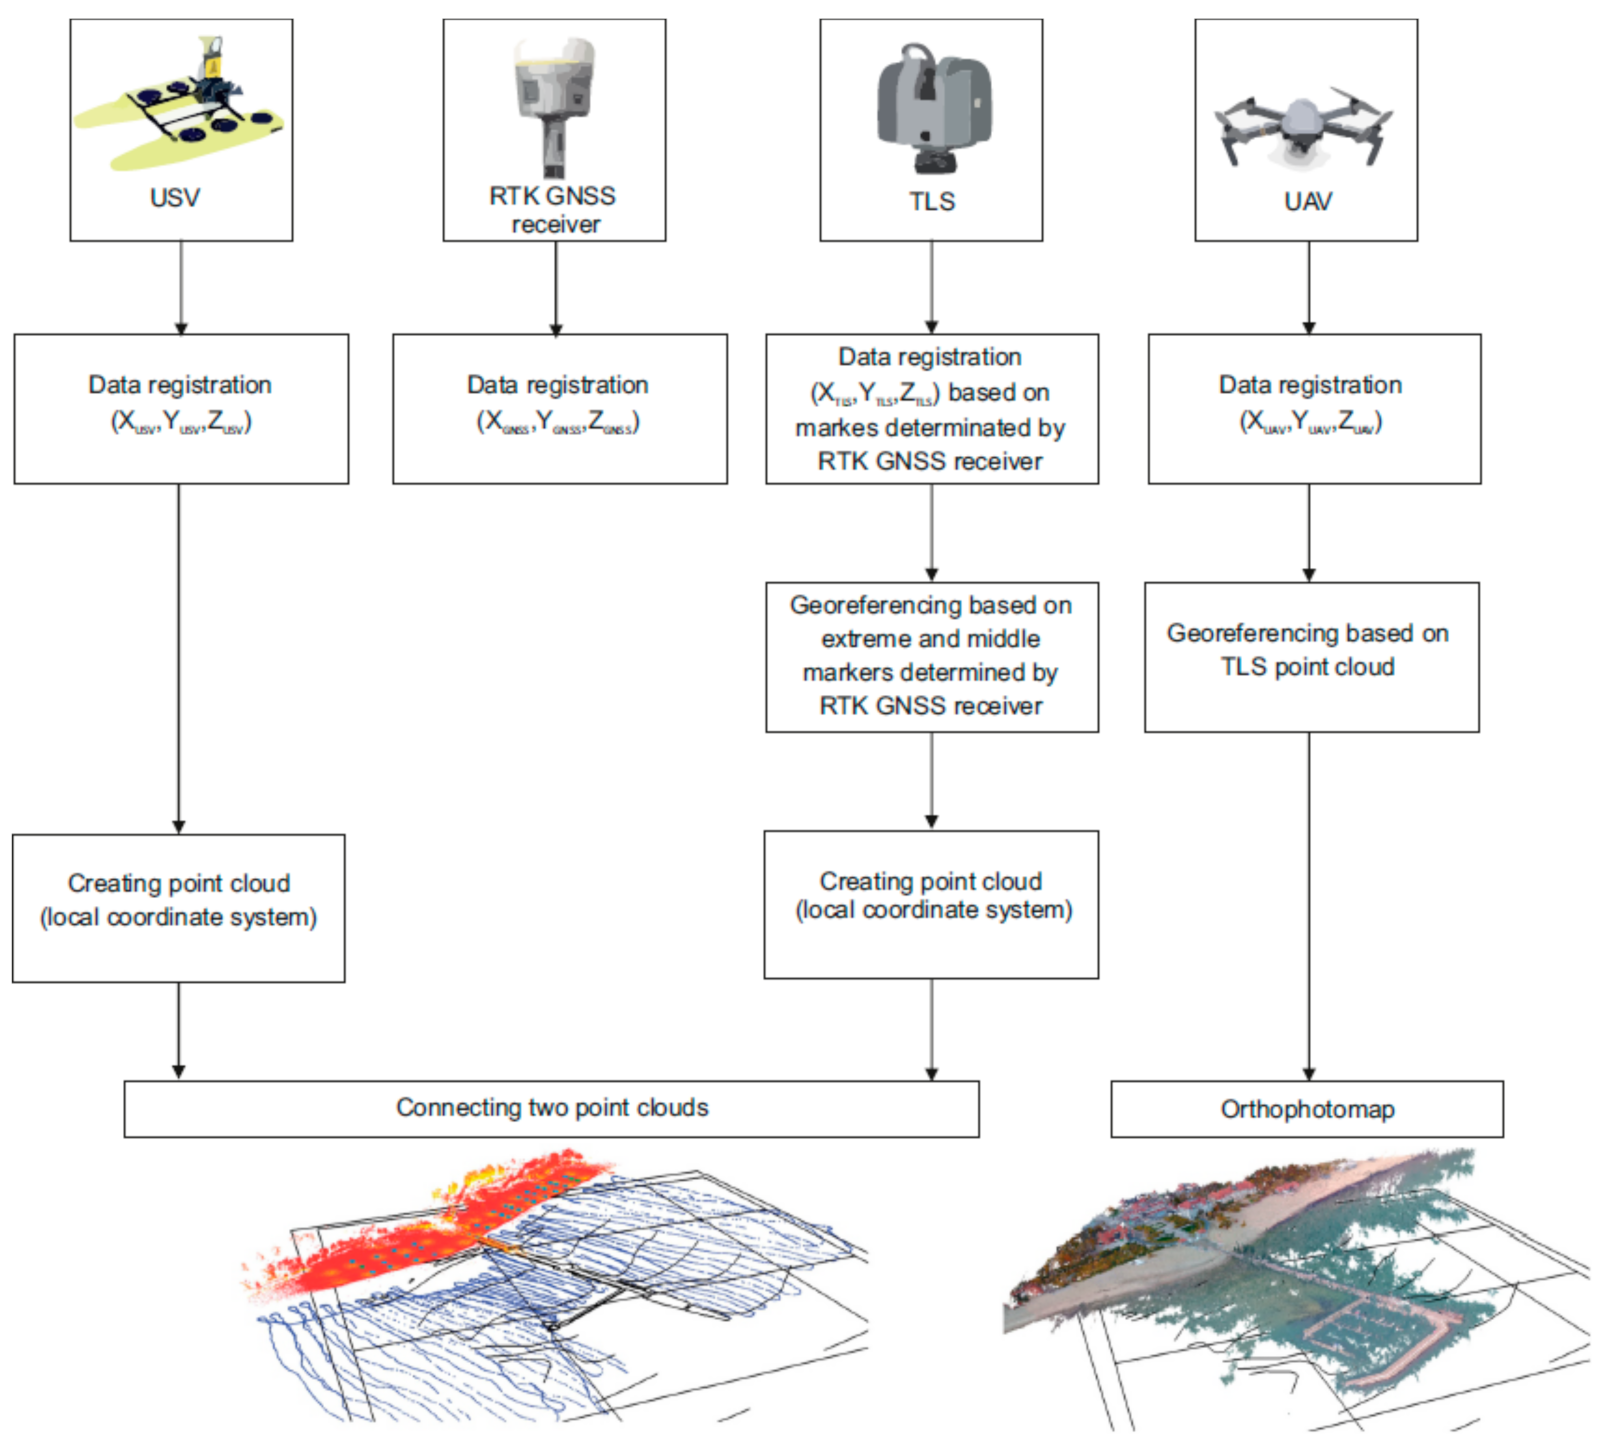
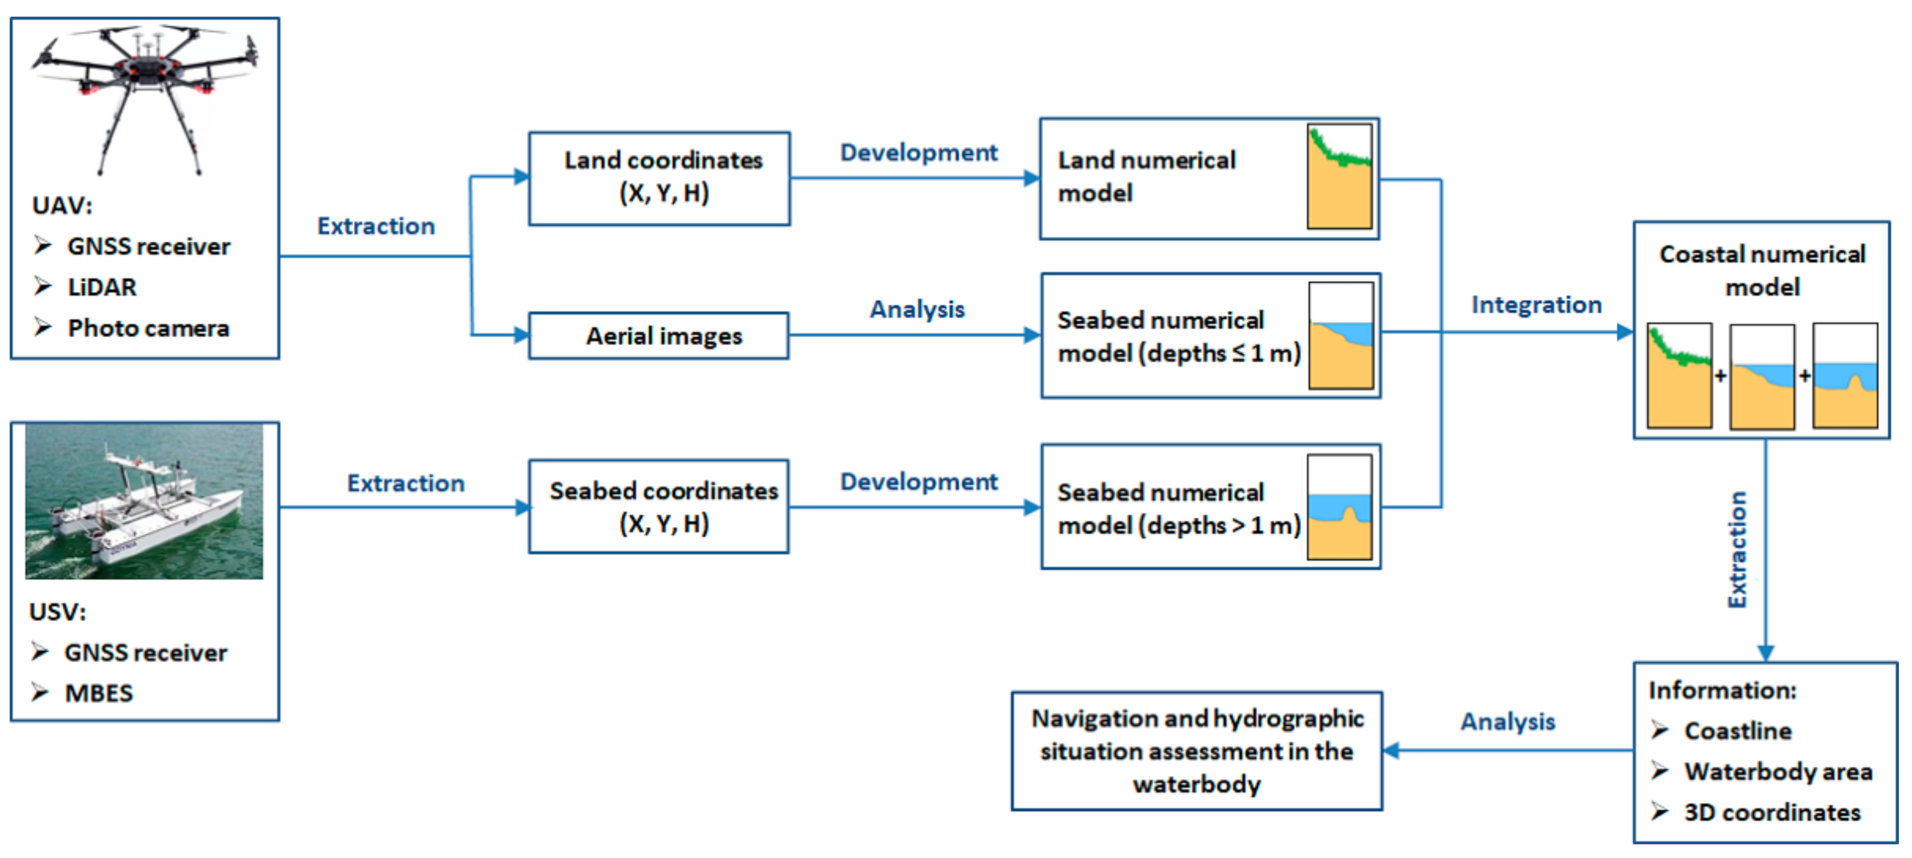
2.2. Data Fusion

The second research aspect is data fusion [62], i.e., a synergic combination of information derived from different, physically separated sensors into a coherent whole. It will be carried out in three stages. In the first place, the integration of the hydrographic and photogrammetric data recorded by an UAV (three-dimensional coordinates of the land, images), an USV (three-dimensional coordinates of the seabed) and LiDAR technology (three-dimensional coordinates of the land) will be performed. Multi-sensor data fusion will be carried out based on the application of statistical methods such as Kalman filtering and probabilistic techniques that include Bayesian networks. Such fusion is widely used in hydrographic measurement systems. The Kalman Filter (KF), the most commonly used filter in linear Gaussian systems, is the optimal method with respect to the criteria of minimum mean square error, max likelihood and max posterior. However, in a nonlinear system, the KF may diverge.
In addition to numerical methods, artificial neural networks (ANNs) will be used during the hydrographic and photogrammetric data processing. ANNs perform a nonlinear transformation by the definition. Of particular interest are ideas for using artificial neural networks. Recorded images correlated with positions constitute the learning sequence of an ANN. The learning process takes place beforehand and can take any length of time. While using the learned network, the dynamically registered images are continuously fed to the input of the network, and the network interpolates the position based on recognized images closest to the analyzed image. The advantage of this method is that the network is learned using real images with their distortions and noise. Thus, the learning sequence contains images analogous to those that will be used in practice. The main problem of this method is the necessity of prior registration of many real images in different hydrometeorological conditions and their compression and processing. After the compression of the analyzed image, the learning sequence of the neural network designed to plot the vehicle position is built. The task of the network will be to construct a mapping function associating the analyzed image with the position. The basic problem of this method is the necessity of prior registration of many real images in different hydrometeorological conditions. The registered images should be digitally processed, especially the compression. After the compression of the analyzed image, the learning sequence of the neural network designed for image fusion is built. The task of the network will be to construct a mapping function associating the analyzed image with a position. One processing method is to encode the image using a Kohonen network and then feed the encoded vector to the general regression neural networks (GRNN) input [63].
Another step is the so-called image fusion acquired using various measurement methods, whose aim is to prepare the final cartographic image and necessary information for a specific application. This involves superimposing the generated cartographic images. To this end, two methods of image transformation, i.e., the addition and extraction, will be applied. The former involves the combination of images derived from different sensors using the “pixel-by-pixel” analysis [64]. On the other hand, image extraction will enable the acquisition of information that is of importance from the perspective of navigation and hydrographic situation assessment, including the coastline course, three-dimensional position coordinates, the waterbody area, etc. In addition to the above-mentioned methods of image transformation, the following algorithms can be used as an alternative: high-resolution analysis, hierarchical image decomposition, pyramid method, principal component analysis (PCA), wavelet transform or fuzzy logic [65,66].
In the third stage (information fusion) [67], based on the final digital terrain model (DTM) of the coastal zone and the acquired information, an assessment of the navigation and hydrographic situation in a shallow waterbody will be possible. These will help, inter alia, in the examination of navigability conditions, anchorages, waterways and other commercial waterbodies and to determine the parameters of the safe depth of waterbodies in the vicinity of ports and in decision-making.

3. Results

3.1. Preliminary Research

In November 2019, the research team conducted preliminary research for an application to the National Center for Research and Development (NCBR) for funding the research project “Innovative autonomous unmanned system for bathymetric monitoring of shallow waterbodies” under the LDIER XI program. The research demonstrated that multi-sensor data integration enabled the performance of bathymetric surveys on shallow waterbodies in an accurate and precise manner while meeting the requirements provided for the IHO exclusive order. It was also found that the main difficulty was to determine the depth between the shallow waterbody coastline and the minimum isobath recorded by the echo sounder (the area is lacking actual measurement data). Examples of hydrographic and photogrammetric measurement results are shown in Figure 3a.
The data integration method [68] was developed on the basis of the tombolo (salient) measurement campaign in Sopot in 2019, during which land GNSS measurements, laser scanning, hydrographic [11] and photogrammetric [69] surveys were performed. The authors clearly indicate the indeterminacy problem of geodetic and hydrographic coordinate systems in data integration. For this reason, they describe the mathematical procedures very precisely to transform the geospatial data to a homogeneous reference system, and then, based on measurements, verify them. The activities presented are necessary for data integration from various devices. A simplified diagram of data integration is presented in Figure 4. The most important aspects of data harmonization are described in a further part of the method analysis.
The harmonization of three-dimensional data sets [70] includes the determination of the scale factor, three rotation angles around the three axes of the coordinate system and the translation vector, taking into account the transformation of the height coordinates of three-dimensional sets. In 3D space, rotations around axes are performed by means of elementary rotation matrices [71], which are functions of rotation angles around selected axes of coordinate systems [72]. The harmonization of three-dimensional data without deviations from the vertical is implemented by the following formulas [68]:
x = x cos θ y sin θ + T X ,
y = x sin θ + y cos θ + T Y ,
z = z + T Z ,
where:
x , y , z —point coordinates in the local based coordinate system X , Y , Z ,
x , y , z —point coordinates in the local modified coordinate system X , Y , Z ,
θ —rotation angle,
T X , T Y , T Z —three-dimensional coordinates of the translation vector.
However, the formula for harmonizing geospatial data with the stated deviation of their numerical representation from the vertical [68]:
R = U Λ V T ,
where:
R —rotation matrix,
U , V T —partial rotation matrices,
Λ —scaling matrix.
On the basis of mathematical assumptions, the three-dimensional data georeferencing [73] was started to a specific coordinate system. The Polish national PL-2000 plane coordinate system and the normal height system are target coordinate systems for the whole geodetic harmonization process. The first data compiled came from the TLS. Before starting the georeferencing process, point clouds in an undefined local coordinate system were registered. Combining scans into one point cloud is an element required before proper data georeferencing. TLS point cloud georeferencing was carried out with the use of extreme and middle markers obtained from land GNSS measurements. The next step was to metric control of both the TLS point cloud and the obtained results of GNSS measurements as a result of which scale change coefficients were obtained. Then the rotation matrix and the translation vector were calculated. The characteristic point coordinates were compared to the coordinates obtained from land GNSS measurements. The deviation values indicated a very small harmonization error in the horizontal plane, which clearly confirms the effectiveness of the method.
The next set of geospatial data, the coordinates of which were transformed to the PL-2000 plane coordinate system and the normal height system, came from UAV surveys. The obtained point cloud generated from the photogrammetric model was originally georeferenced, but its large inaccuracy forced a change in the location of points. Therefore, the TLS cloud was adopted as a reference object against the UAV cloud. The main aim was to determine the transformation parameters from both clouds (TLS and UAV), from which control points were calculated. At the stage of data processing, the analysis of the linear relationships of the iterative closest point (ICP) method [74,75] proved the existence of a scale difference in the spatial sets of both clouds. Therefore, the singular value decomposition (SVD) method [76] was used to obtain the components of rotation matrices, from which in the next step the rotation angles around the X , Y , Z axes were determined. The translation vector was successively calculated. The last step was the spatial operation of rotation taking into account the V OFF vector is expressed by the following formula [68]:
P I = U Λ V T P I I + V O F F V O F F ,
where:
P I —adjustment point coordinates in the corrected coordinate system,
P I I —adjustment point coordinates in the corrected coordinate system after rotation,
V O F F —offset vector.
The bathymetric data were assigned coordinates from land GNSS measurements and depths recorded by the echo sounder were obtained in the target coordinate system. The transformations carried out on real data confirmed the effectiveness of the mathematical procedures used in the harmonization of three-dimensional data.

3.2. Concept of an Innovative Autonomous Unmanned System for Bathymetric Monitoring of Shallow Waterbodies (INNOBAT System)

The final effect of the implementation of the proposed research will be the INNOBAT system, i.e., an integrated system using autonomous unmanned aerial and surface vehicles and designed for bathymetric monitoring in the coastal zone. It will enable the examination of the seabed relief in line with the requirements set out for the most stringent IHO order—exclusive. The research will use autonomous unmanned measurement platforms, i.e., aerial and surface vehicles that move independently (without human involvement) along strictly planned routes. Bathymetric surveys using UAVs and USVs will be performed on shallow waterbodies, i.e., on areas with a depth of up to several meters.
The bathymetric and topographic system will enable, as compared to other existing solutions, the accurate and precise measurement of the entire coastal relief based on the data acquired using a photogrammetric camera, LiDAR and a GNSS receiver that will be installed on a UAV and using a MBES and a GNSS receiver that will be mounted on an USV. LiDAR data will enable the development of a digital land model. The images taken using a photogrammetric camera will enable the determination of both the waterbody coastline course and the depth of the waterbody between the coastline and the minimum isobath recorded by an echo sounder installed on an USV. Due to errors resulting from the refraction phenomenon in the water environment, a technique will be developed and analyzed to eliminate the above-mentioned abnormalities. Exemplary solutions to the problem may be based on the design and measurement of ground control points (GCPs) under the water surface [35] or/and based on the DTM construction with calculations allowing to determine the refraction correction of the depth [77]. The remaining part of the seabed will be measured using an integrated hydrographic system (GNSS receiver + MBES) mounted on an USV. Further on, the image transformation methods of addition and extraction will be applied to develop the final DTM of the coastal zone, which will enable an assessment of the hydrographic and navigation situation in the shallow waterbody (Figure 5).
The dedicated solutions represented by the sector involved in the distribution and production of unmanned vehicles appear to be insufficient, since they are not adapted, in terms of functionality and assembly, to the performance of photogrammetric surveys in the coastal zone. Therefore, it is planned to design a suitable optoelectronic module for the measurement equipment and the required accessories to allow the assumed research to be conducted (Figure 6).
The optoelectronic module will be located under the UAV landing gear using a special platform. It will be made of a bidirectional carbon fiber reinforced polymer (CFRP) composite material, characterized by high strength and low weight. The platform will be attached to the drone’s structural elements using mounting brackets with clamps. Such a solution will provide the structure with sufficiently high durability, stiffness and strength. The optoelectronic module with its construction elements will be designed with the appropriate weight distribution and center of gravity position. This will make it possible to eliminate the negative impact of the system on the functioning of the UAV during the flight. The entire system will not exceed 5 kg, which will enable its installation on commercially available drones, thus increasing the universality of the described solution.
The presented module will consist of two separate segments. The first one will be placed under the platform and will contain a camera placed on a 3-axis gimbal. The use of this type of stabilization will allow to eliminate the negative impact of oscillations and vibrations during the flight and thus to correctly take aerial photos. The second segment will be the case with a frame surrounding it. The division into segments will enable easy disassembly and the possibility of using the optoelectronic module in other solutions. The main task of the described case will be to protect the measurement equipment contained in it against weather conditions. This equipment includes an on-board computer with a data storage device responsible for collecting and pre-processing information from measurement devices, a set of batteries and converters powering the measurement equipment, as well as auxiliary communication modules that will allow the operator to view the parameters in real time. The dimensions of the case are 160 mm x 110 mm x 60 mm. Its size and shape are determined by the elements that will be placed in it. The LiDAR and the GNSS/INS system will be located on the external frame of the described case using fastening threads. The antenna masts of 50 cm long will be placed on the sides of the frame. The measuring elements located outside the case will be connected via appropriate cables to the inside of the box, using specially adapted, waterproof connectors and sockets. This solution will ensure safety for the measurement equipment if the weather conditions deteriorate during the test.
In order to increase the comfort of use, the set of batteries used will be located on the side of the box, in a mount that allows the replacement of discharged cells with new ones, without the need to open the box itself. This solution will allow the operator, after the first set of batteries is discharged, to easily and quickly replace them and continue the mission without having to disassemble the entire module or wait for the cells to be charged.
For the purposes of this article, the hardware configuration of the INNOBAT system meets the accuracy requirements set out for the most stringent IHO order—exclusive, was proposed in Table A1. The exemplary hardware configuration was based on an analysis of the geodetic and hydrographic equipment market [78,79,80,81,82,83].

4. Discussion

The proposed solution is an innovative product with no equivalent in either the domestic or foreign markets. A system that is most closely related, in functionality terms, is Leica Chiroptera 4X Bathymetric & Topographic LiDAR distributed by a Swiss company Leica Geosystems [84]. As compared to the INNOBAT system, this solution is much more expensive due to the high price of a bathymetric LiDAR and the need to carry out photogrammetric surveys using a manned aerial vehicle.
In addition, unlike the Leica Chiroptera 4X Bathymetric & Topographic LiDAR, the INNOBAT system meets the accuracy requirements set out for the most stringent IHO order—exclusive (horizontal position error ≤ 1 m (p = 0.95), vertical position error ≤ 0.15 m (p = 0.95)), according to which bathymetric surveys should be carried out in the coastal zone [30]. As for the system developed by Leica, the depth measurement error ranges from 0.15 to 0.35 m (p = 0.95) with an assumed appropriate water transparency. Based on the manufacturer’s technical specification, it follows that the diffuse attenuation coefficient (Kd(λ)) that is used to characterize the penetration of light into natural waters should be 0.1–0.3 to ensure the highest (assumed) testing accuracy [84]. For example, as shown by the results of other studies [85,86], the Kd(λ) coefficient ranges from 0.2 and 1.0 within the Baltic Sea, so there is no 100% guarantee that the recommended accuracy of the depth measurement using bathymetric LiDAR will be obtained.
Another significant disadvantage of the existing solution is that it has a limited range of operation which allows hydrographic surveys to be conducted to a max depth (m), ranging from 2.7/Kd(λ) to 4/Kd(λ) [84]. On the other hand, the INNOBAT system will allow the whole area to be covered with measurements using autonomous unmanned aerial and surface vehicles.
Moreover, the bathymetric and topographic system will include the following novelty elements as compared to the existing solutions:
  • A new methodology of acquiring hydrographic and photogrammetric data using two autonomous unmanned (aerial and surface) measurement platforms in the coastal zone.
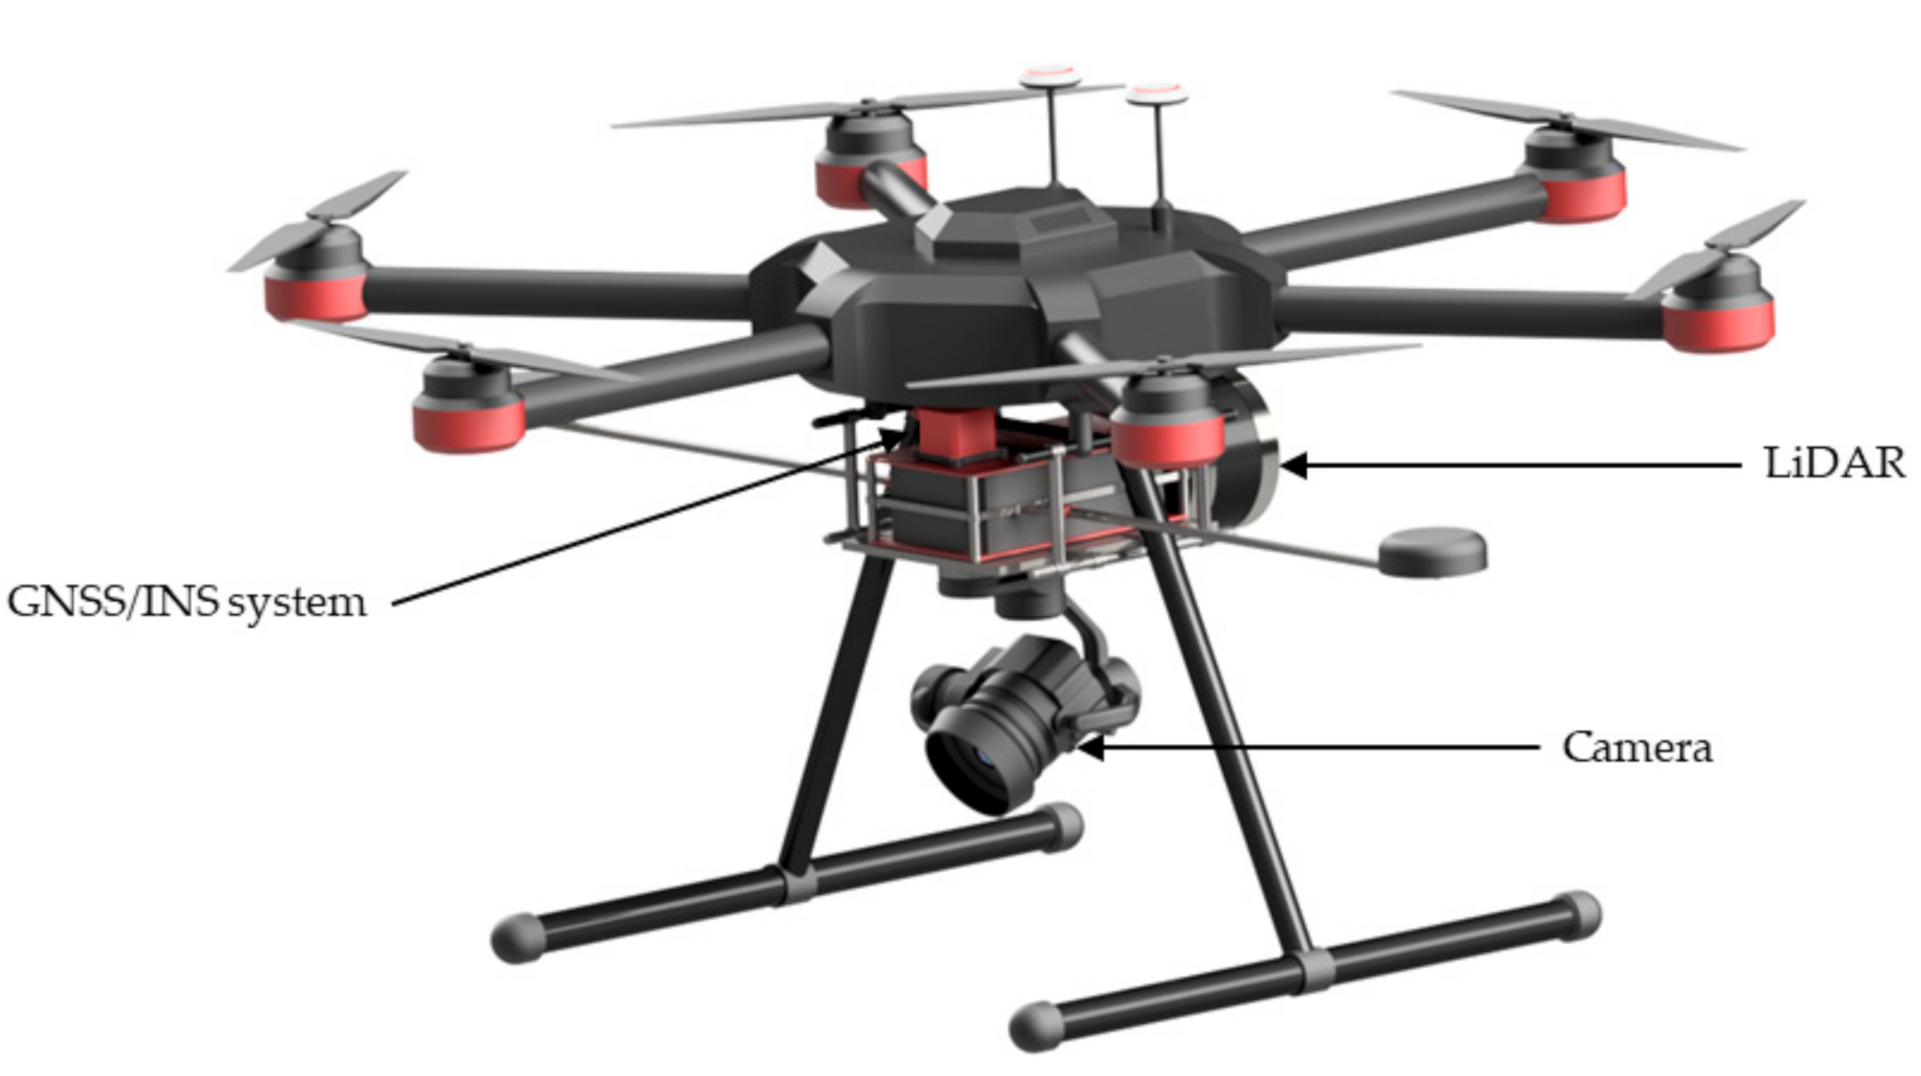
  • A prototype of an optoelectronic module dedicated for an UAV, which will allow photogrammetric surveys in the coastal zone to be conducted.
  • A method for determining the depth of shallow waterbodies based on point clouds obtained in the image processing taken by UAV using a combination of multi-view stereo (MVS) and structure from motion (SfM) techniques. The method will take into account the need for eliminate errors caused by the refraction phenomenon in the water environment during the image processing and will meet the accuracy requirements set out for the most stringent IHO order—exclusive.

5. Conclusions

This publication presents a concept of an innovative autonomous unmanned system for bathymetric monitoring of shallow waterbodies. The preliminary research from 2019 demonstrated that multi-sensor data integration enabled the performance of bathymetric surveys on shallow waterbodies in an accurate and precise manner while meeting the requirements provided for the IHO exclusive order. It was also found that the main difficulty was to determine the depth between the shallow waterbody coastline and the minimum isobath recorded by the echo sounder (the area is lacking actual measurement data).
On the other hand, as far as the potential recipients of services provided while using the system for bathymetric monitoring of shallow waterbodies are concerned, the following can be mentioned:
  • Investors in construction projects at harbor basins and inland waterbodies.
  • Hydrographic companies carrying out surveys on waterway sections, involved in the acquisition of measurement data.
  • Public administration offices, including Geodesy Bureau of Marshal Offices, Hydrographic Office of the Polish Navy, Maritime Offices, National Water Management Authority and Port Boards.
This is due to the need for conducting all hydrographic surveys (on a cyclical basis of approx. 5 years) which are related inter alia to the acceleration of the development of river information services (RIS) and investments in inland waterways after signing the European Agreement on Main Inland Waterways of International Importance (AGN) Convention by Poland in 2017. The most important investment in this regard include:
  • Adaptation of the Oder River Waterway to the parameters of class Va, along with construction of the Polish section of the Danube-Oder Canal and construction of the Silesian Canal.
  • Upgrading of the upper canalized section of the Vistula River Waterway to the parameters of class Va and construction of dams in Niepołomice and Podwale.
  • Lower and Middle Vistula River Cascade from Warsaw to Gdańsk.
  • Upgrading of the other sections of the shipping lanes E-40 and E-70.
  • Implementation of a harmonized RIS system on all waterways of international importance.
Moreover, on the waterbodies, the following are planned: the construction of the Central Port in Gdańsk and an External Port in Gdynia, the extension of the Świnoujście Liquefied Natural Gas (LNG) terminal and numerous other hydrotechnical investment projects including the Vistula Spit cross-cut. A particularly important measurement problem is the maintenance of the waterway to Elbląg. In addition, it is very important to update ENCs, including Inland ENCs (IENCs). The data obtained as a result of the operation of the INNOBAT system would allow to prevent the situation presented in Figure 1, i.e., a large difference in depth between the official ENC and the actual seabed relief [87,88,89,90].

Author Contributions

Conceptualization, M.S. and A.S.; data curation, O.L. and M.W.; investigation, S.W., O.L. and M.W.; methodology, M.S. and C.S.; supervision, A.S. and C.S.; visualization, S.W., O.L. and M.W.; writing—original draft, M.S. and A.S.; writing—review and editing, C.S. and S.W. All authors have read and agreed to the published version of the manuscript.

Funding

This research was funded by the National Centre for Research and Development in Poland, grant number LIDER/10/0030/L-11/19/NCBR/2020.

Institutional Review Board Statement

Not applicable.

Informed Consent Statement

Not applicable.

Data Availability Statement

Not applicable.

Conflicts of Interest

The authors declare no conflict of interest.

Appendix A

Table A1. Exemplary hardware configuration of the INNOBAT system. Own study based on: [56,57,58,59,60,61].
Measurement EquipmentMain Technical and Operating ParametersPhotograph
USV: HydroDronConstruction: floats from laminate and additional elements from stainless steel
Dimensions: 4 m × 2 m × 1–1.4 m
Draft: 0.25–0.5 m
Weight: 300 kg
Motor: 2× Torqeedo Cruise 4.0 RL
Speed: measuring (3–4 kn), cruising (6 kn), max (14 kn)
Autonomy: rechargeable batteries allowing to work up to 12 h at the measuring speed
Communication: remote control up to 40 km, on-board data transmission up to 6 km
Energies 14 05370 i001
Sonar: 3DSS-DX-450Dimensions: 98 mm (diameter) × 568 mm (length)
Weight: 8 kg
Operating frequency: 450 kHz
Horizontal beamwidth (two-way): 0.4°
Vertical beamwidth (selectable): 15–125°
Mechanical transducer tilt (fixed): 20°
Electronic transmit tilt: −45° to 45°
Max ping repetition rate: ~30 Hz
Data output: range and amplitude (2D), range, angle and amplitude (3D)
Max range: 200 m per side (2D), 100 m per side (3D)
Max resolution: 1.67 cm (2D and 3D)
Typical swath width: 10 to 20 times sonar altitude (2D), 6 to 14 times sonar altitude (3D)
Energies 14 05370 i002
UAV: DJI Matrice 600 PRODimensions: 1668 mm × 1518 mm × 727 mm
Weight (with 6× TB48S batteries): 10 kg
Max takeoff weight: 15.5 kg
Motor: DJI 6010
Speed: max descent (3 m/s), max ascent (5 m/s), wind resistance (8 m/s), max (65 km/h)
Max service ceiling above sea level: 2.5–4.5 km
Hovering time (with 6x TB48S batteries): no payload (38 min), 5.5 kg payload (18 min)
Supported DJI gimbals: Ronin-MX, Zenmuse Z30, Zenmuse X5/X5R, Zenmuse X3, Zenmuse XT, Zenmuse Z15 Series HD Gimbal: Z15-A7, Z15-BMPCC, Z15-5D III, Z15-GH4
Battery: 6x TB48S
Max transmission distance: 3.5–5 km
Energies 14 05370 i003
Camera: DJI Zenmuse Z30Dimensions: 152 mm × 137 mm × 61 mm
Weight: 556 g
Sensor: 1/2.8” CMOS, effective pixels: 2.13 Mpx
Lens: 30× optical zoom, F1.6 (wide)–F4.7 (tele), zoom movement speed: 1.8–6.4 s, focus movement time: ∞—near: 1.1 s
Field of view: 63.7° (wide)–2.3° (tele)
ISO range: 100–25600 (photo), 100–6400 (video)
Shutter speed: 1/30–1/6000 s
Still photography modes: single shot, burst shooting: 3/5 frames, interval (2/3/4/7/10/15/20/30 s)
Resolution: 1920 × 1080—Full HD (photo and video)
Format: JPEG (photo), MP4, MOV (video)
Energies 14 05370 i004
GNSS/INS system: SBG Ellipse-DDimensions: 46 mm × 45 mm × 32 mm
Weight: 65 g
Heading: dual antenna GNSS
Navigation: L1/L2 GNSS receiver
Roll/pitch accuracy (RMS): 0.03° (PPK), 0.05° (RTK), 0.1° (SP)
Heading accuracy (RMS): 0.1° (PPK), 0.2° (single and dual antenna)
Velocity accuracy (RMS): 0.3 m/s
Navigation accuracy (RMS): 1 cm + 1 ppm (RTK/PPK), 1 m (SBAS), 1.2 m (single point)
Energies 14 05370 i005
LiDAR: Velodyne PuckDimensions: 103.3 mm (diameter) × 71.7 mm (height)
Weight: 830 g
Channels: 16
Measurement range: 100 m
Range accuracy: ±3 cm (typical)
Field of view (vertical): +15.0° to −15.0° (30°)
Angular resolution (vertical): 2.0°
Field of view (horizontal): 360°
Angular resolution (horizontal/azimuth): 0.1–0.4°
Rotation rate: 5–20 Hz
Laser wavelength: 903 nm
3D LiDAR data points generated: ~300,000 PPS (single return mode), ~600,000 PPS (dual return mode)
Energies 14 05370 i006

References

  1. Yunus, A.P.; Dou, J.; Song, X.; Avtar, R. Improved bathymetric mapping of coastal and lake environments using Sentinel-2 and Landsat-8 images. Sensors 2019, 19, 2788. [Google Scholar] [CrossRef] [PubMed] [Green Version]
  2. Cooper, J.; Navas, F. Natural bathymetric change as a control on century-scale shoreline behavior. Geology 2004, 32, 513–516. [Google Scholar] [CrossRef]
  3. Clarke, J.E.H. First wide-angle view of channelized turbidity currents links migrating cyclic steps to flow characteristics. Nat. Commun. 2016, 7, 11896. [Google Scholar] [CrossRef]
  4. Saylam, K.; Brown, R.A.; Hupp, J.R. Assessment of depth and turbidity with airborne Lidar bathymetry and multiband satellite imagery in shallow water bodies of the Alaskan North Slope. Int. J. Appl. Earth Obs. Geoinf. 2017, 58, 191–200. [Google Scholar] [CrossRef]
  5. Smith, D.P.; Ruiz, G.; Kvitek, R.; Iampietro, P.J. Semiannual patterns of erosion and deposition in upper Monterey Canyon from serial multibeam bathymetry. GSA Bull. 2005, 117, 1123–1133. [Google Scholar] [CrossRef]
  6. Brando, V.E.; Anstee, J.M.; Wettle, M.; Dekker, A.G.; Phinn, S.R.; Roelfsema, C. A physics based retrieval and quality assessment of bathymetry from suboptimal hyperspectral data. Remote Sens. Environ. 2009, 113, 755–770. [Google Scholar] [CrossRef]
  7. Pacheco, A.; Horta, J.; Loureiro, C.; Ferreira, Ó. Retrieval of nearshore bathymetry from Landsat 8 images: A tool for coastal monitoring in shallow waters. Remote Sens. Environ. 2015, 159, 102–116. [Google Scholar] [CrossRef] [Green Version]
  8. Wlodarczyk-Sielicka, M.; Stateczny, A. Selection of SOM parameters for the needs of clusterization of data obtained by interferometric methods. In Proceedings of the 2015 16th International Radar Symposium (IRS 2015), Dresden, Germany, 24–26 June 2015. [Google Scholar] [CrossRef]
  9. Specht, M.; Specht, C.; Mindykowski, J.; Dąbrowski, P.; Maśnicki, R.; Makar, A. Geospatial modeling of the tombolo phenomenon in Sopot using integrated geodetic and hydrographic measurement methods. Remote Sens. 2020, 12, 737. [Google Scholar] [CrossRef] [Green Version]
  10. Mohamed, A.S. 2D and 1D Numerical Model Simulations for the Effect of a Single Detached Breakwater on the Shore. Master’s Thesis, Delft University of Technology, Delft, The Netherlands, 1997. [Google Scholar]
  11. Specht, C.; Lewicka, O.; Specht, M.; Dąbrowski, P.; Burdziakowski, P. Methodology for carrying out measurements of the tombolo geomorphic landform using unmanned aerial and surface vehicles near Sopot Pier, Poland. J. Mar. Sci. Eng. 2020, 8, 384. [Google Scholar] [CrossRef]
  12. Tonina, D.; McKean, J.A.; Benjankar, R.M.; Wright, C.W.; Goode, J.R.; Chen, Q.; Reeder, W.J.; Carmichael, R.A.; Edmondson, M.R. Mapping river bathymetries: Evaluating topobathymetric LiDAR survey. Earth Surf. Process. Landf. 2019, 44, 507–520. [Google Scholar] [CrossRef]
  13. Tysiac, P. Bringing bathymetry LiDAR to coastal zone assessment: A case study in the Southern Baltic. Remote Sens. 2020, 12, 3740. [Google Scholar] [CrossRef]
  14. Lane, S.N.; Richards, K.S.; Chandler, J.H. Developments in monitoring and modelling small-scale river bed topography. Earth Surf. Process. Landf. 1994, 19, 349–368. [Google Scholar] [CrossRef]
  15. Westaway, R.M.; Lane, S.N.; Hicks, D.M. Remote sensing of clear-water, shallow, gravel-bed rivers using digital photogrammetry. Photogramm. Eng. Remote Sens. 2001, 67, 1271–1282. [Google Scholar]
  16. Hogrefe, K.R.; Wright, D.J.; Hochberg, E.J. Derivation and integration of shallow-water bathymetry: Implications for coastal terrain modeling and subsequent analyses. Mar. Geod. 2008, 31, 299–317. [Google Scholar] [CrossRef]
  17. Kulawiak, M.; Chybicki, A. Application of Web-GIS and geovisual analytics to monitoring of seabed evolution in South Baltic Sea coastal areas. Mar. Geod. 2018, 41, 405–426. [Google Scholar] [CrossRef]
  18. Warnasuriya, T.W.S.; Gunaalan, K.; Gunasekara, S.S. Google Earth: A new resource for shoreline change estimation—Case study from Jaffna Peninsula, Sri Lanka. Mar. Geod. 2018, 41, 546–580. [Google Scholar] [CrossRef]
  19. Agrafiotis, P.; Skarlatos, D.; Georgopoulos, A.; Karantzalos, K. Shallow water bathymetry mapping from UAV imagery based on machine learning. Int. Arch. Photogramm. Remote Sens. Spat. Inf. Sci. 2019, XLII-2/W10, 9–16. [Google Scholar] [CrossRef] [Green Version]
  20. Bagheri, O.; Ghodsian, M.; Saadatseresht, M. Reach scale application of UAV+SFM method in shallow rivers hyperspatial bathymetry. Int. Arch. Photogramm. Remote Sens. Spat. Inf. Sci. 2015, 40, 77–81. [Google Scholar] [CrossRef] [Green Version]
  21. Hashimoto, K.; Shimozono, T.; Matsuba, Y.; Okabe, T. Unmanned aerial vehicle depth inversion to monitor river-mouth bar dynamics. Remote Sens. 2021, 13, 412. [Google Scholar] [CrossRef]
  22. Holman, R.; Plant, N.; Holland, T. cBathy: A robust algorithm for estimating nearshore bathymetry. J. Geophys. Res. Ocean. 2013, 118, 2595–2609. [Google Scholar] [CrossRef]
  23. Rossi, L.; Mammi, I.; Pelliccia, F. UAV-derived multispectral bathymetry. Remote Sens. 2020, 12, 3897. [Google Scholar] [CrossRef]
  24. Simarro, G.; Calvete, D.; Luque, P.; Orfila, A.; Ribas, F. UBathy: A new approach for bathymetric inversion from video imagery. Remote Sens. 2019, 11, 2722. [Google Scholar] [CrossRef] [Green Version]
  25. Baptista, P.; Bastos, L.; Bernardes, C.; Cunha, T.; Dias, J. Monitoring sandy shores morphologies by DGPS—A practical tool to generate digital elevation models. J. Coast. Res. 2008, 24, 1516–1528. [Google Scholar] [CrossRef]
  26. Specht, C.; Specht, M.; Cywiński, P.; Skóra, M.; Marchel, Ł.; Szychowski, P. A new method for determining the territorial sea baseline using an unmanned, hydrographic surface vessel. J. Coast. Res. 2019, 35, 925–936. [Google Scholar] [CrossRef]
  27. Koljonen, S.; Huusko, A.; Mäki-Petäys, A.; Louhi, P.; Muotka, T. Assessing habitat suitability for juvenile Atlantic salmon in relation to in-stream restoration and discharge variability. Restor. Ecol. 2012, 21, 344–352. [Google Scholar] [CrossRef]
  28. Kasvi, A.; Salmela, J.; Lotsari, E.; Kumpula, T.; Lane, S.N. Comparison of remote sensing based approaches for mapping bathymetry of shallow, clear water rivers. Geomorphology 2019, 33, 180–197. [Google Scholar] [CrossRef]
  29. Li, J.; Knapp, D.E.; Schill, S.R.; Roelfsema, C.; Phinn, S.; Silman, M.; Mascaro, J.; Asner, G.P. Adaptive bathymetry estimation for shallow coastal waters using Planet Dove satellites. Remote Sens. Environ. 2019, 232, 111302. [Google Scholar] [CrossRef]
  30. IHO. IHO Standards for Hydrographic Surveys, 6th ed.; IHO Publication No. 44; IHO: Monte Carlo, Monaco, 2020. [Google Scholar]
  31. Burdziakowski, P. Increasing the geometrical and interpretation quality of unmanned aerial vehicle photogrammetry products using super-resolution algorithms. Remote Sens. 2020, 12, 810. [Google Scholar] [CrossRef] [Green Version]
  32. Erena, M.; Atenza, J.F.; García-Galiano, S.; Domínguez, J.A.; Bernabé, J.M. Use of drones for the topo-bathymetric monitoring of the reservoirs of the Segura River Basin. Water 2019, 11, 445. [Google Scholar] [CrossRef] [Green Version]
  33. Nikolakopoulos, K.G.; Lampropoulou, P.; Fakiris, E.; Sardelianos, D.; Papatheodorou, G. Synergistic use of UAV and USV data and petrographic analyses for the investigation of beachrock formations: A case study from Syros Island, Aegean Sea, Greece. Minerals 2018, 8, 534. [Google Scholar] [CrossRef] [Green Version]
  34. Cao, B.; Fang, Y.; Jiang, Z.; Gao, L.; Hu, H. Shallow water bathymetry from Worldview-2 stereo imagery using two-media photogrammetry. Eur. J. Remote Sens. 2019, 52, 506–521. [Google Scholar] [CrossRef] [Green Version]
  35. David, C.G.; Kohl, N.; Casella, E.; Rovere, A.; Ballesteros, P.; Schlurmann, T. Structure-from-motion on shallow reefs and beaches: Potential and limitations of consumer-grade drones to reconstruct topography and bathymetry. Coral Reefs 2021, 40, 835–851. [Google Scholar] [CrossRef]
  36. Feng, Q.; Sjogren, P.; Stephansson, O.; Jing, L. Measuring fracture orientation at exposed rock faces by using a non-reflector total station. Eng. Geol. 2001, 59, 133–146. [Google Scholar] [CrossRef]
  37. Yang, B.; Shi, W.; Li, Q. An integrated TIN and GRID method for constructing multi-resolution digital terrain models. Int. J. Geogr. Inf. Sci. 2005, 19, 1019–1038. [Google Scholar] [CrossRef]
  38. Specht, C.; Dąbrowski, P.; Dumalski, A.; Hejbudzka, K. Modeling 3D objects for navigation purposes using laser scanning. TransNav Int. J. Mar. Navig. Saf. Sea Transp. 2016, 10, 301–306. [Google Scholar] [CrossRef]
  39. Fritz, A.; Kattenborn, T.; Koch, B. UAV-based photogrammetric point clouds—Tree stem mapping in open stands in comparison to terrestrial laser scanner point clouds. Int. Arch. Photogramm. Remote Sens. Spat. Inf. Sci. 2013, XL-1/W2, 141–146. [Google Scholar] [CrossRef] [Green Version]
  40. Bareth, G.; Bendig, J.; Tilly, N.; Hoffmeister, D.; Aasen, H.; Bolten, A. A comparison of UAV- and TLS-derived plant height for crop monitoring: Using polygon grids for the analysis of Crop Surface Models (CSMs). J. Photogramm. Remote Sens. Geoinf. Sci. 2016, 2016, 85–94. [Google Scholar] [CrossRef] [Green Version]
  41. Jizhou, W.; Zongjian, L.; Chengming, L. Reconstruction of buildings from a single UAV image. In Proceedings of the 20th International Society for Photogrammetry and Remote Sensing Congress (ISPRS 2004), Istanbul, Turkey, 12–23 July 2004. [Google Scholar]
  42. Saleri, R.; Cappellini, V.; Nony, N.; de Luca, L.; Pierrot-Deseilligny, M.; Bardiere, E.; Campi, M. UAV photogrammetry for archaeological survey: The theaters area of Pompeii. In Proceedings of the 2013 Digital Heritage International Congress (Digital Heritage 2013), Marseille, France, 28 October–1 November 2013. [Google Scholar]
  43. Tan, Y.; Li, Y. UAV photogrammetry-based 3D road distress detection. ISPRS Int. J. Geo-Inf. 2019, 8, 409. [Google Scholar] [CrossRef] [Green Version]
  44. Šašak, J.; Gallay, M.; Kaňuk, J.; Hofierka, J.; Minár, J. Combined use of terrestrial laser scanning and UAV photogrammetry in mapping Alpine terrain. Remote Sens. 2019, 11, 2154. [Google Scholar] [CrossRef] [Green Version]
  45. Wallace, L.O.; Lucieer, A.; Watson, C.S. Assessing the feasibility of UAV-based LiDAR for high resolution forest change detection. Int. Arch. Photogramm. Remote Sens. Spat. Inf. Sci. 2012, 39, 499–504. [Google Scholar] [CrossRef] [Green Version]
  46. Zanutta, A.; Lambertini, A.; Vittuari, L. UAV photogrammetry and ground surveys as a mapping tool for quickly monitoring shoreline and beach changes. J. Mar. Sci. Eng. 2020, 8, 52. [Google Scholar] [CrossRef] [Green Version]
  47. Ruggles, S.; Clark, J.; Franke, K.W.; Wolfe, D.; Reimschiissel, B.; Martin, R.A.; Okeson, T.J.; Hedengren, J.D. Comparison of SfM computer vision point clouds of a landslide derived from multiple small UAV platforms and sensors to a TLS based model. J. Unmanned Veh. Syst. 2016, 4, 246–265. [Google Scholar] [CrossRef]
  48. Agrafiotis, P.; Karantzalos, K.; Georgopoulos, A.; Skarlatos, D. Learning from synthetic data: Enhancing refraction correction accuracy for airborne image-based bathymetric mapping of shallow coastal waters. J. Photogramm. Remote Sens. Geoinf. Sci. 2021, 89, 91–109. [Google Scholar] [CrossRef]
  49. Ro, K.; Oh, J.S.; Dong, L. Lessons learned: Application of small UAV for urban highway traffic monitoring. In Proceedings of the 45th AIAA Aerospace Sciences Meeting and Exhibit, Reno, NV, USA, 8–11 January 2007. [Google Scholar]
  50. Specht, M.; Specht, C.; Wąż, M.; Naus, K.; Grządziel, A.; Iwen, D. Methodology for performing territorial sea baseline measurements in selected waterbodies of Poland. Appl. Sci. 2019, 9, 3053. [Google Scholar] [CrossRef] [Green Version]
  51. Specht, M.; Specht, C.; Lasota, H.; Cywiński, P. Assessment of the steering precision of a hydrographic Unmanned Surface Vessel (USV) along sounding profiles using a low-cost multi-Global Navigation Satellite System (GNSS) receiver supported autopilot. Sensors 2019, 19, 3939. [Google Scholar] [CrossRef] [Green Version]
  52. Naus, K.; Marchel, Ł. Use of a weighted ICP algorithm to precisely determine USV movement parameters. Appl. Sci. 2019, 9, 3530. [Google Scholar] [CrossRef] [Green Version]
  53. Liu, Z.; Zhang, Y.; Yu, X.; Yuan, C. Unmanned surface vehicles: An overview of developments and challenges. Annu. Rev. Control 2016, 41, 71–93. [Google Scholar] [CrossRef]
  54. Giordano, F.; Mattei, G.; Parente, C.; Peluso, F.; Santamaria, R. Integrating sensors into a marine drone for bathymetric 3D surveys in shallow waters. Sensors 2016, 16, 41. [Google Scholar] [CrossRef] [Green Version]
  55. Zwolak, K.; Wigley, R.; Bohan, A.; Zarayskaya, Y.; Bazhenova, E.; Dorshow, W.; Sumiyoshi, M.; Sattiabaruth, S.; Roperez, J.; Proctor, A.; et al. The autonomous underwater vehicle integrated with the unmanned surface vessel mapping the Southern Ionian Sea. The winning technology solution of the Shell Ocean Discovery XPRIZE. Remote Sens. 2020, 12, 1344. [Google Scholar] [CrossRef] [Green Version]
  56. Romano, A.; Duranti, P. Autonomous unmanned surface vessels for hydrographic measurement and environmental monitoring. In Proceedings of the FIG Working Week 2012, Rome, Italy, 6–10 May 2012. [Google Scholar]
  57. Strickland, J.D.; Devine, T. Unmanned surface vehicles: Realizations & applications. In Proceedings of the 11th Symposium on High Speed Marine Vehicles (HSMV 2017), Naples, Italy, 25–26 October 2017. [Google Scholar]
  58. Zhu, M.; Wen, Y.-Q. Design and analysis of collaborative unmanned surface-aerial vehicle cruise systems. J. Adv. Transport. 2019, 2019, 1323105. [Google Scholar] [CrossRef]
  59. Giordano, F.; Mattei, G.; Parente, C.; Peluso, F.; Santamaria, R. MicroVEGA (Micro Vessel for Geodetics Application): A marine drone for the acquisition of bathymetric data for GIS applications. Int. Arch. Photogramm. Remote Sens. Spat. Inf. Sci. 2015, XL-5-W5, 123–130. [Google Scholar] [CrossRef] [Green Version]
  60. Popielarczyk, D.; Templin, T.; Ciećko, A.; Grunwald, G. Application of GNSS and SBES techniques to investigate the Lake Suskie bottom shape. In Proceedings of the 16th International Multidisciplinary Scientific GeoConference (SGEM 2016), Albena, Bulgaria, 30 June–6 July 2016. [Google Scholar]
  61. Stateczny, A.; Kazimierski, W.; Burdziakowski, P.; Motyl, W.; Wisniewska, M. Shore construction detection by automotive radar for the needs of autonomous surface vehicle navigation. ISPRS Int. J. Geo-Inf. 2019, 8, 80. [Google Scholar] [CrossRef] [Green Version]
  62. Khaleghi, B.; Khamis, A.; Karray, F.O.; Razavi, S.N. Multisensor data fusion: A review of the state-of-the-art. Inf. Fusion 2013, 14, 28–44. [Google Scholar] [CrossRef]
  63. Stateczny, A.; Błaszczak-Bąk, W.; Sobieraj-Żłobińska, A.; Motyl, W.; Wisniewska, M. Methodology for processing of 3D multibeam sonar big data for comparative navigation. Remote Sens. 2019, 11, 2245. [Google Scholar] [CrossRef] [Green Version]
  64. Ribeiro, R.A.; Falcão, A.; Mora, A.; Fonseca, J.M. A fuzzy information fusion algorithm based on multi-criteria decision making. Knowl. Based Syst. 2014, 58, 23–32. [Google Scholar] [CrossRef]
  65. Dong, J.; Zhuang, D.; Huang, Y.; Fu, J. Advances in multi-sensor data fusion: Algorithms and applications. Sensors 2009, 9, 7771–7784. [Google Scholar] [CrossRef] [Green Version]
  66. Hsu, S.-L.; Gau, P.-W.; Wu, I.-L.; Jeng, J.-H. Region-based image fusion with artificial neural network. World Acad. Sci. Eng. Technol. 2009, 53, 156–159. [Google Scholar]
  67. Torra, V.; Narukawa, Y. Modeling Decisions: Information Fusion and Aggregation Operators; Springer: Berlin/Heidelberg, Germany, 2007. [Google Scholar]
  68. Dąbrowski, P.S.; Specht, C.; Specht, M.; Burdziakowski, P.; Makar, A.; Lewicka, O. Integration of multi-source geospatial data from GNSS receivers, terrestrial laser scanners, and unmanned aerial vehicles. Can. J. Remote Sens. 2021, 1–14. [Google Scholar] [CrossRef]
  69. Burdziakowski, P.; Specht, C.; Dabrowski, P.S.; Specht, M.; Lewicka, O.; Makar, A. Using UAV photogrammetry to analyse changes in the coastal zone based on the Sopot tombolo (salient) measurement project. Sensors 2020, 20, 4000. [Google Scholar] [CrossRef]
  70. EP; Council of the European Union. Directive 2007/2/EC of the European Parliament and of the Council of 14 March 2007 establishing an Infrastructure for Spatial Information in the European Community (INSPIRE). Available online: https://eur-lex.europa.eu/legal-content/EN/ALL/?uri=CELEX%3A32007L0002 (accessed on 24 August 2021).
  71. Vaníček, P.; Steeves, R.R. Transformation of coordinates between two horizontal geodetic datums. J. Geod. 1996, 70, 740–745. [Google Scholar] [CrossRef]
  72. Bronshtein, I.N.; Semendyayev, K.A.; Musiol, G.; Mühlig, H. Handbook of Mathematics, 6th ed.; Springer: Berlin/Heidelberg, Germany, 2015. [Google Scholar]
  73. Hackeloeer, A.; Klasing, K.; Krisp, J.M.; Meng, L. Georeferencing: A review of methods and applications. Ann. GIS 2014, 20, 61–69. [Google Scholar] [CrossRef]
  74. Besl, P.J.; McKay, N.D. A method for registration of 3-D shapes. IEEE Trans. Pattern Anal. Mach. Intell. 1992, 14, 239–256. [Google Scholar] [CrossRef]
  75. Zhang, Z. Iterative point matching for registration of free-form curves and surfaces. Int. J. Comput. Vis. 1994, 13, 119–152. [Google Scholar] [CrossRef]
  76. Arun, K.S.; Huang, T.S.; Blostein, S.D. Least-squares fitting of two 3-D point sets. IEEE Trans. Pattern Anal. Mach. Intell. 1987, 5, 698–700. [Google Scholar] [CrossRef] [PubMed] [Green Version]
  77. Woodget, A.S.; Carbonneau, P.E.; Visser, F.; Maddock, I.P. Quantifying submerged fluvial topography using hyperspatial resolution UAS imagery and structure from motion photogrammetry. Earth Surf. Process. Landf. 2015, 40, 47–64. [Google Scholar] [CrossRef] [Green Version]
  78. Marine Technology Ltd. HydroDron. Available online: https://marinetechnology.pl/hydrodron/ (accessed on 24 August 2021).
  79. Ping DSP Inc. 3DSS-DX-450. Available online: https://www.pingdsp.com/3DSS-DX-450 (accessed on 24 August 2021).
  80. SBG Systems. Ellipse-D. Available online: https://www.sbg-systems.com/products/ellipse-series/#ellipse-d_rtk_gnss_ins (accessed on 24 August 2021).
  81. SZ DJI Technology Co., Ltd. MATRICE 600 PRO Specs. Available online: https://www.dji.com/pl/matrice600-pro/info#specs (accessed on 24 August 2021).
  82. SZ DJI Technology Co., Ltd. ZENMUSE Z30 Specs. Available online: https://www.dji.com/pl/zenmuse-z30/info#specs (accessed on 24 August 2021).
  83. Velodyne Lidar. PUCK. Available online: https://velodynelidar.com/products/puck/ (accessed on 24 August 2021).
  84. Leica Geosystems. Leica Chiroptera 4X Bathymetric & Topographic LiDAR. Available online: https://leica-geosystems.com/es-es/products/airborne-systems/bathymetric-lidar-sensors/leica-chiroptera (accessed on 24 August 2021).
  85. Doron, M.; Babin, M.; Mangin, A.; Hembise, O. Estimation of light penetration, and horizontal and vertical visibility in oceanic and coastal waters from surface reflectance. J. Geophys. Res. 2007, 112, 1–15. [Google Scholar] [CrossRef] [Green Version]
  86. Stramska, M.; Świrgoń, M. Influence of atmospheric forcing and freshwater discharge on interannual variability of the vertical diffuse attenuation coefficient at 490 nm in the Baltic Sea. Remote Sens. Environ. 2014, 140, 155–164. [Google Scholar] [CrossRef]
  87. Car, M.; Brčić, D.; Žuškin, S.; Svilicic, B. The navigator’s aspect of PNC before and after ECDIS implementation: Facts and potential implications towards navigation safety improvement. J. Mar. Sci. Eng. 2020, 8, 842. [Google Scholar] [CrossRef]
  88. Kristić, M.; Žuškin, S.; Brčić, D.; Valčić, S. Zone of confidence impact on cross track limit determination in ECDIS passage planning. J. Mar. Sci. Eng. 2020, 8, 566. [Google Scholar] [CrossRef]
  89. Stateczny, A.; Gronska-Sledz, D.; Motyl, W. Precise bathymetry as a step towards producing bathymetric electronic navigational charts for comparative (terrain reference) navigation. J. Navig. 2019, 72, 1623–1632. [Google Scholar] [CrossRef]
  90. Wlodarczyk-Sielicka, M.; Stateczny, A. Clustering bathymetric data for electronic navigational charts. J. Navig. 2016, 69, 1143–1153. [Google Scholar] [CrossRef] [Green Version]
Figure 1. Bathymetric charts of the areas in the vicinity of the Sopot pier; (a) shows the linear interpolation of the depth performed due to the lack of actual measurement data (the data are obtained from official ENC cells), while (b) presents actual seabed relief resulting from bathymetric surveys carried out by the team of the Department of Geodesy and Oceanography at the GMU to a depth of approx. 0.6 m. Reprinted from ref. [9].
Energies 14 05370 g001
Figure 2. A hydrographer during bathymetric surveys on an ultra-shallow waterbody (a), and the coverage area being surveyed with measurements (b) using the geodetic method.
Energies 14 05370 g002
Figure 3. A bathymetric chart of the waterbody adjacent to the Sopot pier, developed based on hydrographic and photogrammetric surveys carried out in 2019 (a), and the measurement equipment used during the survey: a DJI Mavic 2 Pro UAV (b) and Seafloor Systems Hydrone USV (c).
Energies 14 05370 g003
Figure 4. A simplified block diagram showing the data integration during the tombolo (salient) measurement campaign in Sopot in 2019.
Energies 14 05370 g004
Figure 5. A diagram of the operation and functioning of an innovative autonomous unmanned system for bathymetric monitoring of shallow waterbodies.
Energies 14 05370 g005
Figure 6. A concept of an optoelectronic module dedicated for an unmanned aerial vehicle (UAV), which will allow photogrammetric surveys in the coastal zone to be conducted.
Energies 14 05370 g006
Publisher’s Note: MDPI stays neutral with regard to jurisdictional claims in published maps and institutional affiliations.

