Abstract
Climate change and finite energy supply issues have received substantial public attention in recent times. It has been argued that a sustainable energy supply associated with the promotion of clean energy is an important engine of growth, which calls for sound protection to reinforce investments in the renewable energy market. This paper examined the effect of intellectual property rights (IPRs) on renewable energy production using the dynamic panel generalised method of moments (GMM) technique on data from 59 sample countries. The empirical results provided strong evidence that IPRs significantly drive renewable energy production. Greater protection rights motivate renewable energy firms to increase energy production from renewable resources. Our findings further revealed that stronger protection propagates the deployment of renewable energy technologies that ultimately promote renewable energy production.
1. Introduction
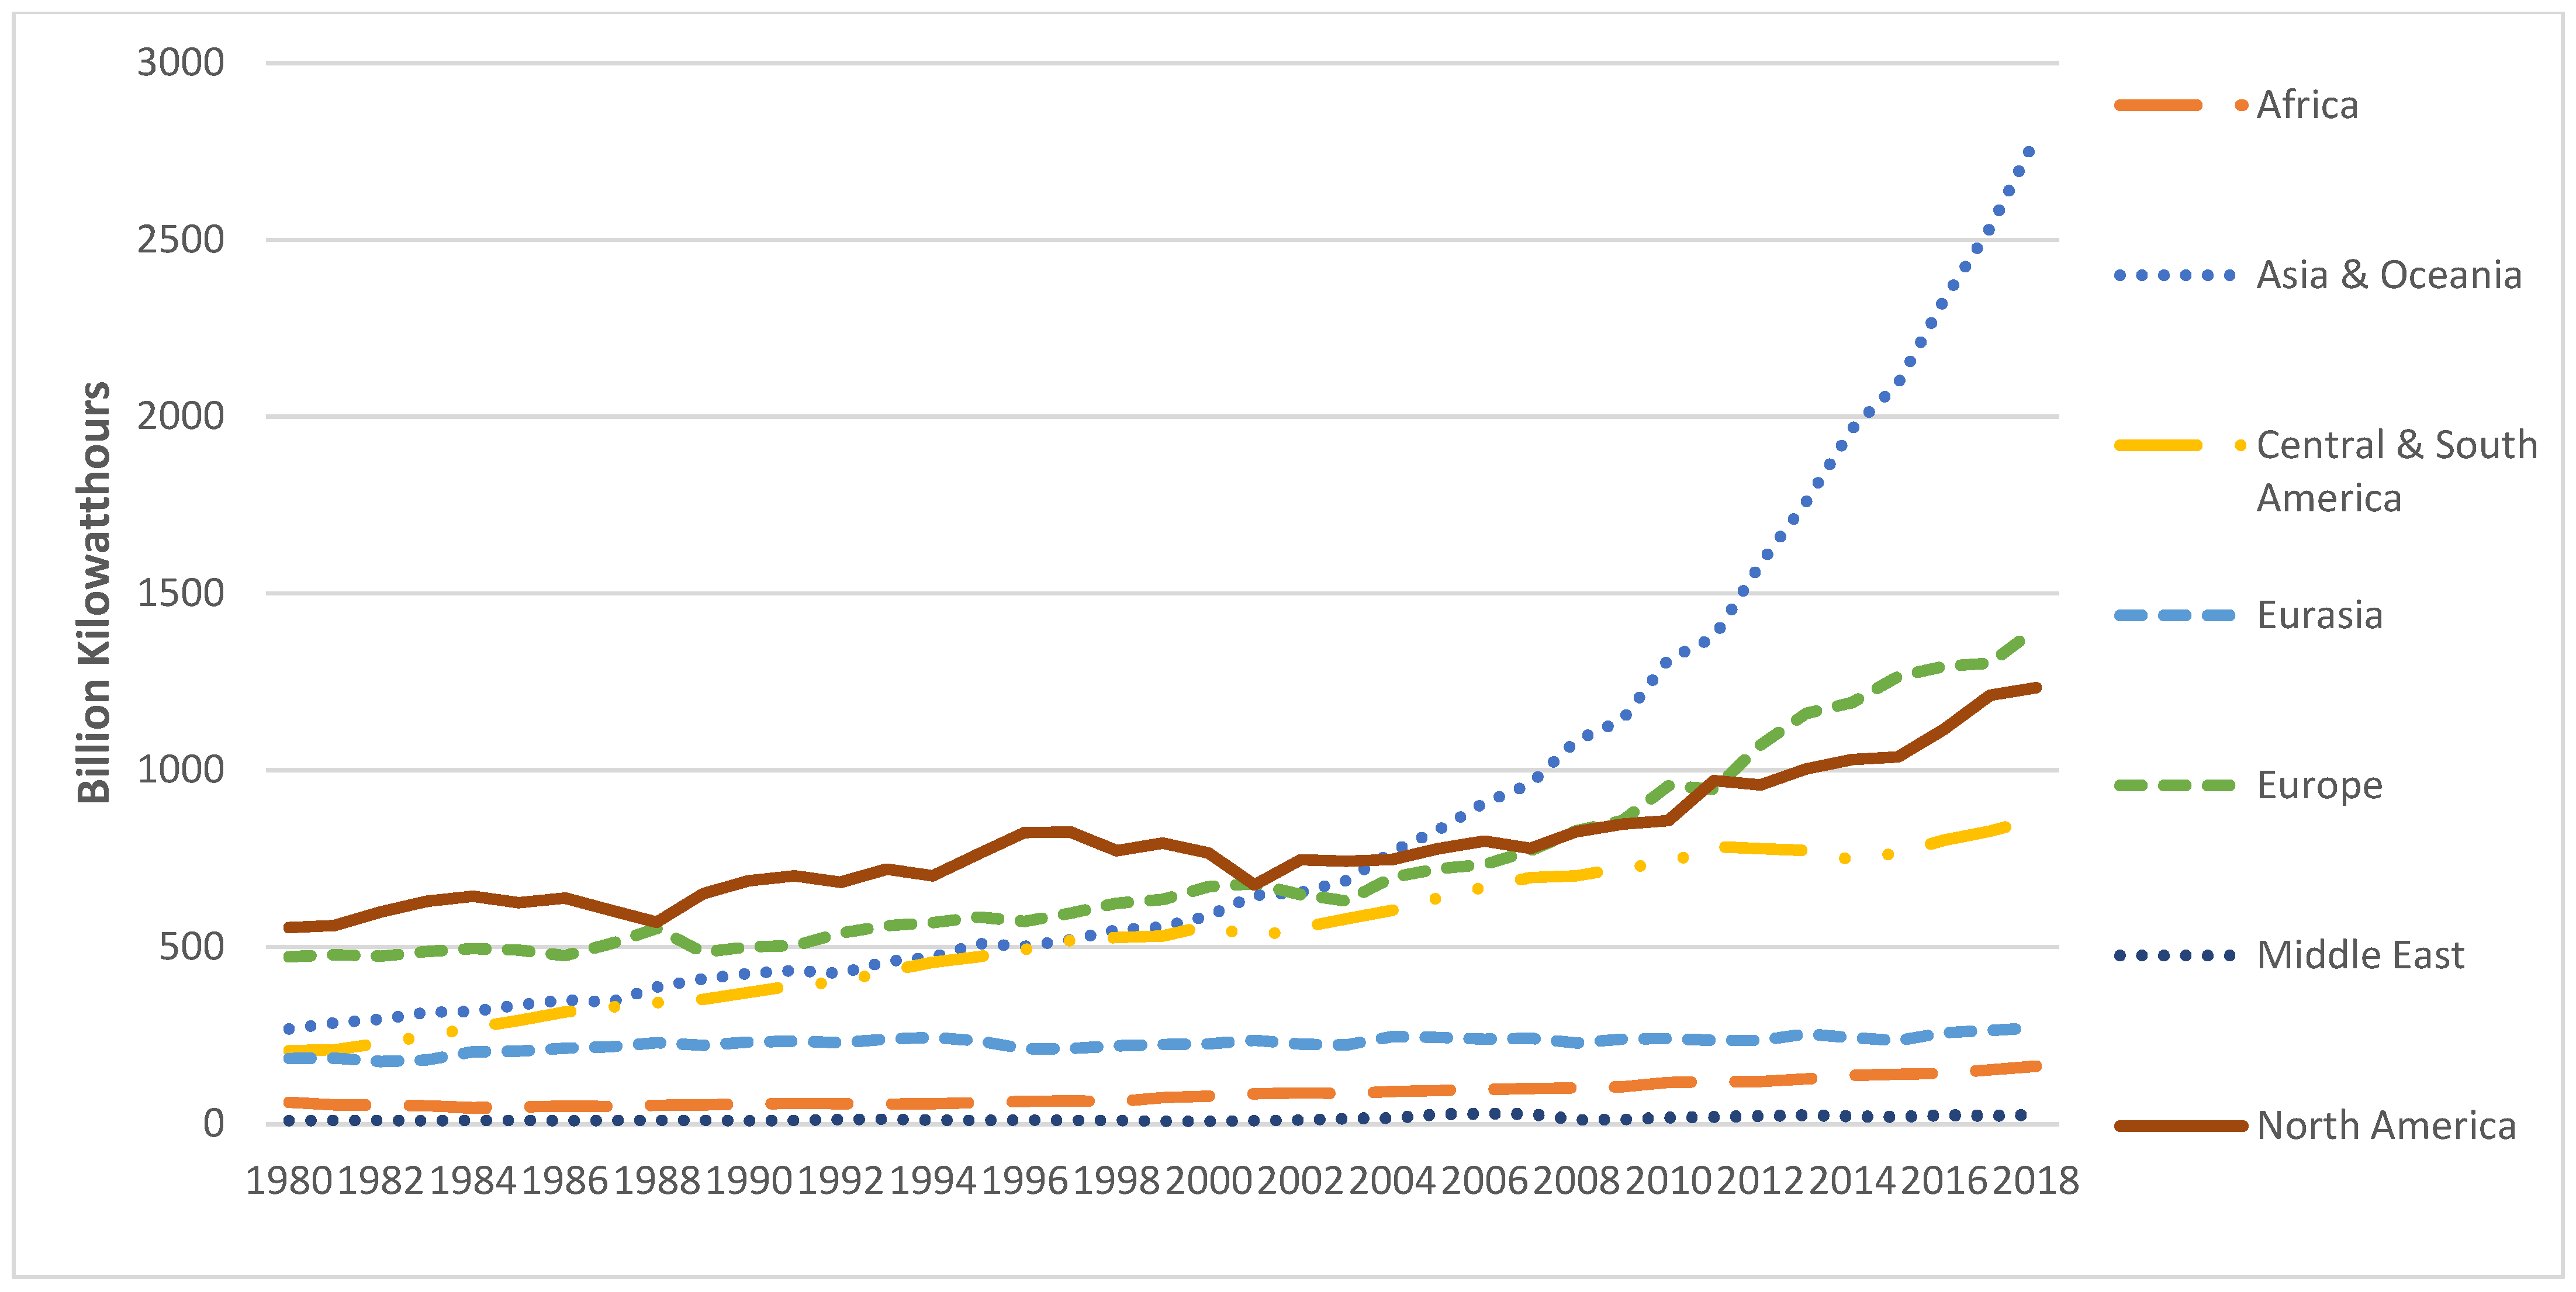
Renewable energy is an important tool to combat global warming; as such, it has been widely argued that the rapid growth of the renewable energy sector can directly reduce emission levels. Figure 1 indicates the energy supplies generated by renewable sources, revealing a gradual upward trend in the generation of world electricity by renewable energy since 1980. The total electricity produced by renewable energy achieved approximately 6000 billion Kilowatts in 2017. Globally, Asia and Oceania are the regions that have made the greatest contribution to overall electricity production from renewable energy at around 2500 kilowatt hours of electricity being generated by renewable resources. The upward trend implies that many countries have started to engage in energy transformation plans.
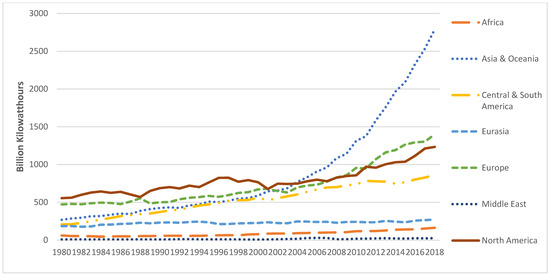
Figure 1.
Total renewable electricity net generation. Source: Energy Information Administration (EIA) [1].
Despite the various advantages of renewable energy over non-renewable energy, energy consumption from renewable energy remains low. According to British Petroleum’s (BP) report, renewable energy accounted for only about four percent of global primary energy consumption in 2018. Oil remains the largest contributor, followed by coal and natural gas. Hydroelectricity, nuclear, and renewable energy contributed less than 10% in 2018 [2]. Reports widely concur that the greatest challenge facing renewable energy is a lack of adequate financing support [3]. For instance, Ref. [4] argues that the private sector only plays a marginal role in this industry, possibly due to low anticipated returns from renewable energy. However, the view of finance as the core mechanism to support the development of renewable energy is contrary to the finding of [5], who concluded that instead of financial aids, the primary factor that prohibits the growth of the renewable energy industry is the lack of supportive governmental policies for the alternative energy industry. We argue that most renewable energy projects require high projected up-front costs, competitive technologies, and longer payback times for return on investment. Therefore, the role of the government in intellectual property right (IPR) enforcement is highly important in facilitating the development of renewable energy. Strengthening IPRs enhance support for the renewable energy industry because investors’ creativity and creations will be protected by this governance framework. IPR protection also limits the imitation level of technology and eliminates the ‘free rider’ issue. This is crucial for investors in the renewable energy industry because renewable energy projects take significant amounts of time to repay their huge investment costs. A patent right is one example of an IPR. Figure 2 provides an overview of the renewable energy patents published by IRENA, which exhibits an upward trend since 2005. The substantial growth in patent applications in respective technology fields is likely a response to market conditions, including higher research and development (R&D) investment, shifts in policy incentives such as feed-in-tariffs, and technological advances such as cost reductions in manufacturing [6]. However, it is noteworthy that the upward trend, though increasing, is increasing at a diminishing rate. This raises the question of whether the slowdown in renewable energy patents poses harm to the development of renewable energy.
Scholars such as [7] state that developing a strong renewable energy sector in less developed countries can be accomplished by acquiring and adapting renewable energy technologies from developed nations. Arguably, strong and reliable IPR protection will encourage private investments from substantial fund holders, which in turn fosters research and innovation. Conversely, a lack of IPR governance will discourage private investment, as developers may not be willing to share knowledge with others, thereby reducing investment funds. IPR is thus decisive in determining participation in technology deployment, as it draws funding that encourages the creation and innovation of new technologies. IPR is likely to be an essential instrument to stimulate investments in renewable energy. However, it may create a barrier to the development of renewable energy if the cost of acquiring IPR is deemed too high. Higher investment costs in technology-related projects may be affordable for certain big investors, but not for a majority of them. Hence, the enforcement of IPRs ostensibly denotes a protected source of knowledge while creating a barrier to access [8].
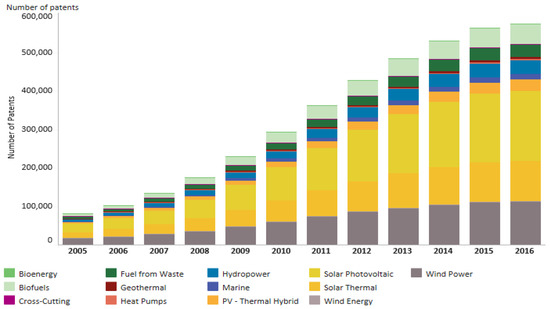
Figure 2.
Renewable energy patent evolution. Source: IRENA INSPIRE [9], based on data from EPO PATSTAT and the climate change technologies classification of EPO.
Figure 2.
Renewable energy patent evolution. Source: IRENA INSPIRE [9], based on data from EPO PATSTAT and the climate change technologies classification of EPO.

Developing countries assert that intellectual property regimes prevent them from gaining access to critical technologies. It is good to have such protection as a reward scheme to recognise the contribution of inventors and encourage them to engage in similar transition plans. Without the protection of IPRs, inventors may have to rely on secrecy to avoid their inventions from being disclosed. Nevertheless, strictly adhering to IPR protection for the sake of monetary benefits will probably limit the diffusion of renewable energy. Consequently, technology transfer will be delayed and impede renewable energy technology adoption. Complying with IPRs should be achieved not because of financial incentives, but because technology sharing plays crucial role in fostering economic growth. Overall, there is uncertainty about whether the enforcement of IPRs prohibits or facilitates the development of renewable energy. However, empirical research on IPRs and renewable energy is relatively limited. Hence, this study aimed to examine whether IPRs present or do not present a barrier to renewable energy development.
This paper intended to contribute to the literature in at least two ways. First, research on IPRs and renewable energy is considerably scarce. To date, only two studies have discussed the link between IPR and renewable energy [7,10]. This study differs from these former studies by focusing on the production, rather than the consumption, of renewable energy. Second, most previous studies employed total patents as the proxy for IPR, which may not accurately depict the implications of IPR for renewable energy as patent data includes patents from all industries. Therefore, this study employed specific patent data (patents granted to environmental technologies and patents granted to climate change mitigation technologies) as the measurement for IPR since these patents are directly linked to renewable energy.
2. Literature Review
Substantial empirical works have underscored the relationship between IPR and various economic activities. For instance, Refs. [11,12,13] found that IPR is a significant engine of economic growth. Ref. [14] also concluded that the level of IPR protection determines the level of economic growth and technology transfer in low-income nations, while it has negative effects on both these outcomes in middle-income nations. These findings imply that innovation in developing countries may be generated through imitation, wherein stronger IPR protection favours foreign firms; therefore, incentives are necessary to boost local innovation in developing nations. Despite numerous preceding works establishing that IPRs have a straightforward effect on productivity and growth, Ref. [15] disputed these findings by concluding that IPRs do not spur productivity growth directly but indirectly through R&D investment. It has conclusively been shown that intellectual property is a valuable tool to promote the development and diffusion of green technology [16]. For example, Ref. [17] highlighted that intensive patent protection aids the profitability of green projects and subsequently leads to higher green energy-related private investment as well as new job creation associated with the acceleration of green energy technology progress.
Moreover, IPR protection acts as a shelter for inventions; in this manner, it provides a platform for knowledge transfer. This is especially true in the energy industry in which huge investment on technology is required. Ref. [18] demonstrated that weak intellectual property regimes are barriers to the deployment of low carbon technologies, as weak IPRs increase the time taken by firms to realise investment returns on innovation. Ref. [19] examined the potential factors such as energy security and level of fossil fuel production that affect renewable energy technology deployment, particularly patenting activity. Their results revealed that patenting activity was found to have a significant impact on renewable energy deployment in 26 OECD countries, while deployment of low carbon energy resources and national energy-related policies are ineffective. This contradicts similar work performed by [20], who presented evidence of the importance of public policy in encouraging the innovation of renewable energy technologies. IPR systems perform a significant function in ensuring that the efforts of talented individuals are not discriminated. In addition, IPRs allow for a certain amount of monopolistic use of new technology and knowledge by restraining use by third parties and competitors. Consequently, they decrease social benefits by prohibiting the application of patent rights for technology and knowledge.
Ref. [7] concluded that there is evidence showing that concerns toward IPR will not necessarily restrict the renewable energy transfer in China. However, a recent study conducted by [10] found that IPR protection and its reform do not significantly influence renewable energy consumption. This suggests that IPR is not a concern for global energy transition, which means policymakers should channel more efforts into economic factors that have stronger impacts on renewable energy adoption. Similarly, Ref. [21] found that IPR policies in the renewable energy sector are disconnected from reality, primarily due to the lack of rapid improvement in the sector’s innovation abilities.
As mentioned earlier, the research on IPRs and renewable energy is considerably scarce. To date, only two studies have discussed the link between IPR and renewable energy [7,10]. Ref. [10] researched on IPR, focusing on the role of IPR in renewable energy consumption rather than renewable energy production, while Ref. [7] discussed the link between IPR and renewable energy technology without incorporating regression analyses. One of the advantages of regression analysis is it allow for the examination of statistical relationship analysis, which subsequently can be treated as the references for policy recommendation. Therefore, our study contributes to the literature by being among the first to examine the impact of IPR on renewable energy production rather than consumption. Looking at the impact of IPR on renewable energy production allows policymakers to judge the effectiveness of renewable energy policies from both users’ and producers’ perspectives. The findings may thus encourage more renewable energy generation, particularly in countries that have just begun their energy transformation journey.
3. Data and Methodology
3.1. Model Specification
Studies on the determinants of renewable energy are typically divided into two dimensions, namely renewable energy consumption and renewable energy production. The common determinants of renewable energy supply are oil price, carbon dioxide emissions, coal price, and gas price (Refer to [22,23,24,25,26,27,28,29]), while the demand side is usually determined by energy use, oil price, carbon dioxide emissions, coal price, and gas price (Refer to [30,31,32,33,34,35]). The factors driving the supply and demand of renewable energy are well documented in the recent work of [36] on solar energy in Japan. The present study, however, focused on one specific predictor of renewable energy supply, i.e., IPR. The primary characteristic of IPR is to recognise producers’ efforts in developing or innovating novel creations that contribute to the market. As such, strict property right protection might not be healthy for renewable energy development as it would undermine new market entrants in the renewable energy industry, who would find it difficult to acquire licenses for renewable technology deployment if copyrights have been registered and granted to the founder. If that is the case, IPRs restrict the development of this industry and eventually become a barrier to new investment. According to World Intellectual Property Organization, Intellectual property can incentivise or create obstacles to technology transfer. Though IPR protection can support climate change technology inventors’ innovations, overprotection is a hindrance to high capital funding. Besides IPR, the other explanatory variables included in this study were population, carbon dioxide emission, GDP, energy use, alternative energy electricity generation, and other energy prices. The selection of these variables was motivated by the research of [22,23,24,25] as summarised in Table 1.

Table 1.
Factors driving renewable energy production in the literature.
Empirical works from [22,23,24,25], which involved regression analyses, did not include the role of IPR in their study. To examine the impact of IPR on renewable energy production, this study modified the work of [22] by positing IPR as the primary explanatory variable. The resultant model is as follows:
where = Renewable energy production
= Population growth
= Carbon dioxide emission
= GDP
= Energy use
= Oil price
= Coal price
= Gas price
= Electricity production from oil sources
= Electricity production from coal sources
= Electricity production from gas sources
= Intellectual property right
3.2. Methodology
This study employed the dynamic panel, generalised method of moments (GMM) technique, which is an extension of the instrumental variable (IV) approach by [37]. The GMM method is designed to address issues associated with short time series data and potential endogeneity. This technique has become more popular among researchers due to its several advantages. For instance, it can handle panel data with a small number of time span observations “T” with a large number of cross-section units “N”. It also assumes a linear combination functional relationship, where the dynamic left-hand side variable depends on its own past values. As such, the independent variables are not strictly exogenous; rather, they are possibly correlated with the present and past values of the error terms. Moreover, the GMM also assumes fixed individual effects to exist in the model. Finally, it allows for the existence of heteroscedasticity and autocorrelation in the data. Two methods have been developed under the GMM framework, namely difference GMM and system GMM. The difference GMM was initiated by [38] and later developed by [39,40,41]). This study opted to use the system GMM estimator because it has been shown to perform much better than the difference GMM in terms of lower bias and higher precision, especially when autoregressive series are close to the random walk [42]. Prior to the examination of regression model results, Cook’s distance test was performed to identify the outlier. For diagnostic checks, the Sargan test and the Arellano-Bond second-order correlation were employed to validate the results. Although several empirical works have highlighted the impact of institutions or institutional quality, no study has covered the specific scope of this indicator. In particular, the role of IPR, as an element of institutional quality, is the core indicator that requires more evidence to supplement existing studies. The interpretation of the protection level of IPR as a measure of institutional quality was put forth by [43]. IPR measures the degree and importance of legal frameworks in renewable energy development. Stronger IPR protection implies that creation or invention is governed strictly by statutory rights and that pioneering teams’ knowledge is appropriately safeguarded.
3.3. Data
Our panel analysis covered time series data of 59 countries from 1980 to 2014. The complete list of countries is presented in Appendix A as Table A1. Two proxies were used to represent the dependent variable of this study: (i) electricity production from renewable sources (REWDI) retrieved from WDI; and (ii) renewable energy generation (REBP) obtained directly from the BP Statistical Review of World Energy. The former was measured as the percentage of total electricity production while the latter was measured as Terawatt-hours. Data of patents granted by both the OECD and WIPO were used to assess IPR. As IPR is one of various governance factors, institutional quality represented by the ICRG and WGI were also used to evaluate institutional quality’s impact on renewable energy production. Institutional quality is notably known as one of the key drivers of renewable energy industry growth [44]. The data for the remaining control variables were primarily collected from WDI and World Bank. After collecting the data for all the variables involved, conversion to logarithmic form was performed to reduce the variation among data. For certain data that are in negative value, an upward adjustment was created such that it allows for the conversion to logarithmic form. Table A2 in the Appendix A presents definitions, sources, and descriptive statistics. Appendix A, Table A3 also presents the correlation results for the model with renewable energy production as the dependent variable.
4. Results and Discussion
4.1. Main Result
The results of the impact of IPR on renewable energy production are shown in Table 2. Model 1 is our main model, which used patents granted by WIPO to environmental technologies as the proxy for IPR. Model 2 employed another IPR indicator, which is patent granted by OECD to climate change mitigation technologies. Models 3 and 4 utilised renewable energy production data from BP as a robustness check for the primary model. All the estimated models passed the Sargan test and confirmed that there was no serial correlation issue in the AR2 test. The common procedure of identifying outliers and excluding them from the regression was applied to avoid bias in the results.
Table 2.
Results of dynamic panel estimations for intellectual property rights and renewable energy production.
Model 1 in Table 2 used patents granted as the proxy for IPR. As shown in Table 2, population growth is an important factor that triggers renewable energy production, evidenced by its positive coefficient. This finding acknowledges the considerable role of population growth in energy demand. However, an unanticipated finding was the negative coefficient of CO2, suggesting that severe pollution levels do not exert a strong impetus on investments in renewable energy. As suggested by [23], this negative effect may mean greater dependency on traditional resources to generate energy. With respect to the role of GDP in renewable energy production, the findings reported a non-significant negative coefficient, which revealed a similar finding with [45,46,47]. Ref. [45] argued that effects of renewable energy on growth can be negative or positive but statistically can be insignificant. A country’s characteristics can be known as the primary factor that contributes to the discouragement of renewable energy development, such as India, which continues to heavily rely on coal as their source of energy. Top oil reserves prove that certain countries in the world, such as Brazil, Canada, and Iran, may find the balance between the investment renewable energy and non-renewable energy difficult, given that there is an abundance of oil. Last but not least, countries without appropriate support from their national energy council can further restrict the development of renewable energy, such as in Indonesia, whereby investors face financing barriers as well as policy uncertainty issues. The findings in this study imply that renewable energy may not be the primary investment option for investors with personal income growth for several reasons. First, investors may find that renewable energy investments do not offer lucrative returns such as well-established non-renewable energy investments because of their higher upfront capital. Second, it takes a longer time for renewable energy investments to meet the break-even point. For an investor aiming for short term returns, this lengthy time horizon is not a favourable option. Third, to participate in renewable energy project bidding, proposals need to be specific and have reasonable cost estimates, as most such projects are awarded by the government. As such, the investment route is longer and more tedious, with uncertain outcomes; this may discourage investment in the renewable energy sector.
Energy use was statistically significant with a positive coefficient, reiterating that the increase in energy use needs be supported by renewable energy generation. A similar finding was obtained by [29], who confirmed that energy use or consumption has a positive impact on renewable energy deployment. Our evidence further showed mixed findings for fossil fuel prices, whereas oil price had a positive coefficient, gas and coal prices had negative coefficients. The positive coefficient of oil price confirms that the appreciation of oil price boosts renewable energy generation. Addressing the electricity production of fossil fuel resources, the results obtained were interesting. Oil and coal electricity production exhibited a negative relationship with renewable energy production. When electricity production from oil and coal is higher, more factors of production are required to support their operations. As a result, electricity production from renewable energy experiences resource scarcity as factors of production are allocated to electricity production by traditional resources. The result of gas energy electricity production was positive, contrary to the former two variables, indicating that the increase in gas production stimulates the electricity production of renewable energy.
The variable that represented IPR was patents granted to renewable energy inventions, which reported a positive and statistically significant result. The conclusion can thus be drawn that IPR is an important determinant of renewable energy production. When more protection is given to renewable energy firms, investors feel more secure and confident to expand their business as their efforts (e.g., wind farm design, solar panel installation technique, biomass processing method, etc.) are recognised. Typically, these efforts require extensive R&D and time; therefore, investors clearly want to protect their property rights to prohibit unauthorised imitation of their methodology in generating energy. With the establishment of strong protection to assure property rights, there are higher injections of capital to promote renewable energy production. There are several factors behind the finding against the result produced by [9], such as the dependent variable employed in this preceding work, renewable energy consumption. The proxy employed to represent IPR only emphasises the Ginarte-Park Index, while this study examined the factor of IPR via two different proxies, and lastly, the number of countries involved in the study are also different.
To evaluate the reliability of the results produced in Model 1, this study employed another IPR indicator, patents granted by OECD to climate change mitigation technologies, shown in Model 2 in Table 2. This model, however, did not report a significant finding for IPR, although the coefficient was positive. One of the plausible factors that contributed to such a result could be due to the number of time series data included, which include a shorter time span compared to the first model. Since Model 2 failed to prove the effect of IPR on renewable energy production, Model 3 and Model 4 were developed using renewable energy production data from BP as the dependent variable. Based on the results, there is solid evidence to show that IPR plays a critical role in driving renewable energy production. Our finding implies that when the degree of protection is higher in the renewable energy sector, such as by granting assurance to renewable technology inventors, inventors gain confidence in contributing ideas that can enhance electricity generation efficiency from renewable resources. With such interventions, more renewable energy technologies will be introduced, which will subsequently secure the capital required by the renewable energy industry.
4.2. Robustness Check
Since IPR is an institutional factor, this study re-estimated the models in Table 2 by replacing IPR with institutional factor data from WGI and ICRG as a robustness check. The results of the robustness check are reported in Table 3, which shows that all four models passed the diagnostic checks. The results appeared to be robust with the alternative proxy, as indicated by most of the coefficients estimated, carrying similar signs. In particular, our main interest variable (IQ WGI) exhibited statistically significant results. However, the coefficient of IQ ICRG was statistically insignificant. With respect to the positive finding produced by our main model (Model 1) and Model 3, an important implication is that a better institutional framework will assure environmental legislation is strictly regulated; hence, it will strengthen investors’ confidence and facilitate renewable energy investment. Investors weigh local statutory standards rigorously, thus the existence of regulatory protection and standard assurance will drive environmentally friendly investments. This finding raises the notion that the commitment of central governments to combat climate change is vital in promoting the deployment of renewable energy.
Table 3.
Results of institutional quality and renewable energy production.
Table 4 provides a complete summary of the analysis results, which provide strong evidence that IPR drives renewable energy electricity production. This finding was supported by the results of the robustness check model that considered institutional quality as the proxy for IPR.
Table 4.
Summary of results of intellectual property right and institutional quality.
5. Conclusions and Policy Implications
The debate on the role of IPR protection scheme in the renewable energy sector from multiple aspects remains an on-going issue. Is introducing safeguards an effective approach to promote the development of this sector? The answer to this question will be left to research related to this field of study. Generally, excessive IPR protection mechanisms will not be a good option while the least protected may turn down the interest of renewable energy investors. Given this, the study conducted is expected to produce important feedback to the renewable industry in respect to whether the protection or its development as well as the degree of IPR protection are a must. It has been demonstrated that renewable energy has the potential to be a useful input in the pursuit of sustainable economic growth [48]. However, deciding the shift from fossil-fuel-based energy to renewable energy production may be difficult because most renewable energy projects require high projected up-front costs, competitive technologies, and longer payback times for return on investment. Thus, the role of the government in intellectual property right (IPR) enforcement is highly important in protecting the developers’ and investors’ rights and facilitating the development of renewable energy. This paper examined the effect of IPR on renewable energy electricity production using the dynamic panel system GMM analysis on data from 59 countries over the period from 1986 to 2014. The role of IPR was proxied by patents granted to environmental technologies and renewable technologies. This study proved that IPR is an important pillar in sustaining renewable energy development. The results were also robust when the alternative proxy of IPR and institutional quality was tested. The existence of IPR protection reflects that innovation via R&D is regarded as crucial to stimulate investment in the renewable energy sector. Without policies to govern IPR, technology developers may be reluctant to share information, causing further delays in investment and technology transfer. When no party is willing to move first and would rather wait for benefits or imitations, the problem of delays in investment will worsen due to the existence of such ‘free riders’ [49]. As IPR prevents the ‘free rider problem’ in this industry, renewable energy firms will feel more secure to launch their development plans. Protection granted to such big scale projects enforces rules and regulations that must be adhered to by potential investors. Any violation of these rules and regulations in the new investment scheme will cause the project to be withdrawn from the plan. Consequently, when IPR protection is rigorous, firms or developers are more willing to disseminate knowledge on renewable energy, thereby encouraging technology transfer in the industry.
Moreover, capital funding to support research on the efficiency of electricity generation in the renewable energy industry is heavily dependent on the value of ideas, and more importantly, a country’s intention to combat climate change. Hence, it is a positive sign when there is a clean energy transformation plan for a nation, because clean renewables are indispensable to secure sustainable energy supply in a majority of countries. However, as suggested by [50], given that most renewables are intermittent sources of energy, it is advisable to consume them via continuous forms of energy (e.g., hydro and geothermal) to ensure the availability of other non-renewable energy such as oil, coal, and gas for commercial, industrial, residential, and agricultural activities.
The policy implication is straightforward in this study. IPR enforcement is a form of protection that reinforces confidence in renewable energy investment, which is deemed important for this industry involved in multiple technologies. For instance, to produce a greater amount of electricity from solar energy farms, the quality of solar panels is critically important. If a solar panel is highly efficient in absorbing energy from the sun, the solar panel design may be sold to other firms. In order to do so, the firm that created the solar panel will file for patent protection to safeguard their invention. In essence, IPR demonstrates that the original efforts of the inventors are recognised. For policy makers, energy transformation measures should be undertaken, such as the introduction of monetary incentives or corporate tax reduction measures to develop the renewables industry. Future studies can extend to specific energy generation types such as solar, wind, biomass, and others. Examining specific energy types may enable forthcoming empirical works to identify the core energy sector that is most affected by IPRs. Moreover, future research can also specialise in the area of stock market development and renewable energy production due to the stock market proving to lead to more renewable energy use [51]. Hence, stock market development may be a potential driving force for renewable energy production.
Overall, this paper has covered the issue regarding the influence of intellectual property rights to renewable energy. Nevertheless, this study has limitations worth mentioning, the most important is that it does not consider subsidies and other incentives provided by governments. Many countries show a surge in interest in renewable energy sources after the introduction of subsidies and other incentives by governments. Due to the data of subsidies and other incentives by governments being qualitative in nature, this study did not consider them in our model.
Author Contributions
Conceptualization, L.C. and W.-S.T.; methodology, W.-S.T.; formal analysis, W.-S.T.; data curation, W.-S.T.; writing—original draft preparation, W.-S.T.; writing—review and editing, L.C.; visualization, L.C.; supervision, L.C. and A.S.A.-R.; funding acquisition, L.C. and A.S.A.-R. All authors have read and agreed to the published version of the manuscript.
Funding
This research was funded by Universiti Putra Malaysia, grant number GP/2018/9632300.
Institutional Review Board Statement
Not applicable.
Informed Consent Statement
Not applicable.
Data Availability Statement
The data presented in this study are available on request from the corresponding author.
Conflicts of Interest
The authors declare no conflict of interest.
Appendix A
Table A1.
List of countries.
Table A1.
List of countries.
| Renewable Energy Electricity Production (WDI) | Renewable Energy Electricity Production (BP) | ||||||
|---|---|---|---|---|---|---|---|
| WIPO | OECD | WGI | ICRG | WIPO | OECD | WGI | ICRG |
| 1. Argentina | 1. Argentina | 1. Argentina | 1. Argentina | 1. Argentina | 1. Argentina | 1. Argentina | 1. Argentina |
| 2. Australia | 2. Australia | 2. Australia | 2. Australia | 2. Australia | 2. Australia | 2. Australia | 2. Australia |
| 3. Austria | 3. Austria | 3. Austria | 3. Austria | 3. Austria | 3. Austria | 3. Austria | 3. Austria |
| 4. Belgium | 4. Belgium | 4. Bangladesh | 4. Bangladesh | 4. Bangladesh | 4. Belgium | 4. Bangladesh | 4. Bangladesh |
| 5. Brazil | 5. Brazil | 5. Belgium | 5. Belgium | 5. Belgium | 5. Brazil | 5. Belgium | 5. Belgium |
| 6. Bulgaria | 6. Bulgaria | 6. Brazil | 6. Brazil | 6. Brazil | 6. Bulgaria | 6. Brazil | 6. Brazil |
| 7. Canada | 7. Canada | 7. Bulgaria | 7. Bulgaria | 7. Bulgaria | 7. Canada | 7. Bulgaria | 7. Bulgaria |
| 8. Chile | 8. Chile | 8. Canada | 8. Canada | 8. Canada | 8. Chile | 8. Canada | 8. Canada |
| 9. China | 9. China | 9. Chile | 9. Chile | 9. Chile | 9. China | 9. Chile | 9. Chile |
| 10. Colombia | 10. Colombia | 10. China | 10. China | 10. China | 10. Colombia | 10. China | 10. China |
| 11. Croatia | 11. Croatia | 11. Colombia | 11. Colombia | 11. Colombia | 11. Croatia | 11. Colombia | 11. Colombia |
| 12. Czech Republic | 12. Czech Republic | 12. Croatia | 12. Croatia | 12. Croatia | 12. Czech Republic | 12. Croatia | 12. Croatia |
| 13. Denmark | 13. Denmark | 13. Czech Republic | 13. Czech Republic | 13. Czech Republic | 13. Denmark | 13. Czech Republic | 13. Czech Republic |
| 14. Estonia | 14. Estonia | 14. Denmark | 14. Denmark | 14. Denmark | 14. Estonia | 14. Denmark | 14. Denmark |
| 15. Finland | 15. Finland | 15. Dominican Republic | 15. Dominican Republic | 15. Estonia | 15. Finland | 15. Estonia | 15. Estonia |
| 16. France | 16. France | 16. Estonia | 16. Estonia | 16. Finland | 16. France | 16. Finland | 16. Finland |
| 17. Germany | 17. Germany | 17. Finland | 17. Finland | 17. France | 17. Germany | 17. France | 17. France |
| 18. Greece | 18. Greece | 18. France | 18. France | 18. Germany | 18. Greece | 18. Germany | 18. Germany |
| 19. Hong Kong | 19. Hong Kong | 19. Germany | 19. Germany | 19. Greece | 19. Hong Kong | 19. Greece | 19. Greece |
| 20. Hungary | 20. Hungary | 20. Greece | 20. Greece | 20. Hong Kong | 20. Hungary | 20. Hong Kong | 20. Hungary |
| 21. India | 21. India | 21. Hong Kong | 21. Hungary | 21. Hungary | 21. India | 21. Hungary | 21. India |
| 22. Indonesia | 22. Indonesia | 22. Hungary | 22. India | 22. India | 22. Indonesia | 22. India | 22. Indonesia |
| 23. Iran. | 23. Iran | 23. India | 23. Indonesia | 23. Indonesia | 23. Iran | 23. Indonesia | 23. Ireland |
| 24. Ireland | 24. Ireland | 24. Indonesia | 24. Ireland | 24. Iran | 24. Ireland | 24. Iran | 24. Israel |
| 25. Israel | 25. Israel | 25. Iran | 25. Israel | 25. Ireland | 25. Israel | 25. Ireland | 25. Italy |
| 26. Italy | 26. Italy | 26. Ireland | 26. Italy | 26. Israel | 26. Italy | 26. Israel | 26. Japan |
| 27. Japan | 27. Japan | 27. Israel | 27. Japan | 27. Italy | 27. Japan | 27. Italy | 27. Kazakhstan |
| 28. Korea, Rep. | 28. Korea, Rep. | 28. Italy | 28. Kazakhstan | 28. Japan | 28. Korea, Rep. | 28. Japan | 28. Korea, Rep. |
| 29. Latvia | 29. Latvia | 29. Japan | 29. Korea, Rep. | 29. Kazakhstan | 29. Latvia | 29. Kazakhstan | 29. Latvia |
| 30. Luxembourg | 30. Malaysia | 30. Kazakhstan | 30. Latvia | 30. Korea, Rep. | 30. Malaysia | 30. Korea, Rep. | 30. Luxembourg |
| 31. Malaysia | 31. Mexico | 31. Korea, Rep. | 31. Luxembourg | 31. Latvia | 31. Mexico | 31. Latvia | 31. Malaysia |
| 32. Mexico | 32. Morocco | 32. Latvia | 32. Malaysia | 32. Luxembourg | 32. Morocco | 32. Luxembourg | 32. Mexico |
| 33. Morocco | 33. Netherlands | 33. Luxembourg | 33. Mexico | 33. Malaysia | 33. Netherlands | 33. Malaysia | 33. Morocco |
| 34. Netherlands | 34. New Zealand | 34. Malaysia | 34. Morocco | 34. Mexico | 34. New Zealand | 34. Mexico | 34. Netherlands |
| 35. New Zealand | 35. Norway | 35. Mexico | 35. Netherlands | 35. Morocco | 35. Norway | 35. Morocco | 35. New Zealand |
| 36. Norway | 36. Pakistan | 36. Morocco | 36. New Zealand | 36. Netherlands | 36. Pakistan | 36. Netherlands | 36. Norway |
| 37. Philippines | 37. Peru | 37. Netherlands | 37. Norway | 37. New Zealand | 37. Peru | 37. New Zealand | 37. Pakistan |
| 38. Poland | 38. Philippines | 38. New Zealand | 38. Pakistan | 38. Norway | 38. Philippines | 38. Norway | 38. Peru |
| 39. Portugal | 39. Poland | 39. Norway | 39. Peru | 39. Philippines | 39. Poland | 39. Pakistan | 39. Philippines |
| 40. Romania | 40. Portugal | 40. Pakistan | 40. Philippines | 40. Poland | 40. Portugal | 40. Peru | 40. Poland |
| 41. Russian Federation | 41. Romania | 41. Peru | 41. Poland | 41. Portugal | 41. Romania | 41. Philippines | 41. Portugal |
| 42. Serbia | 42. Russian Federation | 42. Philippines | 42. Portugal | 42. Romania | 42. Russian Federation | 42. Poland | 42. Romania |
| 43. Singapore | 43. Singapore | 43. Poland | 43. Romania | 43. Russian Federation | 43. Singapore | 43. Portugal | 43. Singapore |
| 44. Slovak Republic | 44. Slovak Republic | 44. Portugal | 44. Serbia | 44. Singapore | 44. Slovak Republic | 44. Romania | 44. Slovenia |
| 45. Slovenia | 45. Slovenia | 45. Romania | 45. Singapore | 45. Slovak Republic | 45. Slovenia | 45. Russian Federation | 45. Spain |
| 46. Spain | 46. Spain | 46. Russian Federation | 46. Slovenia | 46. Slovenia | 46. Spain | 46. Singapore | 46. Sweden |
| 47. Sweden | 47. Sweden | 47. Serbia | 47. Spain | 47. Spain | 47. Sweden | 47. Slovak Republic | 47. Switzerland |
| 48. Switzerland | 48. Thailand | 48. Singapore | 48. Sweden | 48. Sweden | 48. Thailand | 48. Slovenia | 48. Thailand |
| 49. Thailand | 49. Turkey | 49. Slovak Republic | 49. Switzerland | 49. Switzerland | 49. Turkey | 49. Spain | 49. Turkey |
| 50. Turkey | 50. Ukraine | 50. Slovenia | 50. Tanzania | 50. Thailand | 50. Ukraine | 50. Sweden | 50. Ukraine |
| 51. Ukraine | 51. United Kingdom | 51. Spain | 51. Thailand | 51. Turkey | 51. United Kingdom | 51. Thailand | 51. United Kingdom |
| 52. United Kingdom | 52. United States | 52. Sweden | 52. Turkey | 52. Ukraine | 52. United States | 52. Turkey | 52. United States |
| 53. United States | 53. Tanzania | 53. Ukraine | 53. United Kingdom | 53. Ukraine | 53. Vietnam | ||
| 54. Vietnam | 54. Thailand | 54. United Kingdom | 54. United States | 54. United Kingdom | |||
| 55. Turkey | 55. United States | 55. Vietnam | 55. United States | ||||
| 56. Ukraine | 56. Vietnam | 56. Vietnam | |||||
| 57. United Kingdom | |||||||
| 58. United States | |||||||
| 59. Vietnam | |||||||
Table A2.
Definitions, data sources, and descriptions.
Table A2.
Definitions, data sources, and descriptions.
| Variable | Definition | Source | Unit Measurement | Mean | Std Dev | Min | Max | |
|---|---|---|---|---|---|---|---|---|
| RE | REWP | Electricity Production from Renewable sources | WDI | % of Total Electricity Production | 3.75 | 5.79 | 0.00 | 55.85 |
| REWPBP | Renewables Energy Generation | BP | Terawatt-hours | 8.78 | 23.84 | 0.00 | 296.78 | |
| POP | Population Growth | WDI | % change | 0.74 | 0.76 | −2.08 | 2.89 | |
| CO2 | CO2 emissions | WDI | Metric tons per capita | 7.23 | 4.67 | 0.14 | 27.43 | |
| GDP | Real Gross Domestic Product | WDI | US$ constant price 2010 | 1050 | 2090 | 10 | 16,200 | |
| EUSE | Energy Use | WDI | KG of oil equivalent per capita | 3095.35 | 1971.51 | 163.94 | 9353.42 | |
| OP | OIL | Oil Price | WB | US$ Price | 49.83 | 33.41 | 13.53 | 103.40 |
| COAL | Coal Price | WB | US$ Price | 54.48 | 30.06 | 25.08 | 123.85 | |
| GAS | Gas Price | WB | US$ Price | 5.02 | 2.58 | 1.89 | 11.13 | |
| OE | OILP | Electricity Production from Oil sources | WDI | % of Total Electricity Production | 8.29 | 12.01 | 0.00 | 71.44 |
| COALP | Electricity Production from Coal sources | WDI | % of Total Electricity Production | 29.54 | 25.07 | 0.00 | 97.49 | |
| GASP | Electricity Production from Gas sources | WDI | % of Total Electricity Production | 20.54 | 19.50 | 0.03 | 95.27 | |
| IPR | IPR WIPO | Patent Granted to Environmental Technologies | WIPO | Actual Count | 241.29 | 598.68 | 1.00 | 4474.00 |
| IPR OECD | Patent Granted to Climate Change Mitigation Technologies | OECD | Actual Count | 96.27 | 314.52 | 0.08 | 2774.35 | |
Notes: WDI, World Development Indicators; BP, BP Statistical Review of World Energy; WB, World Bank Commodity Price Data; WIPO, World Intellectual Property Organization; OECD, Organisation for Economic Co-operation and Development.
Table A3.
Correlation Matrix.
Table A3.
Correlation Matrix.
| Variables | REWP | REWPBP | POP | CO2 | GDP | EUSE | OIL | COAL | GAS | OILP | COALP | GASP | IPR WIPO | IPR OECD |
|---|---|---|---|---|---|---|---|---|---|---|---|---|---|---|
| REWP | 1.00 | |||||||||||||
| REWPBP | 0.14 | 1.00 | ||||||||||||
| POP | −0.14 | −0.02 | 1.00 | |||||||||||
| CO2 | −0.09 | 0.24 | 0.06 | 1.00 | ||||||||||
| GDP | −0.11 | 0.81 | 0.02 | 0.38 | 1.00 | |||||||||
| EUSE | −0.01 | 0.18 | 0.03 | 0.85 | 0.28 | 1.00 | ||||||||
| OIL | 0.33 | 0.21 | 0.00 | −0.12 | 0.00 | −0.09 | 1.00 | |||||||
| COAL | 0.23 | 0.13 | −0.01 | −0.09 | −0.01 | −0.07 | 0.88 | 1.00 | ||||||
| GAS | 0.15 | 0.08 | 0.01 | −0.05 | −0.01 | −0.05 | 0.75 | 0.73 | 1.00 | |||||
| OILP | −0.14 | −0.12 | 0.20 | −0.19 | −0.04 | −0.32 | −0.17 | −0.14 | −0.11 | 1.00 | ||||
| COALP | −0.15 | 0.15 | −0.02 | 0.17 | 0.17 | −0.19 | −0.07 | −0.06 | −0.03 | −0.01 | 1.00 | |||
| GASP | 0.04 | −0.07 | 0.19 | −0.06 | −0.05 | −0.16 | 0.12 | 0.11 | 0.07 | 0.26 | −0.25 | 1.00 | ||
| IPR WIPO | −0.13 | 0.54 | −0.16 | 0.24 | 0.65 | 0.16 | 0.07 | 0.03 | 0.02 | 0.04 | 0.15 | −0.05 | 1.00 | |
| IPR OECD | −0.06 | 0.68 | −0.04 | 0.42 | 0.85 | 0.34 | 0.06 | 0.09 | 0.04 | −0.03 | 0.11 | 0.01 | 0.61 | 1.00 |
Note: REWP, Electricity Production from Renewable Sources; REWPBP, Renewable Energy Generation; POP, population growth; CO2, CO2 emission; GDP, real gross domestic products; EUSE, energy ese; OIL, oil price; Coal, coal price; Gas, gas price; OILP, electricity production from oil; COALP, electricity production from coal; GASP, electricity production from gas; IPR WIPO, patent granted to environmental technologies; IPR OECD, patent granted to climate mitigation technologies.
References
- EIA. International Electricity Generation. U.S. Energy International Administration. Available online: https://www.eia.gov/international/data/world/electricity/electricity-generation (accessed on 25 August 2021).
- BP Statistical Review of World Energy, 68th ed.; BP plc: London, UK, 2019; Available online: https://www.bp.com/content/dam/bp/business-sites/en/global/corporate/pdfs/energy-economics/statistical-review/bp-stats-review-2019-full-report.pdf (accessed on 29 January 2021).
- Zhang, Y.; Qamruzzaman, M.; Karim, S.; Jahan, I. Nexus between Economic Policy Uncertainty and Renewable Energy Consumption in BRIC Nations: The Mediating Role of Foreign Direct Investment and Financial Development. Energies 2021, 14, 4687. [Google Scholar] [CrossRef]
- Mathews, J.A.; Kidney, S.; Mallon, K.; Hughes, M. Mobilizing private finance to drive an energy industrial revolution. Energy Policy 2010, 38, 3263–3265. [Google Scholar] [CrossRef]
- Zyadin, A.; Halder, P.; Kähkönen, T.; Puhakka, A. Challenges to renewable energy: A bulletin of perceptions from international academic arena. Renew. Energy 2014, 69, 82–88. [Google Scholar] [CrossRef]
- Helm, S.; Tannock, Q.; Iliev, I. Renewable Energy Technology: Evolution and Policy Implications—Evidence from Patent Literature. World Intellectual Property Organization, 2014. Available online: https://www.eldis.org/document/A68704 (accessed on 20 June 2020).
- Downey, K. Intellectual Property Rights and Renewable Energy Technology Transfer in China. South Carol. J. Int. Law Bus. 2012, 9, 90–130. [Google Scholar]
- Newiak, M. The Dual Role of IPRs Under Imitation and Innovation Driven Development; Working Paper; 2001; Available online: https://www.semanticscholar.org/paper/The-Dual-Role-of-Intellectual-Property-Rights-underNewiak/be32246137b7935d142981590aade38940e376c0#paper-header (accessed on 20 August 2021).
- IRENA INSPIRE. RE Technology Patents Reports; International Renewable Energy Agency: Abu Dhabi, United Arab Emirates; Available online: http://inspire.irena.org/Pages/patents/Patents-Search.aspx (accessed on 25 August 2021).
- Li, J.; Omoju, O.E.; Zhang, J.; Ikhide, E.E.; Lu, G.; Lawal, A.I.; Ozue, V.A. Does Intellectual Property Rights Protection Constitute A Barrier To Renewable Energy? An Econometric Analysis. Natl. Inst. Econ. Rev. 2020, 251, R37–R46. [Google Scholar] [CrossRef] [Green Version]
- Gould, D.M.; Gruben, W.C. The role of intellectual property rights in economic growth. J. Dev. Econ. 1996, 48, 323–350. [Google Scholar] [CrossRef] [Green Version]
- Park, W.G.; Ginarte, J.C. Intellectual Property Rights and Economic Growth. Contemp. Econ. Policy 1997, 15, 51–61. [Google Scholar] [CrossRef]
- Siwek, S.E. Copyright Industries in the U.S. Economy: The 2018 Report; International Intellectual Property Alliance: Washington, DC, USA, 2018; Available online: https://iipa.org/files/uploads/2018/12/2018CpyrtRptFull.pdf (accessed on 20 June 2020).
- Falvey, R.; Foster, N.; Greenaway, D. Intellectual property rights and economic growth. Rev. Dev. Econ. 2006, 10, 700–719. [Google Scholar] [CrossRef]
- Park, W.G. Do Intellectual Property Rights Stimulate R&D and Productivity Growth? Evidence from Cross-national and Manufacturing Industries Data. In Intellectual Property and Innovation in the Knowledge-Based Economy; Putnam, J., Ed.; Industry Canada: Ottawa, ON, Canada, 2005; Volume 9, pp. 1–51. [Google Scholar]
- Thomson, R.; Webster, E. The Role of Intelectual Property Rights in Addressing Climate Change: The Case of Agricuture; The University of Melbourne: Melbourne, Australia, 2010. [Google Scholar]
- Gattari, P. The Role of Patent Law in Incentivizing Green Technology. Northwest. J. Technol. Intellect. Prop. 2013, 11, 42–45. [Google Scholar]
- Rai, V.; Schultz, K.; Funkhouser, E. International low carbon technology transfer: Do intellectual property regimes matter? Glob. Environ. Chang. 2014, 24, 60–74. [Google Scholar] [CrossRef]
- Popp, D.; Hascic, I.; Medhi, N. Technology and the diffusion of renewable energy. Energy Econ. 2011, 33, 648–662. [Google Scholar] [CrossRef]
- Johnstone, N.; Haščič, I.; Popp, D. Renewable Energy Policies and Technological Innovation: Evidence Based on Patent Counts. Environ. Resour. Econ. 2010, 45, 133–155. [Google Scholar] [CrossRef]
- Gao, X.; Zhai, K. Performance Evaluation on Intellectual Property Rights Policy System of the Renewable Energy in China. Sustainability 2018, 10, 2097. [Google Scholar] [CrossRef] [Green Version]
- Marques, A.C.; Fuinhas, J.A.; Manso, J. Motivations driving renewable energy in European countries: A panel data approach. Energy Policy 2010, 38, 6877–6885. [Google Scholar] [CrossRef]
- Marques, A.C.; Fuinhas, J.A. Are public policies towards renewables successful?Evidence from European countries. Renew. Energy 2012, 44, 109–118. [Google Scholar] [CrossRef]
- Aguirre, M.; Ibikunle, G. Determinants of renewable energy growth: A global sample analysis. Energy Policy 2014, 69, 374–384. [Google Scholar] [CrossRef] [Green Version]
- Silva, P.P.; Cerqueira, P.A.; Ogbe, W. Determinants of renewable energy growth in Sub-Saharan Africa: Evidence from panel ARDL. Energy 2018, 156, 45–54. [Google Scholar] [CrossRef]
- Rafiq, S.; Bloch, H.; Salim, R. Determinants of renewable energy adoption in China and India: A comparative analysis. Appl. Econ. 2014, 46, 2700–2710. [Google Scholar] [CrossRef] [Green Version]
- Zhao, X.; Luo, D. Driving force of rising renewable energy in China: Environment, regulation and employment. Renew. Sustain. Energy Rev. 2017, 68, 48–56. [Google Scholar] [CrossRef]
- Shah, I.H.; Hiles, C.; Morley, B. How do oil prices, macroeconomic factors and policies affect the market for renewable energy? Appl. Energy 2018, 215, 87–97. [Google Scholar] [CrossRef] [Green Version]
- Damette, O.; Marques, A.C. Renewable energy drivers: A panel cointegration approach. Appl. Econ. 2019, 15, 2793–2806. [Google Scholar] [CrossRef]
- Omri, A.; Nguyen, D. On the determinants of renewable energy consumption: International evidence. Energy 2014, 72, 554–560. [Google Scholar] [CrossRef]
- Lin, B.; Omoju, O.E.; Okonkwo, J.U. Factors influencing renewable electricity consumption in China. Renew. Sustain. Energy Rev. 2016, 55, 687–696. [Google Scholar] [CrossRef]
- Akar, B.G. The Determinants Of Renewable Energy Consumption: An Empirical Analysis For The Balkans. Eur. Sci. J. 2016, 12, 594–607. [Google Scholar] [CrossRef]
- Ergun, S.J.; Rivas, M.F. Determinants of renewable energy consumption in Africa. Environ. Sci. Pollut. Res. 2019, 26, 15390–15405. [Google Scholar] [CrossRef] [PubMed]
- Olanrewaju, B.T.; Olubusoye, O.E.; Adenikinju, A.; Akintande, O.J. A panel data analysis of renewable energy consumption in Africa. Renew. Energy 2019, 140, 668–679. [Google Scholar] [CrossRef]
- Anton, S.G.; Afloarei Nucu, A.E. The effect of financial development on renewable energy consumption. A panel data approach. Renew. Energy 2020, 147, 330–338. [Google Scholar] [CrossRef]
- Farhad, T.-H.; Naoyuki, Y.; Yugo, I.; Peter, J.M. Analyzing the Factors Influencing the Demand and Supply of Solar Modules in Japan. In Asian Development Bank Working Paper 1084; Asian Development Bank Institute: Tokyo, Japan, 2020. [Google Scholar]
- Anderson, T.; Hsiao, C. Formulation and estimation of dynamic models using panel data. J. Econom. 1982, 18, 47–82. [Google Scholar] [CrossRef]
- Holtz-Eakin, D.; Newey, W.; Rosen, H.S. Estimating Vector Autoregressions with Panel Data. Econometrica 1988, 56, 1371–1395. [Google Scholar] [CrossRef]
- Arellano, M.; Bond, S. Some Tests of Specification for Panel Data: Monte Carlo Evidence and an Application to Employment Equations. Rev. Econ. Stud. 1991, 58, 277–297. [Google Scholar] [CrossRef] [Green Version]
- Arellano, M.; Bover, O. Another look at the instrumental variable estimation of error-components models. J. Econom. 1995, 68, 29–51. [Google Scholar] [CrossRef] [Green Version]
- Blundell, R.; Bond, S. Initial conditions and moment restrictions in dynamic panel data models. J. Econom. 1998, 87, 115–143. [Google Scholar] [CrossRef] [Green Version]
- Bun, M.J.; Windmeijer, F. The weak instrument problem of the system GMM estimator in dynamic panel data models. Econom. J. 2010, 13, 95–126. [Google Scholar] [CrossRef] [Green Version]
- Eicher, T.; García-Peñalosa, C. Endogenous strength of intellectual property rights: Implications for economic development and growth. Eur. Econ. Rev. 2008, 52, 237–258. [Google Scholar] [CrossRef]
- Wu, L.; Broadstock, D.C. Does economic, financial and institutional development matter for renewable energy consumption? Evidence from emerging economies. Intern. J. Econ. Policy Emerg. Econ. 2015, 8, 20–39. [Google Scholar] [CrossRef]
- Shahbaz, M.; Raghutla, C.C.; Jiao, Z.; Vinh Vo, X. The effect of renewable energy consumption on economic growth: Evidence from the renewable energy country attractive index. Energy 2020, 207, 118162. [Google Scholar] [CrossRef]
- Lee, S.; Jung, Y. Causal dynamics between renewable energy consumption and economic growth in South Korea: Empirical analysis and policy implications. Energy Environ. 2018, 29, 1298–1315. [Google Scholar] [CrossRef]
- Maji, I.; Sulaiman, C. Renewable energy consumption and economic growth nexus: A fresh evidence from West Africa. Energy Rep. 2019, 5, 384–392. [Google Scholar] [CrossRef]
- Sahlian, D.N.; Popa, A.F.; Cre¸tu, R.F. Does the Increase in Renewable Energy Influence GDP Growth? An EU-28 Analysis. Energies 2021, 14, 4762. [Google Scholar] [CrossRef]
- Wait, A. Investment in Clean Technologies as a Public Good; University of Sydney: Sydney, Australia, 2010. [Google Scholar]
- Hooman, P.; Farhad, T.-H. The Role of Renewable Energy in Resolving Energy Insecurity in Asia; Asian Development Bank Institute: Tokyo, Japan, 2019. [Google Scholar]
- Razmi, S.F.; Bajgiran, B.R.; Mehdi, B.; Salari, T.E.; Razmi, S.M. The relationship of renewable energy consumption to stock market development and economic growth in Iran. Renew. Energy 2020, 145, 2019–2024. [Google Scholar] [CrossRef]
Publisher’s Note: MDPI stays neutral with regard to jurisdictional claims in published maps and institutional affiliations. |
© 2021 by the authors. Licensee MDPI, Basel, Switzerland. This article is an open access article distributed under the terms and conditions of the Creative Commons Attribution (CC BY) license (https://creativecommons.org/licenses/by/4.0/).