Article

A Combined Chemical-Electrochemical Process to Capture CO2 and Produce Hydrogen and Electricity

1
Department of Chemical Engineering, Prairie View A&M University, Prairie View, TX 77446, USA
2
Department of Electrical & Computer Engineering, Prairie View A&M University, Prairie View, TX 77446, USA
*
Author to whom correspondence should be addressed.
Energies 2021, 14(18), 5807; https://doi.org/10.3390/en14185807
Submission received: 31 July 2021 / Revised: 1 September 2021 / Accepted: 3 September 2021 / Published: 14 September 2021
(This article belongs to the Special Issue Novel Technologies for Carbon Dioxide Sequestration)

Abstract

:
Several carbon sequestration technologies have been proposed to utilize carbon dioxide (CO2) to produce energy and chemical compounds. However, feasible technologies have not been adopted due to the low efficiency conversion rate and high-energy requirements. Process intensification increases the process productivity and efficiency by combining chemical reactions and separation operations. In this work, we present a model of a chemical-electrochemical cyclical process that can capture carbon dioxide as a bicarbonate salt. The proposed process also produces hydrogen and electrical energy. Carbon capture is enhanced by the reaction at the cathode that displaces the equilibrium into bicarbonate production. Literature data show that the cyclic process can produce stable operation for long times by preserving ionic balance using a suitable ionic membrane that regulates ionic flows between the two half-cells. Numerical simulations have validated the proof of concept. The proposed process could serve as a novel CO2 sequestration technology while producing electrical energy and hydrogen.

Graphical Abstract

1. Introduction

The Fifth Assessment Report (AR5) of the United Nations Intergovernmental Panel on Climate Change (IPCC), predicts that the global surface temperature by the end of the 21st century could increase by more than 1.5 °C relatively to the average temperature for the 1850–1900 period in most scenarios considered [1]. The decrease of the mean global temperature below the initially predicted 1.5 °C requires global CO2 emissions to be curtailed by 45% by 2030, and achievement of net zero emission by 2050 [1].
Design of efficient CO2 sequestration processes is required to achieve these goals. Process intensification is a discipline that emerged in chemical engineering during the 1970s. A specific description remains elusive; however, size reduction of chemical plants, mitigation of environmental impact, improved energy efficiency, safety, and operation have all been identified as important aspects [2]. The combination of reaction engineering and separation processes leads to significant improvements as the separation process can displaced the reaction equilibrium till higher product formation [3]. The reactive absorption of CO2 in neutral or slightly acidic water solutions is not normally considered for carbon sequestration processes as it proceeds at slow reaction rates, and it has a very small equilibrium constant (7.85 × 10⁻⁹ M at 25 °C) [4]. This value is so small that normally CO2 absorption using aqueous solutions is carried out by high pH solutions [4,5,6].
Several authors have carried out research projects on the chemical conversion of CO2 into high-value-added carbon compounds, such as methanol, organic materials, and plastic materials ([7,8,9,10,11,12,13], among others). However, due to low conversion efficiency, it has been argued that it cannot be an effective greenhouse gas sequestration technology [14,15].
Kim et al. [16] have devised a hybrid Na-CO2 battery that captures CO2 as a bicarbonate salt by displacing the absorption equilibrium reaction in an aqueous solution by using an electrochemical reaction. The cell also produces electric energy and hydrogen simultaneously with highly stable operation over 1000 h. The authors also reported that unlike existing aprotic (non-aqueous) metal-CO2 batteries [17,18,19] the proposed system does not regenerate CO2 during the charging process. Therefore, this hybrid Na-CO2 cell captures CO2, generates electrical energy by battery operation, and produces hydrogen as a byproduct of the electrochemical reaction.
The goal of this work is to develop a simulation model that will represent CO2 capture using an electrochemical process intensification approach based upon Kim et al. [16] work. This theoretical model will be implemented into a computer program to test the concept. Modifications of the proposed model can be used to test different electrode configurations and chemical half-cells. This work will be the subject of future research projects.

2. Materials and Methods

2.1. General Considerations

The system under study is very complex and involves several different important research matters, chemical reactions, electrochemical reactions kinetics, ohmic resistances, electrical double layer theory, and others. A complete study of all these issues is beyond the scope of this work. Every individual issue deserves one, or more, independent studies. Therefore, we have used generic formulations available in the literature to obtained qualitatively sound conclusions. We introduce below a list of issues that required approximations to develop a successful theoretical model that can be used for simulation of this complex process.
  • The evolution of hydrogen on metallic electrodes is a complex process that involves several steps. Some of them are electron transfer steps and others are catalytic in nature (Butler-Volmer, Heyrovsky, Taffel, and combinations ([20,21,22], among others)). There are several kinetic expressions depending upon which step controls the rate of the overall process. Despite the impressive amount of work carried out on this research subject many issues are still not clear. Furthermore, the kinetic behavior depends upon the electrode materials used and operating conditions ([20,21,22,23,24,25,26,27], among others). Some authors even question the existence of a redox mechanism and propose an overpotential-capacitance mechanism for the H2 electrode reaction on Pt [22]. In this work, for simplicity, we used a generic kinetic expression for the evolution of hydrogen under a galvanic cell operating conditions [22], see Section 2.6 below.
  • Even for accepted mechanisms few experimental data are available for the several kinetic parameters necessary for successful simulations. In this project we used literature parameters if available and our own estimates if we could not find values in literature.
  • The theory for electrical double layers (EDLs) in the case of strong electrolytes comprising monovalent ions is well developed for the case of the Gouy-Chapman-Stern model (GCS), ([28,29,30,31], among others). However, the studies published for multi-ion systems show that the theoretical treatment is very complex. In this work we introduced a Debye-Hückel linearization approximation [32] to deal with the several ionic species present, see Section 2.5 below.
  • It is also a complex matter to calculate conductivities of multi-ion solutions [33], especially for high concentrations. We used approximations for these calculations, see Section 2.6 below.

2.2. Model Organization

In this work, we will study the electrochemical cell depicted in Figure 1. The cell is divided into anode and cathode half-cells by an ion exchange membrane (IEM). The presence of the IEM is critical in the operation of the process. More details will be given in the membrane Section 2.4 below. The processes occurring in each half-cell are also listed. The chemical species appearing in each section are shown in the figure. Information about the chemical and electrochemical reactions plus the transport processes are given in the appropriate Section 2.3 and Section 2.6 below.
The derivation of the theoretical cell model requires that we divide the electrochemical cell in the different parts depicted in Figure 2. From left to right we have the following processes:
(1)
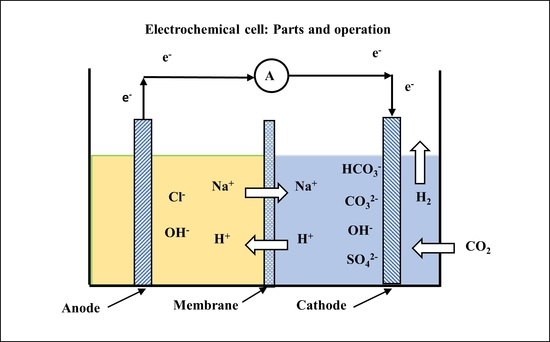
Electrochemical reaction in the anode (oxidation).
(2)
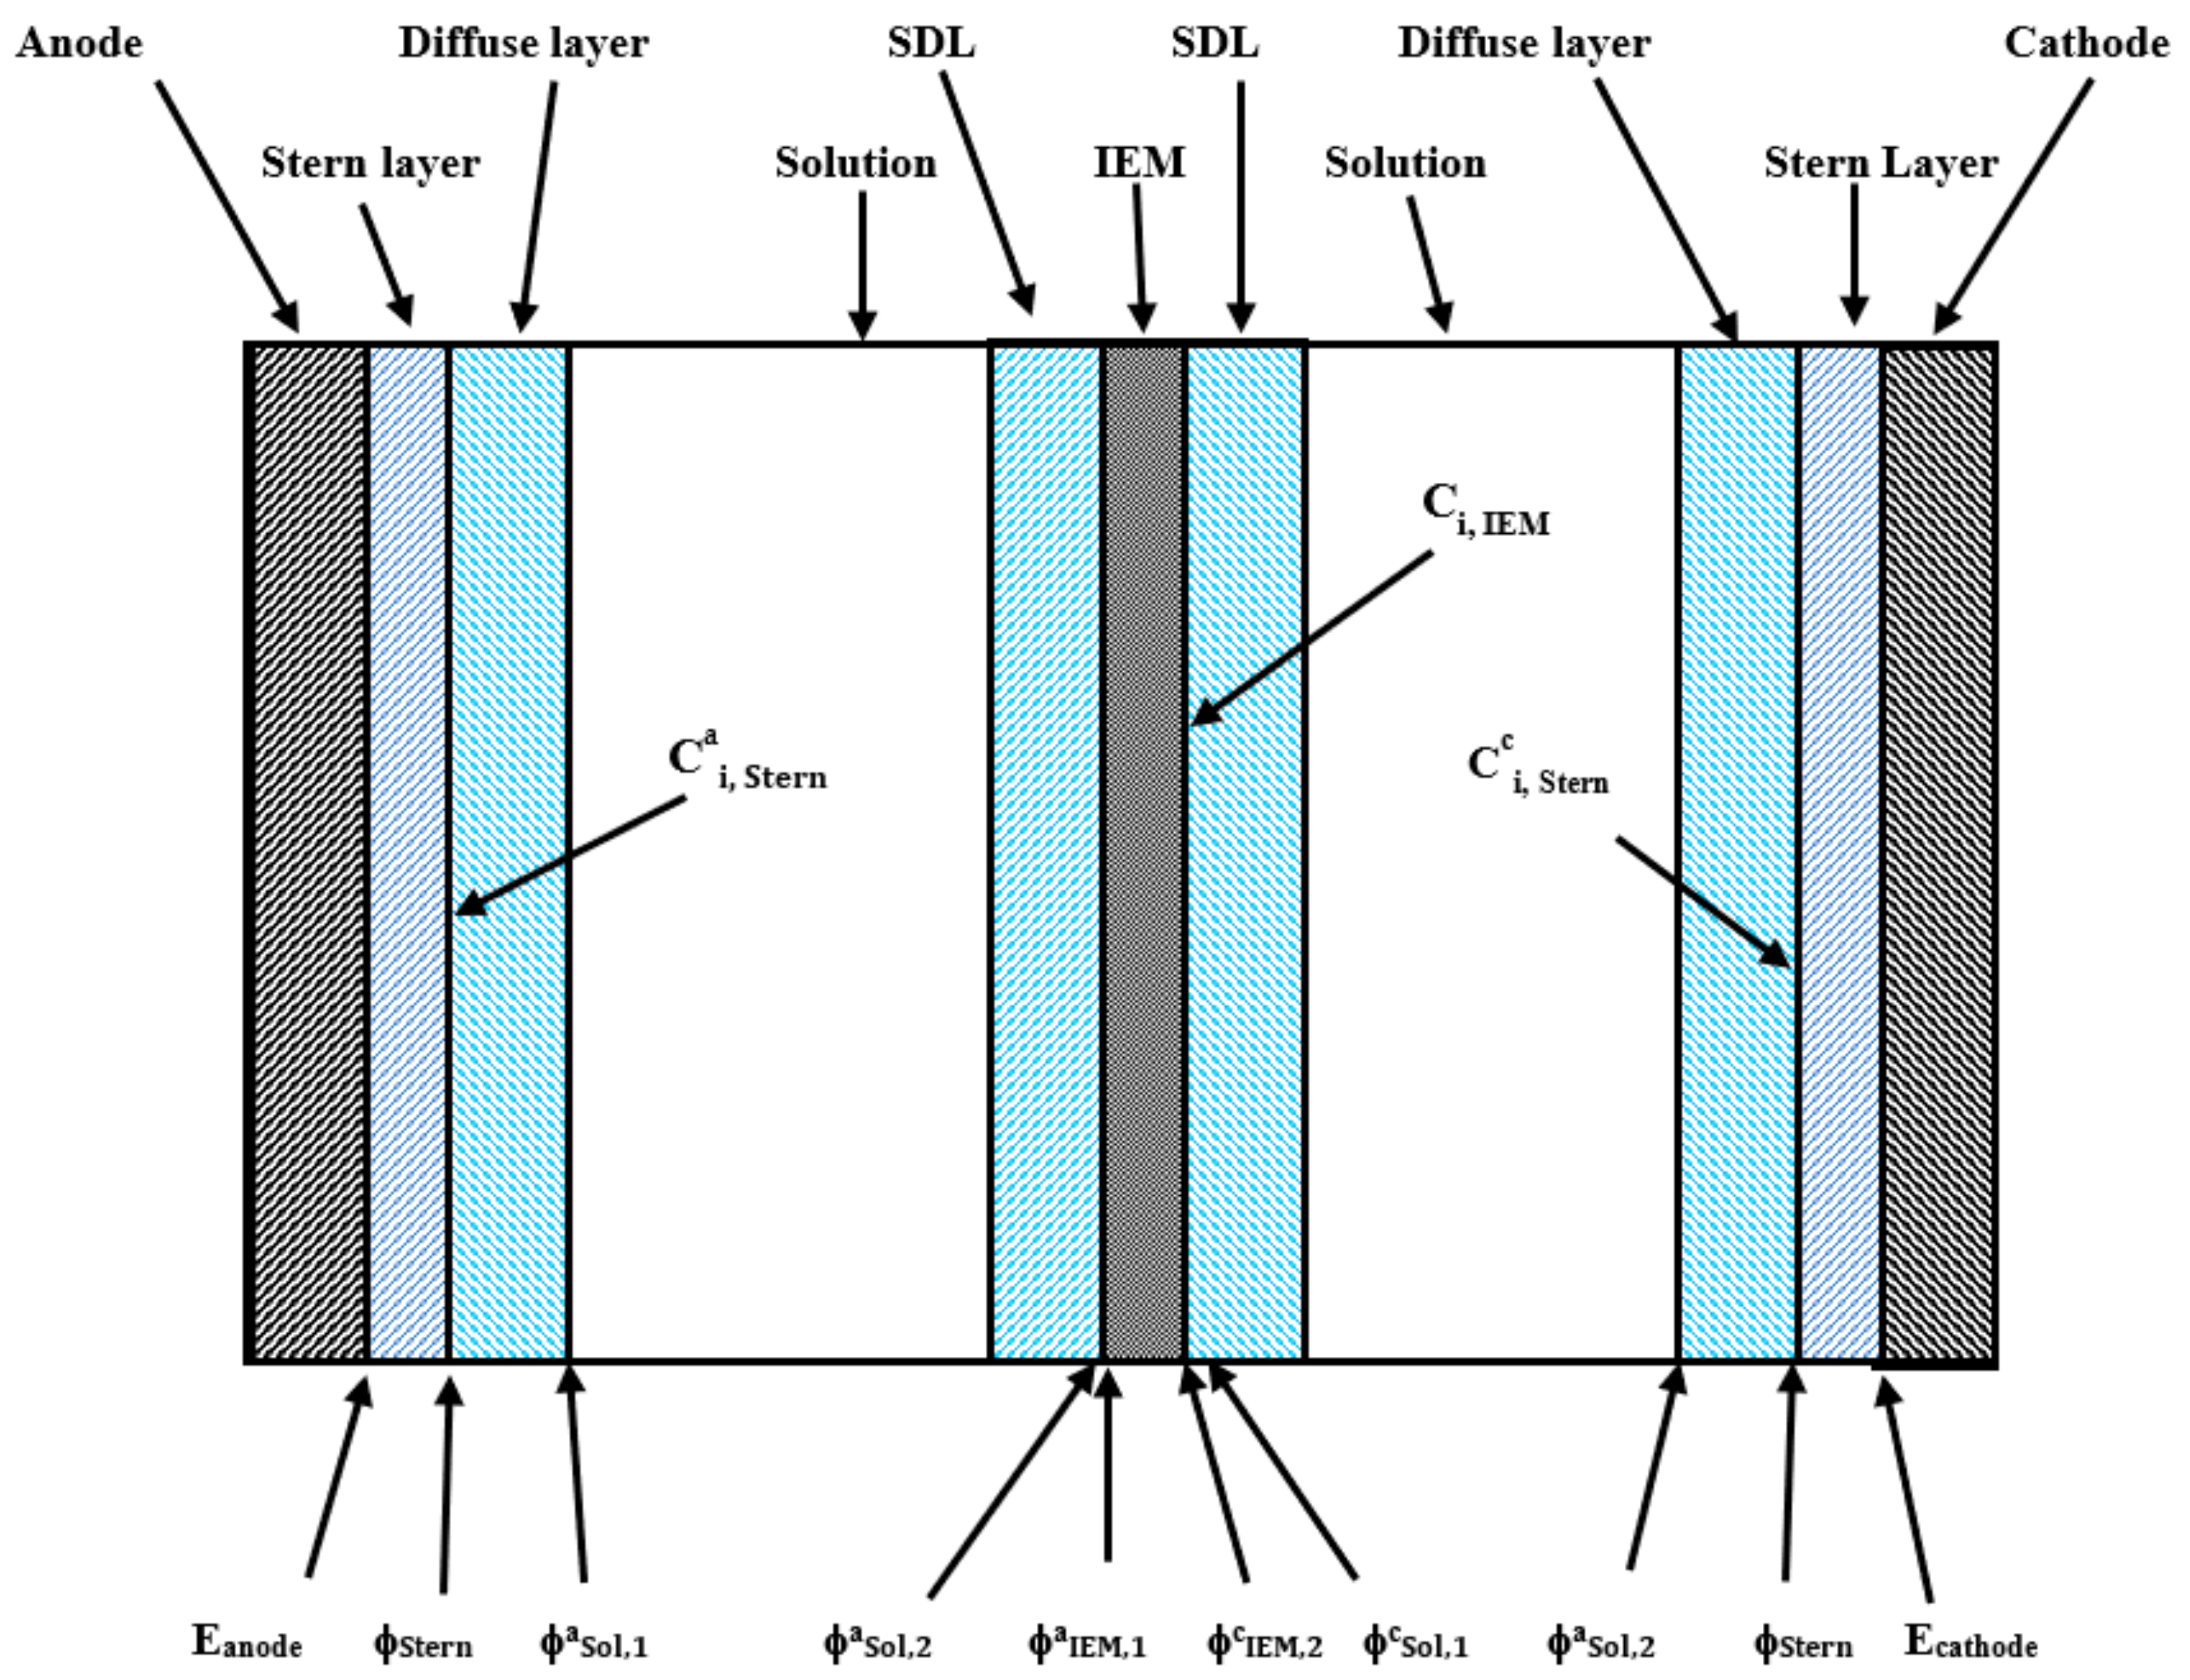
Potential drop through the Stern layer of an electrical double layer (EDL) on the anode side.
(3)
Mass transfer through the diffuse layer of an electrical double layer on the anode side.
(4)
Mass transfer through an aqueous solution in contact with the anode.
(5)
Stagnant double layer in contact with the anionic exchange membrane on the anode side.
(6)
Restricted mass transfer through an ionic exchange membrane (IEM).
(7)
Stagnant double layer in contact with the anionic exchange membrane (IEM) on the cathode side.
(8)
Mass transfer through an aqueous solution in contact with the cathode. Inside the cathode half-cell there is also a chemical reaction between gaseous CO2 and the acidic solution. In this work we bubble in the cathode a gas mixture containing 13% CO2 V/V ratio.
(9)
Mass transfer through the diffuse layer of an electrical double layer on the cathode side.
(10)
Potential drop through the Stern layer of an EDL on the cathode side.
(11)
Electrochemical reaction in the cathode half-cell (reduction).
Figure 2. Descriptions of the different sections used to describe the operation of the electrochemical cell.
Energies 14 05807 g002
The full process includes the electrodes operation (steps 1 and 11), an ion exchange membrane to control ionic transport from the anode to the cathode (step 6), ionic transport inside the solutions in the electrode half-cells (steps 4 and 8), ionic transport between two diffuse layers (steps 3 and 9), potential drops in two Stern layers (steps 2 and 10), and CO2 absorption reaction in the solution located at the cathode half-cell (step 8). The electrical circuit is closed by an electron flow from anode to cathode.
In Figure 2, Ci,j are the concentrations of the i-species at the j-location; ϕj is the electrolyte phase electrostatic potential at the j-location; the a and c superscripts mean anode and cathode side concentrations and potentials, respectively.
We will derive mass and potential balances for every single part and all parts will be assembled to generate a complete model for cell operation.

2.3. Electrode Reactions

The main goal of this project is to develop a model to simulate operation of different half-cell reactions. It is well-known that there are severe practical problems in applying several of the possible anodic half-cells [16]. At this moment we will not consider practical problems in the implementation of our proposed systems. We consider a ‘virtual’ element with the same electrochemical properties as sodium (Na). Of course, metallic Na requires to be handled in non-aqueous solvents [16]. However, for simplicity, we will assume that the practical problems have been solved and keep using Na in the nomenclature. Similar problems happen with K, Li, and other elements, while other metals form oxides that affect the operation of the electrodes, Mg for example, [16].
In the anode we will consider the following reaction:
Na = Na+ + e, E° = −2.71 V
The cathodic reaction under acidic conditions is given by,
2H+ + 2e = H2 (g), E° = 0.0
Therefore, we have generation of Na+ ions in the anodic half-cell and proton reduction in the cathodic half-cell. Other half-cells and reactions conditions can be tested by modifying the model presented in this work. The potentials of each electrode (Ei) are calculated under equilibrium conditions using the Nernst equation [28,29].
E r e d = E r e d o R   T n   F l n a r e d a o x  
In Equations (1)–(3) we considered reduction potentials only; here, E r e d o is the standard reduction electrodes potentials with respect to a hydrogen electrode; n is the number of electrons exchanged in the redox reaction; R is the gas constant; T is the thermodynamic temperature; F is the Faraday constant; and ared and aox are the activities of the reduced and oxidized species in Equation (1) for example.
The total equilibrium cell potential is calculated by,
ΔEcell = EcathodeEanode
where, Ecathode and Eanode are the reduction electrode potentials for the cathode and anode, respectively.

2.4. Ion Exchange Membrane and Stagnant Diffuse Layers

The ion exchange membrane (IEM) plays a critical role in the operation of the electrochemical cell. A cationic membrane is used in this work. The membrane intrinsic negative charge allows free passage to the positive ions (counterions), but severely restricts the passage of negative ions (co-ions). The IEM main function is to allow Na+ ions to move from the anode half-cell where they are generated into the cathode half-cell to balance the H+ ions consumed by the cathodic reaction. The membrane also allows passage of H+ ions from the cathode half-cell into the anode half-cell. The ion exchange membrane controls the value of these ionic fluxes. In this way electroneutrality in both electrode half-cells is maintained and the system can operate continuously. Given the strong membrane charge (w XX) we assumed that the electroneutrality condition is satisfied for all times. This assumption leads to,
i z i   C i ,   c a t i o n M i z i   C i ,   a n i o n M + w X X = 0  
In an ideal membrane Equation (5) leads to,
C N a + M + C H + M + w X X = 0 ,   o r   C N a + M + C H + M = X X      
Here, C i M are the ionic concentrations inside the membrane, w is the sign of the membrane intrinsic charge, −1 for CEM, and XX is the absolute value of the membrane charge (in M units) experimentally determined. In Equation (6), we assumed the presence of a NaCl solution in the anode half-cell and that the membrane behaves ideally, shutting-off completely the co-ions flow, C i , a n i o n M = 0 .
The concentrations of the ions outside and inside the membrane are related by the Donnan equilibrium equation [34,35,36],
C i M = C i ,   s o l j e x p z i Δ ϕ D o n n a n j  
Here, Δ ϕ D o n n a n j is the Donnan potential between membrane and solution, zi is the ion charge, and the superscript j refers to the electrode half-cell, either anode or cathode.
Introducing Equation (7) into Equation (6), after algebraic manipulations we get,
Δ ϕ D o n n a n j = 1 z i l n   C N a + ,   s o l j + C H + ,   s o l j X X = ϕ I E M ,   i j ϕ s o l ,     i j  
Equation (8) allows calculation of the Donnan potential on both sides of the IEM. The ionic flow passing through the membrane can be calculated using [37],
J i ,   M = D M l M   X X   Δ ϕ M    
Here, DM is the diffusivity inside the porous membrane, lM is the membrane thickness, and Δ ϕ M is the potential difference inside the membrane calculated using,
Δ ϕ M = ϕ I E M ,   i a ϕ I E M ,     i c  
In Equation (9) we assumed homogeneous ionic concentrations inside the membrane.
The accounting for two stagnant diffuse layers (SDLs) at both sides of the membrane is also an important step in the process. The ionic transport in both SDLs can be very small; therefore, the rate of the global process will be controlled by the rate of these processes (concentration polarization) [38]. Of course, the rate of these processes can be increased by mechanical agitation. However, sometimes the amount of energy needed is a significant cost in the global process. The degree of concentration polarization occurring in the SDLs regions depends on the local current density and leads to a reduction of the ionic concentration at the solution-membrane interfaces. The limiting current density (ionic concentration at membrane surface assumed zero) results from a depletion of ions in the boundary layer on the solution side and leads to a limitation of ionic transport through the membrane [39]. In this work, we consider the presence of the SDLs by following the procedure presented by Rommerskirchen et al. [39] using the fact that the ion flux in the boundary layer (diffusion and migration) must equal the ion flux in the membrane. We calculate limiting ionic flows in both SDLs, compare the calculated values against Equation (9), and the smallest value is assumed to be the ionic flow through the membrane. The limiting ionic flows were calculated using [39],
I i + , s o l j = 2   D i +   F   C i + ,   s o l j   δ    
Here, δ is the SDL thickness and i+ represents either Na+ or H+.

2.5. Electrical Double Layers (EDLs)

We describe the double-layers using the Gouy-Chapman-Stern model (GCS), which combines a Stern layer of constant capacity, with a diffuse layer where there is a net counterion charge [28]. This model gives the potential drop between the electrode ( e l e c ) and the bulk of the solution ( s o l ) as the sum of a potential drop through the Stern layer ( Δ S t e r n ) and the diffuse layer ( Δ d i f ),
e l e c s o l = Δ d i f + Δ S t e r n  
In the anode EDL the charge formation at the electrode-solution interface has been studied many times in the literature for a symmetric electrolyte, NaCl for example, as [28,29,30],
σ i = Δ S t e r n δ = 2   C i ,   s o l j   sinh Δ d i f 2    
Finally, the excess ionic absorption in the EDL ( w i ) is given [26] by,
w i = 4   C i ,   s o l j sinh 2 Δ d i f 4    
In the cathode the situation is more complex as there are multiple ions in solution. We solved the Poisson-Boltzmann equation [28] for all ions present in the cathode half-cell. Application of the Debye-Hückel linear approximation [32] to the exponential leads to,
d 2 d x 2 = κ 2    
Equation (15) is solved in combination with the following boundary conditions:
@   x   =   y 1 ,   = o  
@   x   =   y 2 ,   = D  
Here, κ 1 is the Debye characteristic length for the process; y1 and y2 are the locations at the bulk of the solution and at the outer Helmholtz plane (OHP), respectively; o and D , are the potential values at the same locations. Equation (15) is solved using the solution proposed below,
= A   e κ   x + B   e κ   x  
Integration of the relationship between potential and distance leads to the calculation of the ionic charge ( σ i ) and excess ionic concentration ( w i ) in the diffuse layer as,
σ i = z i 2   F   C i o y 1 y 2   d x =   z i 2   F   C i o A   κ   e κ   y 2 e κ   y 1 z i 2   F   C i o B   κ   e κ   y 2 e κ   y 1    
w i =   z i   C i o A   κ   [ (   e κ   x ) y 1 y 2 z i   C i o A   κ (   e κ   x ) y 1 y 2 ]   =   z i   C i o A   κ   e κ   y 2 e κ   y 1 z i   C i o B   κ   e κ   y 2 e κ   y 1    
The constants A and B are calculated from boundary conditions given by Equations (16) and (17). Introduction of these values into Equations (19) and (20) leads to the calculation of the voltage drop,
σ = D o   F κ   z i 2   C i o   ,   o r   D o = σ   κ   F   z i 2   C i o  
Equations (20) and (21) are very important for the calculations of the charge and mass balance in the anode and cathode half-cells below.

2.6. Anode and Cathode Bulk Solutions

We carry out mass and charge balances in both solution half-cells for every single ion present. Every half-cell is considered a well-mixed CSTR reactor without internal transport. There are no chemical reactions in the anode half-cell. The following reactions occur in the cathode half-cell:
C O 2   a q . + H 2 O K 1   H C O 3 + H +   a q .  
C O 2   a q . + O H   K 2   H C O 3   a q .
The reaction scheme is completed by including the following reactions:
H 2 O   K w   H + + O H  
H C O 3 K a 2   C O 3 = + H +
In dealing with Equations (22)–(24) we have used the kinetic approach presented in references [4,19] and described in Equations (38)–(41) below.
The authors think that using concentrations in this work instead of activities is warranted because the biggest source of error in the model is produced by the estimates of the kinetic constants in the generalized Frumkin-Butler-Volmer model, Equations (36)–(41) below. However, for completeness we modified the computer code used in this work to introduce calculation of the activity coefficients ( γ i ) using the Davies [40] equation:
l o g 10 γ i = 0.51   z i 2 { I 1 + I 0.3   I }
Here, I is the solution ionic strength calculated by,
I = i z i 2   C s o l ,   i j / 2
This equation is an empirical extension of the Debye-Hückel model to improve accuracy and extend application to solutions of an ionic strength equal or below 0.5 M. The Davies equation is only used for temperatures close to 25 °C. No significant changes were found using the correction. Results showing the differences between using concentrations or activities are included in the Supplementary Materials.
A generic mass balance is given by [35],
C s o l ,   i j t = r i + a j   J i ,   M a j   J i ,   D L j = r i + a j   J i ,   M a j   J i ,   F a j w i t
In Equation (28), a j is the j-half-cell sectional area per unit volume, r i is the production of the i-species by chemical reaction, J i ,   M is the molar flow of the i-species leaving or entering the half-cell from the membrane, J i ,   D L is the molar flow of i-species leaving/entering the EDLs, J i ,   F is the production/consumption of the i-species by the electrode reaction per unit area. J i ,   F is defined positive as the i-species leaves the electrolyte into the electrode. J i ,   M is defined positive when is entering the solution phase (cathode) and negative when is leaving the solution phase (anode). Of course, some chemical species take part in chemical reactions and/or electrode reactions others not, so Equation (28) is a generic equation that needs to be written in the following specific way for every chemical species in anode and cathode.

2.6.1. Anode

C N a + ,   s o l a t = a a   J N a + ,   M a a   J N a + ,   F a a w N a + t
C H + ,   s o l a t = a a   J N a + ,   M a a w H + t
C C l ,   s o l a t = a a w C l t
C O H ,   s o l a = K w C H + , s o l a

2.6.2. Cathode

C N a + ,   s o l c t = a c   J N a + ,   M a c w N a + t
C H + ,   s o l c t = r H + a c   J H + ,   M a c   J H + ,   F a c w H + t
C H C O 3 ,   s o l c t = r H C O 3 a c w H C O 3 t
C O H ,   s o l a = K w C H + , s o l a
C C O 3 ,   s o l a = K a 2   C H C O 3 , s o l a C H + , s o l a  
Here, the rate of production by chemical reactions of the bicarbonate and H+ ions are given by,
r H C O 3 = R 21 + R 22
r H + = R 21
R 21 = k f 21 C O 2 a q . k r 21   H C O 3 H +  
R 22 = k f 22 C O 2 a q . O H k r 22   H C O 3  
Here, R i represents the net rate of Equation (i), k f i is the forward specific rate constant of Equation (i), k r i is the reverse specific rate constant of Equation (i), the a c w i t terms represent the mass ion fluxes into the EDLs, and CO2 (aq.) is the aqueous concentration of CO2 assumed at equilibrium with the gas phase. In this work we used a high CO2 concentration (13% V/V) in the gas phase typical of flue gas waste streams. The value of CO2 (aq.) is provided in Table A1 in the Appendix A.
The calculation of J i ,   F , the production/consumption of the i-species by the electrode reaction per unit area, was done by using the generalized Frumkin-Butler-Volmer equation, which for a one-electron reaction can be represented in dimensional form as [41,42],
J i , F = K R   C O i ,   S t e r n   e x p Δ S t e r n 2   V T K O   C R i ,   S t e r n   e x p Δ S t e r n 2   V T  
Here, C O i ,   S t e r n and C R i ,   S t e r n are the molar volumetric concentrations at the reaction plane. We have assumed that the charge transfer coefficients of the oxidation and reductions steps are equal to ½, (αO = αR = ½), and where KR and KO are kinetic rate constants for the reduction and oxidation reaction, respectively; C O i ,   S t e r n and C R i ,   S t e r n are the molar volumetric concentrations at the reaction plane (equated with the Stern plane, OHP). The concentrations at the reaction plane can be related to the bulk concentrations using the Poisson-Boltzmann distribution [28] by
C O i ,   S t e r n = C O i ,   b u l k   e x p z 1   Δ d i f V T
C R i ,   S t e r n = C R i ,     e x p z   Δ d i f V T
Here, z is the charge sign of the reduced species.
Introducing Equations (43) and (44) into (42) leads to (45)
J i , F = K R   C O i ,   bulk   e x p Δ d i f V T Δ S t e r n 2 V T K O   C R i , bulk e x p Δ S t e r n 2   V T  
We followed several authors ([40,41], among others) by introducing the concept of overpotential ( η   = Δ Δ e q ) to get equations like the classical Butler-Volmer equation [29]. This procedure leads to,
J i , F = K O   C R i ,   bulk   e x p η 1 e x p   z Δ d i f V T +   Δ S t e r n 2   V T
where, Δ e q is the equilibrium potential calculated from Equation (43) when the electrode reaction vanishes ( J i , F = 0 ) as,
Δ e q = l n ( K R   C O i ,   bulk   K O   C R i ,   bulk )
Equation (44) is formally identical to Equation (11) in Biesheuvel et al. [35]. In the case of a neutral species formed by reduction of a monovalent cation, Equation (44) becomes,
J i , F = K O   C R i ,   bulk   e x p η 1 e x p   Δ S t e r n 2   V T
The potential drops in the cathode and anode half-cells are calculated following the procedure proposed by Rommerskirchen et al. [39].
Δ φ l o s s j = h j κ j   I      
Here, h j is the j-half-cell width, and I is the current density (A/m2) passing through the j-half-cell; and κ j ; is the specific conductivity of the solution in the j-half-cell, which is a function of the salt concentration in the solution j-half-cell, calculated by
κ j = c i j   λ i j + κ s o l j      
Here, κ s o l j is the specific conductivity of the solvent, considered to be zero for the dilute solutions and λ i j are the molar conductivities of the i-ionic species in either the anode or cathode, calculated as,
λ i j = λ i j ,   K i c i j    
where, λ i j ,   are the infinite dilution molar conductivities of the i-ionic species and K i is the Kohlrausch constant appearing from using the Kohlrausch’s law of independent migration of ions [43]. In the case of multivalent ions, the molar conductivities are calculated on equivalent bases not molar [29]. Because in the electrode half-cells, we have multi-ionic species we added individual ionic conductivities instead of salt conductivities. The Kohlrausch constants were calculated from linearization of conductivity vs. concentration curves for different ionic compounds at low concentrations. The values used in our calculations are shown in Table A2 in the Appendix A.

3. Results and Discussion

The theoretical model described in the sections above was implemented in a custom-made FORTRAN computer code. This computer code was checked for consistency by performing potential calculations replacing the membrane with a salt-bridge. The error produced by using concentrations instead of activities was tested by comparing the results produced by computer codes with and without activity coefficient calculations. Results of these calculations are shown in a Supplementary Materials file. The authors were not able to find in literature experimental data and/or simulation results to perform a proper validation of the computer code. In order, to compare simulation results using the electrochemical cell and CO2 absorption in a chemical reactor without redox reaction and transport through an IME we also simulated the transient behavior of a batch chemical reactor with the same dimensions of the cathode half-cell. This chemical reactor is operated in batch mode, but there is a continuous input/output flow of a flue gas stream containing 13% V/V CO2. The input data used in our simulations are shown in Table A1 in the Appendix A. The simulation results are shown in Figure 3, Figure 4, Figure 5, Figure 6, Figure 7 and Figure 8.
Figure 3 depicts the time variation of the Na+ and H+ molar fluxes (mol m−2 s−1) against the maximum flux allowed by the ionic membrane. Estimates of diffusion limiting fluxes, not shown here, were significantly below the membrane limiting total flux, and higher than the calculated Na+ and H+ volumetric flows. If this situation persists charge separation will appear on both sides of the membrane until the ionic transport will be stopped (concentration polarization [44]). The cathode side has the smallest limiting flux. Therefore, agitation should be provided. The diffusion limited fluxes were calculated using Equation (11). The value of the SDL thickness (d) is inversely proportional to the amount of agitation; therefore, increased agitation will decrease the d value and increase the limiting ionic flux.
The results presented in Figure 3 show that for the set of conditions used in the simulations the molar fluxes are smaller than the maximum membrane fluxes. Therefore, in all our simulation we adopted the membrane flux as the limiting value for ionic fluxes. In traditional two half cells systems a salt bridge allows movement of anions and cations from one half cell to the other to maintain electroneutrality and reduce unfavorable concentration gradients. However, the presence of the membrane severely restricts the movement of co-ions. In this work we assume the presence of an ideal ionic membrane; therefore, there is no movement of anions from one cell to the other as only cations can move across the membrane. This restriction requires a complex balance between the cation fluxes between the two half cells and the ionic consumption/generation in the electrodes. Furthermore, the chemical reaction generates anions, mainly bicarbonate. These constraints produce a flux of Na+ ions through the cathode and a flux of H+ ions through the anode. In this work we defined the Na+ flux as positive, so the hydrogen flux is negative. These ionic flows produce ionic concentration variations in both half-cells. Typical results are also shown in Figure 4 where the variation of the concentrations of Na+ and H+ are shown as a function of time. We can see in the Figure 4 that the concentration of Na+ decreases in the anode and increases in the cathode while the concentration of H+ decreases in the cathode and increases in the anode. The sum of both cations concentrations always satisfies the electroneutrality condition. In the case of the H+ cation at short times the cathode concentration is higher in the cathode half-cell that at the cathodic half-cell. The difference between both concentrations decreases as time increases until the anode half-cell concentration is bigger than the cathode one. This effect is produced because the migration and diffusion fluxes oppose each other at long times. However, the migration flux that moves from high potential to low potential is always higher than the diffusion flux.
The overpotentials and equilibrium potentials calculated using Equations (43)–(47) are depicted in Figure 5. The equilibrium overpotential in the anode is small and constant and it has been omitted due to its high negative dimensionless value (~−110).
There are only small variations on the values of the overpotential and equilibrium potential values at the anode half-cell. The overpotential at the cathode increases with time representing the change in concentration produced by the cation fluxes. The absolute value of the cathode overpotential is bigger than the anodic one.
A comparison with a batch reactor of the same dimensions as the cathodic half-cell and equal initial conditions with the electrochemical cell is shown in Figure 6. In Figure 6a we can see that the concentration reaches the equilibrium value in a very short time and there is no change in this value as time increases. This figure shows the limitations of a typical chemical reactor, once equilibrium has been reached no further improvement is possible. In Figure 6b, we show the corresponding time change of the H+ ion concentration. In the batch reactor the H+ concentration slightly increases contributing to reducing the bicarbonate equilibrium concentration. On the other hand, on the electrochemical cell the H+ concentration decreases continuously increasing the HCO3− concentration value to higher values as time increases.
The continuous decrease in the H+ produces the increase production of the bicarbonate ion in the electrochemical cell. Inspection of Equations (32)–(36) show that this effect is produced by the consumption of H+ ions by the electron transfer reaction in the cathode and the mass flux through the cationic membrane. The relative importance of these two mechanisms is depicted in Figure 7 where the absolute values of the volumetric flow of hydrogen (JH+/Lcathode) and the rate of the reduction reaction (Jc,F) are plotted vs. time. Both quantities act like sinks that consume the H+ ion. We can see in Figure 7 that the electrode reaction consumes more H+ ion than the mass flux through the membrane.
We established that hydrogen gas is evolved in the cathode. The rate of production of hydrogen gas (mol m−2 s−1) is plotted in Figure 8. The results shown in Figure 8 have been calculated from the values calculated for the cathodic reaction. The rate of hydrogen production decreases as time increases until reaching steady state.
The cell potential has been relatively constant throughout our calculations, as it can be concluded from the results from Figure 5. A net flux of ions will move through the solution from the anode into the cathode while a corresponding electron flux will move from the anode into the cathode through an external electric circuit. The electron flow can be calculated from the net ionic flow from:
I i o n i c = F   i z i   J i    
The variation of the net ionic flux with time is shown in Figure 9.
The current decreases as time increases until a constant value is achieved (exchange current).

4. Conclusions

A theoretical model to study a combination of an electrochemical cell and chemical reaction for CO2 absorption has been proposed. The theoretical model relies on several assumptions as there is no agreement in the literature about several important matters. The model was implemented in a custom-made FORTRAN computer code. Assumptions were made in estimation of the several parameters required for the simulations. The operation of an electrochemical cell consisting of a cathodic acidic hydrogen evolution half-cell and a metallic ‘virtual’ sodium dissolution half-cell was studied. This system was selected for the process to function as a galvanic cell. An ion-exchange membrane regulated ion flow between the two half-cells. Electroneutrality is the driving force in both half-cells; however, due to mass transport resistances, concentration polarization layers can appear and slow or stop the process. Transport through the ionic membrane also pose a constraint to ionic transport processes; therefore, we concluded that agitation is needed. A Na+ ionic flux from the cathode to the anode and a H+ ionic from anode to cathode were observed. Simulation results showed that the system produces hydrogen gas at the cathodic half-cell and an electron flux in the external circuit from anode to cathode. A comparison between a batch chemical reactor and the electrochemical system studied in this work showed that significantly more CO2 is absorbed in our proposed system. The increased absorption is produced by the H+ ion consumption in the cathodic half-cell. The H+ concentration decreases with time due to a proton flux through the membrane into the anode and electrochemical production of hydrogen gas in the cathode.
In conclusion, the theoretical function of the system as intended has been established. A model that can be used to study different half-cell processes and ionic membranes has been reported. This model can help improve process design.

Supplementary Materials

The following are available online at https://www.mdpi.com/article/10.3390/en14185807/s1, Section SM1: Chemical reactions in the cathode, Section SM2: Electroneutrality, Section SM3: Effect of activity coefficients corrections, Figure SM1: Comparison of cation fluxes, Figure SM2: Comparison between produced bicarbonate concentrations with and without activity correction, Figure SM3: Comparison of calculated H+ concentration in the anode with and without correction.

Author Contributions

N.S. participated in investigation, formal analysis, and writing—review and editing; S.B. participated in conceptualizations, and writing—review and editing; J.F.G. participated in methodology, software, formal analysis, and writing—original draft; J.O.A. participated in funding acquisition, project management, and writing—review and editing. All authors have read and agreed to the published version of the manuscript.

Funding

Support for this research provided by the Texas A&M System Chancellor’s Initiative, Prairie View A&M University (SMART MICROGRID) is kindly acknowledged. Partial support (Nabila Shamim and Jorge Gabitto) by two RISE Grants from the office of the Vice-President of Research at PVAMU is also acknowledged. This study was conducted at Prairie View A&M University.

Institutional Review Board Statement

Not applicable.

Informed Consent Statement

Not applicable.

Data Availability Statement

Not applicable.

Conflicts of Interest

The authors declare no conflict of interest.

Appendix A

Table A1. Values used in the simulations.
NotationParameterValue/RangeUnits
E a 0 Anode half-cell standard potential−2.71V
E c 0 Cathode half-cell standard potential0.0V
k R a Anodic reaction forward constant6.65 × 10−4s−1
k R c Cathodic reaction forward constant4.43 × 10−4s−1
k O a Anodic reaction reverse constant6.65 × 10−4s−1
k O c Cathodic reaction reverse constant6.65 × 10−4s−1
C O 2   g Initial CO2 concentration in gas phase0.0054M
C O 2   g Initial CO2 gas phase volume fraction13% V/V
H C O 2 Henry Constant CO20.8285 C C O 2 l C C O 2 g
C H + 0 Initial H+ cathodic concentration0.01–0.1M
C N a + 0 Initial Na+ anodic concentration0.1–0.01M
k f 1 Reaction 1 forward constant0.024s−1
K 1 Reaction 1 equilibrium constant7.31 × 10−7M
k f 2 Reaction 2 forward constant5.86 × 103s−1 M−1
K 2 Reaction 2 equilibrium constant4.51 × 107M−1
K w Ionic water product1 × 10−14M2
K a 2 Carbonic acid second dissociation constant5.0 × 10−11M
L a Anode length0.1m
L c Cathode length0.1m
H c e l l Cell height0.1m
W c e l l Cell width0.1m
L M Membrane thickness0.002m
e M Membrane void fraction0.4(-)
XMembrane charge1M
wMembrane charge sign−1(-)
TTemperature293K
P 0 Standard total pressure1 × 105Pa
Table A2. Values used in calculating potential drop in the half-cells.
NotationParameterValue/RangeUnits
λ H + 0 H+ ion conductivity at infinite dilution349.8S cm2 mol−1
λ N a + 0 Na+ ion conductivity at infinite dilution50.1S cm2 mol−1
λ O H 0 OH ion conductivity at infinite dilution198.3S cm2 mol−1
λ C l 0 Cl ion conductivity at infinite dilution76.3S cm2 mol−1
λ S O 4 2 0 SO42− ion conductivity at infinite dilution160.0S cm2 mol−1
λ H C O 3 0 HCO3 ion conductivity at infinite dilution44.5S cm2 mol−1
λ C O 3 2 0 CO32− ion conductivity at infinite dilution138.6S cm2 mol−1
K H + H+ ion Kohlrausch Constant106.92S cm2 L1/2 mol−3/2
K N a + Na+ ion Kohlrausch Constant40.55S cm2 L1/2 mol−3/2
K O H OH ion Kohlrausch Constant73.37S cm2 L1/2 mol−3/2
K C l Cl ion Kohlrausch Constant46.35S cm2 L1/2 mol−3/2
K S O 4 2 SO42− ion Kohlrausch Constant122.86S cm2 L1/2 mol−3/2
K H C O 3 HCO3 ion Kohlrausch Constant39.31S cm2 L1/2 mol−3/2
K C O 3 2 CO32− ion Kohlrausch Constant109.92S cm2 L1/2 mol−3/2

References

  1. Intergovermental Panel on Climate Change (IPCC). Climate Change 2014: Synthesis Report. Contribution of Working Groups I, II and III to the Fifth Assessment Report of the Intergovernmental Panel on Climate Change; IPCC: Geneva, Switzerland, 2014; Available online: https://www.ipcc.ch/report/ar5/syr/ (accessed on 4 July 2021).
  2. Kim, Y.-H.; Park, L.K.; Yiacoumi, S.; Tsouris, C. Modular Chemical Process Intensification: A Review. Annu. Rev. Chem. Biomol. Eng. 2017, 8, 359–380. [Google Scholar] [CrossRef]
  3. Timberlake, K.; Timberlake, W. Basic Chemistry, 4th ed.; Pearson: Upper Saddle River, NJ, USA, 2014; pp. 454–456. [Google Scholar]
  4. Greer, T. Modeling and Simulation of Post Combustion CO2 Capturing. Master’s Thesis, Faculty of Technology, Telemark University College, Porsgrunn, Norway, 2008. [Google Scholar]
  5. Hikita, H.; Asai, S.; Takatsuka, T. Absorption of Carbon Dioxide into Aqueous Sodium Hydroxide and Sodium Carbonate-Bicarbonate Solutions. Chem. Eng. J. 1972, 11, 131–141. [Google Scholar] [CrossRef]
  6. Hikita, H.; Asai, S.; Takatsuka, T. Gas absorption with a two-step instantaneous chemical reaction. Chem. Eng. J. 1972, 4, 31–40. [Google Scholar] [CrossRef]
  7. Li, P.-Z.; Wang, X.-J.; Liu, J.; Lim, J.S.; Zou, R.; Zhao, Y. A Triazole-Containing Metal–Organic Framework as a Highly Effective and Substrate Size-Dependent Catalyst for CO2 Conversion. J. Am. Chem. Soc. 2016, 138, 2142–2145. [Google Scholar] [CrossRef] [PubMed]
  8. Liu, C.; Yang, B.; Tyo, E.C.; Seifert, S.; DeBartolo, J.; von Issendorff, B.; Zapol, P.; Vajda, S.; Curtiss, L.A. Carbon Dioxide Conversion to Methanol over Size-Selected Cu4 Clusters at Low Pressures. J. Am. Chem. Soc. 2015, 137, 8676–8679. [Google Scholar] [CrossRef] [PubMed]
  9. Angamuthu, R.; Byers, P.; Lutz, M.; Spek, A.L.; Bouwman, E. Electrocatalytic CO2 Conversion to Oxalate by a Copper Complex. Science 2010, 327, 313–315. [Google Scholar] [CrossRef] [PubMed] [Green Version]
  10. Nielsen, D.U.; Hu, X.-M.; Daasbjerg, K.; Skrydstrup, T. Chemically and electrochemically catalysed conversion of CO2 to CO with follow-up utilization to value-added chemicals. Nat. Catal. 2018, 1, 244–254. [Google Scholar] [CrossRef]
  11. Xu, L.; Xiu, Y.; Liu, F.; Liang, Y.; Wang, S. Research Progress in Conversion of CO2 to Valuable Fuels. Molecules 2020, 25, 3653. [Google Scholar] [CrossRef]
  12. More, G.S.; Srivastava, R. Synthesis of amino alcohols, cyclic urea, urethanes, and cyclic carbonates and tandem one-pot conversion of an epoxide to urethanes using a Zn–Zr bimetallic oxide catalyst. Sustain. Energy Fuels 2021, 5, 1498–1510. [Google Scholar] [CrossRef]
  13. Jelmy, E.J.; Thomas, N.; Mathew, D.T.; Louis, J.; Padmanabhan, N.T.; Kumaravel, V.; John, H.; Pillai, S.C. Impact of structure, doping and defect-engineering in 2D materials on CO2 capture and conversion. React. Chem. Eng. 2021. [Google Scholar] [CrossRef]
  14. Bourzac, K. We Have the Technology. Nature 2017, 550, S66–S69. [Google Scholar] [CrossRef] [PubMed] [Green Version]
  15. Markewitz, P.; Kuckshinrichs, W.; Leitner, W.; Linssen, J.; Zapp, P.; Bongartz, R.; Schreiber, A.; Muller, T.E. World-wide Innovations in the development of Carbon Capture Technologies and the Utilization of CO2. Energy Environ. Sci. 2012, 5, 7281–7305. [Google Scholar] [CrossRef] [Green Version]
  16. Kim, C.; Kim, J.; Joo, S.; Bu, Y.; Liu, M.; Cho, J.; Kim, G. Efficient CO2 Utilization via a Hybrid Na-CO2 System Based on CO2 Dissolution. iScience 2018, 9, 278–285. [Google Scholar] [CrossRef] [PubMed] [Green Version]
  17. Qie, L.; Lin, Y.; Connell, J.W.; Xu, J.; Dai, L. Highly Rechargeable Lithium-CO2 Batteries with a Boron- and Nitro-gen-Codoped Holey-Graphene Cathode. Angew. Chem. Int. Ed. 2017, 56, 6970–6974. [Google Scholar] [CrossRef] [PubMed]
  18. Hu, X.; Sun, J.; Li, Z.; Zhao, Q.; Chen, C.; Chen, J. Rechargeable Room-Temperature Na-CO2 Batteries. Angew. Chem. Int. Ed. 2016, 55, 6482–6486. [Google Scholar] [CrossRef]
  19. Al Sadat, W.I.; Archer, L.A. The O2-assisted Al/CO2 electrochemical cell: A system for CO2 capture/conversion and electric power generation. Sci. Adv. 2016, 2, e1600968. [Google Scholar] [CrossRef] [Green Version]
  20. Bockris, J.O.; Mauser, H. The kinetics of the evolution and dissolution of hydrogen at electrodes. Can. J. Chem. 1959, 37, 475–488. [Google Scholar] [CrossRef]
  21. Radhakrishnamurthy, P.; Sathyanarayana, S.; Reddy, A.K.N. Kinetics of hydrogen evolution reaction on a stainless steel electrode. J. Appl. Electrochem. 1977, 7, 51–55. [Google Scholar] [CrossRef]
  22. Cheng, K.L.; Ashraf, N.; Wei, G. A New Overpotential—Capacitance Mechanism for H2 Electrode. Sensors 2006, 6, 1187–1198. [Google Scholar] [CrossRef] [Green Version]
  23. Rheinländer, P.J.; Herranz, J.; Durst, J.; Gasteiger, H.A. Kinetics of Hydrogen Oxidation/Evolution Reaction on Poly-crystaline Platinum in Alkaline Electrolyte Reaction Order with Respect to Hydrogen Pressure. J. Electrochem. Soc. 2014, 161, F1448–F1457. [Google Scholar] [CrossRef]
  24. Shinagawa, T.; Garcia-Esparza, A.T.; Takanabe, K. Insight on Tafel slopes from a microkinetic analysis of aqueous electrocatalysis for energy conversion. Sci. Rep. 2015, 5, 13801. [Google Scholar] [CrossRef] [Green Version]
  25. Tang, M.T.; Liu, X.; Ji, Y.; Norskov, J.K.; Chan, K. Modeling Hydrogen Evolution Reaction Kinetics through Explicit Water–Metal Interfaces. J. Phys. Chem. C 2020, 124, 28083–28092. [Google Scholar] [CrossRef]
  26. Bao, F.; Kemppainen, E.; Dorbandt, I.; Bors, R.; Xi, F.; Schlatmann, R.; Van De Krol, R.; Calnan, S. Understanding the Hydrogen Evolution Reaction Kinetics of Electrodeposited Nickel-Molybdenum in Acidic, Near-Neutral, and Alkaline Conditions. ChemElectroChem 2021, 8, 195–208. [Google Scholar] [CrossRef]
  27. Deluccia, J.J. Electrochemical aspects of hydrogen in metals. In Hydrogen Embrittlement: Prevention and Control; ASTM International. Special Technical Paper 962; ASTM: Philadelphia, PA, USA, 2008; pp. 17–34. [Google Scholar] [CrossRef]
  28. Bockris, J.O.; Reddy, A.K.; Gamboa-Aldeco, M.E. Modern Electrochemistry 2B: Fundamentals of Electrodics; Springer: Berlin/Heidelberg, Germany, 1998. [Google Scholar]
  29. Newman, J.; Thomas-Alyea, K.E. Electrochemical Systems, 3rd ed.; John Wiley and Sons, Inc.: Hoboken, NJ, USA, 2004. [Google Scholar]
  30. Bazant, M.Z.; Thornton, K.; Ajdari, A. Diffuse-charge dynamics in electrochemical systems. Phys. Rev. E 2004, 70, 021506. [Google Scholar] [CrossRef] [PubMed] [Green Version]
  31. Biesheuvel, P.; Bazant, M. Nonlinear dynamics of capacitive charging and desalination by porous electrodes. Phys. Rev. E 2010, 81, 031502. [Google Scholar] [CrossRef] [PubMed] [Green Version]
  32. Debye, P.; Hückel, E. The Theory of Electrolytes. 1. Freezing Point Depression and Related Phenomena. Translated from German by M. J. Braus (2020). Phys. Z. 1923, 24, 185–206. [Google Scholar]
  33. McCleskey, R.B.; Nordstrom, D.K.; Ryan, J.N. Comparison of Electrical Conductivity Calculation Methods for Natural Waters. Limnol. Oceanogr. Methods 2012, 10, 952–967. [Google Scholar] [CrossRef]
  34. Pivonka, P.; Smith, D.; Gardiner, B. Modeling of Donnan Equilibrium in Charged Porous Materials—A Scale Transition Analysis Transport. Porous Media 2007, 69, 215–237. [Google Scholar] [CrossRef]
  35. Biesheuvel, P.M.; Fu, Y.; Bazant, M.Z. Diffuse charge and Faradaic reactions in porous electrodes. Phys. Rev. E 2011, 83, 061507. [Google Scholar] [CrossRef] [Green Version]
  36. Galama, A.H.; Post, J.W.; Hamelers, H.V.M.; Nokonenko, V.V.; Biesheuvel, P.M. On the Origin of the Membrane Potential Arising Across Densely Charged Ion Exchange Membranes: How Well Does the Teorell-Meyer-Sievers Theory Work? J. Membr. Sci. Res. 2016, 2, 128–140. [Google Scholar]
  37. Biesheuvel, P.; Zhao, R.; Porada, S.; van der Wal, A. Theory of membrane capacitive deionization including the effect of the electrode pore space. J. Colloid Interface Sci. 2011, 360, 239–248. [Google Scholar] [CrossRef] [PubMed] [Green Version]
  38. Mishchuk, N.A. Concentration polarization of interface and non-linear electrokinetic phenomena. Adv. Colloid Interface Sci. 2010, 160, 16–39. [Google Scholar] [CrossRef] [PubMed]
  39. Rommerskirchen, A.; Ohs, B.; Hepp, K.A.; Femmer, R.; Wessling, M. Modeling continuous flow-electrode capacitive deionization processes with ion-exchange membranes. J. Membr. Sci. 2018, 546, 188–196. [Google Scholar] [CrossRef]
  40. Davies, C.W. Ion Association; Butterworths: London, UK, 1962; pp. 37–53. [Google Scholar]
  41. Soetsbergen, M.v. Frumkin-Butler-Volmer Theory and Mass Transfer. Electrochem. Cells Russ. J. Electro-Chem. 2012, 48, 570–579. [Google Scholar]
  42. Biesheuvel, P.M.; Fu, Y.; Bazant, M.Z. Electrochemistry and capacitive charging of porous electrodes in asymmetric multicomponent electrolytes. Russ. J. Electrochem. 2012, 48, 580–592. [Google Scholar] [CrossRef] [Green Version]
  43. Castellan, G.W. Physical Chemistry, 3rd ed.; The Benjamin-Cummings Publishing Company, Branch from Pearson Education; Pearson: San Francisco, CA, USA, 1983. [Google Scholar]
  44. Guiver, M.D.; Hoek, E.M.V.; Nikonenko, V.; Tarabara, V.V.; Zydney, A.L. Membrane Terminology. In Encyclopedia of Membrane Science and Technology; Wiley: Hoboken, NJ, USA, 2013; Volume 3, pp. 2219–2228. [Google Scholar]
Figure 1. Electrochemical cell schematic.
Energies 14 05807 g001
Figure 3. Comparison of simulated and limiting flows.
Energies 14 05807 g003
Figure 4. Cation variations in both half-cells.
Energies 14 05807 g004
Figure 5. Calculated overpotential and equilibrium potential values at the cathode and anode half-cells.
Energies 14 05807 g005
Figure 6. Comparison of the electrochemical cell and a batch reactor, (a) Bicarbonate ion concentration variation with time, (b) H+ concentration variation with time.
Energies 14 05807 g006
Figure 7. Time variation of processes consuming the proton ion in the cathode, JH+ is the volumetric H+ flux through the membrane and Jc,F is the net rate of the cathode reaction.
Energies 14 05807 g007
Figure 8. Rate of hydrogen gas production per unit electrode area in the cathode.
Energies 14 05807 g008
Figure 9. Net ionic current variation with time.
Energies 14 05807 g009
Publisher’s Note: MDPI stays neutral with regard to jurisdictional claims in published maps and institutional affiliations.

