
Important Technical Considerations in Design of Battery Chargers of Electric Vehicles

 , , ,
, , ,  and
and 
Abstract
:1. Introduction
2. General Overview
3. Trade-Offs and Constraints
3.1. Switching and Conduction Losses
- The resistance of the IGBT during “on state” () linked in series to the internal resistance of the inductor. The resultant resistance is named R, as shown in Figure 5. R equals plus the internal resistance of the inductor L.
- An independent current source linked in parallel to the capacitor of the DC bus, . It is named , as shown in Figure 5.
3.2. Efficiency
- Obviously, high-quality electrical elements with low resistances, for instance, IGBTs with little and inductors with little internal resistances can be used in order to decrease the conduction losses according to (7), (9), and (10). On the other hand, using high-quality elements increases cost because they are more expensive.
- Lower , IGBTs with lower and , and lower switching frequency can be selected in order to decrease the switching losses according to (6), (9), and (10). On the other hand, the following is also the case:
- -
- Lower decreases cost because the capacitor with lower nominal voltage is used. Capacitors with lower nominal voltages are cheaper.
- -
- Lower reduces the maximum ability of the IGBT leg to inject current to the battery. The maximum possible value for the battery current is decreased (see Section 3.9). In fact, the high-side voltage () has less power to inject the energy to the battery.
- -
- Lower increases the duty cycle of the IGBT leg (), and the control system proceeds towards the saturation condition. The duty cycle is limited to zero and one. Lower results in duty cycles close to one (near saturation condition or over-modulation [7]).
- -
- IGBTs with lower and increase cost because more expensive switches are bought.
- -
- Lower switching frequency involves slower switches, thereby decreasing cost. Switches with lower speeds are cheaper.
- -
- Lower switching frequency causes an increase in the amplitude of the ripple of the battery current . The inductance of the IGBT leg () should be selected higher in order to decrease the ripple. However, it increases cost, volume, and weight.
- The switching loss depends heavily on the characteristics of the IGBTs ( and ), the switching frequency (), and the DC link voltage (). In order to decrease due to an increase in , higher-quality IGBTs with higher voltage and power levels can be utilized. These values heavily depend on the characteristics of the IGBTs, design of the IGBT gate drivers, and so on. On the other hand, is commonly assessed as the percentage of or . It is sensible to compare with and for each prototype. In fact, the efficiency can be an index for making reasonable assessments.
3.3. Transformer and Isolation
- It creates isolation.
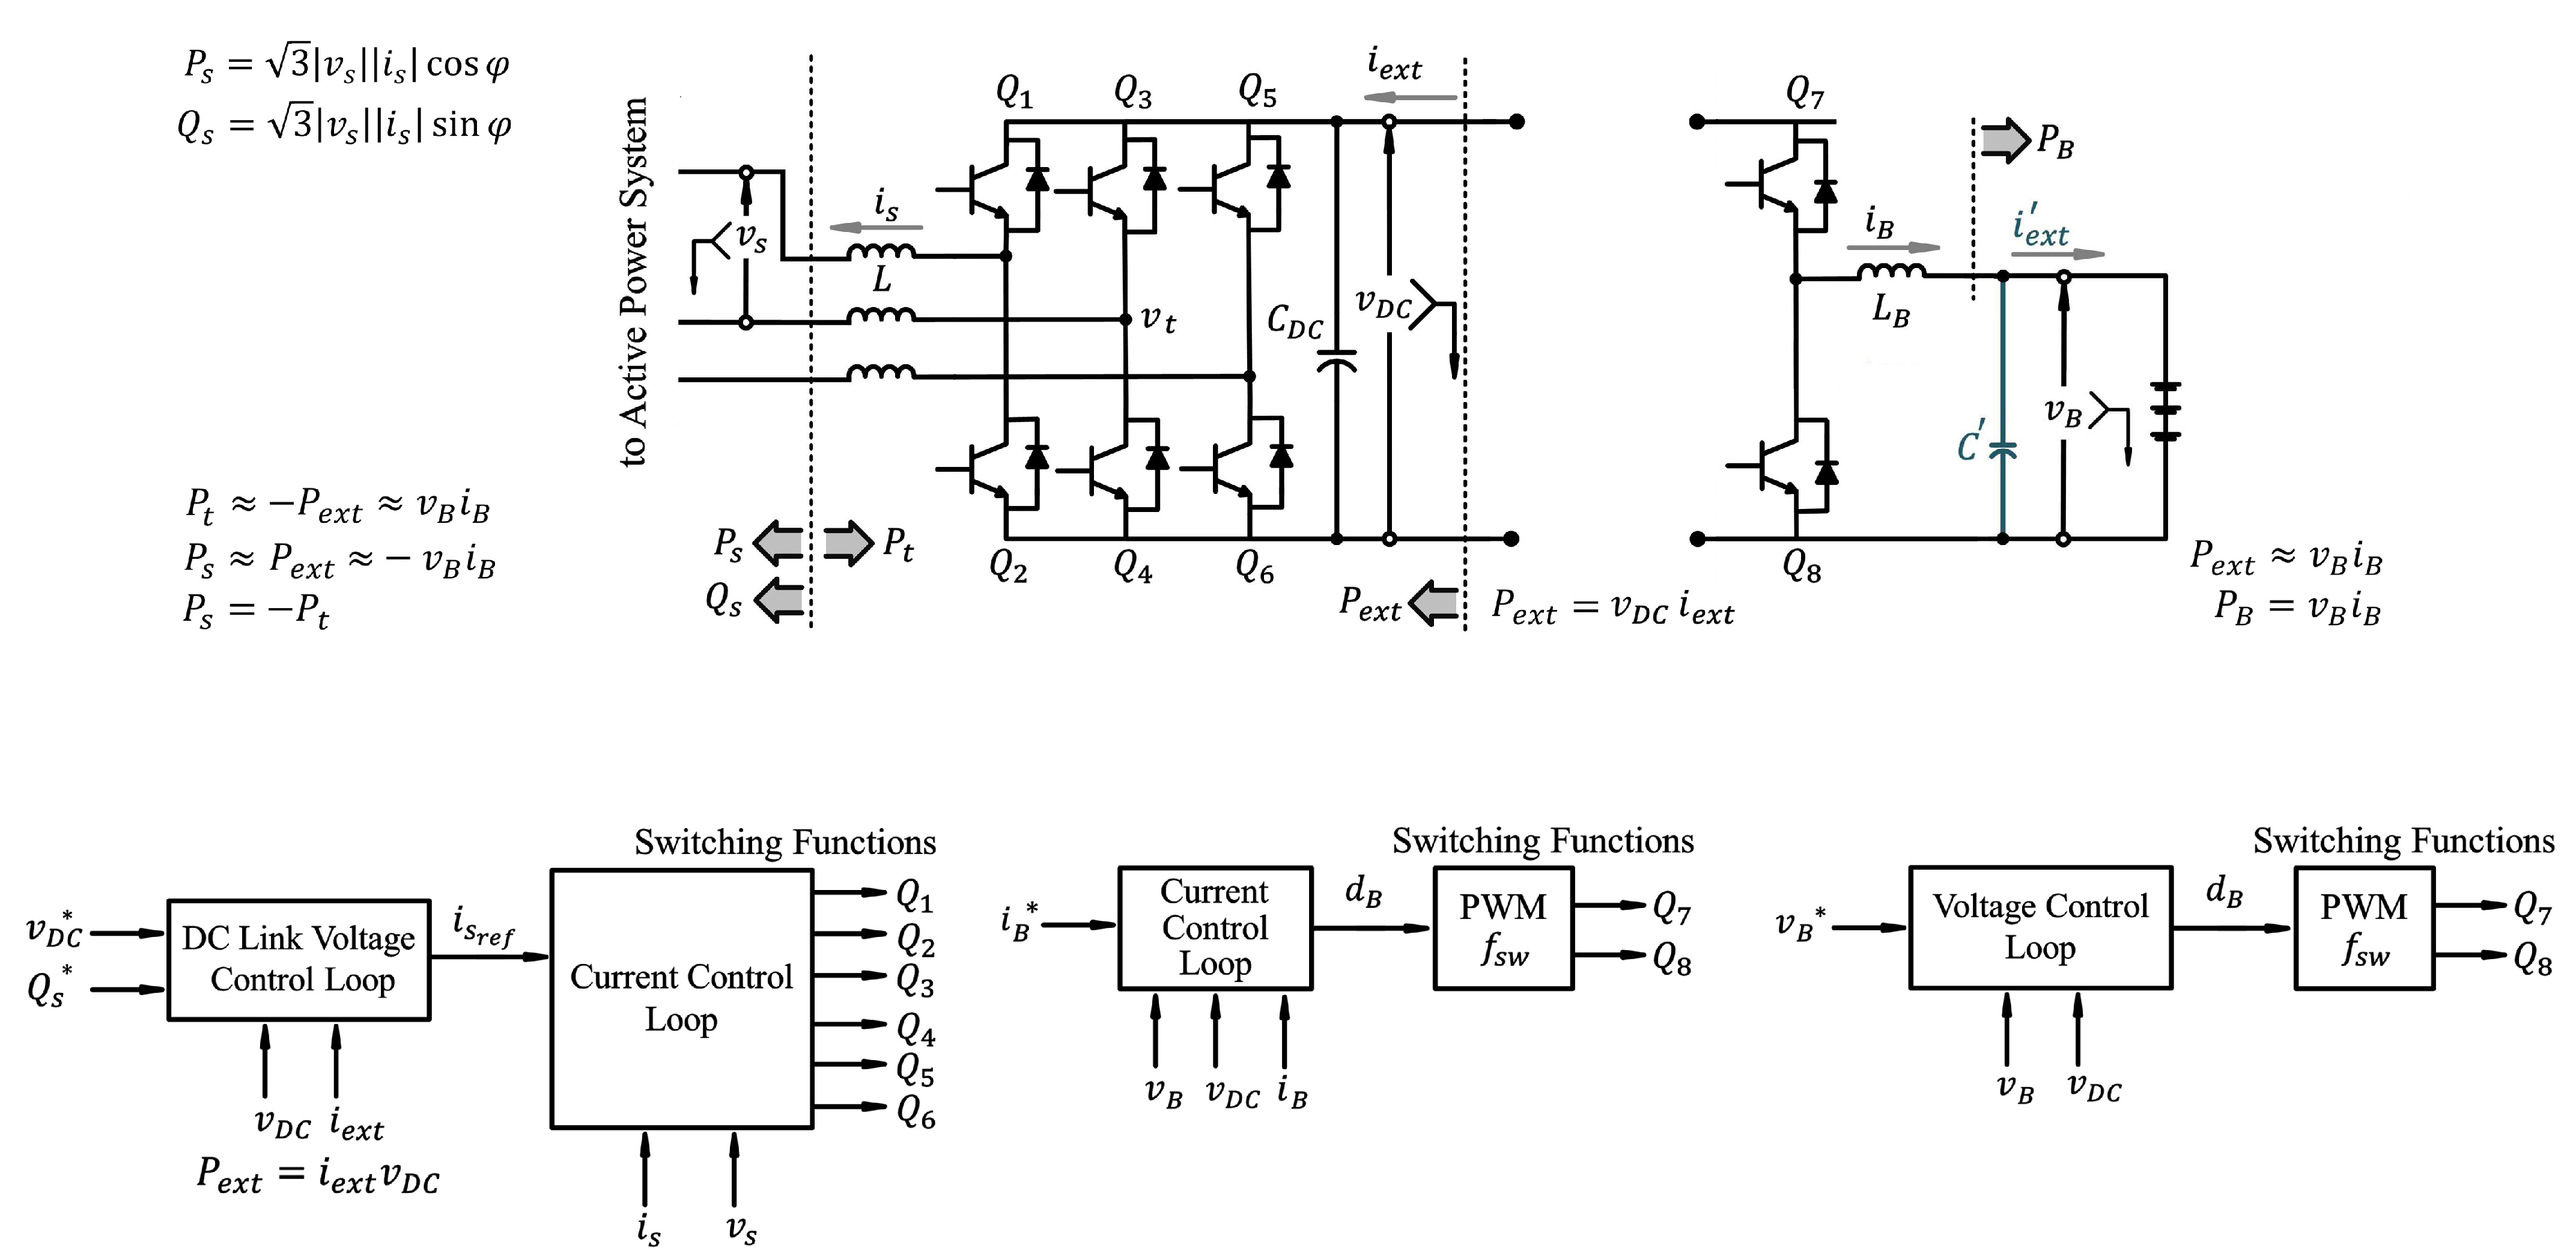
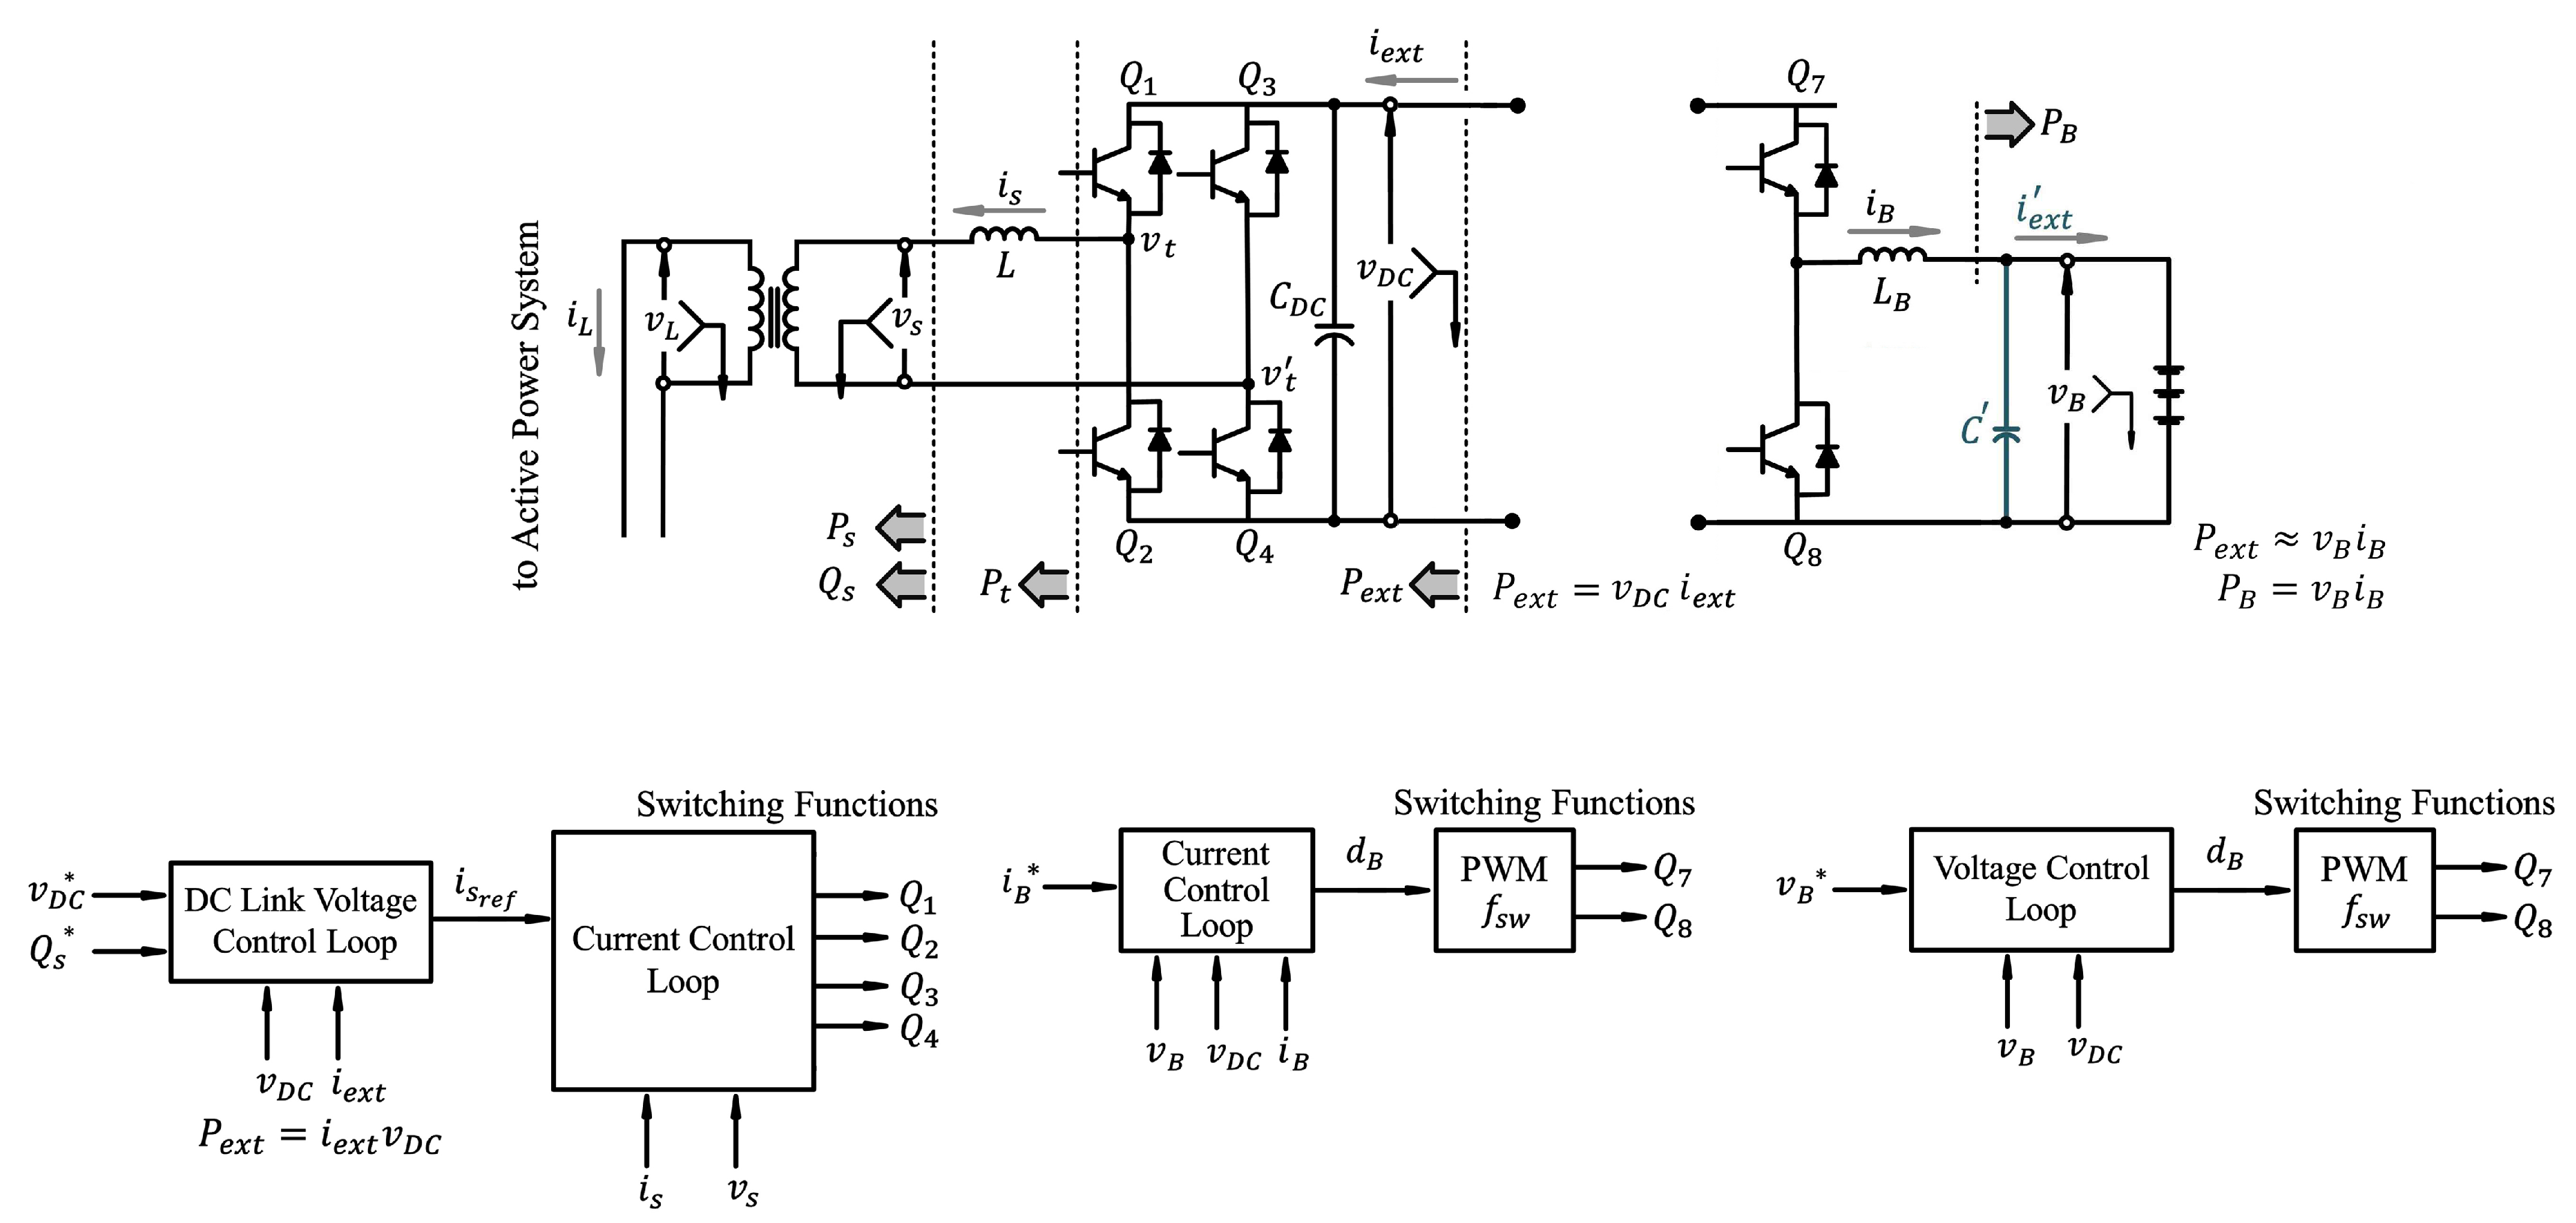
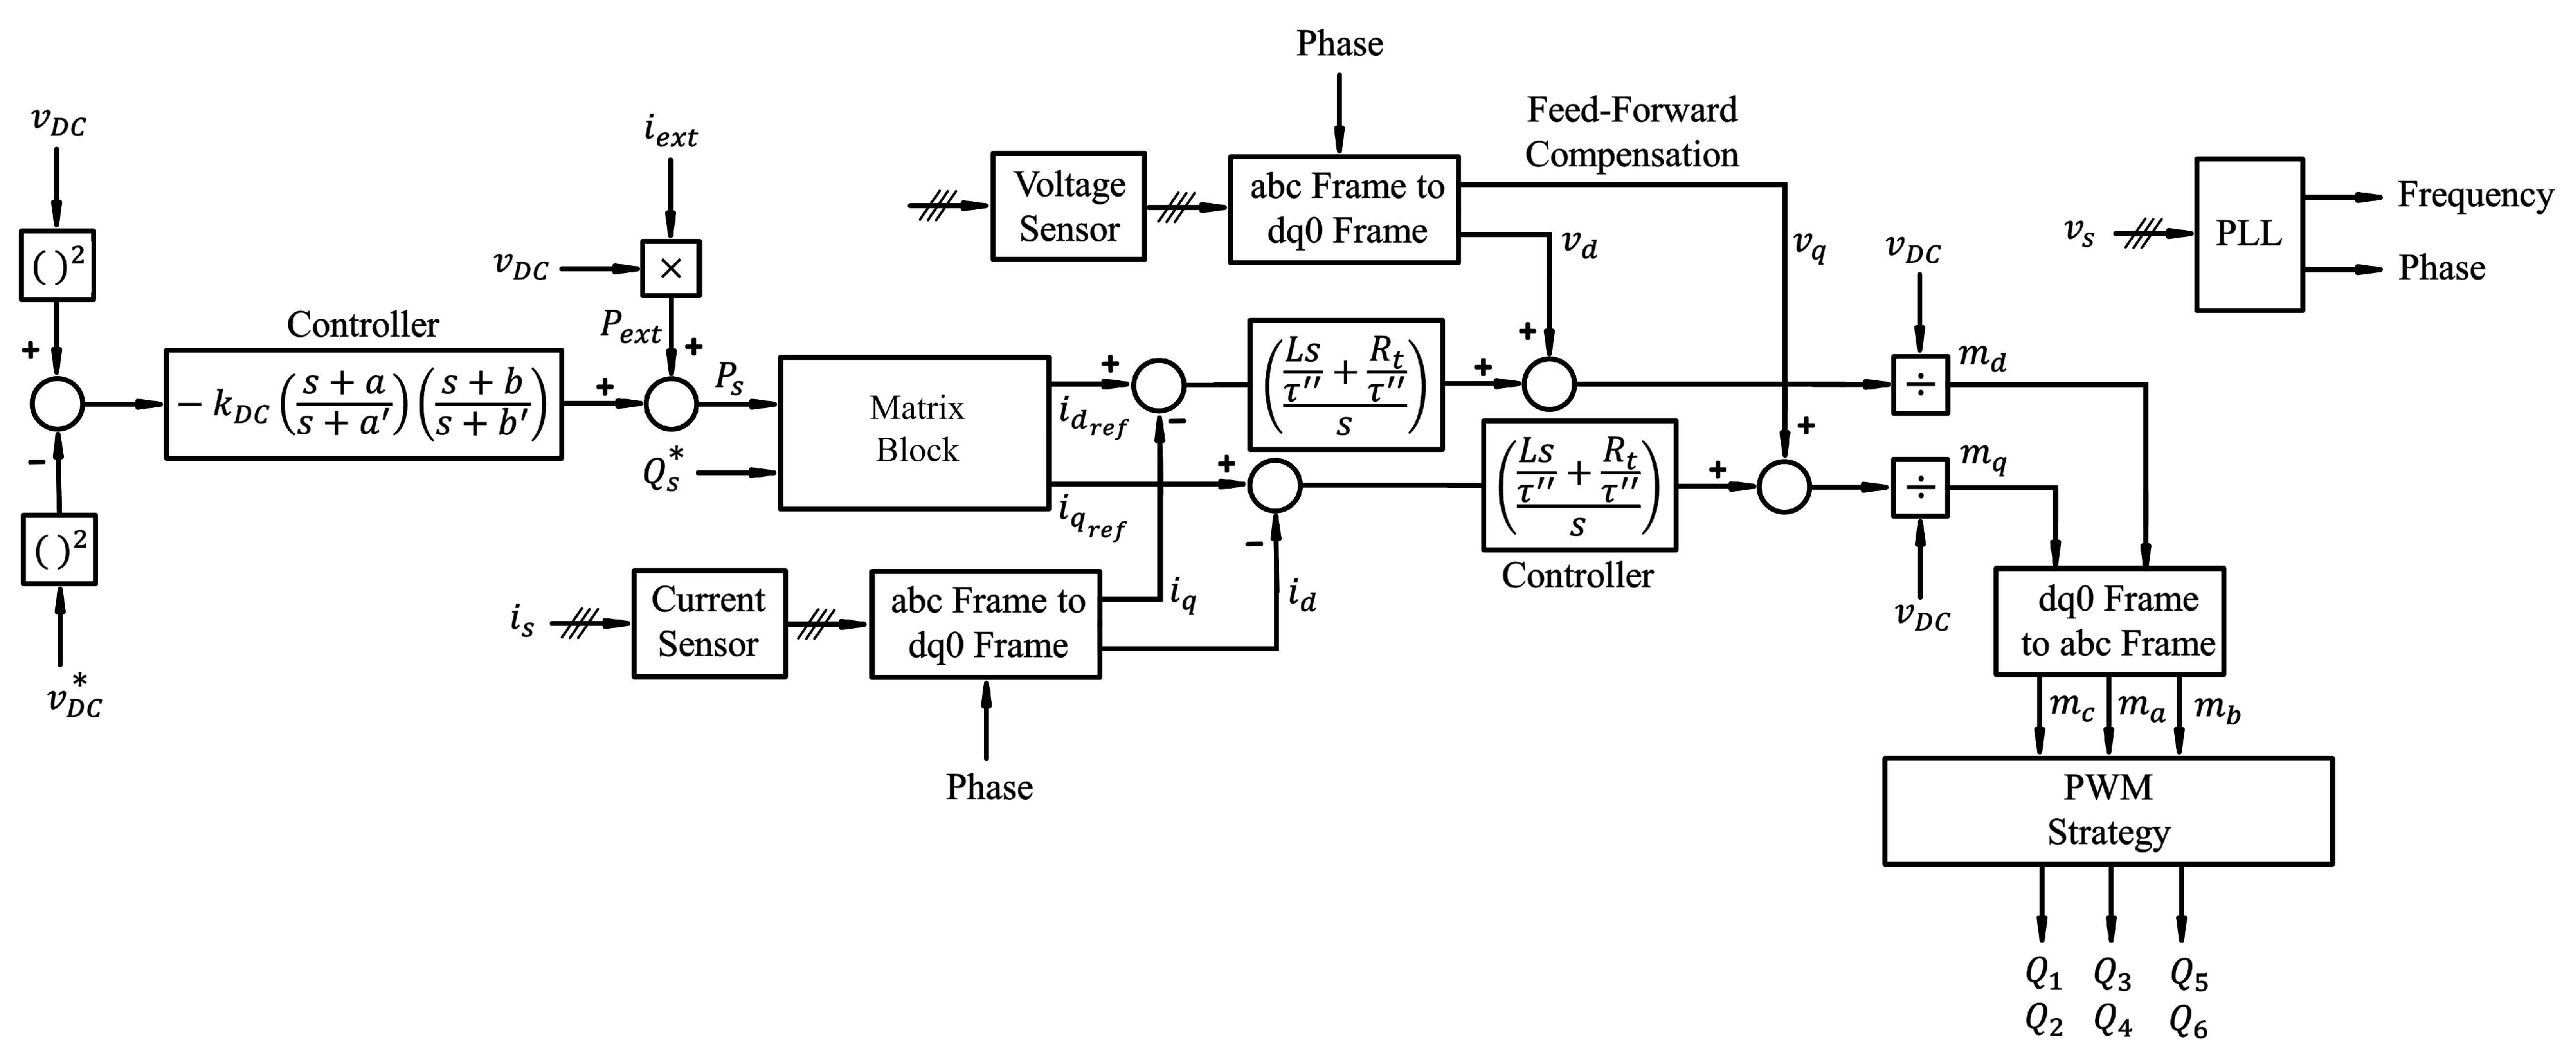
- With the exception of isolation, the transformer has a duty to provide reduced voltage for the converter. It considerably increases the reactive power generation and causes the control system to work far from the saturation condition. Overmodulation occurs when the control system in the DC-AC part generates the duty-cycle control signals for the IGBTs more than one. The over-modulation entails low-harmonics in the spectrum of the AC-side terminal current and voltage [7]. Moreover, the control system cannot successfully track the reference commands of and ( and , respectively), and the power quality thereby deteriorates. In order to avoid the over-modulation, the magnitude of the AC-side terminal voltage of the voltage source converter has to be kept at less than half of the magnitude of [7]. We have the following.According to [7], Equation (17) is differently stated as follows.lIt includes steady-state and transient parts. The derivative parts are approximately zero during steady-state conditions. Thus, Equation (18) can be written even smaller. By assuming , Equation (18) is rewritten as follows [7].Thus, there are typically serious technical limitations on and the rate of change of ; that is, . The reference command of must be confined in order to avoid the overmodulation when the system works under steady-state condition. Rate limiters and saturation limiters have been used and adjusted for the control system based on the maximum values of and . The control system cannot appropriately work without help of these limiters. Based on Equation (19), it is inferred that increases for a specific value of if is decreased. Therefore, if the transformer creates the voltage difference between the microgrid and the converter (that is, it reduces ), the ability of the converter in reactive power generation is greatly enhanced.Equation (19) also reveals that we can use lower if decreased. This means that we can purchase a cheaper DC link capacitor () with lower nominal voltage. Additionally, if is decreased, the switching losses decrease according to the mentioned discussions about the switching losses. On the other hand, lower reduces the maximum ability of the IGBT leg to inject current to the battery and to push the control system towards the saturation condition.If the voltage level at the AC-side terminal is reduced, the current level increases for a specific constant power level. This means that more current flows through the inductor L and the transformer (shown in Figure 1); thus, the conduction losses increase. Increases in volume, weight, and cost are other disadvantages of the three-phase transformer.
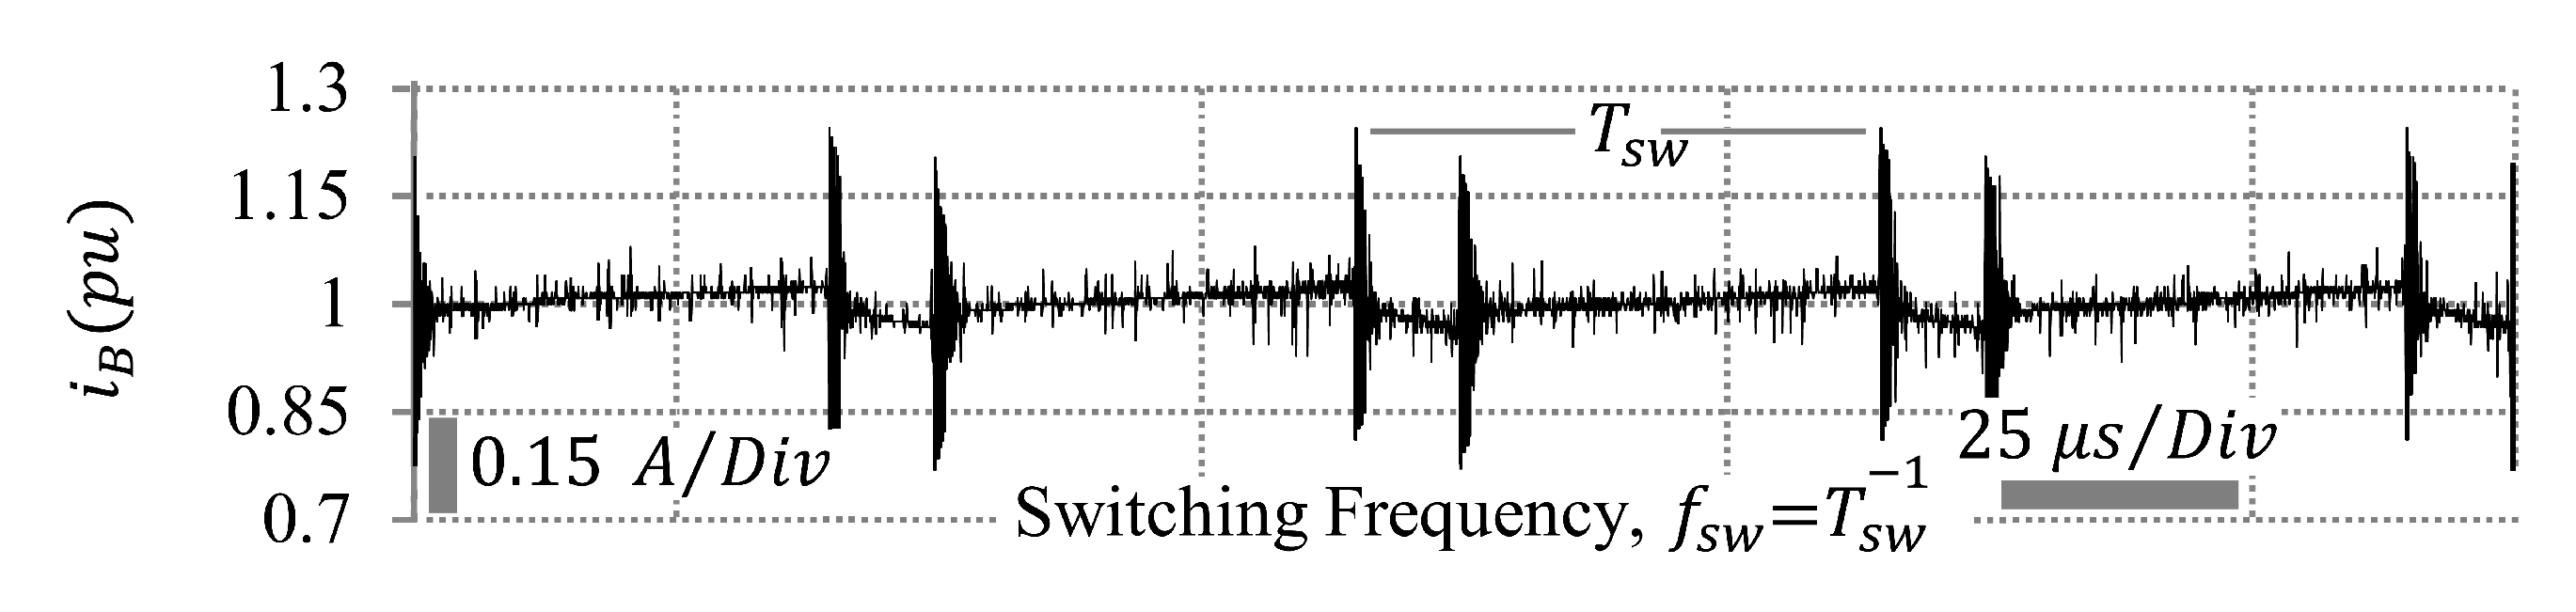
3.4. Battery Current Ripple
- There is an Increase in the inductance of the leg , , and .If is raised, cost, weight, and volume are correspondingly raised.
- A drop in the upper voltage of the legs, , occurs:
- -
- If is reduced, the switching losses decrease according to (8).
- -
- Since the elements such as the capacitors and the switches with lower voltage constraints are bought, the cost is cut.
- -
- The control system approximates to the saturation situation, which is when the duty cycle exceeds one or rather the modulating signal exceeds one and minus one. Simply put, is not powerful enough to make the reference currents when it becomes more than one. The maximum possible current injected to the battery pack is restricted by () and the sum of () and (R) and the sum of the resistances in the path of each leg. The drop in is not desired because it is bound to operate under the saturation condition.
- A rise in the switching frequency, , occurs:
- -
- The more the system works with, the more switching dissipation it possesses.
- -
- Faster IGBTs are used, thus increasing the cost. Moreover, must be greater (at least ten times) than the charging frequency in order to have a recognizable waveform for the battery current.
- -
- -
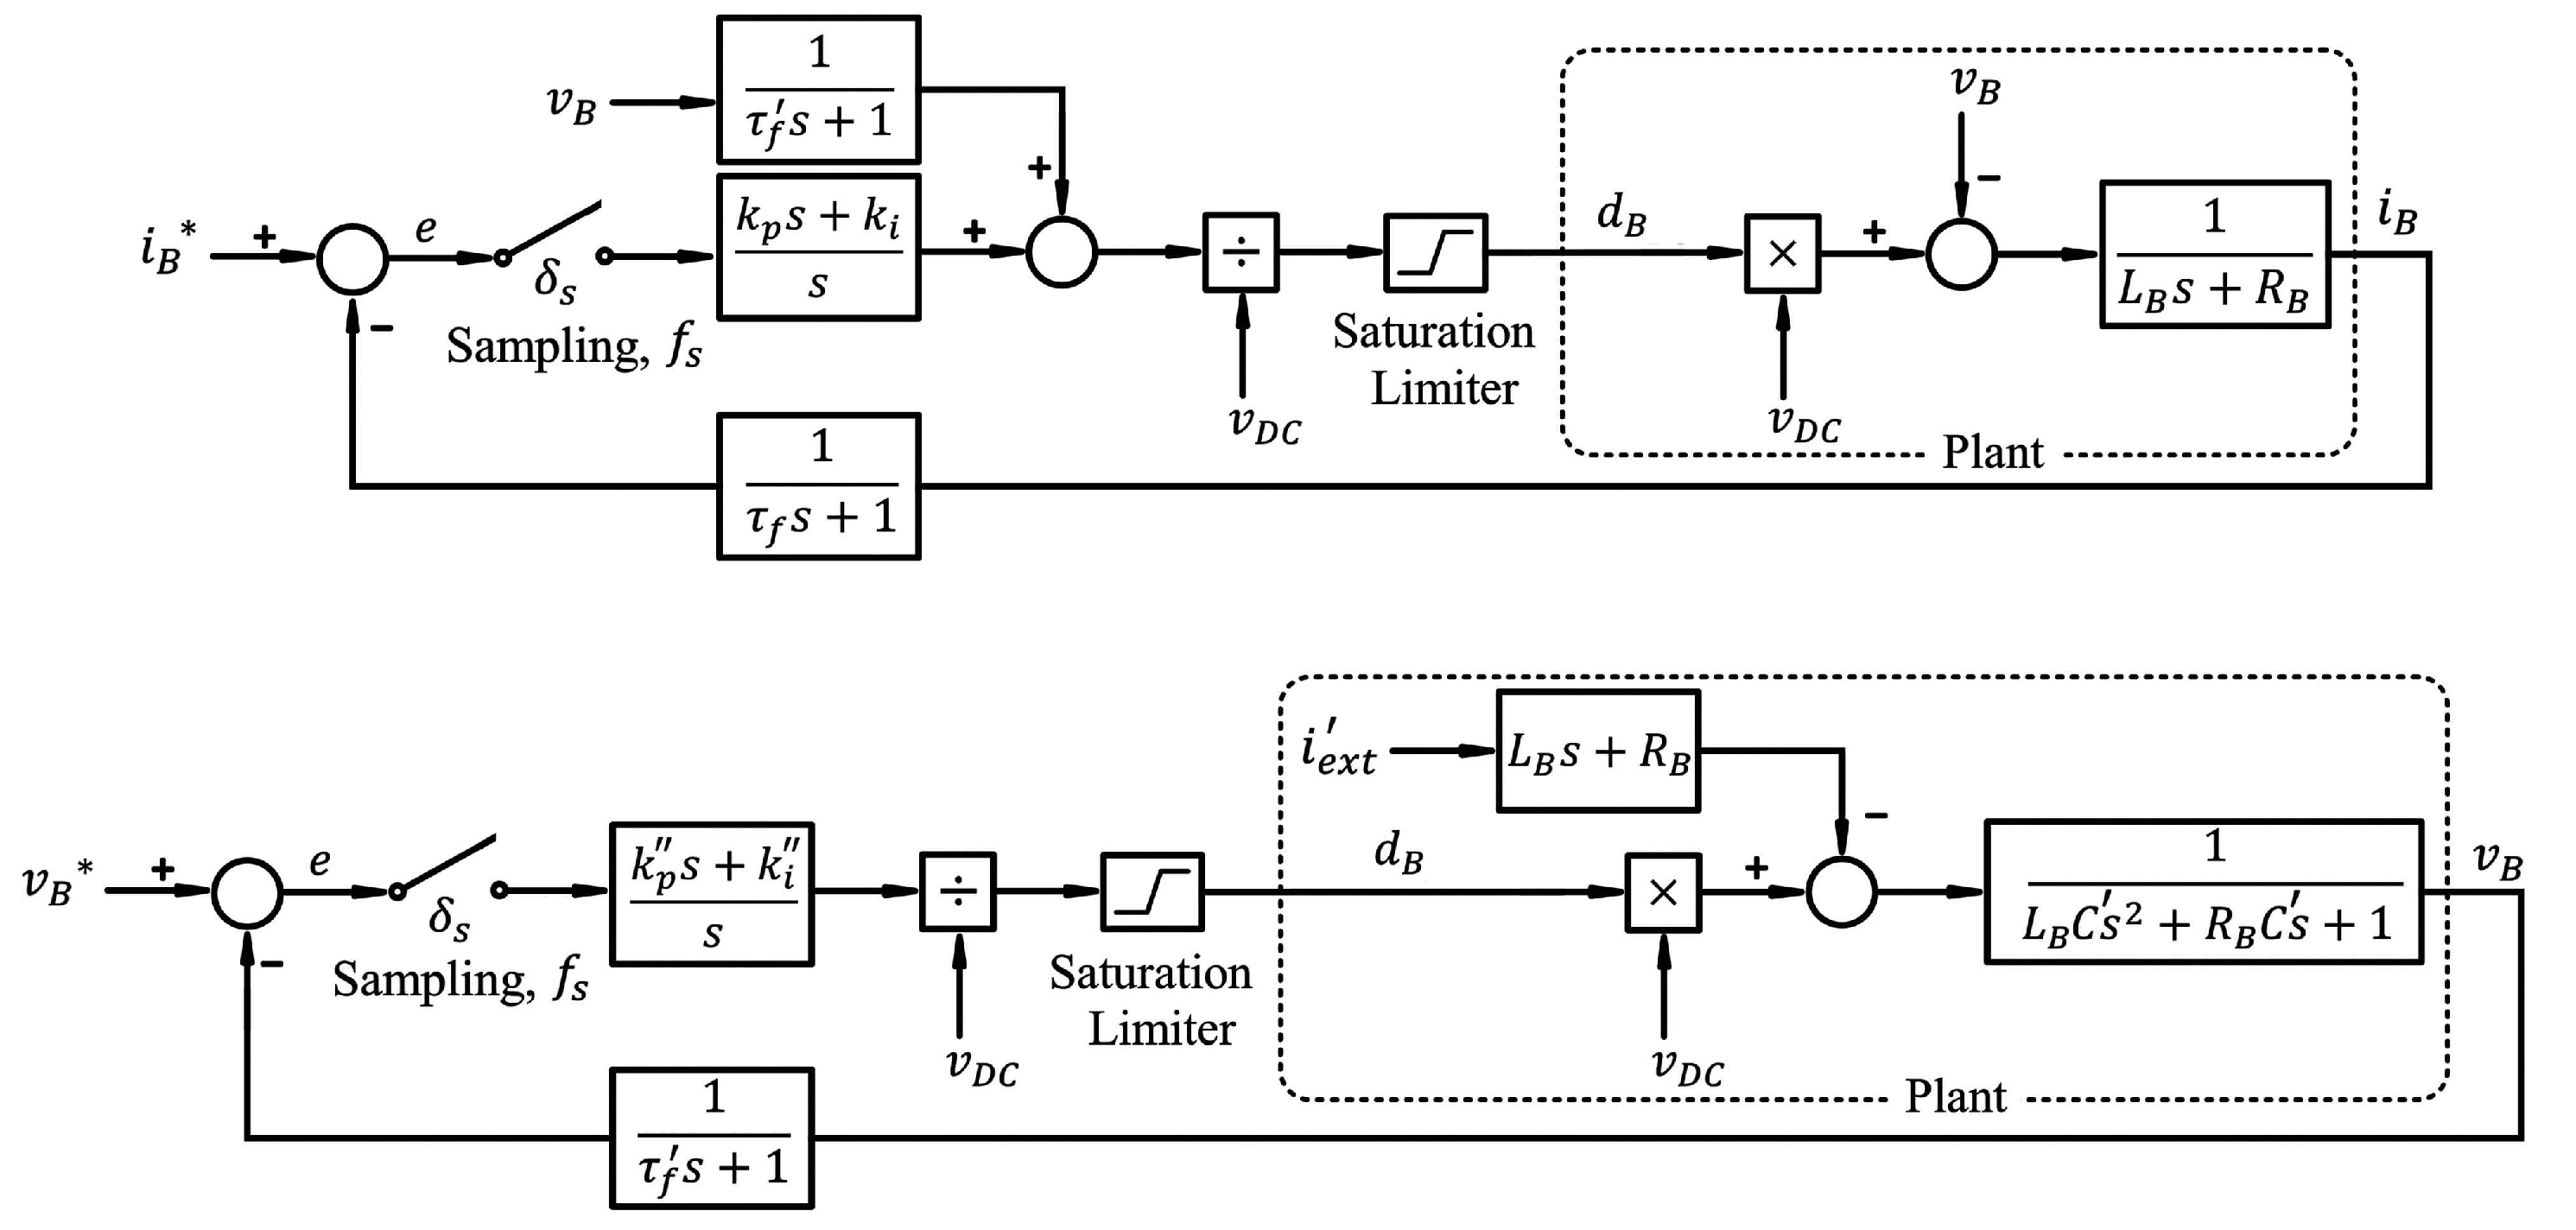
- cannot increase a lot because the bandwidths of the current and voltage sensors must be enhanced again. On the other hand, the sampling frequency of the microcontroller shown in Figure 4 and the clock frequency of the microcontroller must be also enhanced.
3.5. Voltage Stress
- The first type occurs during the transition periods, from the on state to off state and vice versa. Power electronic switches are used to open and close a circuit. When a circuit is opened, the current flowing through it is interrupted. The change in the current during a short period of time () will be very big. It causes the switch to melt. During conduction, when the switch is closed, the voltage difference across two terminals will be ideally zero. However, when the circuit is open, a high voltage difference develops across the switch (). This also causes damage to the switch and ultimately the whole topology. In order to overcome this problem, a switch that has less turn-off time, uses snubber circuits, and has betterdesigned gate drivers is required.
- The second type occurs when it is reverse biased or in an off state. To overcome such a voltage stress, a switch that has a higher breakdown voltage with a safety margin is needed. The voltage stress also depends upon the type of converter one is using. In the case of the topology in this paper, the IGBTs will always be stressed to . Alternative DC-AC topologies such as multi-level ones can be used to reduce the stress across each IGBT. Moreover, can be decreased. Although a decrease in results in a decrease in the switching losses and voltage stress, it causes saturation in the control loops and limits the maximum current delivered to the battery pack
3.6. Switch Gate Drivers
3.7. Microcontroller
- The clock of its central processing unit and its architecture.The clock of a microcontroller determines the speed of calculations. The microcontroller must be able to implement the control systems and its controllers as fast as possible. ARM Cortex-M (ARM LPC1768 as a case in point), STM32, and DSP C2000 (TMS320F28335 as a case in point) are well-known microcontrollers for implementing the control systems similar to what has been illustrated in Figure 4. The architecture of processors commonly falls into two groups: reduced-instruction-set computing (RISC) and complex-instruction-set computing (CISC). The microcontrollers with CISC architecture are better and faster than the ones with RISC architecture for implementing the control loops because they inherently have the discrete structures for filters and signal processing of the control systems. They perform the same calculations faster (10 times faster or even more) in comparison with RISC microcontrollers for a specified clock frequency.
- The frequency of the analogue-to-digital converter, .Nyquist theory states that a periodic signal must be sampled at more than twice the highest frequency component of the signal. In practice, it should be more than 10 times. Therefore, in order to recreate the current and voltages sensed for the control system, the analogue-to-digital converter must be as fast as possible. The accuracy of the analogue-to-digital converter is also an important factor. Thus, the designer should notice the conversion step.
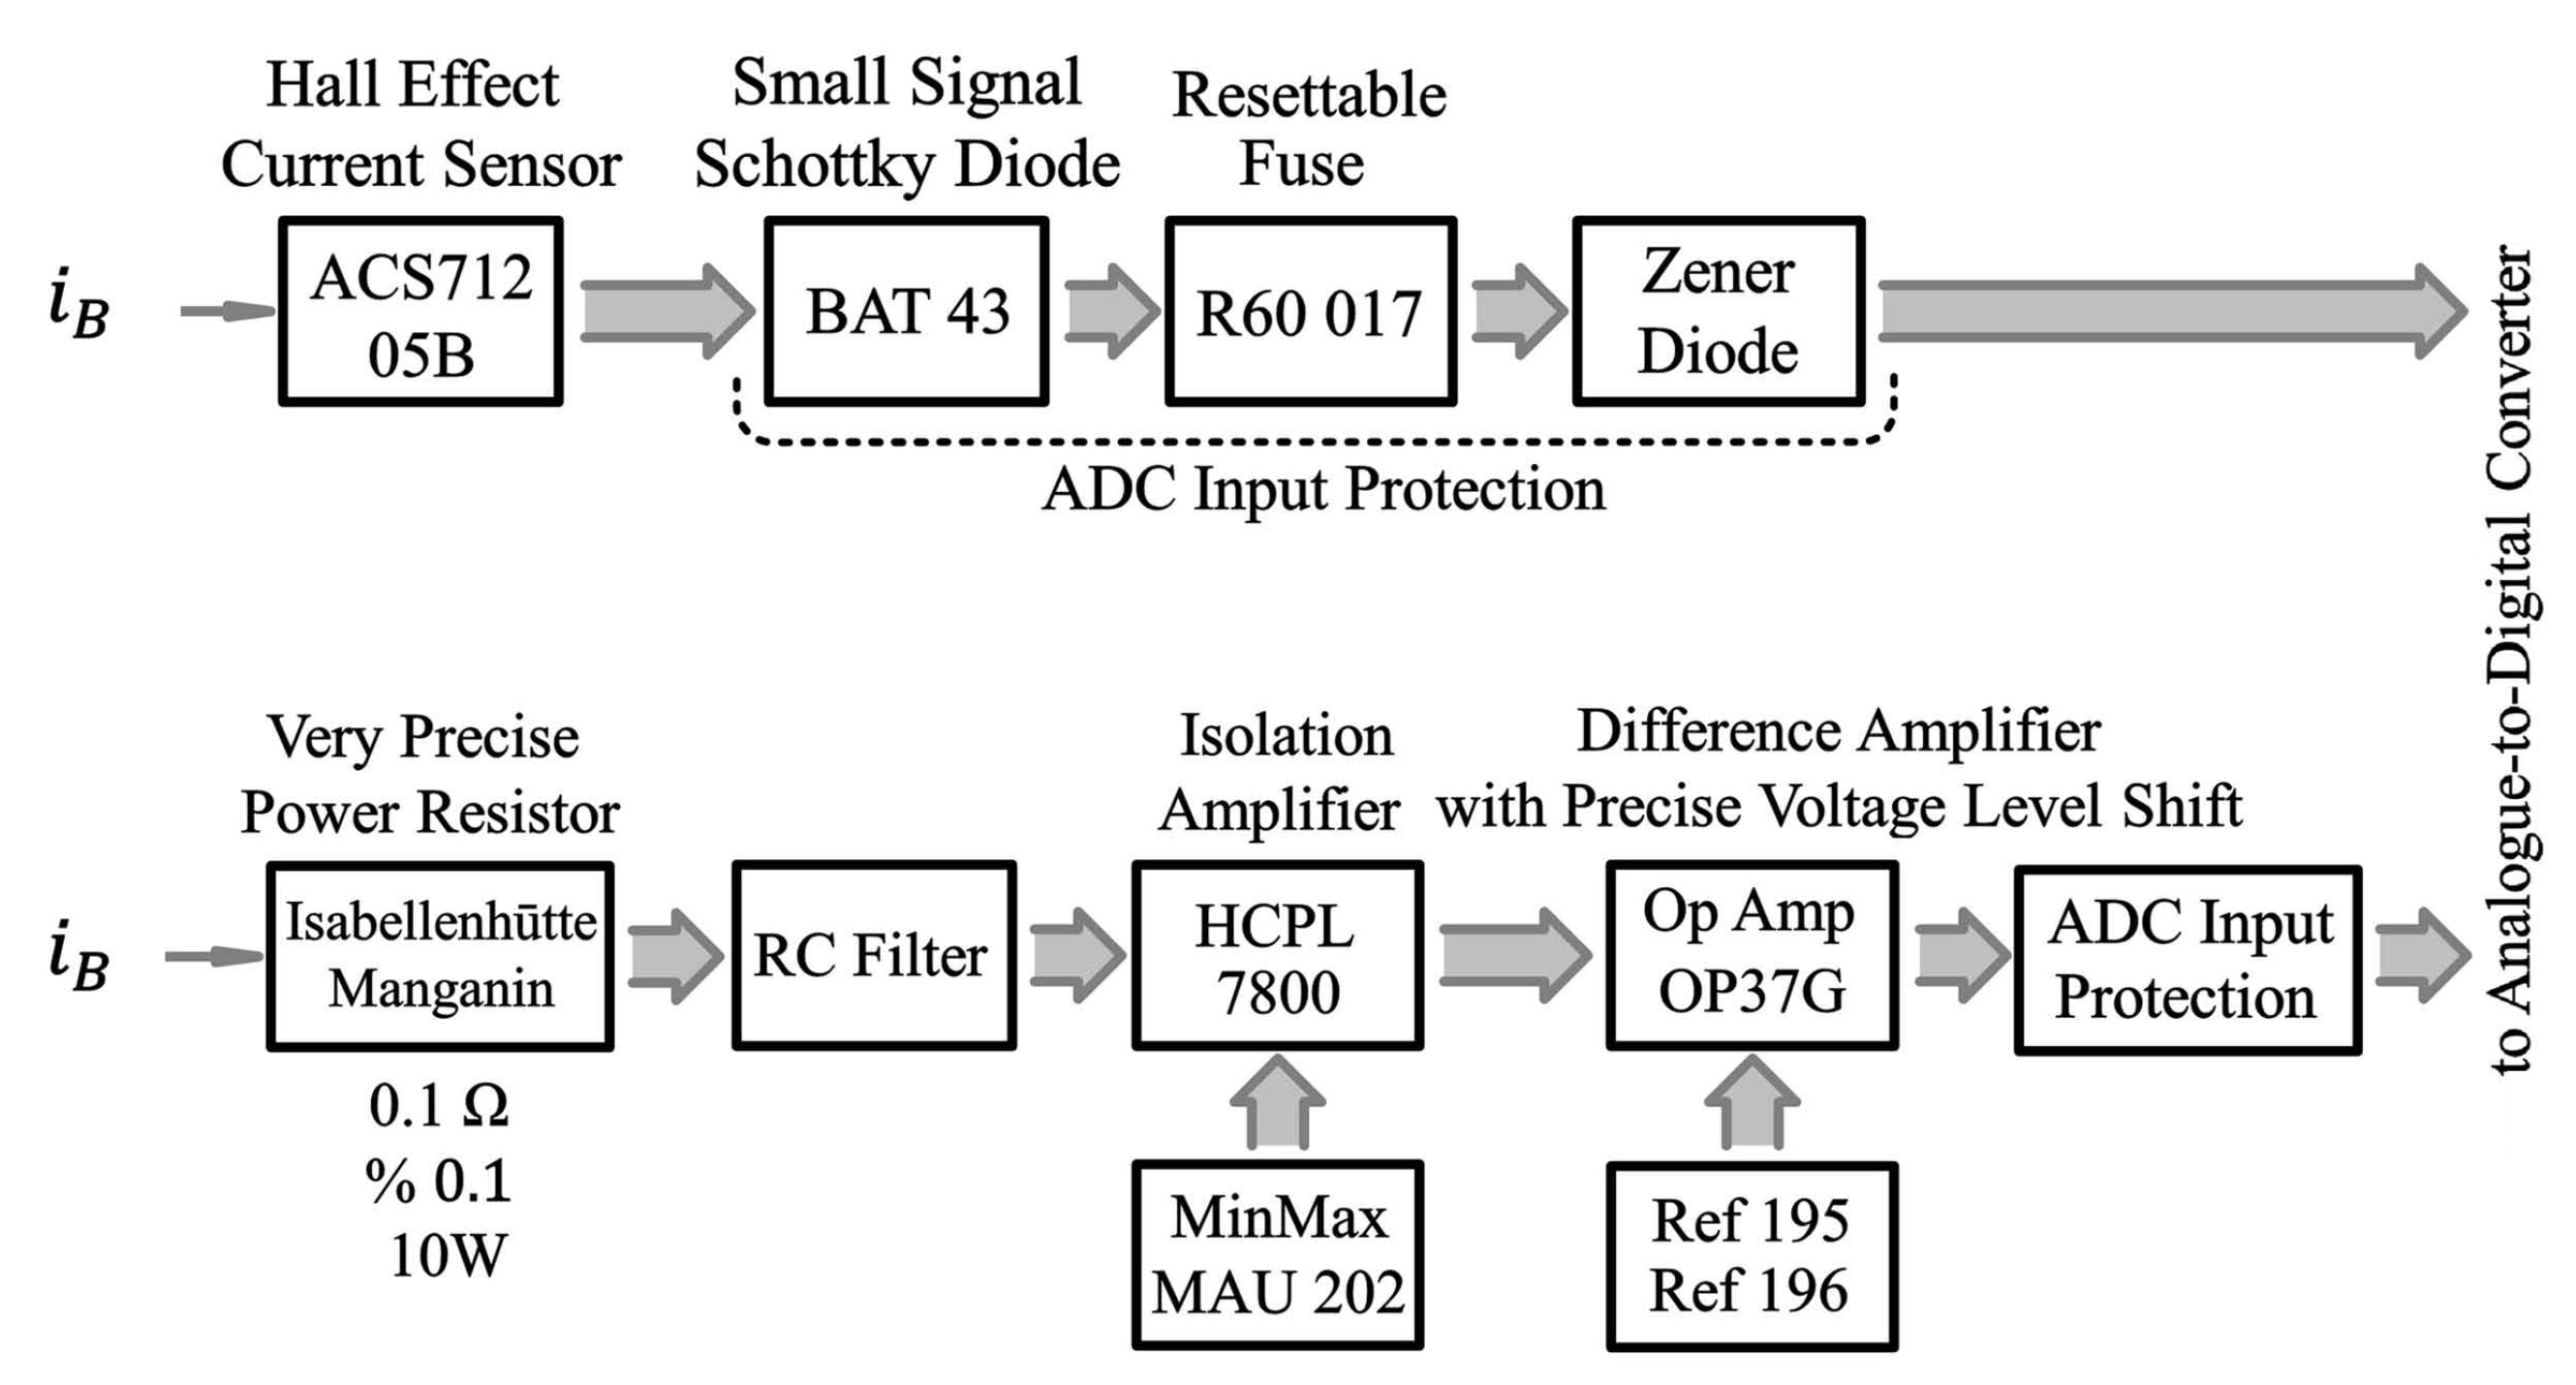
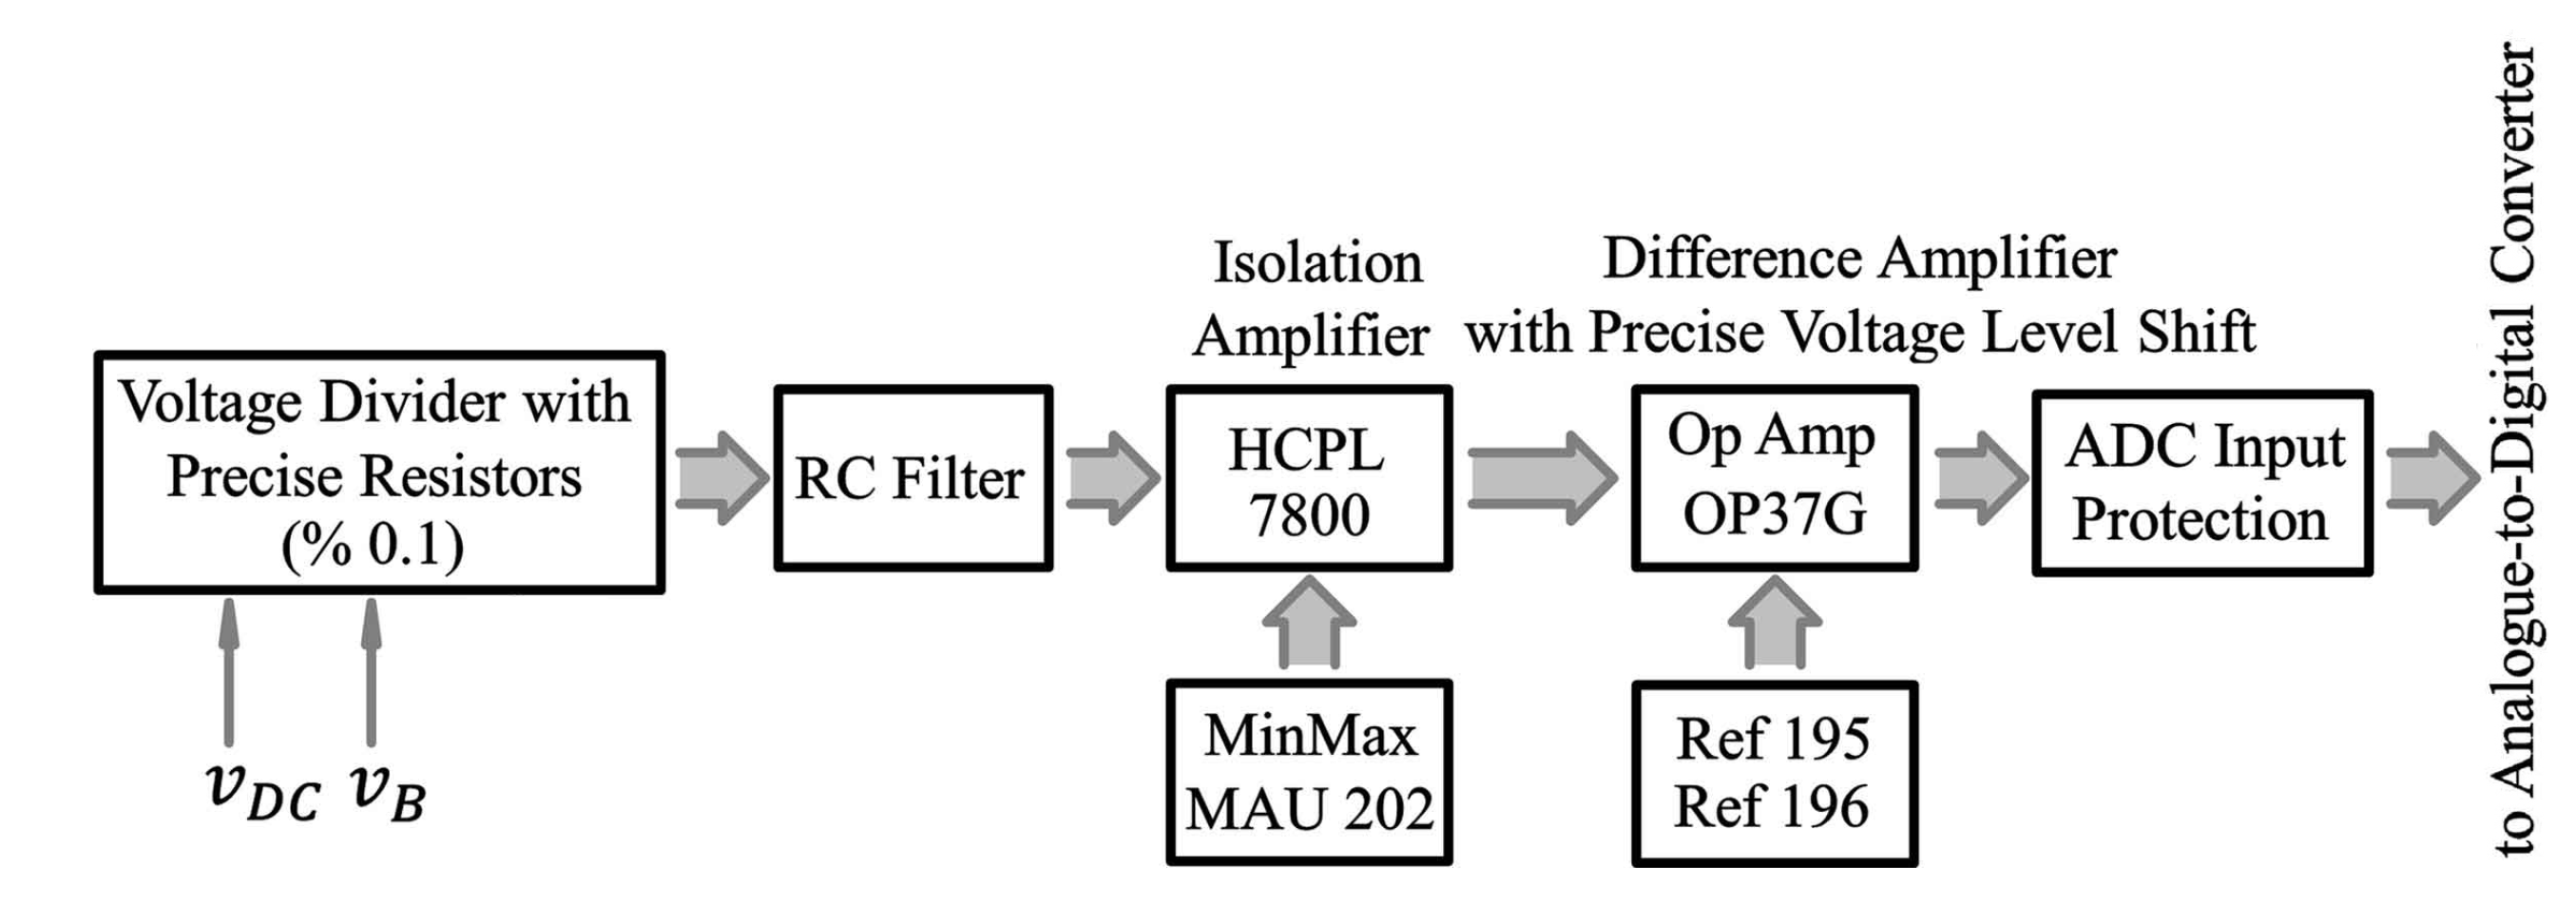
3.8. Voltage and Current Sensors
3.9. Maximum Level of Battery Current and Power
- The voltage difference between and ;Reduction in is unfavourable because it may operate under the saturation situation. Moreover, would not be powerful enough in even duty cycles close to one to make the reference currents. The control loops approximate to the saturation condition. Moreover, a drop in decreases cost and the switching dissipation.
- The sum of () and (R) in each leg, and the equivalent resistance of each leg.The current delivered to the battery is the result of the voltage difference between and over this resistance. Thus, better elements with lower resistances significantly enhance the ability of the system to deliver more power to the battery pack during charging or draw more power from the battery during discharging. Elements with lower resistances also decrease conduction losses according to (7).
- The ability of the elements to tolerate the current and voltage levels, for instance, diameters of the wires of the inductors.
3.10. Other Issues
4. Conclusions
Author Contributions
Funding
Conflicts of Interest
Abbreviations
| AC: | Alternating current; |
| EIS: | Electrochemical Impedance Spectroscopy; |
| DC: | Direct current; |
| EV: | Electric vehicle; |
| IC: | Integrated circuit; |
| IGBT: | Insulated-gate bipolar transistor; |
| PWM: | Pulse width modulation; |
| : | Period of pulse-current waveform; |
| : | Frequency of pulse-current waveform; |
| : | Sampling frequency of analogue-to-digital converter; |
| : | Switching frequency in PWM; |
| : | Switching period in PWM; |
| : | Terminal battery voltage; |
| : | DC link voltage; |
| : | DC link capacitor; |
| : | Capacitor linked in parallel with the battery. It is connected if the voltage control system works; |
| : | Current flowing through ; |
| : | Maximum battery current; |
| : | Current injected to ; |
| : | Current injected to the battery; |
| : | Inductor of the leg connected to the battery; |
| L: | Inductor for the three-phase legs in the DC-AC stage converter; |
| : | Power injected by the leg to the battery. It equals ; |
| : | Maximum battery power and maximum power of the battery charger; |
| : | Power injected to by both the legs . It equals ; |
| : | AC-side three-phase terminal active power; |
| : | AC-side three-phase terminal reactive power; |
| : | AC-side terminal current; |
| : | Line-line AC-side terminal voltage; |
| : | Reference command of the variable △ which is defined by the designer; |
| : | Reference of the variable △ which is generated by the outer control loops; |
| : | Duty cycle in PWM strategy for the leg connected to the battery; |
| : | Time constant of the current sensor; |
| : | Time constant of the voltage sensor; |
| : | Switch number i. |
References
- Bayati, M.; Abedi, M.; Farahmandrad, M.; Gharehpetian, G.B. Delivering Smooth Power to Pulse-Current Battery Chargers: Electric Vehicles as a Case in Point. IEEE Trans. Power Electron. 2020, 36, 1295–1302. [Google Scholar] [CrossRef]
- Bayati, M.; Abedi, M.; Gharehpetian, G.B.; Farahmandrad, M. Two designs for DC–DC stage of electric vehicle charging stations. Electr. Eng. 2020, 107, 2411–2502. [Google Scholar] [CrossRef]
- Bayati, M.; Abedi, M.; Gharehpetian, G.B.; Farahmandrad, M. Sinusoidal-Ripple Current Control in Battery Charger of Electric Vehicles. IEEE Trans. Veh. Technol. 2020, 69, 7201–7210. [Google Scholar] [CrossRef]
- Bayati, M.; Abedi, M.; Gharehpetian, G.B.; Farahmandrad, M. Short-term interaction between electric vehicles and microgrid in decentralized vehicle-to-grid control methods. Prot. Control Mod. Power Syst. 2019, 4, 5. [Google Scholar] [CrossRef] [Green Version]
- Bayati, M.; Salmani, A.; Abedi, M.; Gharepetian, G.B. Control of EV/PHEV bidirectional battery chargers in AC microgrids. In Proceedings of the 2015 International Conference on Power, Instrumentation, Control and Computing (PICC), Thrissur, India, 9–11 December 2015; pp. 1–6. [Google Scholar]
- Bayati, M.; Abedi, M.; Gharehpetian, G.B. A new electric vehicle charging station based on pulse current charging method. In Proceedings of the 2017 Iranian Conference on Electrical Engineering (ICEE), Tehran, Iran, 2–4 May 2017; pp. 967–972. [Google Scholar]
- Yazdani, A.; Iravani, R. Voltage-Sourced Converters in Power Systems; Wiley Online Library: Hoboken, NJ, USA, 2010; Volume 34. [Google Scholar]
- Tabari, M.; Yazdani, A. Stability of a DC distribution system for power system integration of plug-in hybrid electric vehicles. IEEE Trans. Smart Grid 2014, 5, 2564–2573. [Google Scholar] [CrossRef]
- Jiang, Z.; Dougal, R.A. Control strategies for active power sharing in a fuel-cell-powered battery-charging station. IEEE Trans. Ind. Appl. 2004, 40, 917–924. [Google Scholar] [CrossRef]
- Jiang, Z.; Dougal, R.A. Synergetic control of power converters for pulse current charging of advanced batteries from a fuel cell power source. IEEE Trans. Power Electron. 2004, 19, 1140–1150. [Google Scholar] [CrossRef] [Green Version]
- Liu, P.J.; Yen, C.H. A fast-charging switching-based charger with adaptive hybrid duty cycle control for multiple batteries. IEEE Trans. Power Electron. 2017, 32, 1975–1983. [Google Scholar] [CrossRef]
- Wang, J.; Chuang, C. Design considerations of microprocessor-controlled multiphase battery charger with fast-charging strategy. IET Electr. Power Appl. 2007, 1, 143–152. [Google Scholar] [CrossRef]
- Qahouq, J.A.A.; Xia, Z. Single-perturbation-cycle online battery impedance spectrum measurement method with closed-loop control of power converter. IEEE Trans. Ind. Electron. 2017, 64, 7019–7029. [Google Scholar] [CrossRef]
- Khaligh, A.; Li, Z. Battery, ultracapacitor, fuel cell, and hybrid energy storage systems for electric, hybrid electric, fuel cell, and plug-in hybrid electric vehicles: State of the art. IEEE Trans. Veh. Technol. 2010, 59, 2806–2814. [Google Scholar] [CrossRef]
- Cao, J.; Emadi, A. A new battery/ultracapacitor hybrid energy storage system for electric, hybrid, and plug-in hybrid electric vehicles. IEEE Trans. Power Electron. 2012, 27, 122–132. [Google Scholar]
- Tehrani, K. A smart cyber physical multi-source energy system for an electric vehicle prototype. J. Syst. Archit. 2020, 111, 101804. [Google Scholar] [CrossRef]
- Kesler, M.; Kisacikoglu, M.C.; Tolbert, L.M. Vehicle-to-grid reactive power operation using plug-in electric vehicle bidirectional offboard charger. IEEE Trans. Ind. Electron. 2014, 61, 6778–6784. [Google Scholar] [CrossRef]
- Kisacikoglu, M.C.; Kesler, M.; Tolbert, L.M. Single-phase on-board bidirectional PEV charger for V2G reactive power operation. IEEE Trans. Smart Grid 2015, 6, 767–775. [Google Scholar] [CrossRef]
- Chen, L.R.; Young, C.M.; Chu, N.Y.; Liu, C.S. Phase-locked bidirectional converter with pulse charge function for 42-V/14-V dual-voltage Power Net. IEEE Trans. Ind. Electron. 2011, 58, 2045–2048. [Google Scholar] [CrossRef]
- Chen, L.R.; Chu, N.Y.; Wang, C.S.; Liang, R.H. Design of a Reflex-based bidirectional converter with the energy recovery function. IEEE Trans. Ind. Electron. 2008, 55, 3022–3029. [Google Scholar] [CrossRef]
- Falahi, M.; Chou, H.M.; Ehsani, M.; Xie, L.; Butler-Purry, K.L. Potential power quality benefits of electric vehicles. IEEE Trans. Sustain. Energy 2013, 4, 1016–1023. [Google Scholar]
- Gallardo-Lozano, J.; Milanés-Montero, M.I.; Guerrero-Martínez, M.A.; Romero-Cadaval, E. Electric vehicle battery charger for smart grids. Electr. Power Syst. Res. 2012, 90, 18–29. [Google Scholar] [CrossRef]
- Haghbin, S.; Lundmark, S.; Alakula, M.; Carlson, O. Grid-connected integrated battery chargers in vehicle applications: Review and new solution. IEEE Trans. Ind. Electron. 2012, 60, 459–473. [Google Scholar] [CrossRef]
- Hu, K.W.; Liaw, C.M. On a bidirectional adapter with G2B charging and B2X emergency discharging functions. IEEE Trans. Ind. Electron. 2013, 61, 243–257. [Google Scholar] [CrossRef]
- Rivera, S.; Wu, B.; Kouro, S.; Yaramasu, V.; Wang, J. Electric vehicle charging station using a neutral point clamped converter with bipolar DC bus. IEEE Trans. Ind. Electron. 2014, 62, 1999–2009. [Google Scholar] [CrossRef]
- Dusmez, S.; Khaligh, A. Generalized technique of compensating low-frequency component of load current with a parallel bidirectional DC/DC converter. IEEE Trans. Power Electron. 2014, 29, 5892–5904. [Google Scholar] [CrossRef]
- Kollimalla, S.K.; Mishra, M.K.; Narasamma, N.L. Design and analysis of novel control strategy for battery and supercapacitor storage system. IEEE Trans. Sustain. Energy 2014, 5, 1137–1144. [Google Scholar] [CrossRef]
- Khan, S.A.; Islam, M.R.; Guo, Y.; Zhu, J. A new isolated multi-port converter with multi-directional power flow capabilities for smart electric vehicle charging stations. IEEE Trans. Appl. Supercond. 2019, 29, 1–4. [Google Scholar] [CrossRef]
- Hu, Y.; Gan, C.; Hu, S.; Cao, W.; Wang, X.; Finney, S. Winding-centre-tapped switched reluctance motor drive for multi-source charging in electric vehicle applications. IET Power Electron. 2015, 8, 2067–2075. [Google Scholar] [CrossRef]
- Szymanski, J.R.; Zurek-Mortka, M.; Wojciechowski, D.; Poliakov, N. Unidirectional DC/DC converter with voltage inverter for fast charging of electric vehicle batteries. Energies 2020, 13, 4791. [Google Scholar] [CrossRef]
- Bassa de los Mozos, A.; Chandra Mouli, G.R.; Bauer, P. Evaluation of topologies for a solar powered bidirectional electric vehicle charger. IET Power Electron. 2019, 12, 3675–3687. [Google Scholar] [CrossRef]
- Monteiro, V.; Ferreira, J.C.; Melendez, A.A.N.; Couto, C.; Afonso, J.L. Experimental validation of a novel architecture based on a dual-stage converter for off-board fast battery chargers of electric vehicles. IEEE Trans. Veh. Technol. 2017, 67, 1000–1011. [Google Scholar] [CrossRef] [Green Version]
- Sayed, K.; Gabbar, H.A. Electric vehicle to power grid integration using three-phase three-level AC/DC converter and PI-fuzzy controller. Energies 2016, 9, 532. [Google Scholar] [CrossRef]
- Kumar, G.G.; Sundaramoorthy, K.; Athikkal, S.; Karthikeyan, V. Dual input superboost DC–DC converter for solar powered electric vehicle. IET Power Electron. 2019, 12, 2276–2284. [Google Scholar] [CrossRef]
- Chauhan, S.; Singh, B. Grid-interfaced solar PV powered electric vehicle battery system with novel adaptive digital control algorithm. IET Power Electron. 2019, 12, 3470–3478. [Google Scholar] [CrossRef]
- Li, M.; Xu, H.; Li, W.; Liu, Y.; Li, F.; Hu, Y.; Liu, L. The structure and control method of hybrid power source for electric vehicle. Energy 2016, 112, 1273–1285. [Google Scholar] [CrossRef]
- Liu, S.; Xie, X.; Yang, L. Analysis, modeling and implementation of a switching bi-directional buck-boost converter based on electric vehicle hybrid energy storage for V2G system. IEEE Access 2020, 8, 65868–65879. [Google Scholar] [CrossRef]
- Khan, M.S.; Ahmad, I.; Abideen, F.Z.U. Output voltage regulation of FC-UC based hybrid electric vehicle using integral backstepping control. IEEE Access 2019, 7, 65693–65702. [Google Scholar] [CrossRef]
- Araria, R.; Berkani, A.; Negadi, K.; Marignetti, F.; Boudiaf, M. Performance analysis of DC-DC converter and DTC based fuzzy logic control for power management in electric vehicle application. J. Eur. Des Syst. Autom. 2020, 53, 1–9. [Google Scholar] [CrossRef]
- Atawi, I.E.; Hendawi, E.; Zaid, S.A. Analysis and Design of a Standalone Electric Vehicle Charging Station Supplied by Photovoltaic Energy. Processes 2021, 9, 1246. [Google Scholar] [CrossRef]
- Mesbahi, T.; Rizoug, N.; Khenfri, F.; Bartholomeüs, P.; Le Moigne, P. Dynamical modelling and emulation of Li-ion batteries–supercapacitors hybrid power supply for electric vehicle applications. IET Electr. Syst. Transp. 2017, 7, 161–169. [Google Scholar] [CrossRef]
- Sellali, M.; Abdeddaim, S.; Betka, A.; Djerdir, A.; Drid, S.; Tiar, M. Fuzzy-super twisting control implementation of battery/super capacitor for electric vehicles. ISA Trans. 2019, 95, 243–253. [Google Scholar] [CrossRef]
- Monteiro, V.; Pinto, J.; Afonso, J.L. Operation modes for the electric vehicle in smart grids and smart homes: Present and proposed modes. IEEE Trans. Veh. Technol. 2015, 65, 1007–1020. [Google Scholar] [CrossRef] [Green Version]
- Marra, F.; Yang, G.Y.; Træholt, C.; Larsen, E.; Østergaard, J.; Blažič, B.; Deprez, W. EV charging facilities and their application in LV feeders with photovoltaics. IEEE Trans. Smart Grid 2013, 4, 1533–1540. [Google Scholar] [CrossRef]
- Bayati, M.; Abedi, M.; Hosseinian, H.; Gharehpetian, G.B. A novel control strategy for Reflex-based electric vehicle charging station with grid support functionality. J. Energy Storage 2017, 12, 108–120. [Google Scholar] [CrossRef]
- Yilmaz, M.; Krein, P.T. Review of battery charger topologies, charging power levels, and infrastructure for plug-in electric and hybrid vehicles. IEEE Trans. Power Electron. 2013, 28, 2151–2169. [Google Scholar] [CrossRef]
- Hajiaghasi, S.; Salemnia, A.; Hamzeh, M. Hybrid energy storage system for microgrids applications: A review. J. Energy Storage 2019, 21, 543–570. [Google Scholar] [CrossRef]
- Savio, D.A.; Juliet, V.A.; Chokkalingam, B.; Padmanaban, S.; Holm-Nielsen, J.B.; Blaabjerg, F. Photovoltaic integrated hybrid microgrid structured electric vehicle charging station and its energy management approach. Energies 2019, 12, 168. [Google Scholar] [CrossRef] [Green Version]
- Oh, C.Y.; Kim, D.H.; Woo, D.G.; Sung, W.Y.; Kim, Y.S.; Lee, B.K. A high-efficient nonisolated single-stage on-board battery charger for electric vehicles. IEEE Trans. Power Electron. 2013, 28, 5746–5757. [Google Scholar] [CrossRef]
- Electric Vehicle and Plug in Hybrid Electric Vehicle Conductive Charge Coupler; SAE Recommended Practice: Warrendale, PA, USA, 2010.
- Habib, S.; Khan, M.M.; Abbas, F.; Sang, L.; Shahid, M.U.; Tang, H. A comprehensive study of implemented international standards, technical challenges, impacts and prospects for electric vehicles. IEEE Access 2018, 6, 13866–13890. [Google Scholar] [CrossRef]
- Kim, S.Y.; Song, H.S.; Nam, K. Idling port isolation control of three-port bidirectional converter for EVs. IEEE Trans. Power Electron. 2012, 27, 2495–2506. [Google Scholar] [CrossRef]
- De Breucker, S.; Engelen, K.; D’hulst, R.; Driesen, J. Impact of current ripple on Li-ion battery ageing. World Electr. Veh. J. 2013, 6, 532–540. [Google Scholar] [CrossRef] [Green Version]
- Bessman, A.; Soares, R.; Wallmark, O.; Svens, P.; Lindbergh, G. Aging effects of AC harmonics on lithium-ion cells. J. Energy Storage 2019, 21, 741–749. [Google Scholar] [CrossRef]
- Korth Pereira Ferraz, P.; Kowal, J. A Comparative Study on the Influence of DC/DC-Converter Induced High Frequency Current Ripple on Lithium-Ion Batteries. Sustainability 2019, 11, 6050. [Google Scholar] [CrossRef] [Green Version]
- Semiconductors, V. IGBT/MOSFET Gate Drive Optocoupler. Retrieved 2011, 26, 2007–2008. [Google Scholar]
- Patel, A.; Ferdowsi, M. Current sensing for automotive electronics—A survey. IEEE Trans. Veh. Technol. 2009, 58, 4108–4119. [Google Scholar] [CrossRef]
- Ziegler, S.; Woodward, R.C.; Iu, H.H.C.; Borle, L.J. Current sensing techniques: A review. IEEE Sens. J. 2009, 9, 354–376. [Google Scholar] [CrossRef]
- Gao, Y.; Zhang, X.; Cheng, Q.; Guo, B.; Yang, J. Classification and review of the charging strategies for commercial lithium-ion batteries. IEEE Access 2019, 7, 43511–43524. [Google Scholar] [CrossRef]
- Hussein, A.A.H.; Batarseh, I. A review of charging algorithms for nickel and lithium battery chargers. IEEE Trans. Veh. Technol. 2011, 60, 830–838. [Google Scholar] [CrossRef]
- Chen, L.R.; Wu, S.L.; Shieh, D.T.; Chen, T.R. Sinusoidal-ripple-current charging strategy and optimal charging frequency study for Li-ion batteries. IEEE Trans. Ind. Electron. 2013, 60, 88–97. [Google Scholar] [CrossRef]
- Chen, L.R.; Chen, J.J.; Ho, C.M.; Wu, S.L.; Shieh, D.T. Improvement of Li-ion battery discharging performance by pulse and sinusoidal current strategies. IEEE Trans. Ind. Electron. 2013, 60, 5620–5628. [Google Scholar] [CrossRef]
- Cho, S.Y.; Lee, I.O.; Baek, J.I.; Moon, G.W. Battery impedance analysis considering DC component in sinusoidal ripple-current charging. IEEE Trans. Ind. Electron. 2015, 63, 1561–1573. [Google Scholar] [CrossRef]
- Bessman, A.; Soares, R.; Vadivelu, S.; Wallmark, O.; Svens, P.; Ekström, H.; Lindbergh, G. Challenging sinusoidal ripple-current charging of lithium-ion batteries. IEEE Trans. Ind. Electron. 2017, 65, 4750–4757. [Google Scholar] [CrossRef]
- Chen, L.R. Design of duty-varied voltage pulse charger for improving Li-ion battery-charging response. IEEE Trans. Ind. Electron. 2009, 56, 480–487. [Google Scholar] [CrossRef]
- Chen, L.R. A design of an optimal battery pulse charge system by frequency-varied technique. IEEE Trans. Ind. Electron. 2007, 54, 398–405. [Google Scholar] [CrossRef]
- Yin, M.; Cho, J.; Park, D. Pulse-based fast battery IoT charger using dynamic frequency and duty control techniques based on multi-sensing of polarization curve. Energies 2016, 9, 209. [Google Scholar] [CrossRef]
- Amanor-Boadu, J.M.; Abouzied, M.A.; Sánchez-Sinencio, E. An efficient and fast Li-ion battery charging system using energy harvesting or conventional sources. IEEE Trans. Ind. Electron. 2018, 65, 7383–7394. [Google Scholar] [CrossRef]
- Amanor-Boadu, J.M.; Guiseppi-Elie, A.; Sánchez-Sinencio, E. Search for optimal pulse charging parameters for Li-Ion polymer batteries using Taguchi orthogonal arrays. IEEE Trans. Ind. Electron. 2018, 65, 8982–8992. [Google Scholar] [CrossRef]
- Amanor-Boadu, J.; Guiseppi-Elie, A.; Sánchez-Sinencio, E. The Impact of Pulse Charging Parameters on the Life Cycle of Lithium-ion Polymer Batteries. Energies 2018, 11, 2162. [Google Scholar] [CrossRef] [Green Version]
- Chen, L.R.; Chen, J.J.; Chu, N.Y.; Han, G.Y. Current-pumped battery charger. IEEE Trans. Ind. Electron. 2008, 55, 2482–2488. [Google Scholar] [CrossRef]
- Purushothaman, B.; Landau, U. Rapid charging of lithium-ion batteries using pulsed currents a theoretical analysis. J. Electrochem. Soc. 2006, 153, A533–A542. [Google Scholar] [CrossRef]
- Abdel-Monem, M.; Trad, K.; Omar, N.; Hegazy, O.; Van den Bossche, P.; Van Mierlo, J. Influence analysis of static and dynamic fast-charging current profiles on ageing performance of commercial lithium-ion batteries. Energy 2017, 120, 179–191. [Google Scholar] [CrossRef]
- Chiu, H.J.; Lin, L.W.; Pan, P.L.; Tseng, M.H. A novel rapid charger for lead-acid batteries with energy recovery. IEEE Trans. Power Electron. 2006, 21, 640–647. [Google Scholar] [CrossRef]
- Tsai, C.T.; Kuo, Y.C.; Kuo, Y.P.; Hsieh, C.T. A Reflex Charger with ZVS and Non-Dissipative Cells for Photovoltaic Energy Conversion. Energies 2015, 8, 1373–1389. [Google Scholar] [CrossRef]
- Yong, J.Y.; Ramachandaramurthy, V.K.; Tan, K.M.; Mithulananthan, N. A review on the state-of-the-art technologies of electric vehicle, its impacts and prospects. Renew. Sustain. Energy Rev. 2015, 49, 365–385. [Google Scholar] [CrossRef]
- Li, J.; Murphy, E.; Winnick, J.; Kohl, P.A. The effects of pulse charging on cycling characteristics of commercial lithium-ion batteries. J. Power Sources 2001, 102, 302–309. [Google Scholar] [CrossRef]
- Monem, M.A.; Trad, K.; Omar, N.; Hegazy, O.; Mantels, B.; Mulder, G.; Van den Bossche, P.; Van Mierlo, J. Lithium-ion batteries: Evaluation study of different charging methodologies based on aging process. Appl. Energy 2015, 152, 143–155. [Google Scholar] [CrossRef]
- Hsieh, H.I.; Tsai, C.Y.; Hsieh, G.C. Photovoltaic burp charge system on energy-saving configuration by smart charge management. IEEE Trans. Power Electron. 2014, 29, 1777–1790. [Google Scholar] [CrossRef]
- Saldaña, G.; San Martín, J.I.; Zamora, I.; Asensio, F.J.; Oñederra, O. Analysis of the current electric battery models for electric vehicle simulation. Energies 2019, 12, 2750. [Google Scholar] [CrossRef] [Green Version]
- Chen, M.; Rincón-Mora, G. Accurate electrical battery model capable of predicting runtime and IV performance. Energy Convers. IEEE Trans. 2006, 21, 504–511. [Google Scholar] [CrossRef]
- Thiruvonasundari, D.; Deepa, K. Electric vehicle battery modelling methods based on state of charge—Review. J. Green Eng. 2020, 10, 24–61. [Google Scholar]
- Ali, M.U.; Zafar, A.; Nengroo, S.H.; Hussain, S.; Junaid Alvi, M.; Kim, H.J. Towards a smarter battery management system for electric vehicle applications: A critical review of lithium-ion battery state of charge estimation. Energies 2019, 12, 446. [Google Scholar] [CrossRef] [Green Version]
- Varnosfaderani, M.A.; Strickland, D. Online impedance spectroscopy estimation of a battery. In Proceedings of the 2016 18th European Conference on Power Electronics and Applications (EPE’16 ECCE Europe), Karlsruhe, Germany, 5–9 September 2016; pp. 1–10. [Google Scholar]
- Westerhoff, U.; Kurbach, K.; Lienesch, F.; Kurrat, M. Analysis of lithium-ion battery models based on electrochemical impedance spectroscopy. Energy Technol. 2016, 4, 1620–1630. [Google Scholar] [CrossRef] [Green Version]
- Wang, X.; Wei, X.; Zhu, J.; Dai, H.; Zheng, Y.; Xu, X.; Chen, Q. A review of modeling, acquisition, and application of lithium-ion battery impedance for onboard battery management. ETransportation 2020, 7, 100093. [Google Scholar] [CrossRef]
- Stroe, D.I.; Swierczynski, M.; Stroe, A.I.; Kaer, S.K.; Teodorescu, R. Lithium-ion battery power degradation modelling by electrochemical impedance spectroscopy. IET Renew. Power Gener. 2017, 11, 1136–1141. [Google Scholar] [CrossRef]
- Varnosfaderani, M.A.; Strickland, D. A Comparison of Online Electrochemical Spectroscopy Impedance Estimation of Batteries. IEEE Access 2018, 6, 23668–23677. [Google Scholar] [CrossRef]
- Huang, W.; Qahouq, J.A.A. An online battery impedance measurement method using DC-DC power converter control. IEEE Trans. Ind. Electron. 2014, 61, 5987–5995. [Google Scholar] [CrossRef]
- Lee, Y.D.; Park, S.Y.; Han, S.B. Online embedded impedance measurement using high-power battery charger. IEEE Trans. Ind. Appl. 2015, 51, 498–508. [Google Scholar] [CrossRef]
- Buller, S.; Thele, M.; De Doncker, R.W.; Karden, E. Impedance-based simulation models of supercapacitors and Li-ion batteries for power electronic applications. IEEE Trans. Ind. Appl. 2005, 41, 742–747. [Google Scholar] [CrossRef]
- Nikdel, M. Various battery models for various simulation studies and applications. Renew. Sustain. Energy Rev. 2014, 32, 477–485. [Google Scholar]
- Zhu, G.L.; Zhao, C.Z.; Huang, J.Q.; He, C.; Zhang, J.; Chen, S.; Xu, L.; Yuan, H.; Zhang, Q. Fast Charging Lithium Batteries: Recent Progress and Future Prospects. Small 2019, 15, 1805389. [Google Scholar] [CrossRef]
- Pan, H.; Huang, X.; Wang, C.; Liu, D.; Wang, D.; Zhang, R.; Li, S.; Lv, C.; Zhao, L.; Wang, J.; et al. Sandwich structural TixOy-Ti3C2/C3N4 material for long life and fast kinetics Lithium-Sulfur Battery: Bidirectional adsorption promoting lithium polysulfide conversion. Chem. Eng. J. 2021, 410, 128424. [Google Scholar] [CrossRef]
- Rehman, S.; Khan, K.; Zhao, Y.; Hou, Y. Nanostructured cathode materials for lithium–sulfur batteries: Progress, challenges and perspectives. J. Mater. Chem. A 2017, 5, 3014–3038. [Google Scholar] [CrossRef]
- Singh, M.; Kumar, P.; Kar, I. Implementation of vehicle to grid infrastructure using fuzzy logic controller. IEEE Trans. Smart Grid 2012, 3, 565–577. [Google Scholar] [CrossRef]
- Mehmood, K.; Iftikhar, Y.; Chen, S.; Amin, S.; Manzoor, A.; Pan, J. Analysis of Inter-Temporal Change in the Energy and CO2 Emissions Efficiency of Economies: A Two Divisional Network DEA Approach. Energies 2020, 13, 3300. [Google Scholar] [CrossRef]
- Yilmaz, M.; Krein, P.T. Review of the impact of vehicle-to-grid technologies on distribution systems and utility interfaces. IEEE Trans. Power Electron. 2012, 28, 5673–5689. [Google Scholar] [CrossRef]
- Su, W.; Eichi, H.; Zeng, W.; Chow, M.Y. A survey on the electrification of transportation in a smart grid environment. IEEE Trans. Ind. Inform. 2011, 8, 1–10. [Google Scholar] [CrossRef]


Publisher’s Note: MDPI stays neutral with regard to jurisdictional claims in published maps and institutional affiliations. |
© 2021 by the authors. Licensee MDPI, Basel, Switzerland. This article is an open access article distributed under the terms and conditions of the Creative Commons Attribution (CC BY) license (https://creativecommons.org/licenses/by/4.0/).
Share and Cite
Bayati, M.; Abedi, M.; Farahmandrad, M.; Gharehpetian, G.B.; Tehrani, K. Important Technical Considerations in Design of Battery Chargers of Electric Vehicles. Energies 2021, 14, 5878. https://doi.org/10.3390/en14185878
Bayati M, Abedi M, Farahmandrad M, Gharehpetian GB, Tehrani K. Important Technical Considerations in Design of Battery Chargers of Electric Vehicles. Energies. 2021; 14(18):5878. https://doi.org/10.3390/en14185878
Chicago/Turabian StyleBayati, Mahdi, Mehrdad Abedi, Maryam Farahmandrad, Gevork B. Gharehpetian, and Kambiz Tehrani. 2021. "Important Technical Considerations in Design of Battery Chargers of Electric Vehicles" Energies 14, no. 18: 5878. https://doi.org/10.3390/en14185878
APA StyleBayati, M., Abedi, M., Farahmandrad, M., Gharehpetian, G. B., & Tehrani, K. (2021). Important Technical Considerations in Design of Battery Chargers of Electric Vehicles. Energies, 14(18), 5878. https://doi.org/10.3390/en14185878