Article

Model of Choice Photovoltaic Panels Considering Customers’ Expectations

Faculty of Mechanical Engineering and Aeronautics, Rzeszow University of Technology, al. Powstancow Warszawy 12, 35-959 Rzeszow, Poland
*
Author to whom correspondence should be addressed.
Energies 2021, 14(18), 5977; https://doi.org/10.3390/en14185977
Submission received: 3 September 2021 / Revised: 14 September 2021 / Accepted: 16 September 2021 / Published: 20 September 2021
(This article belongs to the Special Issue Energy Decision Making: Problems, Methods, and Tools)

Abstract

:
Photovoltaic electricity generation is key to achieving deep decarbonization with a high degree of electrification. It is predicted that the energy sector will reduce carbon dioxide by producing electricity mainly from photovoltaic (PV) power. Although dynamic development of the implementation of photovoltaic panels has been observed, their choice considering customer specificity is still a problem. Therefore, the purpose of this study is to propose the model of choice photovoltaic panels considering customers’ expectations. It can support the choice of a photovoltaic panel of a certain quality (satisfaction of concrete customer) in combination with the cost of its purchase. The proposed model includes acquiring and then processing customers’ expectations into technical criteria, while simultaneously considering the weighting of these criteria. It is realized in a standardized way, i.e., the zero-unitarization method (MUZ), after which normalized values of the quality of the photovoltaic panels’ criteria are obtained. In turn, the quality of these products is estimated by the weighted sum model (WSM) and then integrated with purchase cost in qualitative cost analysis (AKJ). As a result, using the scale of relative states, it is possible to categorize customer satisfaction from indicating qualitative cost and selecting the photovoltaic panel expected by customers (the most satisfactory). The effectiveness of the model was demonstrated by a sensitivity analysis, after which the key PV criteria were indicated. The proposed model is intended for any entity who selects a photovoltaic panel for customers. The computerization of calculations may contribute to its utilitarian dissemination.

1. Introduction

Negative climate changes lead to the need to make effective decisions in the context of sustainability [1,2,3]. This is mainly manifested in anthropogenic climate changes, of which 90% arise from greenhouse gases [4]. An analysis by the Intergovernmental Panel on Climate Change (IPCC) [5] showed that global emissions should be reduced to net-zero within the next few decades. The analysis was a follow-up to the Paris Agreement, which is an agreement to achieve carbon neutrality in emissions by 2050, with perspective to 2100. The National Public Utilities Council points out that the earlier, the better, and most of the commitments are set until around 2050. In this context, 137 countries have committed to carbon neutrality, as confirmed, for example, by the Energy and Climate Intelligence Unit or the Carbon Neutrality Coalition [6]. In order to reduce greenhouse gases, it is necessary to use renewable energy sources (RES) [4,7], e.g., renewable energy in the form of water, wind, solar, biomass, or geothermal energy [8]. It is considered that after 2050, 50% of the global energy supply will be produced by RES, where the volume of RES is considered as 140 times greater than the worldwide annual energy consumption [9]. According to the International Energy Agency (IEA), the world will see an increase in total renewable energy of around 50% by 2040 [10]. Currently, all RES allow to achieve about 15–20% of the world’s total energy [9]. In turn, to achieve the climate goal of limiting global warming to below 2 °C, the share of RES in the final demand of energy needs to grow from 19% in 2017 to 65% in 2050. It is predicted that the share of RES in electricity generation will be equal to 80% in 2050, whereas it was estimated at 25% in 2017 [11]. In European Union (EU) countries, this level is currently at about 32%, where the main leader is Germany [12]. In the EU, the most popular RES used to produce electricity are solid biofuels (40.3%) [12]. Despite that, it is assumed that a significant increase in the total production of renewable energy (even about 60%) will be provided by solar energy, where a key source will be photovoltaic (PV) energy [10,13,14,15,16,17].
Photovoltaic energy is the direct production of electricity from solar energy, which is a clean and safe RES [10,18]. The exploitation of PV systems exhibits minimal pollutions during their lifetime. Hence, the probable influence of PV systems on the environment from the production process until disposal cannot be ignored. During production, PV systems produce hazardous contaminants, which are dangerous for water resources and emissions of air pollutants. Additionally, the negative impact of the production of the PV systems refers to land use and environmental factors. However, PV systems are still one of the cleanest and safest RES [19]. For energy mainly used in passive heating systems [12], the most often-used instrument to convert solar energy is photovoltaic (PV) systems [7,20]. Photovoltaic energy is becoming more and more popular because of fossil fuels’ shortages as well as their negative impact on the environment [21]. In recent years, there has been an increase in the share of solar energy in the production of electricity [12]. For example, in 2019, energy from photovoltaic systems generated a total of 633 GW of the world’s solar power, whereas in 2014, it was only 177 GW [21]. Among EU countries, the biggest producer of electricity from solar energy is the Czech Republic (22.5%), followed by Germany, The Netherlands, and Italy (average 19.6%). In turn, the least electricity from solar energy is produced in Finland, Poland, Austria, and Lithuania (average 1.9%) [12]. It is predicted that the demand for solar systems will grow at a rate of 20% annually [18]. It depends on, for example, the collector’s working surface, the availability of solar radiation throughout the year, and the type of solar system [18]. Additionally, the industry purpose of the generation of photovoltaic energy is to reduce electricity generation costs in comparison to commercial electricity obtained from the electrical grid [7]. According to [16], photovoltaic generation of electricity is a key to achieving deep decarbonization with a high degree of electrification. In order to comply with the Paris Agreement, it is expected that the energetic sector reduces carbon dioxide emissions by about 80% by 2040. To achieve this, the production of electricity from photovoltaics should deliver 3518 TWh in 2030 and 7208 TWh in 2040. Additionally, globally, electricity demand growth exceeds all other fuels, i.e., according to The International Energy Agency, electricity will account for 21% of the global final energy consumption by 2030 [22]. The photovoltaic panels are commonly installed in buildings, mainly in order to maintain thermal comfort and provide hot water utilities [23]. Photovoltaic panels installed in household systems (utility-scale) constitute over 33% of the global cumulative photovoltaic power [14], are becoming more and more popular [15], and are developing faster than other RES [16,24]. Their development is perceived as being due to subsidies supporting the installation of photovoltaic panels [16]. Programs supporting the use of RES by households, for example, include subsidies for the purchase and installation of photovoltaic panels. In the last decade, households have participated in a program driven by energy cost savings [25]. However, the use of solar installations by one-family households remains relatively limited. The problem is choosing a photovoltaic panel which will be the most satisfactory for the customer [23,26].
The choice of the most favorable photovoltaic panel for the customer is a current problem, e.g., due to the dynamic growth of solar energy development (mainly from photovoltaic), and a need to adapt photovoltaic panels to changing customer requirements [1,2,4,16]. Additionally, the global photovoltaic industry is undergoing a transformation, and the number of different kinds of photovoltaic panels continues to grow [27]. This is an additional problem when determining the most favorable photovoltaic panel for the customer. After conducting a literature review, it was concluded that are a few works in which instruments used to choose a photovoltaic panel beneficial for the customer were proposed. However, there is a lack of a single, coherent model supporting the choice of a photovoltaic panel considering the customers’ expectations.
There is a lack of a model that helps to choose a photovoltaic panel based on a qualitative cost indicator. This refers to a model where quality is determined taking into account customers’ criteria (expected and rated for importance), which are processed into technical criteria of photovoltaic panels. Determined in this way, the quality level is integrated with the actual cost of purchase, where based on a qualitative cost indicator, an expected photovoltaic panel is selected. The lack of this kind of model was considered as a gap in the existing literature.
Hence, the purpose of this study is to propose a model that assists in choosing a photovoltaic panel considering customers’ expectations. As part of the analysis, the following hypotheses were assumed:
Hypothesis 1.
It is possible to determine a qualitative cost indicator of photovoltaic panels while simultaneously considering customers’ criteria and technical criteria, weighting of criteria (importance of these criteria for the customer), and the actual cost of purchasing photovoltaic panels.
Hypothesis 2.
Based on the qualitative cost indicator, it is possible to classify customer satisfaction, and thus select the photovoltaic panel closest to the customers’ expectations.
These hypotheses were verified after testing the proposed model. Testing was carried out for photovoltaic panels of key producers from Poland.

2. Literature Review
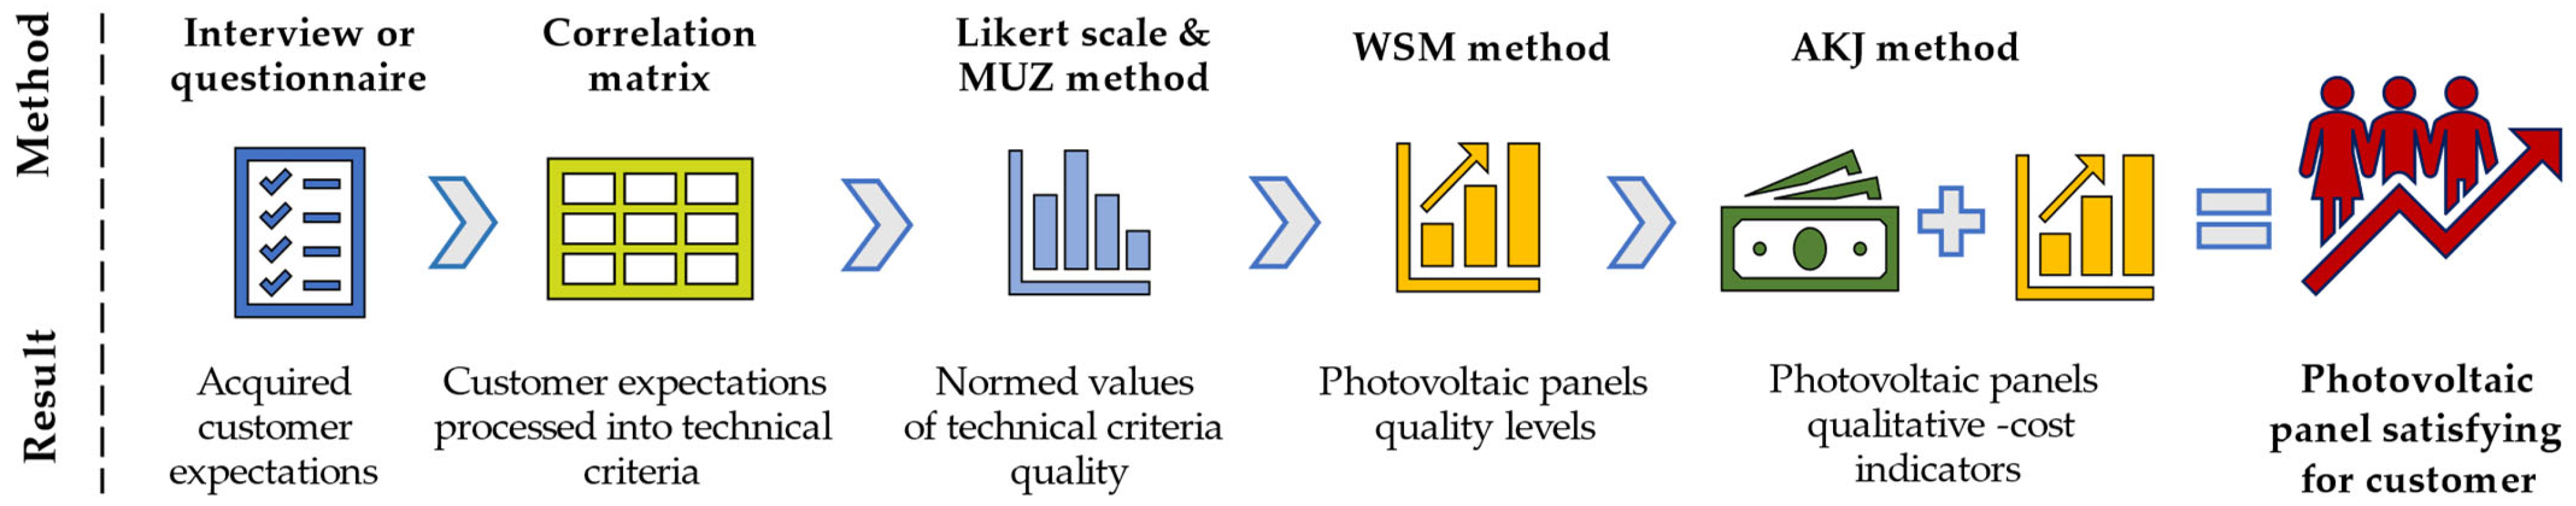
A literature review was conducted, showing that various methods of selecting solar panels have been used. For example, the authors of [28] used the Analytical Hierarchy Process (AHP) method to choose the best panel to design a photovoltaic system. In the analysis, a few technical criteria (electric, mechanical, economic), environmental criteria, and opinions from three customers were included. The AHP method was also used by the authors of [29]. The aim of their study was to rate the sustainability of renewable technology in the context of compromises between industry and the environment. Testing of this method was carried out based on photovoltaic (PV) panels. In turn, in [30], a model based on actual data from households was presented, i.e., costs, solar radiation intensity variability, and net metering policy. The aim was to make the determination of which photovoltaic system is the most efficient. Whereas authors of [31] proposed a model of multi-criteria decision making (MCDM), which integrated the AHP method and the (Multiplicative Multi-Objective Ratio Analysis (MULTIMOORA) method. In this model were included, e.g.,: costs, both monetary and environmental, efficiency, and technical indicators. Application of the model supported the choice of solar power plants as the most favorable option for producing PV in Turkey. Another example is [15], in which the technical-economic criteria of standalone photovoltaic (SAPV) were analyzed. This analysis supported the designers and customers to make a choice of the most advantageous design before the installation of SAPV. On the other hand, in [16] the motivation of customers to install photovoltaic panels was analyzed. For this purpose, a questionnaire was used in which, for example, the attitudes of customers towards the environment, and their knowledge and perception of the responsibilities in the area of environmental protection were verified. The results have shown that, e.g., knowledge, ecological awareness, and environmental values have an impact on the purchase of PV. A survey was also used by the authors of [32] to make a model of the segmentation groups of photovoltaic users. Customers from households were separated into differing groups based upon criteria, i.e., voluntary implementation, involuntary (purchase house with PV), farm adapted, or not adapted to implementation of PV. A different approach than expected for the selection of solar panels by a customer is presented in [33]. In this article, we combined quality function deployment (QFD) with Pythagorean fuzzy sets (PFS). The idea of integrated methods relied upon acquiring and processing the voice of customer (VoC) into precision data. In turn, [34] presented a method to assess the influence of photovoltaic power on customer reliability and the deployment of system reserves in a new environment. For this, the Monte Carlo simulation was used. Another example is [27], in which the evolution of photovoltaic business models was analyzed. The Business Model Canvas was used for that. Therefore, authors of [35] assessed the use of photovoltaic systems in historic buildings. The aim was to achieve better implementation of solar energy, with specific adaptations based on technical compatibility, importance of historical building, its surroundings, energy profitability, or impact RES on the external environment. Hence, customers’ opinions were not included.
A review of the literature indicates that are few works in which were proposed the instruments to choose a photovoltaic panel that was beneficial for customers. Mainly, this choice relied on using the multi-criteria decision methods (MCDM) [4,28,29,31,35]. In the analyses, the aim was to match precise customer expectations [32] and include different aspects of chosen photovoltaic panels, e.g., costs, technical criteria, environmental criteria, performance criteria [28,31], actual values from exploitation photovoltaic in households [30]. In addition, the development of photovoltaics was assessed [27,34], and motivation and awareness of customers about the implementation of these products were examined [32]. However, a model of choice photovoltaic panels considering customer expectations was not developed, where this choice includes criteria simultaneously expected by customers, such as quality of photovoltaic panels and cost of their purchase. For this purpose, this model was proposed, which is a support for experts (brokers and bidders) to determine the most favorable photovoltaic panel, which was closest to customer expectations. The literature review has shown that the choice of PV is based on the “quality” of modules, i.e., by including PV criteria. However, the customer’s expectations were not included in this process. Following authors of [1,2,4], to achieve the satisfaction of customers (expected quality level of product) it is necessary to include customer requirements in the design process. Hence, the proposed model is a new instrument to choose photovoltaic panels expected by customers and is a new area for scientific discussions. The concept and method of the proposed model are shown in the next part of article.

3. Model

A model of choice photovoltaic panels, which considers customers’ expectations, was developed. The model supports the determination of which photovoltaic panel will be the most satisfactory for the customer, both in terms of quality level and cost of purchase. The concept of the model relies on precise definition of customer expectations, i.e., the required (expected) criteria of the photovoltaic panels and their importance for customers. Then, customer expectations are processed onto technical criteria of photovoltaic panels. For this purpose, a customer and technical criteria correlation matrix was used. Then, the quality of technical criteria of photovoltaic panels related to customer expectations was estimated. For that, a combination of methods was used, i.e., zero-unitarization method (MUZ) [36,37,38,39,40] and a weighted sum model (WSM) [41,42,43,44]. The assessment of quality of criteria was done on the Likert scale [45,46], and then normalized by the MUZ method. Next, the weighted sum model (WSM) was used to calculate the quality of photovoltaic panels, taking into account the importance (weighting) and quality of criteria. Then, in order to indicate the most advantageous, in terms of quality and cost, the choice of the photovoltaic panel for customer, the calculated quality of these panels was combined with their cost, and the qualitative-cost analysis (AKJ) was applied [4,47,48,49,50]. Based on the qualitative-cost indicators, it is possible to propose the customer’s most favorable photovoltaic panel. A graphical presentation of the methods used in the model is shown in Figure 1.
The exact characteristics of the mentioned methods are shown at individual stages of the proposed model. In the following, the main benefits, determining the selection of methods, are indicated.
The MUZ method is used to normalize values within the range <0; 1>. The main benefits for choice of the MUZ method [36,37,38,39,40] were:
  • Efficiency in normalization values in any range;
  • Possibility of normalization of criteria characterized by negative, equal to zero, and positive values;
  • Normalization of equality of length and boundaries of intervals for all standardized criteria and obtaining positive or equal to zero values of criteria after normalization.
The indicated elements for the MUZ method are characteristic of photovoltaic panels’ technical criteria. Therefore, this method was considered beneficial in the proposed model.
The WSM method is used to estimate product quality based on normalized criteria values, where quality is calculated considering the weighting of these criteria. The selected benefits for applying of the WPM method [41,42,43,44] were:
  • Effective for matching several of the criteria of the product, where these criteria are independent of each other;
  • Effective in estimating the product quality based on the normalized quality of criteria;
  • Allows estimation of product quality considering criteria weighting.
The AKJ method supports making a determination of which product is satisfactory for customers in terms of quality and cost. The main benefits decisively for apply of the AKJ method [4,47,48,49,50] were:
  • Allowing for the combination of the product quality with actual cost of its purchase;
  • Supports making determinations about the product preferred by customers based on product quality level and cost of its purchase;
  • This method allows the inclusion of product quality estimations by any method, where quality has ranges from 0 to 1.
The proposed model was designed in ten main stages. The developed model and instruments using at individual stages is shown in Figure 2 and Figure 3.

3.1. Adopting a Purpose of Analysis

The aim is determined by the entity using the proposed model (bidder, broker, expert). In the proposed approach, the purpose is to choose the photovoltaic panel that is best for the customer, considering qualitative level and cost of purchase. In order to determine their aim, an initial interview with customer is preferred. During the interview, it is necessary to determine allocate of PV, e.g., household, small and medium-sized enterprises (SME), or others. For correct determine the purpose, it is adequate to use the specific, measurable, achievable, relevant, time-bound, exciting, recorded (SMART-ER) method [51,52].

3.2. Initial Selection of Photovoltaic Panels

The initial selection of photovoltaic panels is done by the entity (bidder, broker, expert) using options from the proposed model. That means, to select any number of photovoltaic panels is at the disposal of entity. The selection is done with the inclusion of the initial customer’s expectations, which were verified during the interview to determine the purpose. Hence, it is beneficial to consider the differences between building integrated photovoltaics (BIPV) [53,54] and building applied photovoltaics (BAPV) [53,55]. The BIPV can be installed in buildings as an alternative to building elements, i.e., roof, elevation. Hence, BIPV has an influence on a building’s functionality and can be an integral part of an building’s energy system [54]. In turn, the BAPV system allows the use of standard photovoltaic molds on buildings, where this system is not an integral part of building [55]. Selected photovoltaic panels will be verified in the next stages of the model. The classification of the characteristics of photovoltaic panels are shown in [18,21].

3.3. Determination of the Technical Criteria of Photovoltaic Panels

The technical criteria of PV are determined by the entity (bidder, broker, expert) or group of experts. After the literature review, e.g., [56,57,58], it was shown that it is preferred to determine between 14 and 25 technical criteria. These criteria can be determined during brainstorming (BM). It is advisable to use a catalog (specification) of photovoltaic panels. These can be based on the key (basic) criteria of photovoltaic panels, on which their quality largely depends. The technical criteria are measurable, therefore, it is easier to precisely determine the quality level of a product. Additionally, the quality of photovoltaic panels largely depends on technical criteria [1,4,18,21]. These criteria will be combined with customer criteria (also qualitative criteria), as is shown in Stage 3.6. of the model. Hence, the importance of other criteria, such as aesthetics, can be determined in the next stage of the model. Additionally, the economic criteria are omitted at this stage, because the actual cost of purchase of photovoltaic panels will be included in Stage 3.9. of the model.

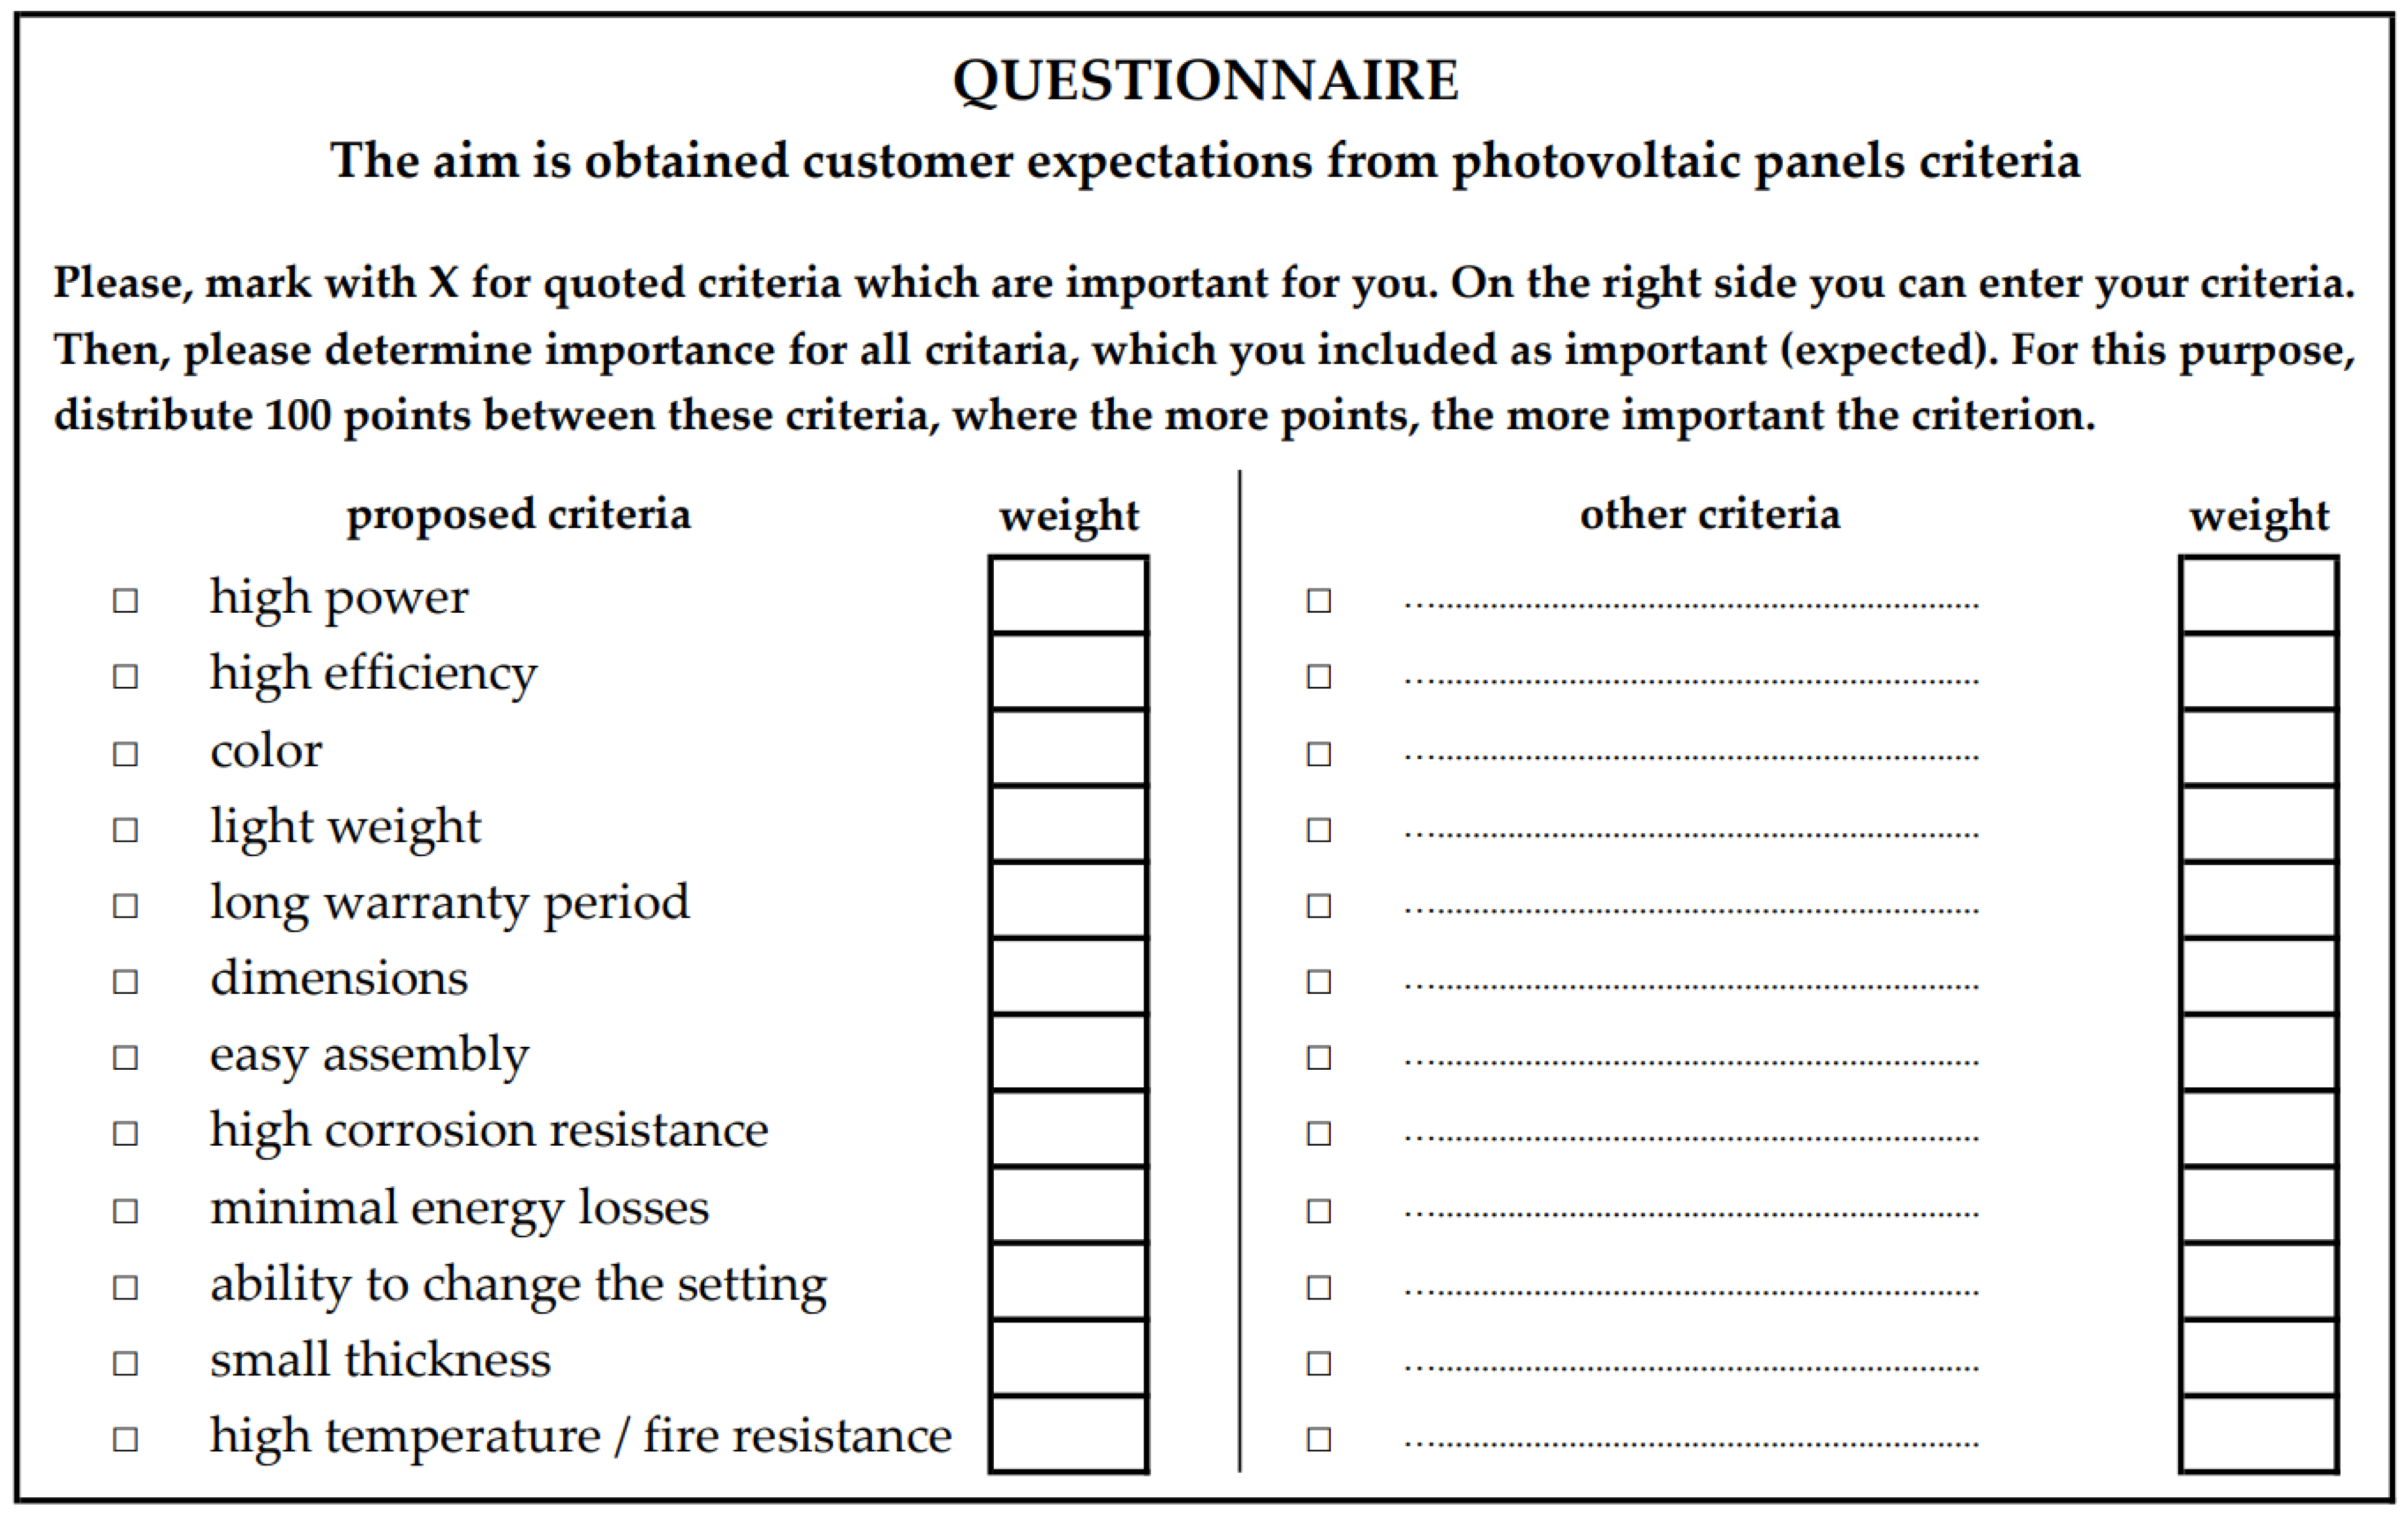
3.4. Determination of Photovoltaic Panels Criteria Expected by Customer

At this stage, the customer determines the criteria which are important for them, in view of the way in which they will use the photovoltaic panels. The aim is to select the main criteria that a photovoltaic panel should be characterized by, so that it meets the customer’s expectations. For this purpose, an interview may be conducted or a questionnaire may be used (Figure 4). The purpose of the questionnaire is to support the customer in determining their preferences and expectations [59,60,61]. Therefore, in questionnaire is preferable to propose examples of product criteria, e.g., basic or innovation criteria about which the customer is unaware.
The problems associated with determining the criteria of PV is considered in works, e.g., [53,62,63,64]. As shown by authors of articles [53,62], important is paying attention to European Research projects, which were precisely described in mentioned articles. Additionally, authors of article [62] suggested that an important criterion is the storage capacity of PV to minimize costs of managing load variance storage. Hence, a bigger energy storage capacity would imply a bigger facilities volume, and it generates difficulty for aesthetic installation of PV in an urban environment. In this context, authors [62] also mentioned that it is important to include criteria such as: aesthetic (visual presentation of PV determined by physical characteristics, for example color, size, pattern, shape, and also land or visibility) and social acceptance (determined for example by economic criteria, education, perception of RES). In turn, authors of [53] have shown that installation of photovoltaic panels is not preferred for historic and vernacular buildings. Therefore, customers should consider this when determining their criteria of PV. As shown by authors of [53], criteria should allow for high compatibility of PV by, for example, using similar architectonic materials, e.g., several colors or patterns, special and low-reflecting glasses, or innovative cost-competitive coating. For this reason, as shown in [53], it is necessary to consider criteria, such as: flexibility of dimensional, easy install, safety, reliability, fire security, thermal stability, and comfort.
There are several standards, deliverable by the International Energy Agency’s task. For example, the enabling framework for the development of BIPV (Task 15) [63]. This task refers to aesthetic criteria, and also reliability (technical criteria), and financial issues. In this context, it is preferred to include criteria, such as building energy performance, the functionality of building envelope, but, also, mentioned aesthetics. Another task of the IEA SHC is task 41 ‘Solar Energy and Architecture’ [64]. This task included the issue of influence of PV on the aesthetic of buildings. Therefore, as with the previous ones, it is necessary to remember these issues during determining criteria of PV. Other proposed criteria are shown in Figure 4. Additionally, customer should be possibilities to propose own criteria. The number of total criteria proposed by customer should be equal about from 14 to 25 criteria [56,58]. The customer specifies these criteria without using technical criteria.

3.5. Determination of Photovoltaic Panels Criteria Weighting

The criteria weightings (i.e., importance) are determined by customer. The criteria weighting is of importance for criteria in the context of use in photovoltaic panels. The customer determines weighting for all criteria (from Stage 3.4.). For this purpose, an interview may be conducted or a questionnaire may be used. The customer determines weighting only for criteria that were considered by him as of importance (necessary), i.e., determined in Stage 3.4 (criterion marked X). Other criteria should be missed. Following [52,65,66], it is effective to determine criteria weighting by distribution by customer of 100 points among all expected criteria, where the more points, the more important the criterion. The proportion of points are arbitrary but necessary is to include that more point is bigger weight. The sum of all points determined to important criteria (necessary, i.e., marked X) have to be equal to 100.
An example of a questionnaire that can be used to obtain customer expectations in relation to photovoltaic panels criteria are shown in Figure 4.
After obtained of customer expectations is necessary to realize the next step of model.

3.6. Transformation Customer Expectations into Technical Requirements

The sixth stage is transformation customer expectations into technical requirements. The aim is determining technical criteria expected by customer and its importance (weighting). This stage is realized in two steps.

3.6.1. Transformation of Customer Criteria into Technical Criteria

The first step is transformation of customer criteria into technical criteria for photovoltaic panels. Transformation is realized by expert. The purpose is reduced technical criteria only to criteria importance for customer. This step is carried out based on initial defined technical criteria (Stage 3.3.) and customer criteria of photovoltaic panels (Stage 3.5.). It is preferred to prepare correlation matrix C = [ c c × c t ] , where c c is customer criteria in i t h row, c t is technical criteria in j t h column. Correlations are determined by expert by writing X or 0, where X is correlation occurs, 0 is no correlation. Further analysis will only include technical criteria correlated with customer criteria. The criteria without correlation should be skipped [1]. Therefore, after this stage, a set of technical criteria are obtained that should be taken into account in further analysis in order to select a photovoltaic panel that satisfies the customer.

3.6.2. Transformation of Customer Criteria Weighting into Technical Criteria Weighting

The second step is transformation of customer criteria weighting into technical criteria weighting. This stage is carried out based on criteria weighting determined by customers (Stage 3.5.) and technical criteria correlated with customer criteria (Step 3.6.1.) The weighting of criteria determined by customer are presented as fraction of the sum of points (i.e., 100 points). For this purpose it is necessary to use Formula (1):
w i c = p i 100 ,
where: p is weight i t h criterion determined by customer in range from 0 to 100 points, I is photovoltaic panel criterion expected by customer.
The criteria weighting determined by the customer ( w i ) should be transformed to technical criteria weighting. It relies on assigning appropriate weighting for technical criteria correlated with customer criteria. The customer criteria can be correlated with one or more technical criteria (according to Step 3.6.1.). Hence, transformation of customer criteria weighting into technical criteria weighting is calculated by arithmetic means in Formula (2) [67]:
w ¯ i t = i = 1 n w i c n ,
where: w c is weight i t h customer criterion, n is number of customer criteria correlated with i t h technical criterion, w t is weight i t h technical criterion, i is photovoltaic panel criterion expected by the customer.
The sum of the estimated technical criteria weighting should be equal to 1. In another case, it is necessary to normalize criteria weighting according to Formula (3) [67]:
w i n = w ¯ i t i = 1 n w ¯ i t ,
where: w n is normalized weight i t h technical criterion, w ¯ i t is arithmetic mean from weighting i t h technical criteria, i is photovoltaic panel criterion expected by the customer.
Technical criteria weighting will be included on Stage 3.8. of the model to determine the quality of photovoltaic panels.

3.7. Assessment of Quality of Photovoltaic Panels Criteria

This stage is carried out by entity using the proposed model (bidder, broker, expert) or group of experts. It should be estimated quality only for technical criteria related to customer criteria (from Stage 3.6.). This stage is realized in three main steps.

3.7.1. Characterization of Photovoltaic Panels Criteria

The first step is characterization of photovoltaic panels criteria. It refers to assigning each criterion a characteristic value, e.g., parameter (values) or rang of values. The criteria values (parameters) are determined based on catalog (specification) of photovoltaic panels. For this purpose, it is necessary to create matrix M 1 = [ m × n ] , where m is technical parameters, n is photovoltaic panels. In matrix should be noted values (parameters) for all photovoltaic panels.

3.7.2. Initial Estimate of the Quality of the Technical Criteria

The second step is the initial estimate of the quality of the technical criteria. This step is carried out by an expert. Estimate quality of technical criteria are realized based on the values (parameters) of technical criteria noted in matrix M 1 . The expert compares technical criteria values with competitive photovoltaic panels values. The expert compares these criteria and, based on these criteria, assessed the impact of performance of PV systems in practice. The purpose is to estimate the quality of technical criteria to achieve by customer really feel of difference at home. The Likert scale is used for this, where 1 is low criterion quality, 5 is high criterion quality [45,46].
Initially, a twin matrix of M 1   is created, i.e., M 2 = [ m × n ] , where m is technical parameters of photovoltaic panels, n is photovoltaic panels. The matrix M 2 is used to determine the quality of photovoltaic panels quality, i.e., (4):
M 2 = [ q 11 q 12 q 13 q 1 j q 21 q 31 q 22 q 32 q 23 q 33 q 2 j q 3 j q ij q ij q ij q ij q ij ] ,
where: q is quality of photovoltaic panel criterion for i th photovoltaic panel and j th criterion.
Next, expert assessments all criteria for selected photovoltaic panels. As result, initially estimated quality of technical criteria of photovoltaic panels is obtained.
The quality was estimated based on different units of measurement for the technical criteria of photovoltaic panels. Therefore, the obtained values should be normalized. It is shown in the next step of the model.

3.7.3. Normalization of the Quality of Technical Criteria

The process of normalization of the quality of technical criteria is realized based on the initially estimated quality of these criteria (from Step 3.7.2.). The normalization consists in making transformations to standardize photovoltaic panels criteria values for their effective comparison. It is realized by depriving titers of measurement results and unification variables with respect to size. Absolute values are transformed into relative values (i.e., transformed variable values). For this purpose, the MUZ method is used (zero-unitarization method) [36,37,38,39,40].
Because the initially estimated quality (q) for i t h different criteria was described by n values (technical parameters), so-called transformed quality values should be shown in matrix W (5) [36,37]:
W = [ w 11 w 12 w 13 w 1 n w 21 w 31 w 22 w 32 w 23 w 33 w 2 n w 3 n w i 1 w i 2 w i 3 w in ] ,
where: n th is value of technical criterion of photovoltaic panel, i th is technical criterion of photovoltaic panel.
Then, it is necessary to transform values of transformed quality from columns of the matrix W into x 11 , x 21 , …, x m 1 . The normalized matrix Z is obtained (6) [38,39,40]:
Z = [ z 11 z 12 z 13 z 1 n z 21 z 31 z 22 z 32 z 23 z 33 z 2 n z 3 n z i 1 z i 2 z i 3 z in ] ,
where: z th is normalized value of technical criterion of photovoltaic panel, i th is technical criterion of photovoltaic panel.
Technical categories can be determined as a simulator, destimulator, and nominee, as shown in literature of the subject [36,37,40]. In order to cause aggregation, it is necessary to split all transformed values into either simulator or destimulator. It is carried out by Formulas (7)–(10) [36,37,38,39,40]:
x i * = x max x i ,
x i * = x max + x min x i ,
x i * = 1 x i ,
x i * = x max x i ,
where: x i * is transformed criterion quality value, x max is maximum value of quality, x min is minimum value of quality, i = 1, …, n.
After the normalization process by the zero-unitarization method (MUZ), the matrix X is obtained. This matrix is devoid of titers in a specific range of variation from 0 to 1, which correspond to the real quantities of the M matrix. The matrix X shows Formula (11) [36,39,40]:
X 1 = [ x 11 x 12 x 1 w x 1 ( w + 1 ) x 1 ( w + s ) x 21 x 22 x 2 w x 2 ( w + 1 ) x 2 ( w + s ) x r 1 x r 2 x rw x r ( w + 1 ) x r ( w + s ) ] ,   where   j   = 1 ,   ,   w + s for   submatrix :   X 1 =   [ x 11 x 12 x 1 w x 21 x 22 x 2 w x r 1 x r 2 x rw ] ,   X 2 = [ x 1 ( w + 1 ) x 1 ( w + 2 ) x 1 ( w + s ) x 2 ( w + 1 ) x 2 ( w + 2 ) x 2 ( w + s ) x r ( w + 1 ) x r ( w + 2 ) x r ( w + s ) ]
Hence, normalization formulas for criteria so-called simulant or destimulat are determined by Formula (12) [36,37,38,39,40]:
Z i j S = x ij min   i x ij max   i x ij min   i x ij ,   X j S ,   max   i x ij   min   i x ij Z i j D = max   i x ij x ij max   i x ij min   i x ij ,   X j D where : max   i   x ij , i = 1 , , m , j = 1 , , n     maxiumum i th varbiable min   i x ij , i = 1 , , m , j = 1 , , n     minimum j th varbiable by   conditions :   { z ij = 0 x ij = max i   x i j z ij = 1 x ij = min i   x i j
Whereas, for nominee is used Formula (13) [39,40]:
z ij = { x ij min   i x ij x 0 j min   i x ij dla x ij c 0 j x ij max   i x ij x 0 j max   i x ij dla x ij >   c 0 j , X ij N ,
where: c 0 j is nominal value of criterion X j
From Formula (14), conditions for normalized criterion are achieved [36,38,40]:
{ z ij = 1 x ij = c 0 j z ij = 0 ( x ij = min   i x ij   v   x ij = max   i x ij ) ,
After applying the MUZ method, is obtained aggregation of values of quality of photovoltaic panels criteria (in the range <0; 1>), which is appropriate for this method [37,38,39]. As a result, the quality of criterion of photovoltaic panels is estimated on a scale from 0 to 1, where the more points the higher the quality.

3.8. Calculation of the Quality Level of Photovoltaic Panels

The eighth stage of the model is calculation quality level of photovoltaic panels. In this aim, the weighted sum model (WSM) is used [41,42]. Applying the WSM method, it is necessary to estimate quality for all photovoltaic panels (selected on Stage 3.2.), considering normalized values quality of photovoltaic panels criteria (determined in Step 3.7.3.), and weighting of technical criteria (determined in Step 3.6.2.).
The normalized, weighted decision matrix A i W S M is created. For this purpose, the Formula (15) is used [41,42,43,44]:
A i W S M = i = 2 n w j t x i j = q i ,
where: w i t is weighting of technical criteria for i t h criterion (from Step 3.6.2.), x i j is normalized values for quality of technical criterion of photovoltaic panel (from Step 3.7.3.).
Based on calculated values, it is possible to create a ranking of photovoltaic panels. The maximum value (first position in the ranking) is the highest quality of photovoltaic panel (i.e., expected by customer). The minimum value (last position in the ranking) is the lowest quality of photovoltaic panel (i.e., unexpected by customer).
In order to choose a photovoltaic panel with simultaneously considering quality and cost of purchase, it is necessary to realize the next step of the model.

3.9. Calculation of Qualitative-Cost Indicator of Photovoltaic Panels

The ninth step is calculation of qualitative-cost indicator of photovoltaic panels. For this purpose, the qualitative-cost analysis is used (AKJ) [4,47,48,49,50].
The function of the qualitative-cost decision, in general terms, for the AKJ method is as follows (16) [4,31]:
D = f ( Q , K ) ,
where: D is decision, Q is quality of product (%), K is cost of purchase of product.
Therefore, in the AKJ method, it is possible to include the quality of photovoltaic panels (from Stage 3.8.) and the cost of their purchase. The AKJ method is shown in 10 main steps.

3.9.1. Determination of Photovoltaic Panels Quality

The first step is determination of photovoltaic panels quality. It is necessary to determine the quality of all i t h photovoltaic panels. In the proposed approach, the quality of photovoltaic panels is equal q i   (i.e., determined in Stage 3.8. of the model).

3.9.2. Determination Cost of Purchase of Photovoltaic Panels

In the second step is necessary to determine the cost of purchase of photovoltaic panels ( K i ) . The cost of purchase for all i t h photovoltaic panels should be determined. The cost is determined by expert (broker) according to the cost of purchase proposed products.

3.9.3. Calculation of the Cost–Quality Index

The third step is calculation of the cost–quality Index ( c k ). It is the index that determines how much cost one percent of quality of photovoltaic panel. The lower the cost–quality index, the better for products. According to authors of works [4,47,48] this index is calculated from Formula (17):
c k i = K i Q i ,
where: K is cost of purchase i t h photovoltaic panel (from Step 3.9.1.), Q is quality i t h photovoltaic panel (from Step 3.9.2. in %).

3.9.4. Estimation of the Relative Cost

The fourth step is estimation of the relative cost (k). Following the authors of [49,50] it is necessary to use Formula (18):
k i = K m a x K i K m a x K m i n ,
where: K is cost of purchase i t h photovoltaic panel (form Step 3.9.1.), K m a x is maximum cost from all cost of photovoltaic panels (from Step 3.9.1.), K m i n is minimum cost from all cost of photovoltaic panels (from Step 3.9.1.).

3.9.5. Estimation of the Cost–Quality Proportionality Index

The fifth step is estimation of the cost–quality proportionality index (E). For that, Formula (19) is used [4,47,49,50]:
E i = k i q i ,
where: k is relative cost for i t h photovoltaic panel (from Step 3.9.4.), q is quality i t h photovoltaic panel (from Step 3.9.2.).

3.9.6. Estimation of the Decision Function Index

The sixth step is estimation of the decision function index (d). This index depends on the value of the cost–quality proportionality index (E) as shown Formula (20) [4,47,50]:
f o r E i = < 0 ;   1 > d i = 0.5 × E i , f o r E i > 1 d i = 0.5 + 0.5 × ( 1 1 E i ) ,
where: E is cost–quality proportionality index for i t h photovoltaic panel (from Step 3.9.5.).

3.9.7. Estimation of the Relative Cost Index

The seventh step is estimation of the relative cost index (c). According to authors of works [47,48,49] this index is estimated as shown the Formula (21):
c i = c k m a x i c k i c k m a x i c k m i n i ,
where: c k m a x is maximum the relative cost index for i t h photovoltaic panel (from Step 3.9.3.), c k m i n is minimum the relative cost index for i t h photovoltaic panel (from Step 3.9.3.), c k is cost–quality index for i t h photovoltaic panel (from Step 3.9.3.).

3.9.8. Estimation of the Settlement Index for Technical Preference

The eighth step is estimation of the settlement index for technical preference ( R t ). According to authors of works [49,50] this index is determined according to Formula (22):
R t i = α q i + β d i + γ c i + δ k i α + β + γ + δ f o r α : β : γ : δ = 8 : 4 : 2 : 1 ,
Hence, the settlement index for technical preference is calculated from Formula (23) [4,47,48]:
R t i =   0.0667 ( 8 q i + 4 d i + 2 c i + k i ) ,
where: q is quality i t h photovoltaic panel (from Step 3.9.1.), d is decision function index for i t h photovoltaic panel (from Step 3.9.6.), c is relative cost index for i t h photovoltaic panel (from Step 3.9.7.), k is relative cost for i t h photovoltaic panel (from Step 3.9.4.).

3.9.9. Estimation of the Settlement Index for Economic Preference

The ninth step is estimation of the settlement index for economic preference ( R e ). According to the AKC method, this index is estimated from dependencies (24) [4,48,50]:
R e i = α k i + β c i + γ d i + δ q i α + β + γ + δ f o r α : β : γ : δ = 8 : 4 : 2 : 1 ,
Therefore, the settlement index for economic preference is calculated from Formula (25) [47,50]:
R e i =   0.0667 ( 8 k i + 4 c i + 2 d i + q i ) ,
where: q is quality i t h photovoltaic panel (from Step 3.9.1.), d is decision function index for i t h photovoltaic panel (from Step 3.9.6.), c is relative cost index for i t h photovoltaic panel (from Step 3.9.7.), k is relative cost for i t h photovoltaic panel (from Step 3.9.4.).

3.9.10. Estimation of the Decision Settlement Index

The tenth step is estimation of the decision settlement index ( R d ). Following the authors of works [4,47,48,49,50] this index is calculated from Formula (26):
R d i = R t i R e i 2 ,
where: R t is settlement index for technical preference for i t h photovoltaic panel (from Step 3.9.8.), R e is settlement index for economic preference for i t h photovoltaic panel (from Step 3.9.9.).
According to R d Index, possible is to create the ranking of photovoltaic panels. Maximum R d   value (first position) is the photovoltaic panel the most satisfying for the customer in terms of qualitative-cost. Minimum R d value (last position) is the photovoltaic panel the least satisfying for the customer in terms of qualitative-cost.
Based on the decision settlement index, it is possible to classify customer satisfaction from photovoltaic panels and from the choice photovoltaic panel expected by the customer.

3.10. Classification and Choice of Photovoltaic Panel

The tenth step is classification and choice of photovoltaic panel expected by customer. It relies on determinations of which photovoltaic panel will meet the customer’s expectations in terms of quality and cost. Classification is realized based on the decision settlement index ( R d ) estimated in Stage 3.9. of the model. For this purpose, the scale of relative states is used (Figure 5).
On the basis of the proposed model, it is possible to select the photovoltaic panel expected by the customer, i.e., satisfying the customer both in terms of quality and cost of purchase. The model supports the entity (bidder, broker, expert) in the choice of a photovoltaic panel that meets the criteria expected by customer, and subsequently allows the customer to choose a satisfying photovoltaic panel.

4. Results

The test of the proposed model was carried out based on photovoltaic panels for key Polish producers. However, any entity (bidder, broker, expert) can use the proposed model to choose a photovoltaic panel that meets the criteria expected by the customer.

4.1. Adopting Purpose of Analysis

According to first stage, initial consultation with customer was done, and the aim was determined. Customer looked for photovoltaic panel to installed in household. He considered that quality of panel, and its cost of purchase are important to him. Therefore, purpose was to choice photovoltaic panel to install in household, and this panel will be the most favorable for customer in terms of qualitative-cost.

4.2. Initial Selection of Photovoltaic Panels

According to second stage, the initial selection of photovoltaic panels was carried out. As part of testing the model, ten different photovoltaic panels of a key Polish producer were selected. In terms of customer preferences, these were photovoltaic panels for installation in a household. These panels were contractually marked from P1 to P10.

4.3. Determination of Technical Criteria of Photovoltaic Panels

Based on third stage, technical criteria of the photovoltaic panels were determined. The selection of technical criteria was carried out after a literature review [28,30,31]. Based on the catalog (specification) of photovoltaic panels was carried out brainstorming (BM), after which 22 criteria were selected:
  • Electrical criteria: rated power (Wp), short-circuit current (A), maximum current (A), idle voltage (V), maximum voltage (V), efficiency (%);
  • Application criteria: maximum system voltage (VDC), color, warranty period (years);
  • Temperature criteria: temperature coefficient of intensity (%/°C), temperature coefficient of voltage (%/°C), temperature power factor (%/°C);
  • Mechanical criteria: length (mm), width (mm), thickness (mm), weight (kg);
  • Construction criteria: windshield (mm), frame, type of cells, number of cells, kind of cells, kinematics.
All criteria are main criteria of photovoltaic panels. The characteristic of these parameters is shown in Table 1.
Additionally, characteristics of these parameters are generally available, e.g., in any specifications of photovoltaic panels, and in subject literature [28].

4.4. Determination of Photovoltaic Panels Criteria Expected by Customer

According to fourth stage, photovoltaic criteria expected by customers were selected. For this purpose, the proposed questionnaire was used. The customer pointed five expected criteria, i.e., high power, high efficiency, color, long warranty period, ability to change the setting, high temperature and fire resistance. Additionally, customers pointed to a single criterion, i.e., availability of various shapes. The customers mentioned that the most favorable color for the photovoltaic panel is black.
The rest of the proposed criteria were dismissed, because they were considered by customers as not very important.

4.5. Determination of Photovoltaic Panels Criteria Weighting

In the fifth stage, customers determined the weighting of criteria of photovoltaic panels. For this purpose, the proposed questionnaire was used. The customer designated weighting by the distribution of 100 points between these criteria: high power—weight of 30 points, high efficiency—weight of 15 points, color—weight of 10 points, long warranty period—weight of 15 points, ability to change the setting—weight of 10 points, high temperature and fire resistance—weight of 5 points, availability of various shapes—weight of 30 points.
Results from fourth and fifth stages are shown in Figure 6.

4.6. Transformation of Customer Expectations into Technical Requirements

At the sixth stage, customer expectations were transformed into technical requirements of photovoltaic panels.
As was shown in Step 3.6.1., customer criteria were transformed into technical criteria. The purpose was to reduce the technical criteria to criteria important for the customer. Hence, the correlation matrix was developed. In this matrix, correlations (X) or lack of correlations (0) between customer criteria and technical criteria were determined by the expert. Results are presented in Table 2.
It was shown that a lack of correlation between customer criteria and technical criteria of photovoltaic panels for frame and weight. Therefore, these criteria were dismissed in further analysis. Other technical criteria (i.e., 20 criteria) were considered adequate to verify because were associated with customer criteria. As shown in Step 3.6.2., weighting of customer criteria were transformed into weights of technical criteria of photovoltaic panels. The Formula (1) was used for this. The result was shown in Table 3.
Then, the weight ( w i c ) was noted for correlated technical criteria with customer criteria. Weights of each technical criterion were estimated as arithmetic average with weights of customer criteria ( w ¯ i t ) . The Formula (2) was used for that. The sum of all criteria weights was greater than 1. Therefore, according to Formula (3), the technical criteria weights were normalized. The result is shown in Table 4.
The normalized weights of technical criteria ( w i n ) of photovoltaic panels were considered in the future stage of analysis (i.e., during calculating the quality level of photovoltaic panels).

4.7. Assessment of Quality of Photovoltaic Panels Criteria

According to seventh stage of the model, the quality of technical criteria was estimated. As shown in Step 3.7.1. of the model, all photovoltaic panels were characterized relative to technical criteria. The specification of selected photovoltaic panels was used for that. The result is shown in Table 5.
As assumed in Step 3.7.2. of the model, the quality of the technical criteria of photovoltaic panels was estimated. It was based on Table 4. The same parameter values characterized the criteria, i.e., maximum system voltage, type of cells, kind of cells, kinematics and warranty period. Therefore, these criteria were not included in the next analysis, i.e., there is no justification for comparing these criteria with each other. The matrix M 2 was done, in which a team of experts assessed the quality of other criteria of photovoltaic panels (i.e., 15 criteria). This assessment was done on the Likert scale and was on a comparison of criteria of the same kind. Additionally, assessment of color criterion resulted from preference customer, where the most favorable color was black. The result is shown in Table 6.
According to Step 3.7.3., the normalization process was realized, i.e., unify values of photovoltaic panels criteria to their effective comparison. The MUZ method was used for that. The expert determined categories as destimulants and simulants, where the higher the destimulant value, the better the quality of photovoltaic panel criterion, while the higher the stimulant value, the worse the quality of photovoltaic panel criterion. The result is presented in Table 7.
Normalized values of quality of technical criteria were in range <0; 1>. Therefore, the process of normalized was carried out correctly.

4.8. Calculation Quality Level of Photovoltaic Panels

In the eighth stage of the model, the quality level of photovoltaic panels was calculated. For this purpose, the weighted sum model (WSM) was used. The normalized values of technical criteria quality (from Stage 4.7.) and weights of technical criteria (from Stage 4.6.) were used to estimate the quality of photovoltaic panels. The result is presented in Table 8.
The quality of photovoltaic panels was calculated based on Table 7. The Formula (15) was used for that. The result is shown in Table 9.
Based on values of photovoltaic panels’ quality level ( q i ) was created ranking. The result is shown in Figure 7.
It was demonstrated, that the photovoltaic panel marked P4 has the highest quality level (0.58) and is the most favorable for customer during quality. Other photovoltaic criteria were characterized by relatively lower quality levels. As part to determine a qualitative-cost index was carried out next stage of the model.

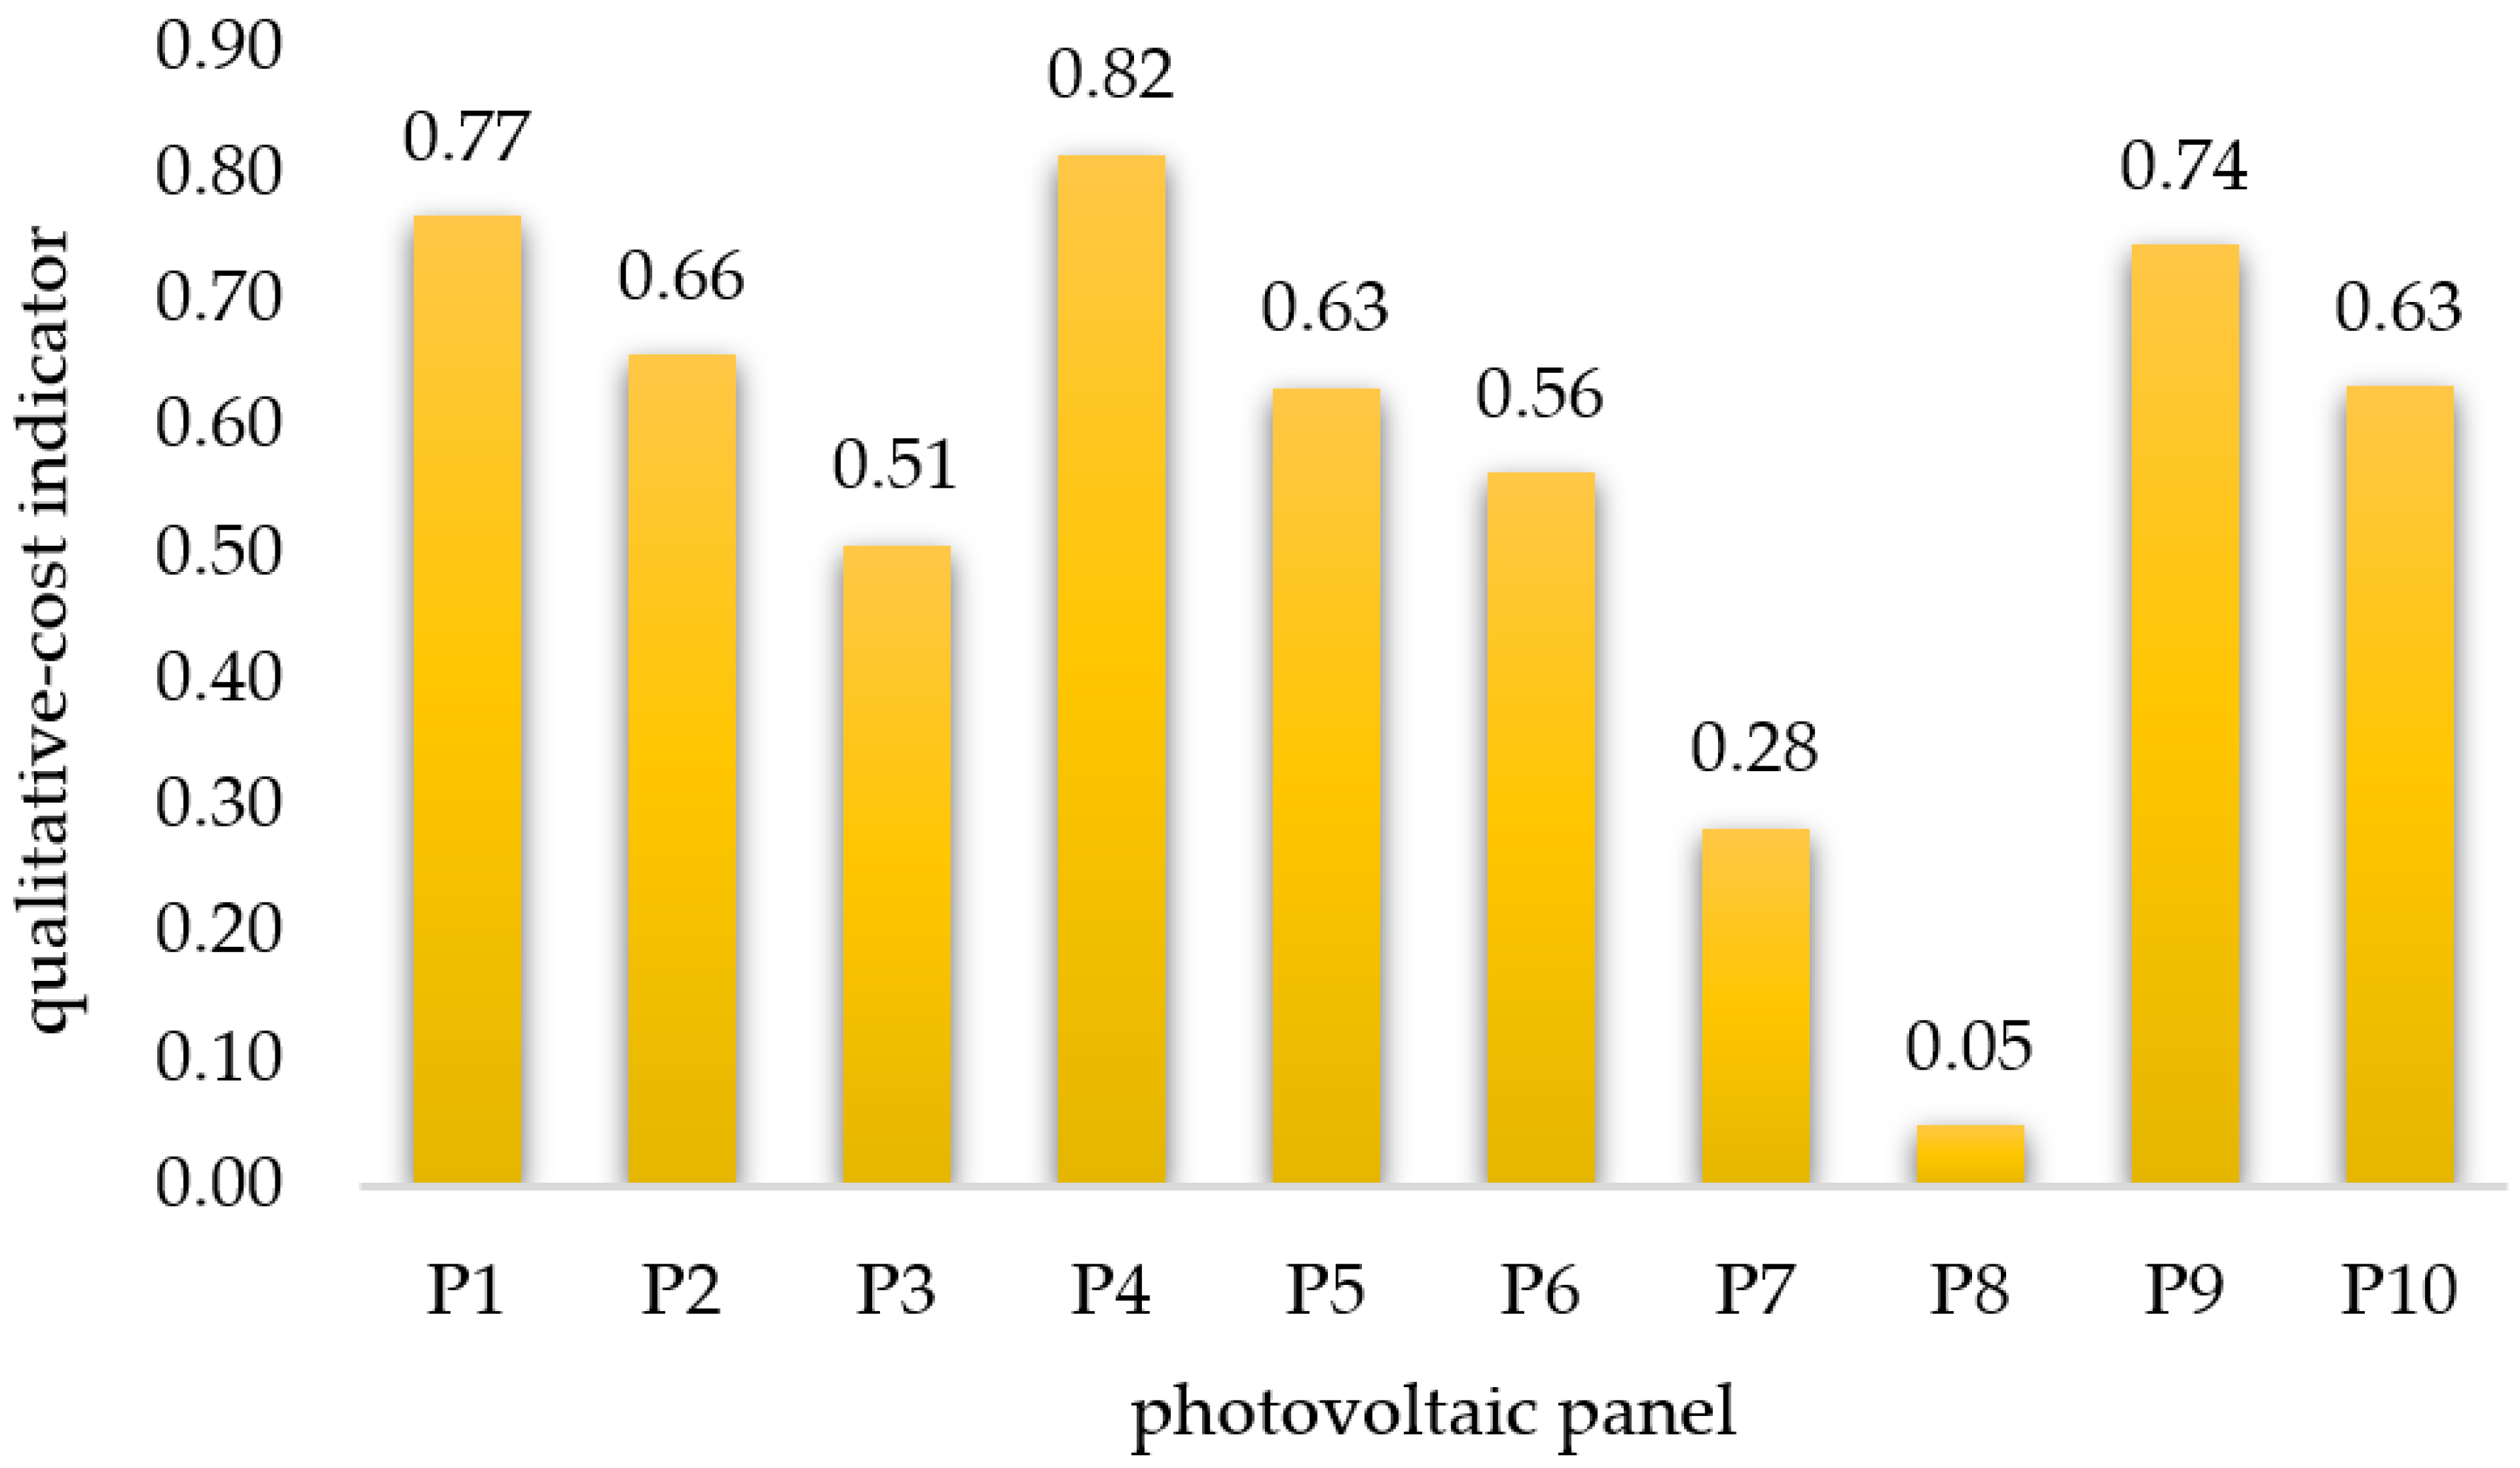
4.9. Calculation of Qualitative-Cost Indicator of Photovoltaic Panels

In stage ninth of the model, the qualitative-cost indicator of photovoltaic panels was calculated. The AKJ method was used for that.
According to Step 3.9.1., it was considered that quality of photovoltaic panels are determined by values ( q i ). According to Step 3.9.2., the approximate purchase cost of a single photovoltaic panel was determined. Then, steps of the model from 3.9.3. to 3.9.10. were carried out. The results are shown in Table 10 and Figure 8.
After simultaneously considering the quality and cost of photovoltaic panels, it was considered that panel P2 (Rd = 0.82) was still the most favorable for the customer. This panel has the highest quality level and relatively the lowest cost of purchase. Subsequently, the qualitative-cost indicators were classified and a photovoltaic panel satisfying the customer was selected.

4.10. Classification and Choice of Photovoltaic Panel

In the tenth stage of the model, photovoltaic panels were classified and the most favorable photovoltaic panel was selected. It consisted of clustering the decision settlement index ( R d ) according to relative states scale. The result is shown in Table 11.
It was demonstrated, that the choice of photovoltaic panel P4 is a distinctive decision. This panel has the highest indicator Rd (0.82), which, in this case, is the highest quality level and the lowest cost of purchase. Therefore, finally, we demonstrated that the choice of photovoltaic panel P4 is the most preferred for this customer. In this case, it was turned out that not always the highest cost of purchase is equal to the highest quality level. This proves the suitability and effectiveness of the proposed model to precise choice of photovoltaic panel expected by customer.

5. Discussion

Meeting customer expectations is the basic activity of successful organizations [68,69,70]. In the era of increased demand for the implementation of renewable energy sources (RES) [2,4,10], it is effective to install and develop photovoltaic panels. It resulted from the perspective of the use of these products as a key tool to reduce negative climate changes and produce electrical energy [10,13,14,15,16]. The most popular are the photovoltaic panels installed in households [9,10], whose assembly for individual customers develops faster than other RES [16,24]. However, customers chose photovoltaic panels that supports the criteria expected by customers [28,30,31]. Therefore, the purpose was to propose a model of choice photovoltaic panels considering customers’ expectations. The test of the model was carried out for key Polish producers of photovoltaic panels. As a result, a photovoltaic panel was selected that met the customer’s expectations, both in terms of quality and cost.
Testing of the proposed model, the difference between rankings of the photovoltaic panel for quality level ( q ) and qualitative-cost indicator were verified ( R d ). The summary of these rankings is presented in Table 12.
Under the accepted conditions, it was concluded that considering the cost of purchase of photovoltaic panels has an impact on the satisfied customer from photovoltaic panels. For assessments of this customer, we simultaneously considered that the quality and cost allowed to increase their satisfaction for the panels, i.e., P1 (from 4 to 2), P10 (from 7 to 5), P2 (from 8 to 4). On the other hand, a decrease in customer satisfaction was observed for the panels, i.e., P9 (from 2 to 3), P5 (from 3 to 5), P6 (from 5 to 6), P3 (from 6 to 7), P7 (from 6 to 8). Only for photovoltaic panels P4 and P8, no difference was observed, i.e., P4 (first position in both rankings—the highest quality level and the lowest cost), and P8 (ninth position in both rankings—the worst quality level and the highest cost). In the adopted assumptions, the increase in customer satisfaction resulted from a relatively high level of quality and low purchase cost of photovoltaic panels. On the other hand, a decrease in customer satisfaction was observed for relatively low levels of quality and higher purchase costs of photovoltaic panels. In the analyzed case, it was turned out that not always the highest quality is equal to the highest cost of purchase. However, the obtained ranking relies on individual adopted assumptions, therefore it will be different due to change expectations of customer.
Then, the sensitivity analysis was done. The purpose was to verify (post-factum) the influence of elements included in the model on the final choice of a photovoltaic panel. A sensitivity analysis was carried out in program STATISTICA 13.3. For this purpose, the neuron network model was created. The input variables (explanatory) were selected, i.e., normalized values of photovoltaic criteria quality ( x ij ), quality level of photovoltaic panel ( q i ), and the cost of purchase of photovoltaic panel (Ki). The output variable (explained) was a qualitative-cost indicator (the decision settlement index, Rd), based on which classified and choice photovoltaic panel expected by customer. The input and output variables were quantitative variables. A simplified scheme of input variables processed into output variables by the neural network is presented in Figure 9.
The model was carried out as part of multiple sampling, using a random sampling method. In order to increase the network’s ability to data generalization, according to the authors of articles [4,71], it was assumed: training sample (70%), test sample (15%), and validation sample (15%), number of samples equal to 2, and the initial generator value was 1000. The selection of the final neural network was based on multiple tests of differing models, for example, the number of neurons in the hidden layer or the type of activation function. Finally, the network type of multilayer perceptron (MPL) was selected [71]. It was the network of MPL 17-15-1 characterized by 17 input neurons, 15 hidden layer neurons, and 1 output neuron. Information about the selected neural network is shown in Table 13.
Results from applying created neural network to global sensitivity analysis are shown in Table 14.
In the assumed conditions for testing the model, sensitivity analysis demonstrates that photovoltaic panels criteria were selected in the correct way (values above 1 or near 1). In this case, these criteria had an important impact on choice of a photovoltaic panel. In an assumed assessment of quality and costs, the greatest impact on the final choice of photovoltaic panel was the cost of its purchase (4.880). The least significant impact was the efficiency criterion (0.989). The carried out sensitivity analysis demonstrates that research was correctly realized. It has been shown that the customer’s preferred photovoltaic panel has been properly identified. At the same time, the correctness of the adopted hypotheses was confirmed.
It was shown that it is possible to determine qualitative-cost indicator of photovoltaic panels with simultaneously considering customer’ criteria and technical criteria, weights of criteria (importance of these criteria for customer), and actual cost of purchase photovoltaic panels. Additionally, it was concluded that, based on qualitative-cost indicator it is possible to classify customer satisfaction, and, thus, select the photovoltaic panel closest to the customer’s expectations.
The main advantages of the proposed model:
  • The precise choice of photovoltaic panel considering customer expectations;
  • The possibility of choice of the photovoltaic panel, simultaneously taking into account quality of photovoltaic panel and cost of purchase;
  • The predicting customer satisfaction from qualitative-cost indicator of photovoltaic panel;
  • The possibility estimate product quality level for photovoltaic panel criteria which are important for customer;
  • The systematic reduction in multiple technical criteria for photovoltaic panels to criteria which are important and expected for customer;
  • Additionally, the proposed model has business benefits, i.e.:
  • A low-cost instrument to support the entity (bidder, broker, expert) to choose a photovoltaic panel with criteria expected by the customer;
  • Supporting customers in determining their requirements and expectations about photovoltaic panel;
  • The possibility to verify a photovoltaic panel and its criteria;
  • The increase in customer satisfaction with the products offered;
  • Obtaining information about customer requirements to predict the expected photovoltaic panels.
The disadvantage of the proposed model is that there is no possibility for generalization of the selection of photovoltaic panels for many customers. It results from the character of the proposed model, where the choice of photovoltaic panel is closely related to individual customer expectations. Additionally, the proposed model is not resistant to changing customer requirements in the future. Another disadvantage of the model is the fact that obtained rankings of choice photovoltaic panels rely on customer preference and types of analyzed photovoltaic panels.
As part of future research, we have planned to implement the model in software and an extension of the model with other criteria, e.g., environmental criteria. Additionally, future research will be concentrated on the implementation of the algorithm to predict customer expectations.

6. Conclusions

Negative climate changes generate a need to making effective actions. In this area, a beneficial instrument are renewable energy sources (RES). In the last decade, there has been a significant development of the perspective around solar energy, mainly photovoltaic energy. In view of a need for the adaptability of photovoltaic panels to changing customer expectations, a model which supported the choice of photovoltaic panel which considered customer expectations was developed.
Therefore, the purpose was to propose a model of choice photovoltaic panels which considered customers’ expectations. The model helps to determine which photovoltaic panel will be the most satisfactory for customer, both in terms of its quality level and purchase cost. An idea of the model relies on an estimation of the quality of photovoltaic panels by connecting customer criteria with technical criteria, while simultaneously including weighting (importance) of these criteria. The combined methods were used for that, i.e., zero-unitarization method (MUZ) and weighted sum model (WSM). Then, the quality of photovoltaic panels was connected with the actual cost of their purchase. The AKJ method (qualitative-cost analysis) was used for this. Additionally, by implemented in model the relative state scale, it is possible to classification customer satisfaction and choice of photovoltaic panel expected by customer. Based on the qualitative-cost indicator, it was possible to propose the photovoltaic panel that was the most favorable for the customer.
A test of the model was carried out for ten photovoltaic panels of key Polish producers. The verification was carried out for 22 key technical criteria of photovoltaic panels, i.e., rated power (Wp), short-circuit current (A), maximum current (A), idle voltage (V), maximum voltage (V), efficiency (%), maximum system voltage (VDC), warranty period (years), temperature coefficient of intensity (%/°C), temperature coefficient of voltage (%/°C), temperature power factor (%/°C), length (mm), width (mm), thickness (mm), weight (kg), windshield (mm), frame, type of cells, number of cells, kind of cells, and kinematics. For the testing of the model, an adequate questionnaire was to obtain customer expectations. The customer pointed to six expected criteria of photovoltaic panels and determined their weighting (importance). For this purpose, customers designated weighting by distribution of 100 points between these criteria, i.e., high power—weighting of 30 points, high efficiency—weighting of 15 points, color—weighting of 10 points, long warranty period—weighting of 15 points, ability to change the setting—weighting of 10 points, high temperature and fire resistance—weighting of 5 points, availability of various shapes—weighting of 30 points. Customer criteria were combined with technical criteria of photovoltaic panels. It was shown a lack of correlation between customer criteria and technical criteria of photovoltaic panels for frame and weighting. Therefore, these criteria were dismissed in further analysis. Other technical criteria (i.e., 20 criteria) were considered adequate to verify because they were associated with customer criteria. Then, the quality of photovoltaic panels criteria were assessed. The same parameter values characterized the criteria, i.e., maximum system voltage, type of cells, kind of cells, kinematics, and warranty period. Therefore, these criteria were not included in the next analysis, i.e., there is no justification for comparing these criteria with each other. Hence, the quality of photovoltaic panels was estimated for fifteen criteria. This quality included the weighting (importance) of criteria that were determined by the customer. The combined methods were used for that, i.e., zero-unitarization method (MUZ) and weighted sum model (WSM). It was demonstrated that the photovoltaic panel marked P4 has the highest quality level (0.58) and is the most favorable for customer during quality. Other photovoltaic criteria were characterized by relatively lower quality levels. Then, the quality of photovoltaic panels was compared with the cost of its purchase. The AKJ method (qualitative-cost analysis) was used for this. After classification (i.e., clustering the decision settlement index ( R d ) according to relative states scale) of the customer satisfaction, it was concluded that the most favorable photovoltaic panel is P4. This panel was characterized by the highest quality level and the lowest cost of purchase (Rd = 0.82). It consisted of clustering the decision settlement index ( R d ) according to relative states scale. However, the results will be different in terms of customer preference, types of photovoltaic panels, or selected criteria and their weighting. After sensitivity analysis, it was shown that the proposed model is effective and allows to choose photovoltaic panels based upon a consideration of customer expectations.
The proposed model can be used by any entity (bidder, broker, expert) to choose the photovoltaic panel expected by customer. Additionally, the model can be an effective tool supporting the dynamic development of photovoltaic panels. The use of the model can help the customer to define his preferences, and, thus, contribute to the increase in customer satisfaction with photovoltaic panels. The computerization of calculations may contribute to its utilitarian dissemination.

Author Contributions

Conceptualization, D.S. and A.P.; methodology, A.P.; formal analysis, D.S.; writing—original draft preparation, D.S.; writing—review and editing, A.P.; visualization, D.S.; supervision, A.P. All authors have read and agreed to the published version of the manuscript.

Funding

This research received no external funding.

Institutional Review Board Statement

Not applicable.

Informed Consent Statement

Not applicable.

Data Availability Statement

Not applicable.

Conflicts of Interest

The authors declare no conflict of interest.

References

  1. Siwiec, D.; Pacana, A. Model Supporting Development Decisions by Considering Qualitative–Environmental Aspects. Sustainability 2021, 13, 9067. [Google Scholar] [CrossRef]
  2. Pacana, A.; Siwiec, D.; Bednárová, L. Analysis of the incompatibility of the product with fluorescent method. Metalurgija 2019, 3–4, 337–340. [Google Scholar]
  3. Eitan, A. Promoting Renewable Energy to Cope with Climate Change—Policy Discourse in Israel. Sustainability 2021, 13, 3170. [Google Scholar] [CrossRef]
  4. Ulewicz, R.; Siwiec, D.; Pacana, A.; Tutak, M.; Brodny, J. Multi-Criteria Method for the Selection of Renewable Energy Sources in the Polish Industrial Sector. Energies 2021, 14, 2386. [Google Scholar] [CrossRef]
  5. The Intergovernmental Panel on Climate Change (IPCC). Available online: https://www.ipcc.ch/2020/07/31/energy-climatechallenge/ (accessed on 11 September 2021).
  6. Race to Net Zero: Carbon Neutral Goals by Country. Available online: https://www.visualcapitalist.com/race-to-net-zero-carbon-neutral-goals-by-country/ (accessed on 12 September 2021).
  7. Węgierek, P.; Pastuszak, J.; Dziadosz, K.; Turek, M. Influence of Substrate Type and Dose of Implanted Ions on the Electrical Parameters of Silicon in Terms of Improving the Efficiency of Photovoltaic Cells. Energies 2020, 13, 6708. [Google Scholar] [CrossRef]
  8. Liczmańska-Kopcewicz, K.; Pypłacz, P.; Wiśniewska, A. Resonance of Investments in Renewable Energy Sources in Industrial Enterprises in the Food Industry. Energies 2020, 13, 4285. [Google Scholar] [CrossRef]
  9. Kumar, M. Social, Economic, and Environmental Impacts of Renewable Energy Resources. In Wind Solar Hybrid Renewable Energy System; IntechOpen Limited: London, UK, 2020; pp. 1–11. [Google Scholar] [CrossRef] [Green Version]
  10. Jie, Y.; Ji, X.; Yue, A.; Chen, J.; Deng, Y.; Chen, J.; Zhang, Y. Combined Multi-Layer Feature Fusion and Edge Detection Method for Distributed Photovoltaic Power Station Identification. Energies 2020, 13, 6742. [Google Scholar] [CrossRef]
  11. Solaun, K.; Cerda, E. Climate change impacts on renewable energy generation. A review of quantitative projections. Renew. Sustain. Energy Rev. 2019, 116, 109415. [Google Scholar] [CrossRef]
  12. Energy from Renewable Sources in 2019. Available online: https://stat.gov.pl/obszary-tematyczne/srodowisko-energia/energia/energia-ze-zrodel-odnawialnych-w-2019-roku,3,14.html (accessed on 23 August 2021).
  13. Pacana, A.; Siwiec, D. Analysis of the Possibility of Used of the Quality Management Techniques with Non-Destructive Testing. Tech. Gaz. 2021, 28, 45–51. [Google Scholar] [CrossRef]
  14. International Energy Agency. Renewables 2019. 2019. Available online: https://www.iea.org/reports/renewables-2019 (accessed on 23 August 2021).
  15. Behrouz, B.; Appadoo, S.S.; Thavaneswaran, A.; Hoque, M.E. Modeling of Short-Term Electricity Demand and Comparison of Machine Learning Approaches for Load Forecasting. In Proceedings of the 2020 IEEE 44th Annual Computers, Software, and Applications Conference (COMPSAC), Madrid, Spain, 13–17 July 2020; IEEE: Madrid, Spain, 2020; pp. 1302–1307. [Google Scholar] [CrossRef]
  16. Grębosz-Krawczyk, M.; Zakrzewska-Bielawska, A.; Glinka, B.; Glińska-Neweś, A. Why Do Consumers Choose Photovoltaic Panels? Identification of the Factors Influencing Consumers’ Choice Behavior regarding Photovoltaic Panel Installations. Energies 2021, 14, 2674. [Google Scholar] [CrossRef]
  17. Wolniak, R.; Saniuk, S.; Grabowska, S.; Gajdzik, B. Identification of Energy Efficiency Trends in the Context of the Development of Industry 4.0 Using the Polish Steel Sector as an Example. Energies 2020, 13, 2867. [Google Scholar] [CrossRef]
  18. Ferreira, A.C.; Silva, A.; Teixeira, J.C.; Teixeira, S. Multi-Objective Optimization of Solar Thermal Systems Applied to Portuguese Dwellings. Energies 2020, 13, 6739. [Google Scholar] [CrossRef]
  19. Tawalbeh, M.; Al-Othman, A.; Kafiah, F.; Abdelsalam, E.; Almomani, F.; Alkasrawi, M. Environmental impacts of solar photovoltaic systems: A critical review of recent progress and future outlook. Sci. Total Environ. 2021, 759, 143528. [Google Scholar] [CrossRef] [PubMed]
  20. Shaito, A.; Hammoud, M.; Kawtharani, F.; Kawtharani, A.; Reda, H. Power Enhancement of a PV Module Using Different Types of Phase Change Materials. Energies 2021, 14, 5195. [Google Scholar] [CrossRef]
  21. Yildirim, M.A.; Nowak-Ocłoń, M. Modified Maximum Power Point Tracking Algorithm under Time-Varying Solar Irradiation. Energies 2020, 13, 6722. [Google Scholar] [CrossRef]
  22. Report Extract. Outlook for Electricity. Available online: https://www.iea.org/reports/world-energy-outlook-2020/outlook-for-electricity (accessed on 12 September 2021).
  23. Li, C.; Huang, Q.; Wang, Y. Effect of Color Coating of Cover Plate on Thermal Behavior of Flat Plate Solar Collector. Energies 2020, 13, 6696. [Google Scholar] [CrossRef]
  24. Swayne, T.; Barton, D. Photovoltaic Distributed Generation Impact Analysis—A Rural Electric Cooperative Case Study. In Proceedings of the 2017 IEEE Rural Electric Power Conference (REPC), Columbus, OH, USA, 23–26 April 2017; IEEE: Columbus, OH, USA, 2017; pp. 73–81. [Google Scholar] [CrossRef]
  25. Siudek, A.; Klepacka, A.M.; Florkowski, W.J.; Gradziuk, P. Renewable Energy Utilization in Rural Residential Housing: Economic and Environmental Facets. Energies 2020, 13, 6637. [Google Scholar] [CrossRef]
  26. Fernández, G.; Galan, N.; Marquina, D.; Martínez, D.; Sanchez, A.; López, P.; Bludszuweit, H.; Rueda, J. Photovoltaic Generation Impact Analysis in Low Voltage Distribution Grids. Energies 2020, 13, 4347. [Google Scholar] [CrossRef]
  27. Horvath, D.; Szabo, R. Evolution of photovoltaic business models: Overcoming the main barriers of distributed energy deployment. Renew. Sustain. Energy Rev. 2018, 90, 623–635. [Google Scholar] [CrossRef]
  28. Balo, F.; SAgbansua, L. The Selection of the Best Solar Panel for the Photovoltaic System Design by Using AHP. Energy Procedia 2016, 100, 50–53. [Google Scholar] [CrossRef] [Green Version]
  29. Hartvigsson, E.; Odenberger, M.; Chen, P.; Nyholm, E. Estimating national and local low-voltage grid capacity for residential solar photovoltaic in Sweden, UK and Germany. Renew. Energy 2021, 171, 915–926. [Google Scholar] [CrossRef]
  30. Chatterji, E.; Bazilian, D. Smart Meter Data to Optimize Combined Roof-Top Solar and Battery Systems Using a Stochastic Mixed Integer Programming Model. IEEE Access 2020, 8, 133843–133853. [Google Scholar] [CrossRef]
  31. Seker, S.; Kahraman, C. Socio-economic evaluation model for sustainable solar PV panels using a novel integrated MCDM methodology: A case in Turkey. Socio-Econ. Plan. Sci. 2021, 77, 100998. [Google Scholar] [CrossRef]
  32. Vasseur, V.; Kemp, R. A segmentation analysis: The case of photovoltaic in the Netherlands. Energy Effic. 2015, 8, 1105–1123. [Google Scholar] [CrossRef] [Green Version]
  33. Haktanir, E.; Kahraman, C. A novel interval-valued Pythagorean fuzzy QFD method and its application to solar photovoltaic technology development. Comput. Ind. Eng. 2019, 132, 361–372. [Google Scholar] [CrossRef]
  34. Zhao, Q.; Wang, P.; Goel, L.; Ding, Y. Evaluation of nodal reliability risk in a deregulated power system with photovoltaic power penetration. IET Gener. Transm. Distrib. 2014, 8, 421–430. [Google Scholar] [CrossRef]
  35. Polo López, C.S.; Lucchi, E.; Leonardi, E.; Durante, A.; Schmidt, A.; Curtis, R. Risk-Benefit Assessment Scheme for Renewable Solar Solutions in Traditional and Historic Buildings. Sustainability 2021, 13, 5246. [Google Scholar] [CrossRef]
  36. Kukuła, K.; Bogocz, D. Zero unitarization method and its application in ranking research in agriculture. Econ. Reg. Stud. 2014, 3, 5–13. [Google Scholar] [CrossRef]
  37. Zadrąg, R.; Kniaziewicz, T. Utilization of the zero unitarization method for the building of a ranking for diagnostic marine engine parameters. Combust. Engines 2017, 171, 44–50. [Google Scholar] [CrossRef]
  38. Kiselakova, D.; Stec, M.; Grzebyk, M.; Sofrankova, B. A Multidimensional Evaluation of the Sustainable Development of European Union Countries—An Empirical Study. J. Compet. 2020, 12, 56–73. [Google Scholar] [CrossRef]
  39. Kryk, B.; Guzowska, M.K. Implementation of Climate/Energy Targets of the Europe 2020 Strategy by the EU Member States. Energies 2021, 14, 2711. [Google Scholar] [CrossRef]
  40. Normalizacja Kryteriów Oceny Dostaw w Systemach Zaopatrzenia. Available online: https://docplayer.pl/58180323-Normalizacja-kryteriow-oceny-dostaw-w-systemach-zaopatrzenia.html (accessed on 23 August 2021).
  41. Kolios, A.; Mytilinou, V.; Lozano-Minguez, E.; Salonitis, K. A Comparative Study of Multiple-Criteria Decision-Making Methods under Stochastic Inputs. Energies 2016, 9, 566. [Google Scholar] [CrossRef] [Green Version]
  42. Tscheikner-Gratl, F.; Egger, P.; Rauch, W.; Kleidorfer, M. Comparison of Multi-Criteria Decision Support Methods for Integrated Rehabilitation Prioritization. Water 2017, 9, 68. [Google Scholar] [CrossRef] [Green Version]
  43. Wang, C.-N.; Chen, Y.-T.; Tung, C.-C. Evaluation of Wave Energy Location by Using an Integrated MCDM Approach. Energies 2021, 14, 1840. [Google Scholar] [CrossRef]
  44. Gupta, A.; Slebi-Acevedo, C.J.; Lizasoain-Arteaga, E.; Rodriguez-Hernandez, J.; Castro-Fresno, D. Multi-Criteria Selection of Additives in Porous Asphalt Mixtures Using Mechanical, Hydraulic, Economic, and Environmental Indicators. Sustainability 2021, 13, 2146. [Google Scholar] [CrossRef]
  45. Joshi, A.; Kale, S.; Chandel, S.; Pal, D.K. Likert Scale: Explored and Explained. Curr. J. Appl. Sci. Technol. 2015, 7, 396–403. [Google Scholar] [CrossRef]
  46. Sullivan, G.; Artino, A. Analyzing and Interpreting Data from Likert-Type Scales. J. Grad. Med. Educ. 2013, 5, 541–542. [Google Scholar] [CrossRef] [Green Version]
  47. Pacana, A.; Siwiec, D.; Bednárová, L. Method of Choice: A Fluorescent Penetrant Taking into Account Sustainability Criteria. Sustainability 2020, 12, 5854. [Google Scholar] [CrossRef]
  48. Siwiec, D.; Bednarova, L.; Pacana, A.; Zawada, M.; Rusko, M. Decision support in the production of packaging films by cost-quality analysis. Przem. Chem. 2019, 98, 1594–1596. [Google Scholar] [CrossRef]
  49. Pacana, A.; Ulewicz, R. Analysis of causes and effects of implementation of the quality management system com-pliant with ISO 9001. Pol. J. Manag. Stud. 2020, 21, 283–296. [Google Scholar] [CrossRef]
  50. Kosacka, M.; Golinska-Dawson, P.; Mierzwiak, R. Sustainability Classification for SMEs from the Remanufacturing Sector. Chiang Mai Univ. J. Nat. Sci. 2015, 14, 321–338. [Google Scholar] [CrossRef]
  51. Lawlor, K.B.; Hornyak, M.J. Smart Goals: How the Application of Smart Goals Can Contribute to Achievement of Student Learning Outcomes. Dev. Bus. Simul. Exp. Learn. 2012, 39, 259–267. [Google Scholar]
  52. Lescauskiene, I.; Bausys, R.; Zavadskas, E.K.; Juodagalviene, B. VASMA Weighting: Survey-Based Criteria Weighting Methodology that Combines ENTROPY and WASPAS-SVNS to Reflect the Psychometric Features of the VAS Scales. Symmetry 2020, 12, 1641. [Google Scholar] [CrossRef]
  53. Lucchi, E.; Polo Lopez, C.S.; Franco, G. A conceptual framework on the integration of solar energy systems in heritage sites and buildings. IOP Conf. Ser. Mater. Sci. Eng. 2020, 949, 012113. [Google Scholar] [CrossRef]
  54. Biyik, E.; Araz, M.; Hepbasli, A.; Shahrestani, M.; Yao, R.; Shao, L.; Essahb, E.; Oliveirac, A.C.; Cañod, T.; Rico, E.; et al. A key review of building integrated photovoltaic (BIPV) systems. Eng. Sci. Technol. Int. J. 2017, 20, 833–858. [Google Scholar] [CrossRef]
  55. Kumar, N.; Sudhakar, K.; Samykano, M. Performance comparison of BAPV and BIPV systems with c-Si, CIS and CdTe photovoltaic technologies under tropical weather conditions. Case Stud. Therm. Eng. 2019, 13, 100374. [Google Scholar] [CrossRef]
  56. Hansen, E.; Bush, R.J. Understanding customer quality requirements—Model and application. Ind. Mark. Manag. 1999, 28, 119–130. [Google Scholar] [CrossRef]
  57. Huang, Y.M. On the general evaluation of customer requirements during conceptual design. J. Mech. Des. 1999, 121, 92–97. [Google Scholar] [CrossRef]
  58. Roder, B.; Heidl, M.J.; Birkhofer, H. Pre-Acquisition Clustering Of Requirements—Helping Customers To Realize What They Want. Des. Harmon. 2013, 7, 407–416. [Google Scholar]
  59. Zhang, C.; Liu, F. Research on method of expression and analysis for customer’s requirements. In Proceedings of the SKG 2009—5th International Conference on Semantics, Knowledge, and Grid, Zhuhai, China, 12–14 October 2009; pp. 454–455. [Google Scholar] [CrossRef]
  60. Koomsap, P. Design by customer: Concept and applications. J. Intell. Manuf. 2013, 24, 295–311. [Google Scholar] [CrossRef]
  61. Stylidis, K.; Rossi, M.; Wickman, C.; Söderberg, R. The Communication Strategies and Customer’s Requirements Definition at the Early Design Stages: An Empirical Study on Italian Luxury Automotive Brands. Procedia CIRP 2016, 50, 553–558. [Google Scholar] [CrossRef] [Green Version]
  62. Sánchez-Pantoja, N.; Vidal, R.; Pastor, M.C. EU-Funded Projects with Actual Implementation of Renewable Energies in Cities. Analysis of Their Concern for Aesthetic Impact. Energies 2021, 14, 1627. [Google Scholar] [CrossRef]
  63. Enabling Framework for the Development of BIPV. Available online: https://iea-pvps.org/research-tasks/enabling-framework-for-the-development-of-bipv/ (accessed on 11 September 2021).
  64. Wall, M.; Probst, M.C.M.; Roecker, C.; Dubois, M.C.; Horvat, M.; Jørgensen, O.B.; Kappel, K. Achieving Solar Energy in Architecture-IEA SHC Task 41. Energy Procedia 2012, 30, 1250–1260. [Google Scholar] [CrossRef] [Green Version]
  65. Odu, G. Weighting methods for multi-criteria decision making technique. J. Appl. Sci. Environ. Manag. 2019, 23, 1449. [Google Scholar] [CrossRef] [Green Version]
  66. van Til, J.; Groothuis-Oudshoorn, C.; Lieferink, M.; Dolan, J.; Goetghebeur, M. Does technique matter; a pilot study exploring weighting techniques for a multi-criteria decision support framework. Cost Eff. Resour. Alloc. 2014, 12, 22. [Google Scholar] [CrossRef] [PubMed] [Green Version]
  67. Manikandan, S. Measures of central tendency: The mean. J. Pharmacol. Pharmacother. 2011, 2, 140–142. [Google Scholar] [CrossRef] [PubMed] [Green Version]
  68. Siwiec, D.; Pacana, A. A Pro-Environmental Method of Sample Size Determination to Predict the Quality Level of Products Considering Current Customers’ Expectations. Sustainability 2021, 13, 5542. [Google Scholar] [CrossRef]
  69. Pačaiová, H.; Sinay, J.; Turisová, R.; Hajduová, Z.; Markulik, Š. Measuring the qualitative factors on copper wire surface. Measurement 2017, 109, 359–365. [Google Scholar] [CrossRef]
  70. Ostasz, G.; Czerwinska, K.; Pacana, A. Quality management of aluminum pistons with the use of quality control points. Manag. Syst. Prod. Eng. 2020, 28, 771–773. [Google Scholar] [CrossRef] [Green Version]
  71. Siderska, J. Analysis of the possibilities of using artificial neural networks to model social capital values in IT companies. Econ. Manag. 2013, 1, 84–97. [Google Scholar]
Figure 1. Simplified scheme of selection of methods to proposed model. Own study.
Energies 14 05977 g001
Figure 2. Model of choosing the most favorable photovoltaic panel—part 1. Own study.
Energies 14 05977 g002
Figure 3. Model of choosing the most favorable photovoltaic panel—part 2. Own study.
Energies 14 05977 g003
Figure 4. Example of questionnaire to obtain customer expectations in relation to photovoltaic panels criteria. Own study.
Energies 14 05977 g004
Figure 5. Relative states scale. Own study, based on [4,47,48,49,50].
Energies 14 05977 g005
Figure 6. Questionnaire with obtained customer expectations about photovoltaic panels criteria. Own study.
Energies 14 05977 g006
Figure 7. Ranking of photovoltaic panels quality level.
Energies 14 05977 g007
Figure 8. Qualitative-cost ranking of photovoltaic panels.
Energies 14 05977 g008
Figure 9. Simplified scheme of the neural network to sensitivity analysis of the proposed model.
Energies 14 05977 g009
Table 1. Characteristics of main criteria of photovoltaic panels. Own study, based on [53,62,63,64].
Technical Criterion with Alternative NameDefinition
rated power (Wp)
(installed power)
determines the value of potential size of electricity obtainable by photovoltaic installation, i.e., disposition energy of devices
short-circuit current (A)
(current at maximum load, Impp)
current flowing at short circuit of cell, i.e., in a moment of maximum load
maximum current (A)
(maximum output current)
current, which can deliver PV to load
idle voltage (V)
(voltage without load or open circuit, Voc)
voltage achieve in situation when module is not connected to any load
maximum voltage (V)
(critical voltage, Vmpp)
voltage in maximum power point (MPP); this voltage is when PV works in Standard Test Conditions (STC)
efficiency (%)efficiency informs how effectively the PV will change power solar radiation into electricity, where the higher the value of this parameter—the better; this value is given by producer
maximum system voltage (VDC)maximum impassable possible voltage, which can be in installation circuit of PV; limits number of PV which can be combined in one chain
maximum power (MPP)the value has maximum power achieved by photocell, this power is available in standard test condition (STC), i.e., solar radiation power 1000 W/m2, spectrum density AM 1,5, cell temperature 25 °C); it is output parameter for most investors by choice of PV
module efficiencyit is a percent of solar energy, which the PV can processed to electricity; efficiency of total module is lower than a single link, because not the entire surface of module process solar energy to electricity; on efficiency of total module has also impact way of linking cells
solar cell efficiencyit is efficiency of a single cell included in module
Table 2. Correlation matrix between customer criteria and technical criteria of photovoltaic panels.
Technical Criteria/Customer CriteriaHigh PowerHigh EfficiencyLong Warranty PeriodAbility to Change
the Setting
High Temperature
Resistance
Availability of Various ShapesColor
Rated power (Wp)X000000
Short-circuit current (A)X0X0XX0
Maximum current (A)XX00000
Idle voltage (V)0X00XX0
Maximum voltage (V)XXX0000
Efficiency (%)XXX0XX0
Maximum system voltage (VDC)XX0X00X
Temperature coefficient of intensity (%/°C)00X0XX0
Temperature coefficient of voltage (%/°C)00X0XX0
Temperature power factor (%/°C)X0X0XX0
Length (mm)XX00000
Width (mm)XX00000
Thickness (mm)XX00000
Weight (kg)0000000
Windshield (mm)00X0XXX
Frame0000000
Type of cellsXXX0XX0
Number of cellsX000000
Kind of cellsXXX0XX0
Kinematics0XXX000
Color000000X
Warranty period00X0000
Table 3. Weights of criteria of photovoltaic panels determined by customer.
Weight/Customer CriteriaHigh PowerHigh EfficiencyLong Warranty
Period
Ability to Change
the Setting
High Temperature ResistanceAvailability
of Various Shapes
Color
Weight determined in points ( p i )302515195510
Weight determined in decimal form ( w i c )0.30.250.150.190.050.050.1
Table 4. Normalized weights of technical criteria of photovoltaic panels.
Technical Criteria/Customer CriteriaHigh PowerHigh EfficiencyLong Warranty PeriodAbility to Change
the Setting
High Temperature
Resistance
Availability of Various ShapesColorAverage from Weights ( w ¯ i t ) Normalized Weight ( w i n )
Rated power (Wp)0.30000000.300.08
Short-circuit current (A)0.300.1500.050.0500.140.04
Maximum current (A)0.30.25000000.180.05
Idle voltage (V)00.25000.050.0500.120.03
Maximum voltage (V)0.30.250.1500000.230.06
Efficiency (%)0.30.250.1500.050.0500.160.04
Maximum system voltage (VDC)0.30.2500.19000.10.210.06
Temperature coefficient of intensity (%/°C)000.1500.050.0500.080.02
Temperature coefficient of voltage (%/°C)000.1500.050.0500.080.02
Temperature power factor (%/°C)0.300.1500.050.0500.140.04
Length (mm)0.30.25000000.280.08
Width (mm)0.30.25000000.280.08
Thickness (mm)0.30.25000000.280.08
Windshield (mm)000.1500.050.050.10.090.02
Type of cells0.30.250.1500.050.0500.160.04
Number of cells0.30000000.300.08
Kind of cells0.30.250.1500.050.0500.160.04
Kinematics00.250.150.190000.200.05
Color0000000.10.100.03
Warranty period000.1500000.150.04
Table 5. Parameters of photovoltaic panels for expected technical criteria.
Technical CriterionP1P2P3P4P5P6P7P8P9P10
Rated power (Wp)325400385181315340370470345365
Short-circuit current (A)9.9910.3111.537.069.9411.6211.4111.5310.5411.43
Maximum current (A)9.579.8110.996.597.5010.8310.8911.019.8610.68
Idle voltage (V)40.9948.7539.383540.638.141.2150.3139.0938.0
Maximum voltage (V)33.9740.8332.9627.533.731.433.9842.6932.6134.2
Efficiency (%)19.4319.7720.720.019.019.419.821.220.519.5
Maximum system voltage (VDC)1500150015001500150015001500150015001500
Temperature coefficient of intensity (%/°C)0.0450.0450.0440.0420.0570.0570.0440.0440.0440.048
Temperature coefficient of voltage (%/°C)−0.276−0.276−0.272−0.323−0.286−0.286−0.272−0.272−0.272−0.270
Temperature power factor (%/°C)−0.360−0.360−0.350−0.460−0.370−0.370−0.354−0.350−0.350−0.350
Length (mm)1665199017691667167217621774212216891776
Width (mm)100510051052994991994105210539961052
Thickness (mm)40403545353536363540
Windshield (mm)3.23.23.12.92.83.22.02.32.12.2
Type of cellsMonoMonoMonoMonoMonoMonoMonoMonoMonoMono
Number of cells667212060120120120144120120
Kind of cellsAAAAAAAAAA
KinematicsYesYesYesYesYesYesYesYesYesYes
ColorBlackWhiteBlackBlackBlackWhiteSilverSilverBlackBlack
Warranty period12121212121212121212
Table 6. Assessment of quality of photovoltaic panels technical criteria in Likert scale.
Technical CriteriaP1P2P3P4P5P6P7P8P9P10
Rated power (Wp)4235443143
Short-circuit current (A)4325422232
Maximum current (A)3342244534
Idle voltage (V)4531424532
Maximum voltage (V)4543444544
Efficiency (%)5423554325
Temperature coefficient of intensity (%/°C)3345114442
Temperature coefficient of voltage (%/°C)4452335555
Temperature power factor (%/°C)4452335555
Length (mm)5235433143
Width (mm)4435553253
Thickness (mm)3352554453
Windshield (mm)2223325454
Number of cells4435333233
Color5155544455
Table 7. Normalized quality of photovoltaic panels criteria.
Technical Criteria
and Kind of Criterion
(D-destimulant, S-simulant)
P1P2P3P4P5P6P7P8P9P10
Rated power (Wp)S0.750.250.501.000.750.750.500.000.750.50
Short-circuit current (A)S0.670.330.001.000.670.000.000.000.330.00
Maximum current (A)D0.670.670.331.001.000.330.330.000.670.33
Idle voltage (V)D0.250.000.501.000.250.750.250.000.500.75
Maximum voltage (V)D0.500.000.501.000.500.500.500.000.500.50
Efficiency (%)S1.000.670.000.331.001.000.670.330.001.00
Temperature coefficient of intensity (%/°C)S0.500.500.751.000.000.000.750.750.750.25
Temperature coefficient of voltage (%/°C)S0.670.671.000.000.330.331.001.001.001.00
Temperature power factor (%/°C)S0.670.671.000.000.330.331.001.001.001.00
Length (mm)S1.000.250.501.000.750.500.500.000.750.50
Width (mm)S0.670.670.331.001.001.000.330.001.000.33
Thickness (mm)S0.330.331.000.001.001.000.670.671.000.33
Windshield (mm)S0.000.000.000.330.330.001.000.671.000.67
Number of cellsS0.670.670.331.000.330.330.330.000.330.33
ColorD0.500.000.501.000.500.500.500.000.500.50
Table 8. Weights of criteria and normalized values of photovoltaic panels quality.
Technical Criteria w n P1P2P3P4P5P6P7P8P9P10
Rated power (Wp)0.080.750.250.501.000.750.750.500.000.750.50
Short-circuit current (A)0.040.670.330.001.000.670.000.000.000.330.00
Maximum current (A)0.050.670.670.331.001.000.330.330.000.670.33
Idle voltage (V)0.030.250.000.501.000.250.750.250.000.500.75
Maximum voltage (V)0.060.500.000.501.000.500.500.500.000.500.50
Efficiency (%)0.041.000.670.000.331.001.000.670.330.001.00
Temperature coefficient of intensity (%/°C)0.020.500.500.751.000.000.000.750.750.750.25
Temperature coefficient of voltage (%/°C)0.020.670.671.000.000.330.331.001.001.001.00
Temperature power factor (%/°C)0.040.670.671.000.000.330.331.001.001.001.00
Length (mm)0.081.000.250.501.000.750.500.500.000.750.50
Width (mm)0.080.670.670.331.001.001.000.330.001.000.33
Thickness (mm)0.080.330.331.000.001.001.000.670.671.000.33
Windshield (mm)0.020.000.000.000.330.330.001.000.671.000.67
Number of cells0.080.670.670.331.000.330.330.330.000.330.33
Color0.030.500.000.501.000.500.500.500.000.500.50
Table 9. Quality of photovoltaic panels.
Technical CriteriaP1P2P3P4P5P6P7P8P9P10
Rated power (Wp)0.060.020.040.080.060.060.040.000.060.04
Short-circuit current (A)0.030.010.000.040.030.000.000.000.010.00
Maximum current (A)0.030.030.020.050.050.020.020.000.030.02
Idle voltage (V)0.010.000.020.030.010.020.010.000.020.02
Maximum voltage (V)0.030.000.030.060.030.030.030.000.030.03
Efficiency (%)0.040.030.000.010.040.040.030.010.000.04
Temperature coefficient of intensity (%/°C)0.010.010.020.020.000.000.020.020.020.01
Temperature coefficient of voltage (%/°C)0.020.020.020.000.010.010.020.020.020.02
Temperature power factor (%/°C)0.030.030.040.000.010.010.040.040.040.04
Length (mm)0.080.020.040.080.060.040.040.000.060.04
Width (mm)0.050.050.030.080.080.080.030.000.080.03
Thickness (mm)0.030.030.080.000.080.080.050.050.080.03
Windshield (mm)0.000.000.000.010.010.000.020.020.020.02
Number of cells0.060.060.030.080.030.030.030.000.030.03
Color0.010.000.010.030.010.010.010.000.010.01
q i 0.480.300.370.580.500.430.390.160.510.37
Ranking4871356927
Table 10. Qualitative-cost analysis for photovoltaic panels.
AKJP1P2P3P4P5P6P7P8P9P10
q i 0.480.300.370.580.500.430.390.160.510.37
q i   ( % ) 47.8329.8736.5257.5850.0843.0838.5515.9650.9137.14
K i   ( ) 120.34124.72143.19118.16135.66140.04160.39161.92124.06131.29
c k i 2.524.183.922.052.713.254.1610.152.443.53
k i 0.950.850.431.000.600.500.030.000.870.70
E i 1.992.851.171.741.201.160.090.001.701.88
d i 0.750.820.570.710.580.570.050.000.710.73
c i 0.940.740.771.000.920.850.740.000.950.82
R t i 0.640.530.480.700.590.530.320.090.640.55
R e i 0.890.780.530.930.680.600.250.010.840.71
R d i 0.770.660.510.820.630.560.280.050.740.63
Ranking2471568935
Table 11. Customer satisfaction from qualitative-cost indicator of photovoltaic panels.
ProductRdRankingDecision
P10.772beneficial
P20.664satisfactory
P30.517moderate
P40.821distinctive
P50.635satisfactory
P60.566moderate
P70.288unfavourable
P80.059bad
P90.743beneficial
P100.635satisfactory
Table 12. Comparison of rankings of quality level and qualitative-cost indicator for photovoltaic panels.
Quality LevelQualitative-Cost Indicator
Product K   ( ) qRankingProduct K   ( ) RdRanking
P4118.160.581P4118.160.821
P9124.060.512P1120.340.772
P5135.660.503P9124.060.743
P1120.340.484P2124.720.664
P6140.040.435P5135.660.635
P7160.390.396P10131.290.635
P3143.190.376P6140.040.566
P10131.290.377P3143.190.517
P2124.720.308P7160.390.288
P8161.920.169P8161.920.059
Table 13. Information about the neural network to sensitivity analysis of the proposed model.
Neural NetworkMLP 17-15-1
Quality (learning)0.973
Quality (testing)0.000
Quality (validation)0.000
Error (learning)0.002
Error (testing)0.000
Error (validation)0.001
Learning algorithmBFGS 8
Error functionSOS
Activation (hidden)Linear
Activation (output)Exponential
Table 14. Results of global sensitivity analysis from neural network MLP 17-15-1.
Variable of Neural NetworkResult
Rated power (Wp)1.412
Short-circuit current (A)1.328
Maximum current (A)1.422
Idle voltage (V)1.111
Maximum voltage (V)1.015
Efficiency (%)0.989
Temperature coefficient of intensity (%/°C)2.507
Temperature coefficient of voltage (%/°C)1.270
Temperature power factor (%/°C)1.319
Length (mm)1.300
Width (mm)1.873
Thickness (mm)1.340
Windshield (mm)1.059
Number of cells1.292
Color1.006
Cost of purchase of photovoltaic panels
Quality of photovoltaic panels
4.880
1.244
Publisher’s Note: MDPI stays neutral with regard to jurisdictional claims in published maps and institutional affiliations.

