Article

Characterization of the Carbonate Formation Fracture System Based on Well Logging Data and Results of Laboratory Measurements

by
Marek Stadtműller
1,*,
Paulina I. Krakowska-Madejska
2,
Grzegorz Leśniak
1 and
Jadwiga A. Jarzyna
2
1
Oil and Gas Institute-National Research Institute, Ul. Lubicz 25A, 31-503 Krakow, Poland
2
Faculty of Geology, Geophysics and Environmental Protection, AGH University of Science and Technology, Al. Mickiewicza 30, 30-059 Krakow, Poland
*
Author to whom correspondence should be addressed.
Energies 2021, 14(19), 6034; https://doi.org/10.3390/en14196034
Submission received: 17 August 2021 / Revised: 17 September 2021 / Accepted: 20 September 2021 / Published: 22 September 2021
(This article belongs to the Special Issue Well Logging Applications)

Abstract

:
This article presents a novel methodology for data integration including laboratory data, the results of standard well logging measurements and interpretation and the interpretation of XRMI imager data for determination of the porosity and permeability of the fracture system in carbonate rock. An example of the results of the micro computed tomography applied for carbonate rock is included. Data were obtained on the area of the Polish Lowland Zechstein Main Dolomite formation. The input set of data included the results of mercury injection porosimetry (MICP), thin section and polished section analysis, well logging measurements and comprehensive interpretation and micro computed tomography. The methodology of the macrofractures’ analysis based on borehole wall imagery as well as estimation of their aperture was described in detail. The petrophysical characteristics of the fracture systems were analyzed as an element of standard interpretation of well logging data along a carbonate formation. The results of permeability determination, with micro-, mezzo- and macrofractures’ presence in the rock taken into consideration, were compared with outcomes of the drill stem tests (DSTs).

1. Introduction

In modern hydrocarbon prospection, completion and exploitation, attention is focused on detailed characterization of reservoir rocks to limit the risk of new areas for effective exploitation and calculation of reserves. The most effective procedures for realizing that goal are novel methods and methodologies of laboratory tests and well logging measurements, processing and interpretation. Scientists and engineers insist on investors making as many modern laboratory experiments and novel logs as possible to extend the knowledge on petrophysical parameters, but they prefer to use standard, verified methods to avoid additional costs. As the economic value is of utmost importance, both old and new methods are being applied together.
Physical flow models of homogeneous media in porous rocks are defined by the ranges of the critical pore throats (pore diameters), which allows determination of four main classes of capacity [1,2,3]: low capacity—when the effective porosity of rocks is in the range of 3.5–10%; medium capacity—10–15%; high capacity—15–20%; and very high capacity—when effective porosity exceeds 20%. According to the presented classification, sealing rocks are characterized by an effective porosity equal to 0.0–3.5%. These criteria are not used when fractured reservoir rocks are considered. In fractured-type reservoirs, the rocks are characterized by an effective porosity equal to 1–2% and are potentially qualified as reservoirs of very low capacity. The porosity/permeability problem in carbonates is different in comparison to clastic rocks. Porous capacity classes, valid for clastic rocks and geological information on the facies of the Zechstein Main Dolomite formation, are shown as a background to underline the difference.
Quantitative analysis of capillary pressure curves from mercury injection porosimetry (MICP) allows determination of the genetic type of intergranular pore–micro-fracture systems. In such an approach, three genetic types of hydrocarbon reservoirs can be determined: porous, porous-fractured and fractured. It is also possible to evaluate the percentage of pores and fractures deciding the hydrocarbons’ migration possibility [4]. The results of macroscopic observations and microscopic laboratory experiments including mercury injection porosimetry allow determination of the character and degree of development of pore–fracture systems, which can be the basis for characterization of rock formation as the reservoir rock.
Fractured reservoirs dominate in carbonates [5,6]. In hydrocarbon prospection, the attention is focused on the characterization of porous/fractured rocks in detail to obtain the best possible tool to calibrate well logs with the use of limited laboratory data. Empirical relations between petrophysical properties—i.e., porosity and permeability from borehole and laboratory data, usable to work in the original borehole—lead to uncertainty in resource calculations when extended to other wells [7,8]. Thus, the main goal for petrophysicists and well log analysts is to include as many novel techniques improving such relations as possible. In Poland, the Polish Lowland Zechstein formations, the Main Dolomite and Zechstein Limestone are the best examples of carbonate reservoir rocks [9]. Fractures of various sizes are the most important porosity components in these carbonates. They are divided into three main groups: microfractures, with a diameter/aperture of <0.01 mm; mezzofractures, with apertures in the range of 0.01–1 mm; and macrofractures, with apertures greater than 1 mm. This paper shows how combination of the imaging well logging method (XRMI log) with older, well-known microscopic techniques of calculating micro- and mezzofractures [10] with the support of mercury injection porosimetry (MICP) allows for characterizing fractured carbonates. An example of using the novel micro computed tomography methodology for fracture mapping and characterization is also presented in the article [11,12].

2. Geological Settings

The Main Dolomite (Ca2) built in the Polish Zechstein Basin as a deep-marine deposit was not considered as the rock prospective rock for hydrocarbons until the discovery of oil accumulations in the carbonate toe of slope sediments in the late 1970s [9], close to the study area. The accurate interpretation made by PGNiG S.A. specialists revealed that the oil-bearing Main Dolomite deposits resulted from subaqueous flows of carbonate clastic rocks. Main Dolomite is considered simultaneously as source and reservoir rock. Integrated geological and geophysical analyses confirmed this solution, and after these discoveries, the Zechstein Main Dolomite was considered the most important hydrocarbon-bearing formation in the Polish Lowland [9,13]. Intensive studies confirmed that the Main Dolomite was developed in several facies related to the depositional environments in the study area (Figure 1).
Rocks of sedimentary textures such as grainstones, mudstones and organogenic sediments constitute the Main Dolomite in the sedimentary environment, representing platform flat, barrier, oolith zone and platform slope facies. In the Grotów Peninsula, the Main Dolomite is mainly built in the carbonate platform sedimentary environment, where the following microfacies were recognized: boundstones—porous-type reservoir with low capacity for gas and very low capacity for oil; mudstones—porous- and pore–fractures-type reservoir with high and medium capacity for gas and very low or low capacity for oil; grainstones—porous-type reservoir with medium capacity for gas and low capacity for oil [4].

3. Methods

Mercury injection porosimetry (MICP) is a laboratory technique that has been successfully used for a long time for the determination of material parameters such as effective porosity, skeletal and bulk density, total pore area, diameter of average capillary and others [16]. Porosity (total and effective) and density (bulk and skeletal) are especially important for understanding the structure of a rock, its pore space configuration and ability to media flow. Mercury does not wet mineral grains and penetrate pores by the capillary phenomenon. The difference between the total porosity (helium method) and the porosity from MICP is the amount of irreducible water—in the MICP experiments, it was forced into the pores by an external pressure that is inversely proportional to the size of the pores.
Thin section and polished section fracture analysis was performed on samples formatted into cubes with an edge length of 4 cm, with thin plates made of markings for slits with an opening below 0.1 mm. Polished sections were tested for porosity and fracture permeability for fractures with an opening greater than 0.1 mm. A statistical approach was used for numerical determination of the porosity and fracture permeability from these measurements. The applied methodology of micro- and mezzofracture analysis was based on solutions published in Russian and Polish [10,17]. Hence, a short explanation of the concepts is included below.
In laboratory conditions, microfractures were tested on thin sections and on polished sections made of particularly cut rock cubes with an edge length of 4 cm, with thin plates made of markings for slits with an opening below 0.1 mm while the polished sections were tested for porosity and fracture permeability for fractures with an opening greater than 0.1 mm. The numerical determination of porosity and fracture permeability, by nature, must be a statistical indication. For statistical calculations, the initial characteristics of the fracture system (directed, vertical, horizontal, random) are necessary to allow the adoption of appropriate constants in the statistical calculations [16].
For polished sections, the amount of porosity and fracture permeability are calculated by treating the observed fractures as smooth ones with the measured length much greater than the opening. The amount of laminar flow (permeability) through such a fracture is described by the Boussinesq equation [5,18]:
q = l b 3 12 μ Δ P Δ L
where q—flow rate of the liquid volume; μ—dynamic viscosity; l—fracture length; b—fracture width; L—flow length; P—pressure.
Equating (1) to the Darcy equation and introducing the average linear fracture density Γ equal to n/L, we obtain the permeability formula for a quasi-isotropic, homogeneous fracture system:
k = ( a × b 3 × Γ ) / 12
where a—indicator resulting from the adoption of appropriate units; n—the number of fractures observed along the section L.
The related fracture and cavern porosity is calculated from the following formula:
p o r o s i t y = c b l s
where s—tested surface of the polished section; c—constant resulting from the selection of units.
Microfracture analysis was performed on thin sections using the random traverse method. This method is based on putting a random segment (length L) on a thin section and counting how many times it crosses microfractures. For such assumptions, a volume density index can be calculated from Equation (4):
Γ l = Π 2 4 L 1 k l   i = 1 k l n i
where kl—number of vision fields put on thin section number l; L—microscope field of view diameter; n—number of crossings of fracture traces with segments kl, each with length L.
By putting this value into porosity Equation (3), we obtain the following:
P o r o s i t y = Π 2 L b l k l i = 1 k l n i
where b—average fracture width for thin section number l.
For permeability, we obtain the following:
k = c Π 2 L b l 3 k l   i = 1 k l n i
where c is a constant value depending on the chosen units [17,19].
The described methodology can be summarized in four steps as regards fracture measurements, processing and calculations:
  • Determining fracture density. A measurement is based on planimetry analysis of a whole sample (number of vision fields must be at least 250) and counting of crossings of microfractures with a chosen arm of cross in the eyepiece (for every vision field separately). A proper magnification level was chosen based on the size of the microfractures. The optimum was around 100–150×. During planimetry analysis, microfractures of a width less than 0.1 mm should not be taken under consideration because they are analyzed during measurements on replicas.
  • Measurement of microscope’s vision field. To perform calculations, we also needed to measure the microscope’s vision field under the magnification we adopted. In order to do so, a thin section with a millimeter standard was used.
  • Measurement of microfracture thickness. In order to estimate a microfracture’s thickness, about 100 measurements need to be performed to obtain the average value of the results. It is essential to know that measuring the thickness of a few large microfractures can result in a great increase in the average thickness. To estimate the microfracture’s thickness, a weighted mean was used.
  • Performing calculations.
Electric imaging log (XRMI™). Halliburton’s X-tended Range Micro Imager tool is a wireline borehole device designed to obtain high-quality electric images of borehole walls [20]. The XRMI™ device registers 125 microresistivity logs around the borehole wall, which is similar to a dipmeter but more advanced. It is used for evaluating structural and stratigraphic features and bedding orientation, delineates thin beds and laminations and improves net-to-gross estimation. It is also a unique tool for secondary porosity (e.g., fractures and vugs) characterization in reservoirs in situ and provides information on electrofacies, which is useful in rock description according to the definition of electrofacies as a set of data with very similar petrophysical parameters extracted from well logging measurements, enabling stratigraphic intervals to be correlated and distinguished from others [21].
Micro computed tomography (micro-CT) is a novel, modern laboratory method of detailed material investigations that, in recent years, has become popular in reservoir rock investigations [22,23]. The results of X-ray micro computed tomography are a good source of information on the shape and tortuosity of pore channels, the porous cross-sectional area and pore connectivity. It is used as a precise method for obtaining 3D images of an investigated rock to build 2D/3D models of the porous rock. The results are also used as the basis for hydrodynamic simulations [11,24].

4. Materials—Data Sources and Analyses

The data used in the research are from the Zechstein Main Dolomite formation Ca2 in the Polish Lowland (Wielkopolska Platform-Gorzów Platform-Grotów Peninsula, Figure 1). The majority of the samples belonged to the dolostone lithology. There were several samples of mudstones and anhydrites, but in the presented analyses, the results from these samples were always treated as outliers. A total number of results from MICP equal to 136 samples from 4 boreholes was used (G-1, G-2, G-5 and G-6). For boreholes G-5 and G-10, the well logging measurements and results of the comprehensive interpretation of mineral composition, porosity, water/hydrocarbon saturation and permeability were also used. In borehole G-10, outcomes from the XRMI™ log from the Main Dolomite depth section were also available. It is worth noting that the G-10 well is situated close to G-5. It can be concluded that the Zechstein orogeny is similar in structure and lithofacies to the G-5 and G-10 well sites.
Sets of cumulative (Figure 2a) and incremental (Figure 2b) pore volume curves (G-5, MICP) characterize the porosity and pore distribution in the rock samples. The curves in Figure 2a illustrate the difference in porosity. The majority of samples in Figure 2b represent the pore–fracture type of reservoir rock. The spikes observed in the plots in Figure 2b in the pore size range of 0.03–1 μm are related to pores and micro-fractures. Spikes of rather small amplitude in the range 60–400 μm represent a relatively small number of fractures of bigger diameter. Lines related to samples of very low porosity (0.34% and 0.84%) (blue curve not visible in Figure 2b due to being covered by orange one) reveal no spikes in the range of small diameters, only in the bigger diameters, which means that fractures are responsible for the porosity of these samples. The set of pairs in the plots in Figure 2 illustrates the ability of MICP to characterize dolostone facies.
Rock samples belong to the carbonate platform sedimentary environment and grainstone facies (in majority). Some samples represent mudstone facies. The total porosity of all samples ranged between 0 and 33.19%. Permeability, which turned to be possible to obtain in the available apparatus, was determined only in a small part of the data set and ranged between 0.001 and 5.866 mD; the lower range of the used permeameter was equal to 0.001 mD. The plot of permeability vs. porosity presented in Figure 3a is based on the full data from the G-1 borehole. Samples revealing permeability equal to the boundary value of the used apparatus (0.001 mD) were not included in the correlation. A low positive correlation was observed, and scattering of points was distinctly visible, resulting in a low determination coefficient (R2 = 0.32). For instance, a relatively high porosity of 15.22% was related to a low permeability of 0.105 mD, and a relatively low porosity of 5.89% was related to a high permeability of 2.155 mD (red points in Figure 3a). Such pictures are typical for samples from the carbonate platform sedimentary environment and are explained by the microporosity of rock on one side and microfracturing on the other.
A similar relation was obtained on the basis of data from the G-6 well (Figure 3b). Here, two separate groups of data are visible. It was observed that in the left group, bulk density (MICP) ranges from 2.42 to 2.84 g/cm3, and in the right one, from 2.1 to 2.62 g/cm3. Only two samples in the right group present a bulk density greater than 2.42 g/cm3. The higher values of effective porosity and permeability in the samples from the G-6 borehole in comparison to data from the G-1 well are related to the oolith zone. G-1 is situated in a platform flat.

4.1. Relations between Petrophysical Parameters from the Whole Data Set

Mutual relations between petrophysical parameters were analyzed in individual boreholes and in the whole data set. Simple statistics for the whole data set were calculated (Table 1). Porosity was measured using both helium (HM) and mercury (MICP) methods. From the HM method, we obtained the total porosity (material density), and from the MICP (bulk and skeletal density)—effective porosity and the parameters of the pore space.
Plots presenting mutual relationships between parameters obtained using all samples regardless of cutting manner confirm that differences are not big.
The relation between the effective porosity from the MICP experiment and the total porosity for data from all boreholes revealed several points off the bisector of the 90° angle (Figure 4a). Two gray points belong to the group representing G-1 perpendicular plugs. Larger values of total porosity than effective porosity from the MICP experiment in the case of plugs cut perpendicularly confirmed the presence of vertical fractures. One blue point represents the result from the undescribed plug from the G-6 borehole. Other results are focused on the bisector. The determination coefficients in data sets from all boreholes range from 0.93 (G-1) to 0.98 (G-2). Similar relationships between effective porosity from the MICP experiment and total porosity for data from the G-5 borehole are presented in Figure 4b, including differentiation into undescribed and parallel cut plugs. The general character of the relationship is similar to those presented in Figure 5a. The porosity range is also similar. The results from the plugs cut from cores in various ways have the same characteristics, which means that data from all boreholes can be processed together.
Both types of porosity—total and effective—from the MICP experiment correlate well with bulk density from the MICP (Figure 5a). Determination coefficients were equal to 0.89 for total porosity and 0.83 for effective porosity from the MICP. Total porosity ranged between 0.4 and 33.19% with an average value equal to 11.08% and a median equal to 10.37%, while the same quantities for effective porosity from the MICP were equal to 0.34–24.50, 10.49 and 10.36%, respectively (Table 1). The similar lowest values in both data sets mean that mercury penetrates almost the same small pores as during total porosity measurement. Higher values in the total porosity data set mean that not all pores and fractures are opened for mercury penetration. Information on porosity and fluid flow can be obtained from the relation between the decimal logarithm of average diameter of capillary (ADC) and the effective porosity from the MICP experiment (Figure 5b). The decimal logarithm of ADC was used because the range of this quantity was large (0.03–49 μm). Selected blue points represent a high percentage of pores of diameter bigger than 1 μm. The positive correlation (R2 = 0.66) between ADC and effective porosity from the MICP experiment shows that the porosity and fluid flow in the discussed data are related to pores connected among themselves, which indicates intergranular and connected fracture porosity. Relationships between various parameters obtained from laboratory experiments were shown to explain differences in the data and confirm that the discussed data from all boreholes can be processed together.

4.2. Laboratory Petrophysical Parameters (MICP) vs. Well Logging Results in G-5 Borehole Data Set

Well logging data in the G-5 borehole comprised measured logs (transit interval time, DT (ms/ft), natural radioactivity, GR (API), bulk density, RHOB (g/cm3), neutron porosity, NPHI (limestone units) and others. Additionally, the results of the comprehensive interpretation of well logs were available: total porosity; PHI (%); volume of minerals constituting the Main Dolomite rock formation, i.e., dolomite; VDOL (dec); anhydrite; VANH (dec) and the total volume of clay minerals—shaliness, VCL (dec). Simple statistics for the selected log data are presented in Table 2.
Mutual relations between the well logging origin data presented in Figure 6 illustrate ranges of variability and distribution of data. The well logging data were divided into three groups according to shaliness value: VCL < 5, 5 < VCL < 10 and VCL > 10%. The volume of shaliness was examined in detail. The range of this quantity in the G-5 borehole, presented in Table 2, is 0–13%. The three classes used in the interpretation present the variability of the parameter and its influence on other parameters. The majority of the well log data belong to the group of very low shaliness (VCL < 5%). These data cover the full range of transit interval time, DT (45–69 μs/ft), and reveal GR from 8 to 58 API. Furthermore, these data cover the full range of total porosity, PHI, bulk density and RHOB (Table 2). It means that great variability of facies is present in the data set. High VCL values are distinctly visible in the GR vs. Dt relation over the main data group. In other plots, high VCL data are placed on the outskirts. The influence of shaliness, VCL, is slightly different from that of simple GR quantity. For instance, in the RHOB vs. DT relation, the highest VCL points (blue ones) are in the central part of the data cloud while the middle ones (gray) are at the positions of the highest DT. It can be interpreted as the influence of fracturing. Shifting of DT to the highest positions is also visible in the PHI vs. DT relation, which can be similarly explained. For the analyses, the available logs and results of the comprehensive interpretation were used. Bulk density, RHOB, porosity, PHI and slowness from the sonic log, DT, are influenced by shaliness. Mutual relations between the used quantities characterize the carbonate rock.

5. Results

The standard interpretation of the petrophysical parameters available in the borehole data set includes PHI log as an effective porosity estimate as well as K as an absolute permeability estimate. The laboratory core data were obtained from different depths. Due to this, the PORO values for PHI and PERM values for K were selected from the results of well logging interpretation at depths as close as possible to the depths at which samples were obtained, separately for micro- and mezzofractures.
The fracture porosity and fracture permeability obtained from the thin section analyses of micro- and mezzofractures and the porosity (PORO) and permeability (PERM) from the well logging interpretation in the boreholes G-1, G-2, G-5 and G-6 in the study area are presented in Table 3. These results were the basis for further analyses of the data set.

5.1. Analysis of Data Set

Analysis of the data was performed on the basis of three fundamental assumptions related to the fracture systems in orogeny: the first assumption was the presence of three independent fracture systems, namely micro-, mezzo- and macrofractures, with various/defined aperture sizes; the second was the summation of the influences of the parameters of individual systems on the petrophysical characteristics of rock; and the third assumption was related to the porosities of the laboratory-determined fractures, which were treated as relative values and named Micro- or Mezzofracture_porosity Indexes, which are equal to the values included in Table 3. These quantities enable calculation of the independent components of the respective types of fractures when the interpreter is able to use PHI (PORO) as the porosity estimation of rock.
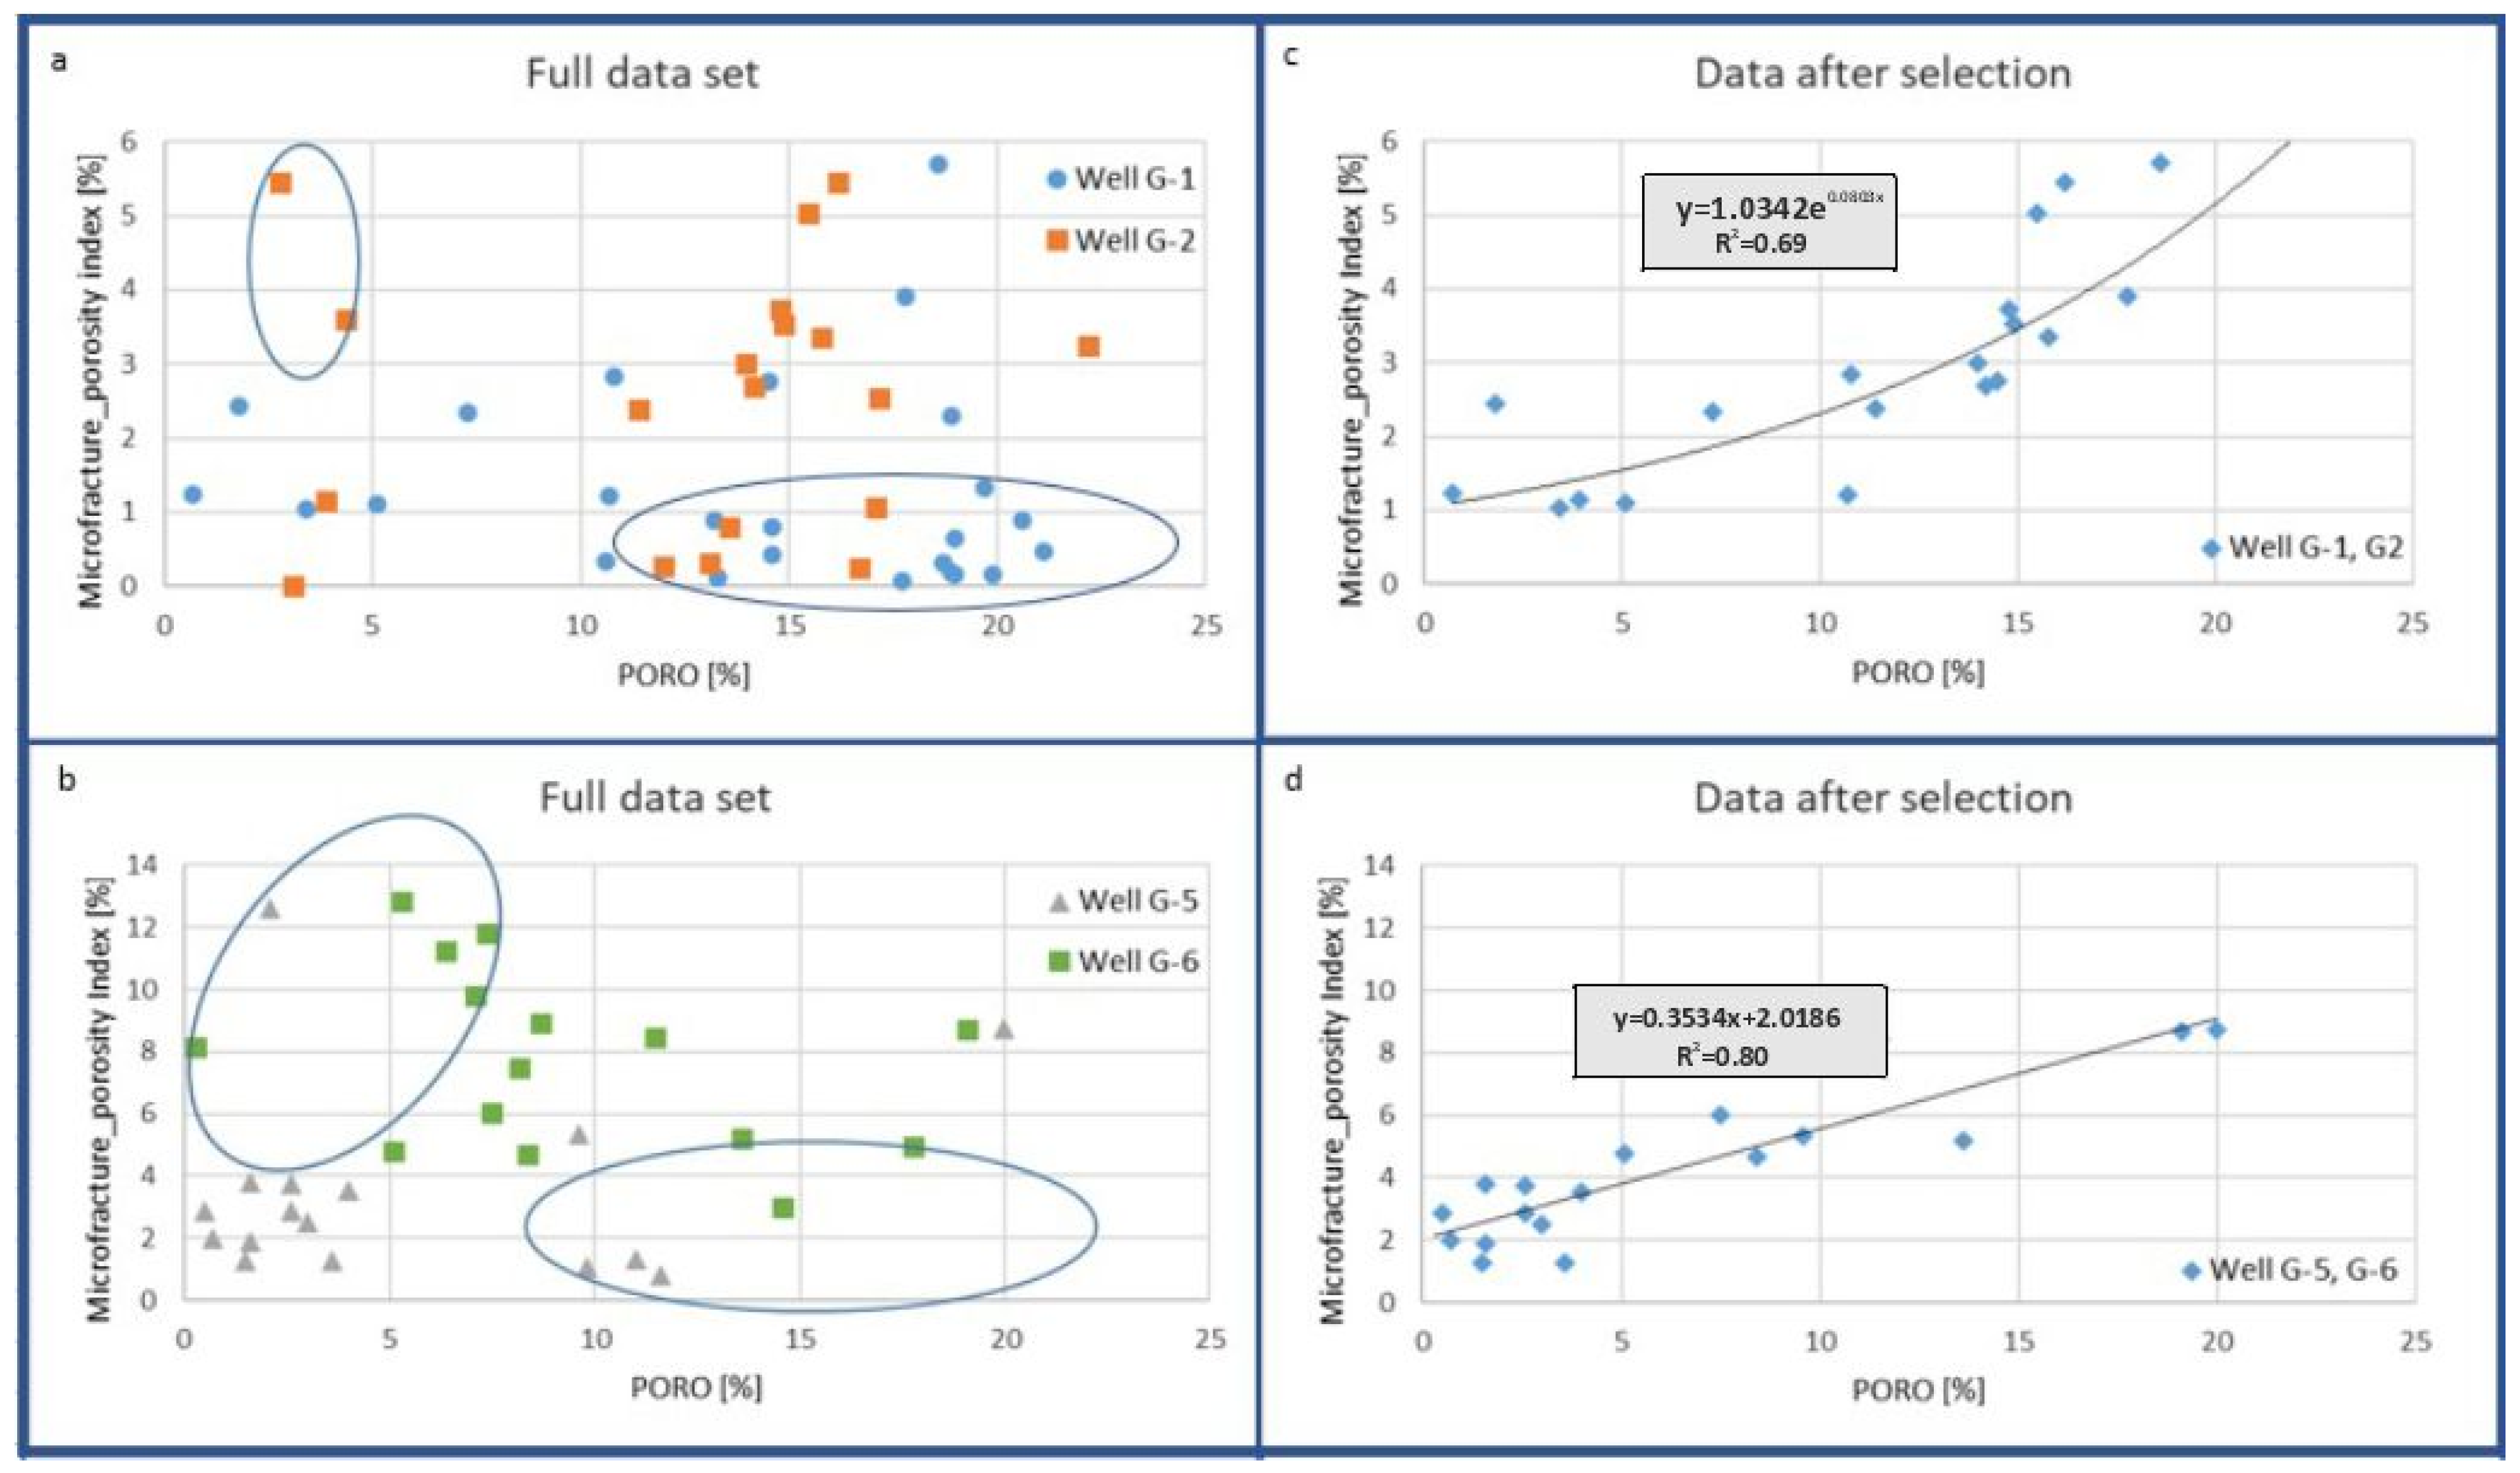
Microfracture_porosity Index and Mezzofracture_porosity Index are the quantities defined for scaling the fracture permeability of the analyzed rocks compared with the porosity interpreted from well logging. The results are presented in the series of plots illustrating Microfracture_porosity Index vs. PORO (Figure 7) and Mezzofracture_porosity Index vs. PORO (Figure 8). In each series, the first two plots illustrate the relation between Micro-/Mezzofracture_porosity Index vs. PORO for the full data sets from the considered boreholes. The next two plots illustrate the similar relations for the selected data sets. Selection was performed on the basis of the following statements: in all plots, we can observe the characteristic arrangement of the data and the division into three subareas marked in plots with ovals:
  • PORO > ~10% and Microfracture porosity Index < ~1%;
  • PORO < ~5% and Microfracture porosity Index > ~3%;
  • The rest of the data.
The two first classes, according to the authors’ assumptions, are responsible for the caverns and not connected voids in the rock and not numerous micro- and mezzofractures of high permeability. They are not the essential part of the rock total pore space, and consequently, they do not decide the fluid filtration rock ability. The estimated total volume of porosity represented by these two classes does not exceed 0.5% of the effective rock porosity calculated during well logging data interpretation. This estimation was made based on the number of laboratory points in each class. This assumption allowed for omitting these classes of data in the further quantitative analyses.
The Microfracture_porosity Index in the data set from the G-1 and G-2 boreholes covered the range 0–6%, and that in G-5 and G-6 covered 0–14%. After selection, the range in the G-1 and G-2 group was still the same (Figure 7a,b), but in the G-5 and G-6 group of data, it decreased to 10% (Figure 7d). The relationships between Microfracture_porosity Index and PORO presented in the plots in Figure 7c,d were used in quantitative analyses. High determination coefficients mean that the equations present credible relations.
The Mezzofracture_porosity Index ranged from 0 to 1.2% in boreholes G-1 and G-2 and from 0 to 2.5% in G-5 and G-6. In both cases, the Mezzofracture_porosity Indexes revealed order of magnitude lower values in comparison to the Microfracture_porosity Index relation. Similar to Microfracture_porosity Index vs. PORO, ranges were higher in G-5 and G-6 in comparison to G-1 and G-2. The boreholes are located in different facies: G-1 and G-2 in the platform flat, G-5 in the barrier and G-6 in the oolith zone (Figure 1b). Lithofacies analysis showed that the majority of data represent grainstones. Correlation equations obtained on the basis of data after selection were used in the further analyses to calculate microfracture and mezzofracture porosities.

5.2. Fracture Permeability Analysis

5.2.1. Micro- and Mezzofracture Permeability Analysis

The relation between microfracture permeability and Microfracture_porosity Index determined on the basis of data from boreholes G-5 and G-6 is characterized by a very high correlation coefficient as the result of tight mathematical relations between these quantities. In the further analysis, we used only the following equation: microfracture permeability = 1.385*Microfracture_porosity Index. The relation between mezzofracture permeability and Mezzofracture_porosity Index in the same boreholes (Figure 9) was characterized by a high determination coefficient of R2 = 0.76. Points scattering illustrated the difficulties in depth matching between thin sections and well logging interpretation results.

5.2.2. Matrix Permeability Analysis

Parameters characterizing the matrix of dolostone in the study were obtained from well logging interpretation and mercury injection porosimetry (MICP). The rock matrix porosity was calculated as an odd between PHI and the sum of all fracture systems’ porosity (micro, mezzo, macro), obtained using the described methodology. The relation between permeability and porosity from laboratory measurements in the G-6 borehole (Figure 3b) enabled calculation of equations for Permeability vs. Effective porosity_MICP for the two identified groups of data (Figure 10). The equation in blue (part II) was used in the further analyses for matrix porosity estimation.

5.3. Fracture System Evaluation from Well Logs

Fracture system determination from well logging has been the subject of intensive investigations for many years [5]. On the basis of the comprehensive interpretation of well logs, the difference between porosity from the neutron and sonic logs enables calculating the secondary porosity index, SPI, which numerically presents the part of porosity related to fractures [25]. Qualitative analysis of the well logs’ anomalies enabled determination of the complex fracture analysis (CFA) methodology [26,27]. Novel well logging devices, i.e., electric and acoustic imagers, enable direct analysis of fractures and their arrangements in the orogeny. They are especially useful in the analysis of macrofractures, which is hard or even impossible to perform using laboratory methods. At present, for field well logging measurements ordered by the hydrocarbon industry in Poland, the electric imager XRMITM (Halliburton) is commonly used instead of the previously popular acoustic imager (Halliburton).

5.3.1. Macrofracture Analysis from Electric Imager

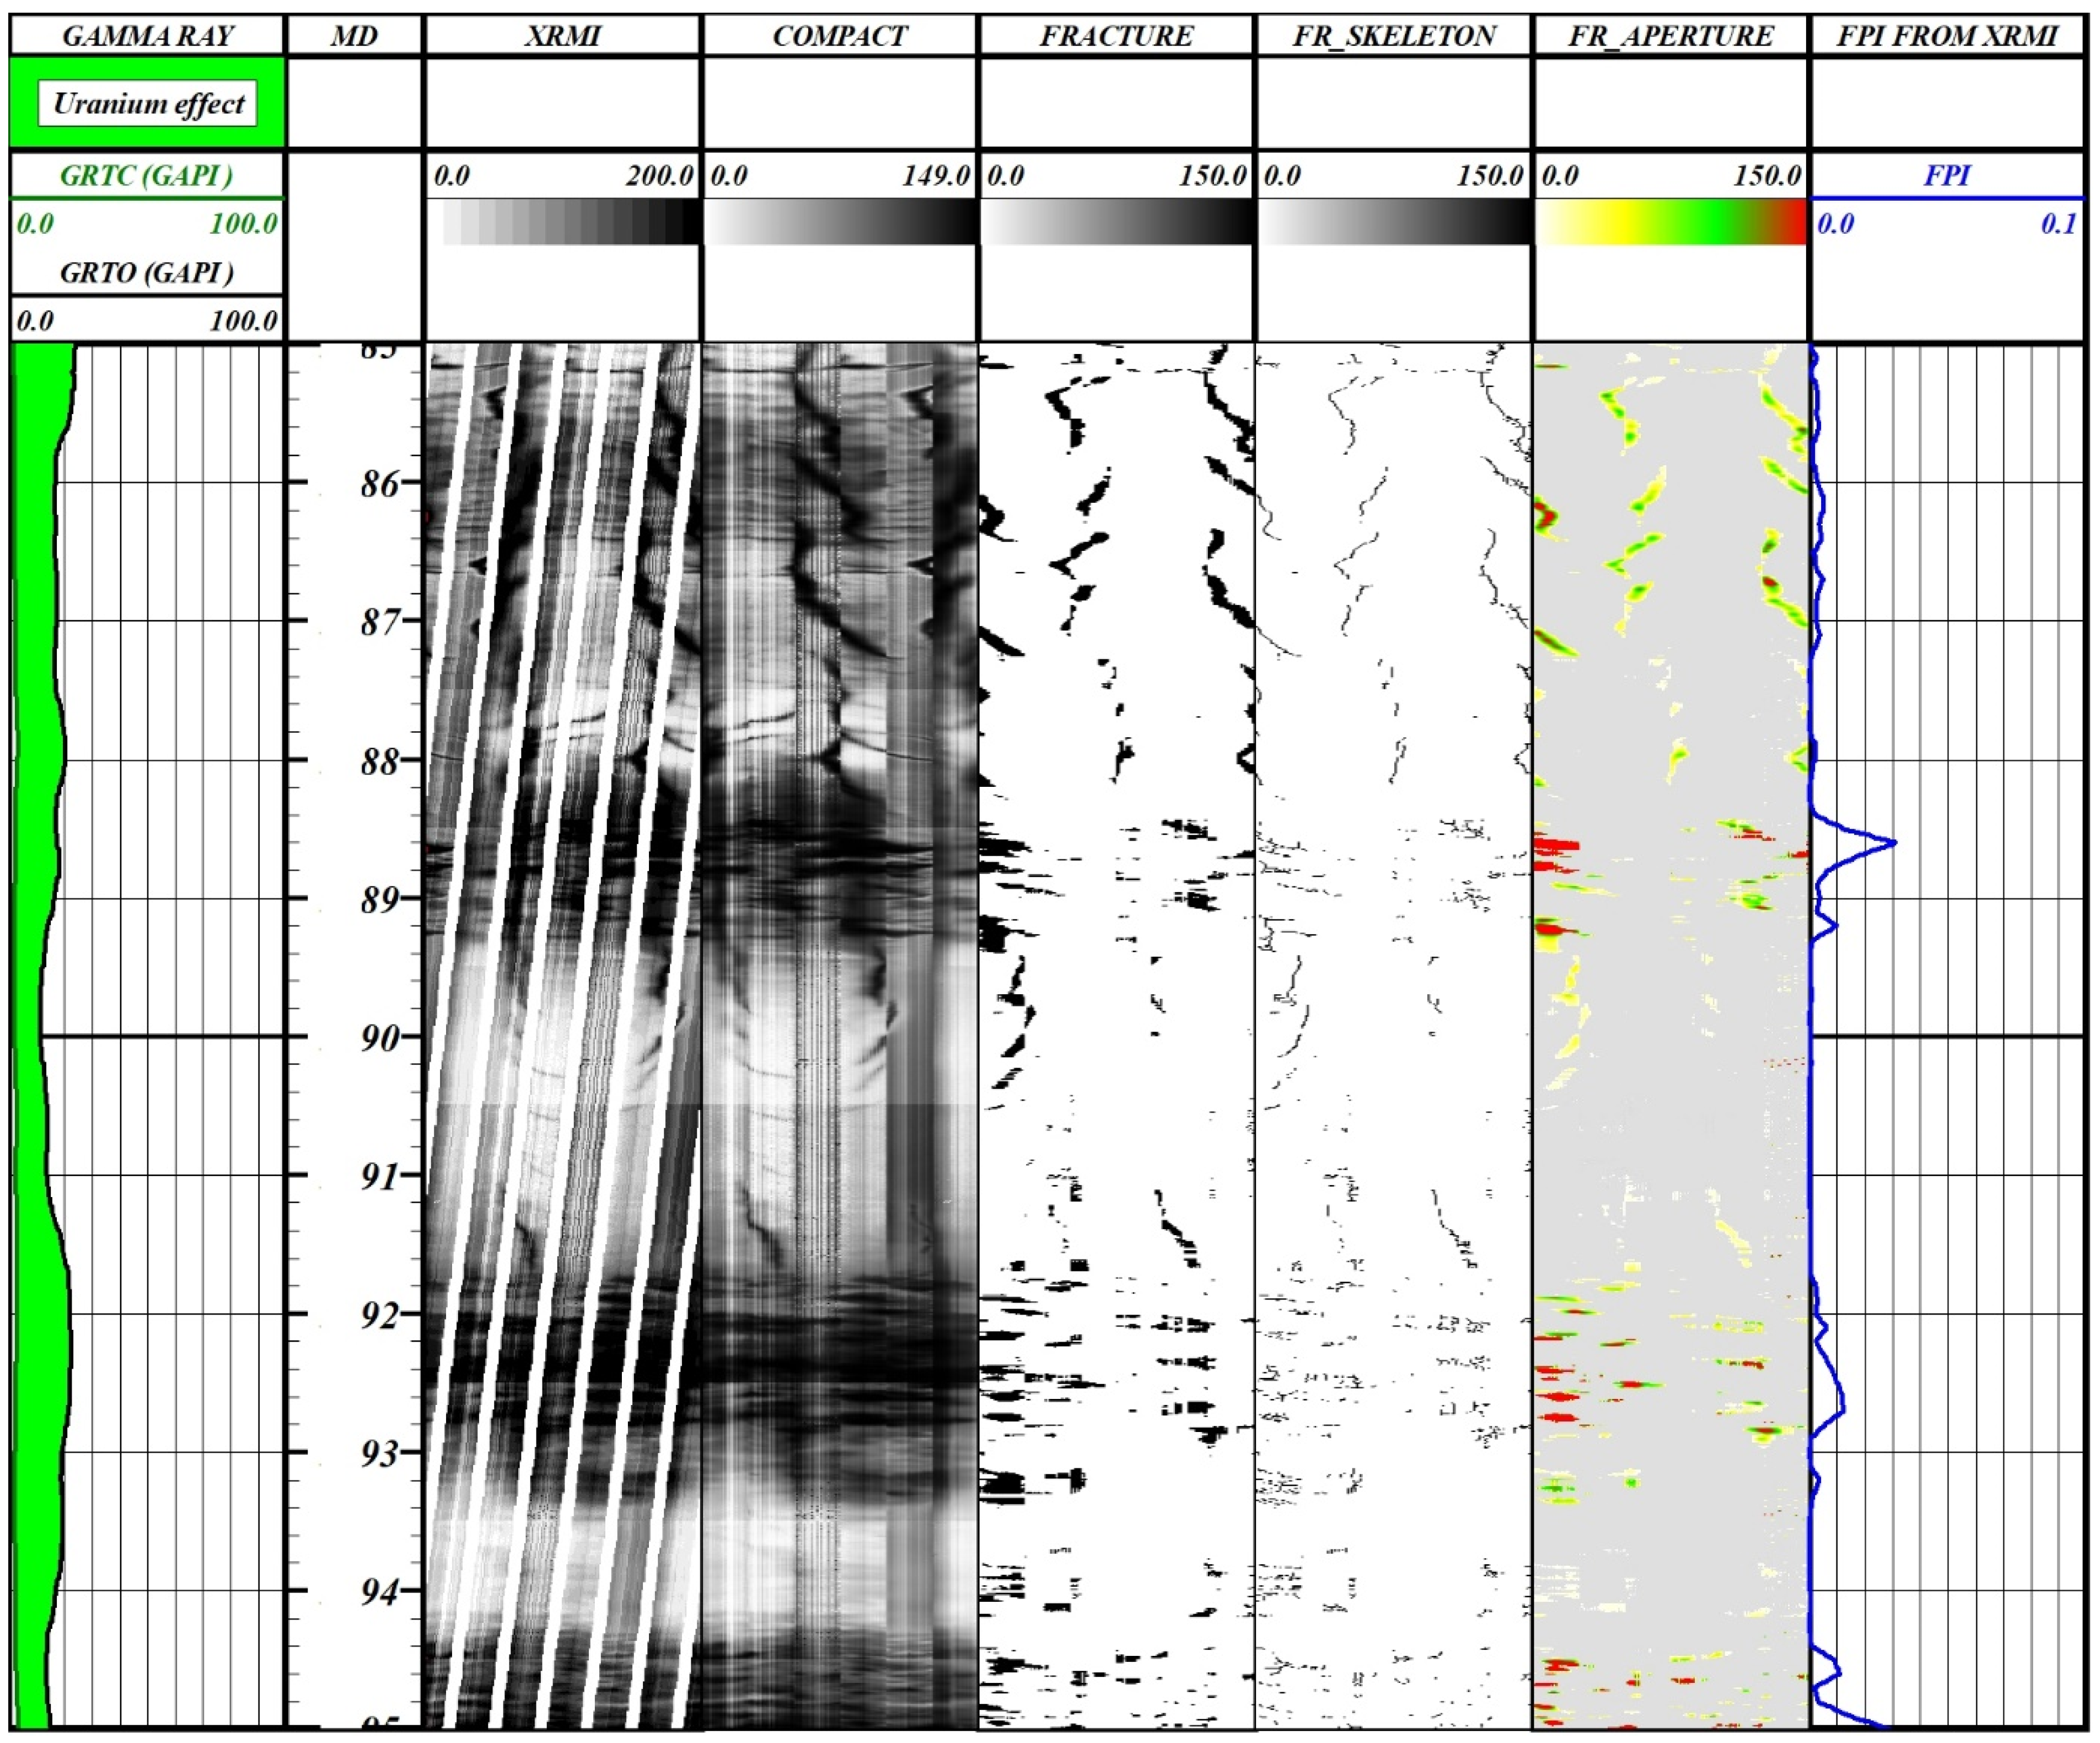
Based on the fundamental paper of Luthi and Suihaite from 1990 [28] considering the fracture analysis and aperture calculation, the automatic procedure in the domestic system of the processing and interpretation of well logs ProGeo [27,29] was elaborated and implemented. The procedure consists of the following steps:
-
Canceling of the breaks between pad registration to obtain homogeneous vector data and vector curves COMPACT;
-
Fracture tracing using the filtration and skeletonization procedures to obtain vector curves FRACTURE and FR_SKELETON;
-
Calculating the aperture of recognized fractures to obtain vector curves FR_APERTURE.
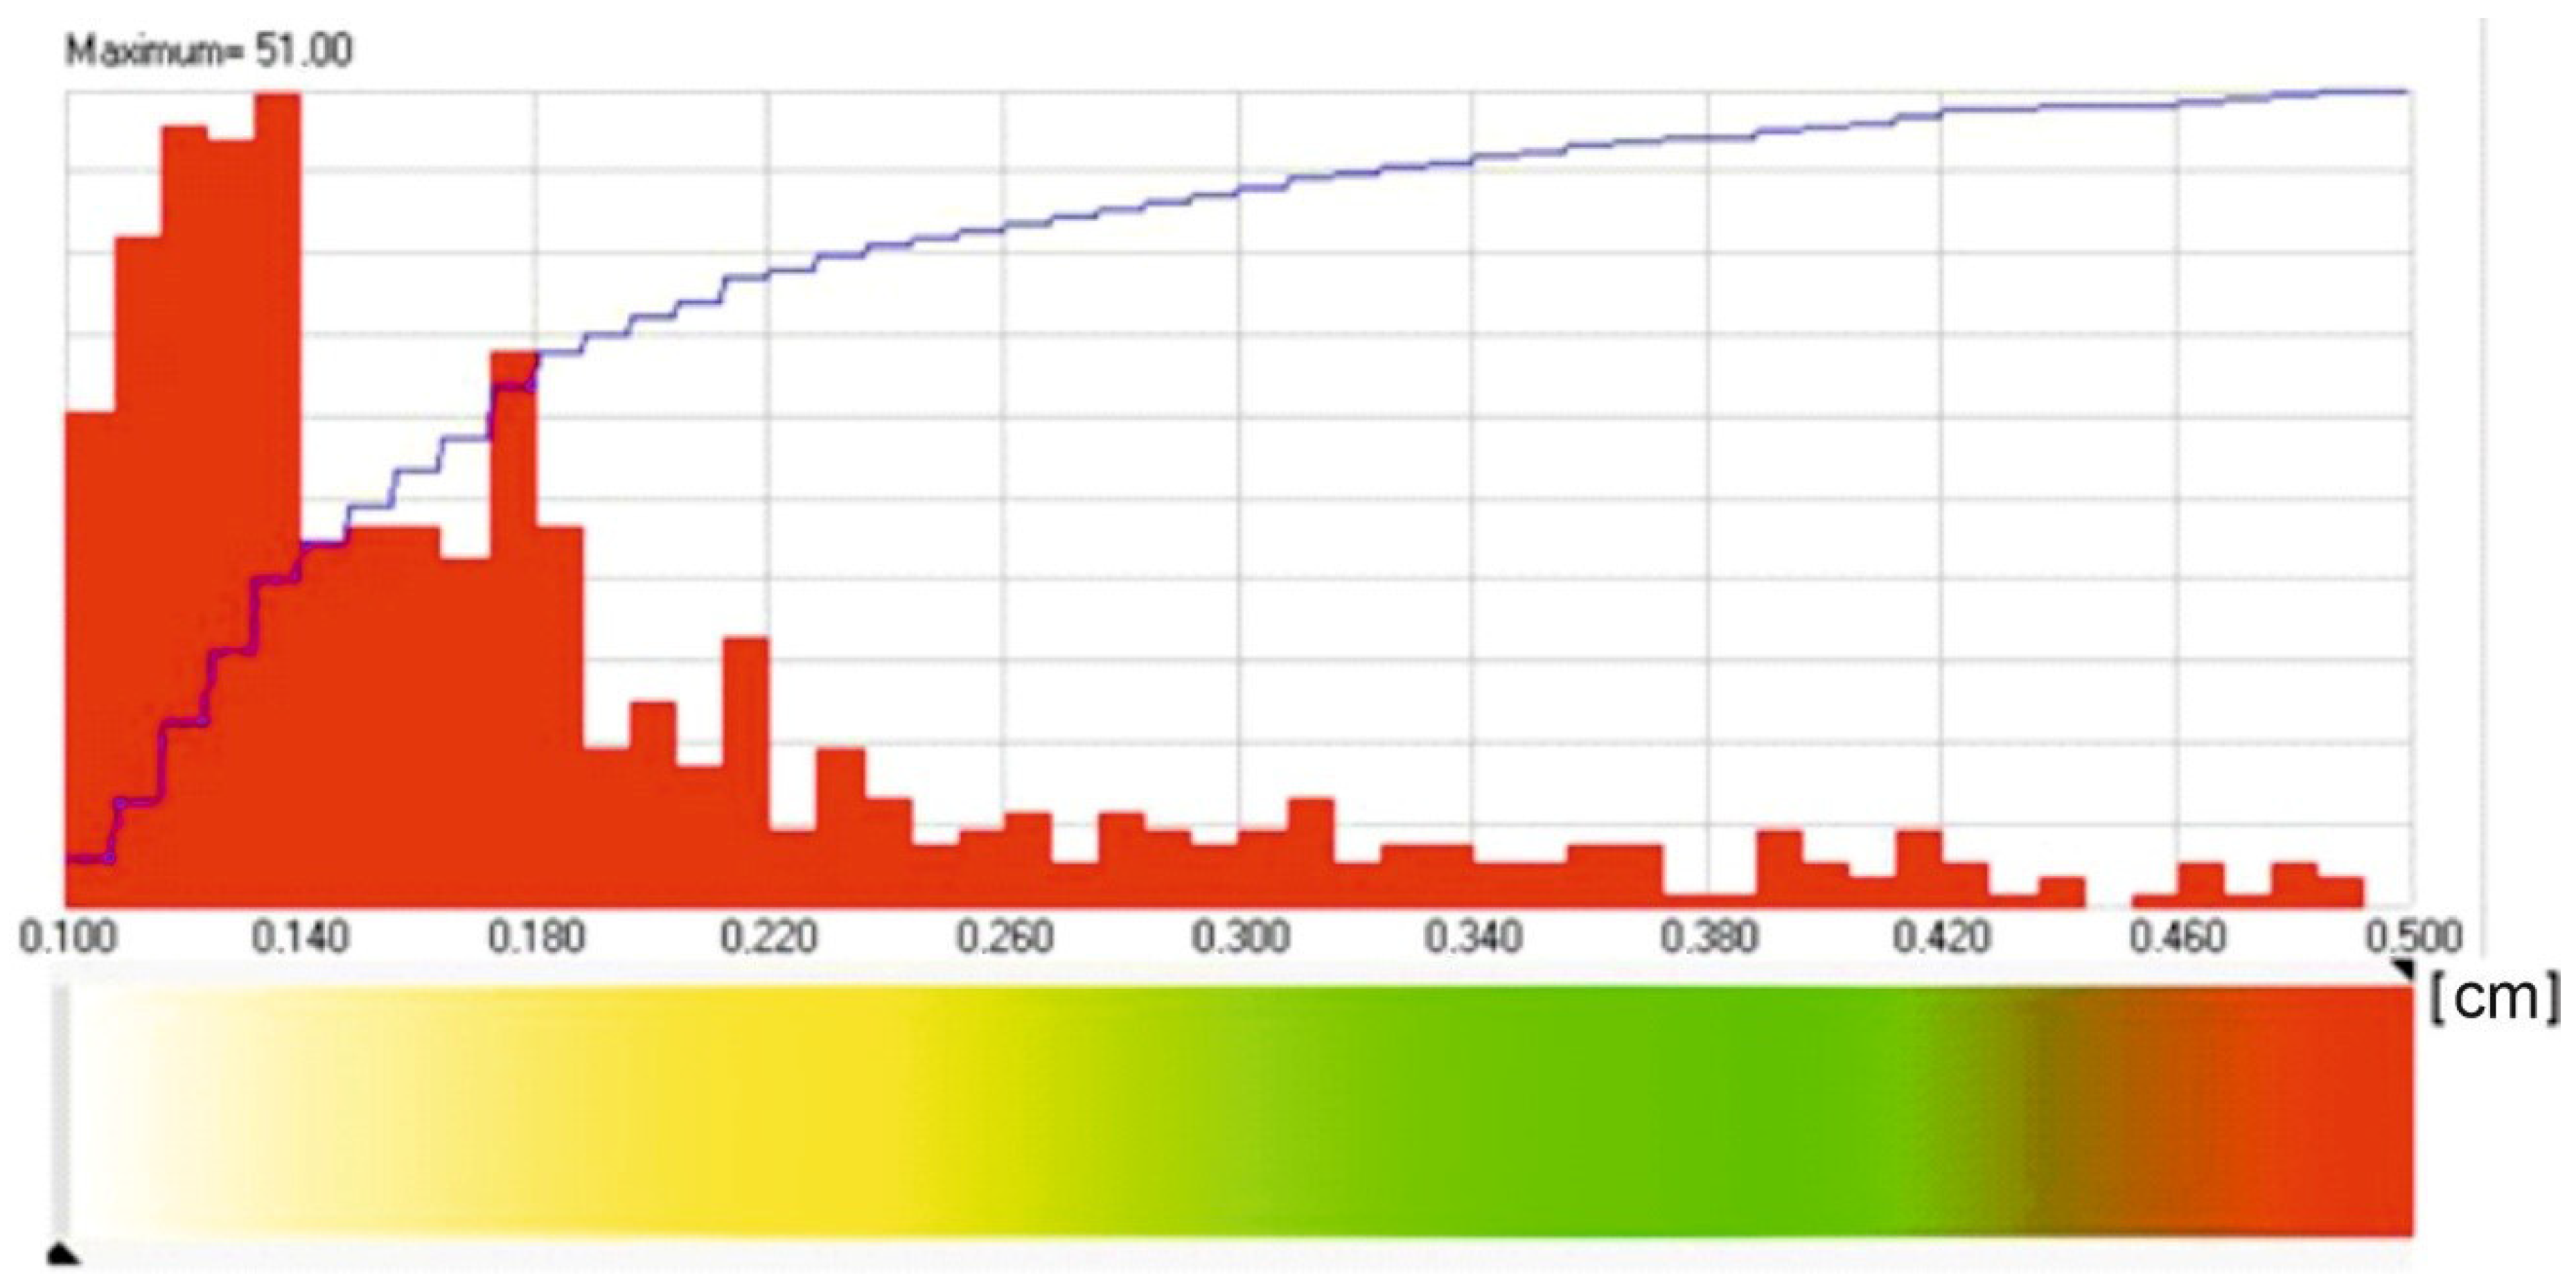
The results of the abovementioned procedure in the ProGeo system including Fracture Porosity Index (FPI) are presented in Figure 11. The FPI is defined as the ratio of the surface occupied by the traced fractures to the total surface of the analyzed borehole wall. The FPI values in the presented sample are in the range of 0–0.03. A histogram of the estimated fractures is presented in Figure 12 together with colors related to the aperture values. It is worth noting that 90% of the apertures range from 1 to 3.4 mm, and the maximal value is equal to 5 mm. This maximal value is probably related to a cavern or vug.

5.3.2. Fracture Porosity and Permeability Calculation (Well G-10)

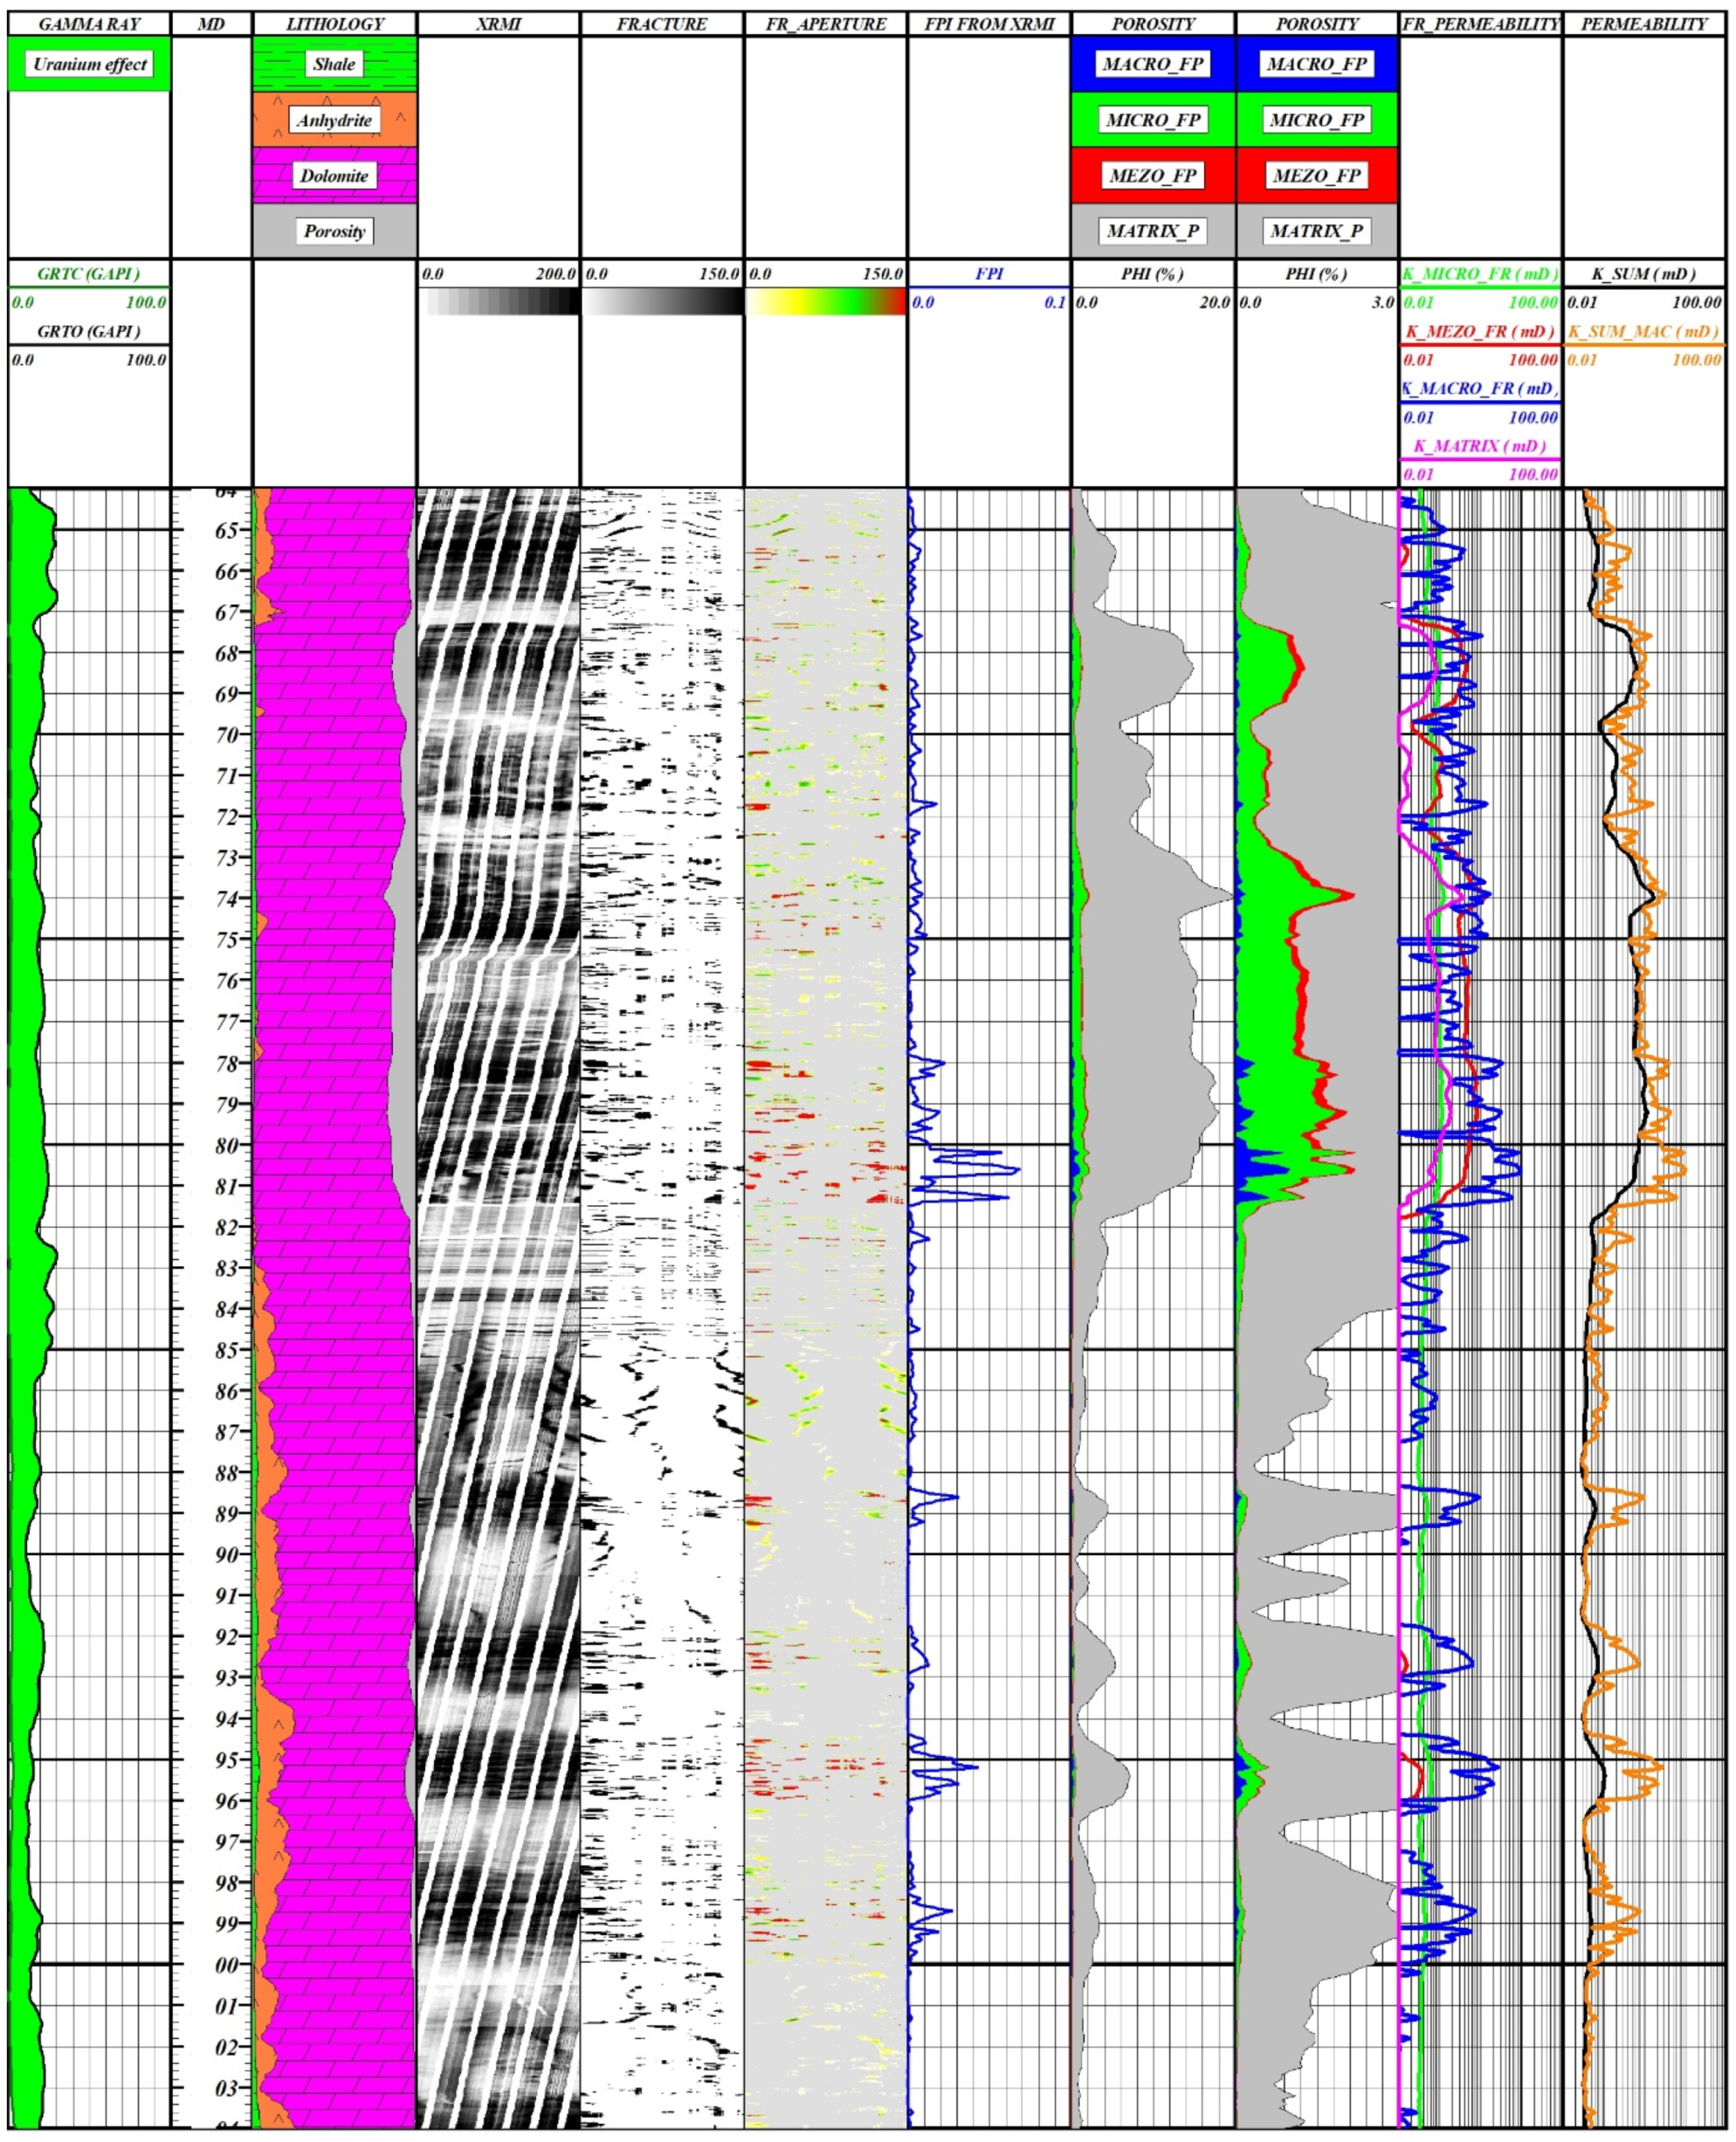
The presented approach, combining the results of laboratory measurements and the measurements and interpretation results of well logs, enabled the calculation of relevant correlations between rock porosity and fracture porosity and permeability. These relations were used in the analysis of the parameters along the Main Dolomite section of 40 m thickness in the G-10 borehole. Estimation of the permeability of macrofractures was also possible and conducted. This parameter was not estimated in a laboratory investigation due to the impossibility of coring the intensely fractured sections of carbonate profile. The interpretation procedure consisted of the following steps:
  • Microfracture porosity calculation according to Equations (7) and (8) (Figure 7d)
    M i c r o f r a c t u r e   p o r o s i t y   I n d e x = 0.3534 P H I + 2.0186
    MICRO_FP = (Microfracture porosity Index/100) ∗ PHI
  • Mezzofracture porosity calculation according to Equations (9) and (10) (Figure 8d)
    M e z z o f r a c t u r e   p o r o s i t y   I n d e x = 0.065 P H I + 0.0899
    MEZZO_FP = (Mezzofracture porosity Index/100) ∗ PHI [%]
  • Macrofracture porosity calculation according to Equation (11)
    MACRO _ FP = FPI PHI   [ % ]
  • Matrix porosity calculation according to Equation (12)
    MATRIX_P = PHI − (MICRO_FP + MEZO_FP + MACRO_FP [%]
  • Microfracture permeability calculation according to Equation (13)
    K_MICRO_FR = 1.385 ∗ MICRO_FP [mD]
  • Mezzofracture permeability calculation according to Equation (14) (Figure 9)
    K_MEZO_FP = 119.22 ∗ MEZO_FP1.7756 [mD]
  • Matrix permeability calculation according to Equation (15) (Figure 10)
    LOG (K_MATRIX) = 0.0854 ∗ PHI − 2.2373
  • Rock permeability without macrofractures calculation according to Equation (16)
    K_SUM = K_MICRO_FR + K_MEZO_FR + K_MATRIX [mD]
  • Macrofracture permeability calculation according to Equation (17)
    K_MACRO_FR = MACRO_FP ∗ K_MACRO [mD]
The quantity K_MACRO was previously unknown and was adopted assuming that the total permeability K_SUM_MAC should be in agreement with the result of standard permeability interpretation from well logs. Calculations were conducted in the software loop and repeated multiple times. The final macrofracture permeability value was equal to 985 mD. This value is, in all likelihood, the result of fractures of great apertures, higher than 1 mm.
  • Total permeability calculation according to Equation (18)
    K_SUM_MAC = K_SUM + K_MACRO_FR [mD]
The obtained results are presented in Figure 13. The basic statistics of the results are included in Table 4 and Table 5.

5.4. Discussion of the Results

The results of the petrophysical parameters of the G-10 well profile analysis confirmed in full the convergence between the newly presented interpretation of micro-, mezzo- and macrofractures and both laboratory data and all available geological information regarding the G-10 well.
However, the analysis of the conducted DST (drill stem test) results showed a difference in permeability: 0.13 (DST) and 0.51 mD (means obtained for the analyzed depth section using the proposed methodology) (Table 5).
Considering the fact that the entire Main Dolomite formation Ca2 permeability results from the presence of fractures, and the matrix permeability is an order of magnitude smaller and hence negligible, the difference occurring can be explained by the destruction of the filtering properties of the rock during the well boring process and drilling mud influence on the borehole wall and flushed zone. This would be especially relevant for macrofracture systems, where permeability has crucial importance for the total permeability of the analyzed rock.

6. Microtomography Exploration of Limestone Lithology Sample

After considering the carbonate fracture systems, the results of microtomography exploration of a limestone sample are presented. This paragraph shows the ability of the authors to make sophisticated measurements, apply specialist software dedicated to obtaining a large range of parameters that cannot be determined from standard methods as well as the proposed methodology and extend the knowledge on fractured carbonate reservoirs.
Microtomography images were acquired at the AGH UST Faculty of Physics and Applied Computer Sciences by Nanotom S (General Electric Co., Fairfield, CT, USA). The resolution of the images was 0.6 × 0.6 × 0.6 µm3 (volume of 1 voxel). Segmentation was performed by threshold method using a single threshold value selected by the interpreter. Comparison of the total porosity values from the CT with the results from other laboratory techniques was helpful in threshold value adoption. Interpretation of the CT images was performed using the poROSE computer program, developed at the AGH UST, FGGEP, Department of Geophysics [12,24].
An Upper Devonian age clay limestone plug from a depth equal to 4264 m was obtained from a D-2 well situated in the Pomeranian Synclinorium. It is older and located deeper in comparison to the discussed Main Dolomite samples. The mineral composition (from XRD measurement) parameters obtained from the MICP and nuclear magnetic resonance (NMR) experiment together with porosity from the micro computed tomography and P- and S-wave velocity ratio are presented in Table 6.
The bulk density (D) and the skeletal density (SD) from the MICP are very close (Table 6). The effective porosity from the MICP (P) is very low at 0.0637%. The effective porosity from the NMR experiment, Kpef_nmr = 0.11%, is higher but is distinctly lower than the NMR total porosity of Kp_nmr = 0.58% and the micro computed tomography porosity of Kp_μ CT = 0.40%, which are close to one another. The differences in values result from the different physical basis of the experiments. The lowest value of porosity from the MICP shows that mercury particles do not penetrate small parts of pore space. The close values of volume of irreducible water (Kp1) and volume of bound water (Sw_nmr) confirm the presence of clay minerals (17.6%) in the limestone sample. Furthermore, the Vp/Vs ratio (1.95) being higher than that for clean limestone [30] confirms the shaliness.
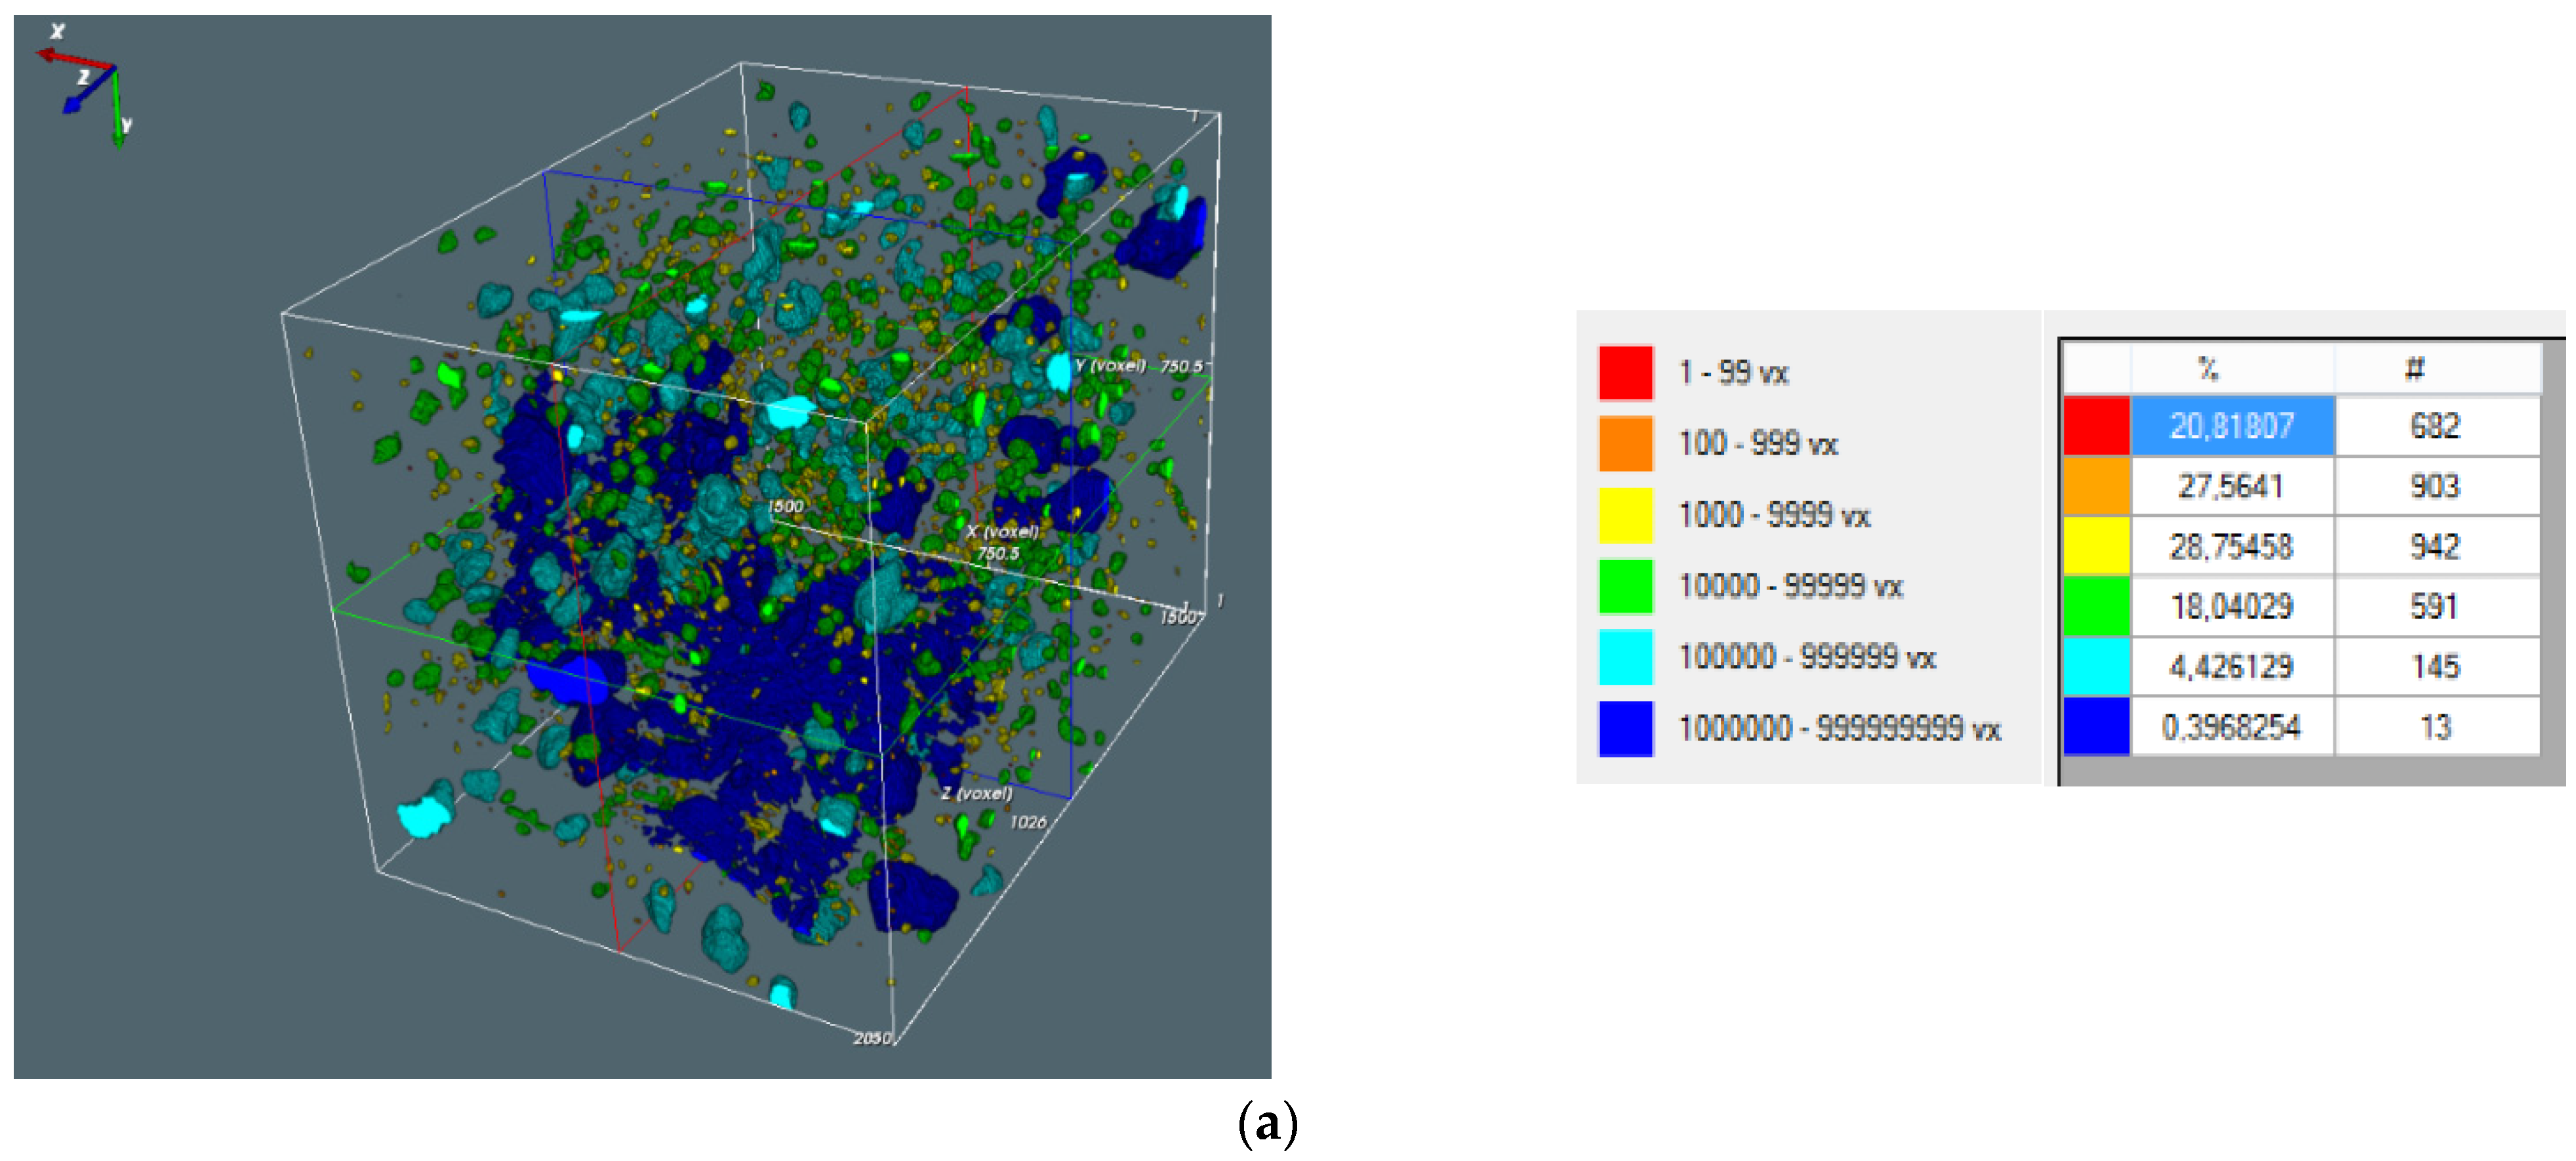
The three subfigures below (Figure 14a–c) present 3D micro-CT images. The first one illustrates an image of a full sample in the Y-Z plane, and the next two are visualizations of the fracture in two projections: Y-Z and X-Z.
Fracture is a characteristic object distinguished in the sample. It was characterized on the basis of parameters calculated using the poROSE program. Fracture occupied only 0.3968% of the sample. The fracture volume constituted 13.89% of the volume of the 3276 porous objects selected in the sample under the micro-CT/poROSE analyses. The effective porosity was small, equal to 0.002933 (fraction). Ellipsoid centers are located on the image in the positions X = 830, Y = 890 and Z = 1616 and show an elongated fracture shape along the Z-axis. Anisotropy, defined as determining deviation of the shape of the object from the sphere equal to 0.74 (unitless), confirms the elongated shape. The bigger value of the parameter describing the shape of the object ShapeVa3D, equal to 1683 (unitless)—based on volume, defined as the number of voxels assigned to the given object, and surface area, defined as the number of voxels on the object that are immediately adjacent to the environment—in comparison to ShapeVa3D Mesh, equal to 806 (unitless)—calculated on the basis of the surface mesh area (the surface area calculated on the basis of a multi-angle grid) and enclosed volume, defined as the volume limited by the surface mesh area—shows that the structure of the fracture is very complicated. The presented example illustrates the power of micro computed tomography, which reveals sophisticated parameters helpful in fracture characterization. A strong point of micro-CT is that it requires a small plug for investigations, but its weak point is related to the difficulty in up-scaling the results, especially in heterogeneous rocks. The presented results illustrate how effective microtomography is in carbonate fracture characterization.

7. Conclusions

Regional and local geological knowledge and the experience of interpreters are important factors influencing carbonate rock fracture porosity and permeability determination. Standard logs and laboratory measurements (including all archive data) are still useful in the interpretation process to obtain the trends of changes and general information of petrophysical parameters. Mercury injection porosimetry, MICP, is a powerful technique for characterizing the reservoir potential of carbonate rocks. The density and effective porosity parameters from MICP are credible and useful and may be the basis for calculating regressions. Standard laboratory permeability meters provide important data. They are helpful in the determination of basic matrix permeability vs. porosity relations. Similarly, the basic information about fracture porosity from neutron and sonic logs can be used. Thin section laboratory measurements of micro- and mezzofractures and the applied calculation methodology enable extension of the level of knowledge about reservoir rocks. Combining this information with the novel data from the electric imaging log provides key information for precise calculation of fracturing porosity and permeability. Joint information from well logging and laboratory experiments enables up-scaling and extension of the detailed point laboratory data along a borehole axis in a continuous way. Micro-CT imaging provides very extensive information which cannot be obtained from other sources. The MICP and CT data in connection with well log analysis allow for describing the porous space of the analyzed rocks as a set of microcaverns/singular large pores (microvugs) and large micropore systems as well as microfractures, which are responsible for the retention properties. The studied rocks can be defined as classic reservoir rocks with dual porosity–dual permeability parameters. The effective porosity partaking in the transportation is mostly based on the microcaverns. The observations made while studying the CT results show that sections of the microcaverns are either isolated or connected only via narrow canals, which makes them not connected to the main paths of the flow. The filtering properties are dominated by microfractures. The media flow paths consist of two stages—the first is the micropores and pores (microcaverns), which deliver media to microfractures, and the second is transportation of the medium to a well by fracture.

Author Contributions

Conceptualization, M.S. and J.A.J.; formal analysis, investigation and methodology, M.S., J.A.J., G.L. and P.I.K.-M.; writing—original draft preparation, J.A.J., M.S., G.L. and P.I.K.-M.; writing—review and editing, J.A.J. and M.S.; visualization, M.S., J.A.J. and P.I.K.-M.; supervision, J.A.J. All authors have read and agreed to the published version of the manuscript.

Funding

This article was financially supported by the Marek Stadtműller Ph.D. funds and by the second edition of the program of the Polish Minister of Science and Higher Education, entitled “Implementation Doctorate” no. 0033/DW/2018/02/4 of 22 January 2019.

Institutional Review Board Statement

Not applicable.

Informed Consent Statement

Not applicable.

Data Availability Statement

Archive of PGNiG S.A., Warsaw, Poland; archive of Oil and Gas Institute-National Research Institute, Krakow, Poland.

Acknowledgments

The authors express their thanks to the Polish Oil and Gas Company, PGNiG S.A., Warsaw, Poland, for granting permission for the use of geological and well logging information in the preparation of this article. Data were also allowed for investigations in the Marek Stadtműller Ph.D. trial.

Conflicts of Interest

The authors declare no conflict of interest.

References

  1. Perrodon, A. Dynamics of Oil and Gas Accumulations; Elf Aquitaine: Pau, France, 1983; ISBN 2-901026-12-5. [Google Scholar]
  2. Semyrka, R. Quantitative and qualitative petrophysical characteristics of main dolomite subfacies in pleogeographical zones. Miner. Resour. Manag. 2013, 29, 99–114, (In Polish, Abstract in English). [Google Scholar] [CrossRef] [Green Version]
  3. Mikołajewski, Z. Petrological Characteristics of the Main Dolomite in the Region Gorzów-Pniewy. In Report on the Scientific Project No NN 525 348538; AGH University of Science and Technology: Krakow, Poland, 2011. (In Polish) [Google Scholar]
  4. Semyrka, R.; Semyrka, G.; Zych, I. Variability of petrophysical parameters of subfacies in the Main Dolomite strata of the western Grotów Peninsula area in the light of porosimetric measurements. Geologia 2008, 34, 445–468, (In Polish, Abstract in English). [Google Scholar]
  5. Aguilera, R. Naturally Fractured Reservoirs; Penn Well Publ. Comp.: Tulsa, OK, USA, 1980; pp. 1–703. [Google Scholar]
  6. Rzyczniak, M.; Solecki, M.L.; Zeljaś, D.; Dubiel, S.J. The effect of pressure depression on the water inflow volume to wells which cover carbonate rocks in the Carpathian Foredeep basement, SE Poland. Rudarsko-geološko-naftni zbornik 2021, 36, 34–42. [Google Scholar] [CrossRef]
  7. Arns, C.H.; Bauget, F.; Ghous, A.; Sakellarion, A.; Senden, T.J.; Sheppard, A.P.; Sok, R.M.; Pinczewski, W.V.; Kelly, J.C.; Knackstedt, M.A. Digital Core Laboratory: Petrophysical Analysis from 3D Imaging of Reservoir Core Fragments. Petrophysics 2005, 46, 260–277. [Google Scholar]
  8. Fadhil, D.T.; Yonus, W.A.; Theyab, M.A. Reservoir characteristics of the Miocene age formation at the Allas Dome, Hamrin Anticline, Northern Iraq. MMD J. 2020, 14, 17–23. [Google Scholar]
  9. Jaworowski, K.; Mikołajewski, Z. Oil-and gas-bearing sediments of the Main Dolomite (Ca2) in the Międzychód region: A depositional model and the problem of the boundary between the second and third depositional sequences in the Polish Zechstein Basin. Prz. Geol. 2007, 55, 1017–1024. [Google Scholar]
  10. Paduszynski, J. Szacowanie gęstości mikroszczelin metodą trawersów losowych. Nafta 1965, 1, 2–3. (In Polish) [Google Scholar]
  11. Karpyn, Z.; Alakmi, A.; Parada, C.; Grader, A.S.; Halleck, P.M.; Karacan, O. Mapping Fracture Apertures Using Micro Computed Tomography. In Proceedings of the International Symposium of the Society of the Core Analysts, Pau, France, 21–24 September 2003; SCA 2003–50. Available online: https://www.ux.uis.no/~s-skj/ipt/Proceedings/SCA.1987-2004/1-SCA2003-50.pdf (accessed on 30 August 2021).
  12. Krakowska, P.I. Innovative Method of Unconventional Oil and Gas Reservoirs Interpretation Using Computed X-ray Tomography; Project Report; National Centre for Research and Development: Warsaw, Poland, 2019; Unpublished. [Google Scholar]
  13. Semyrka, R.; Jarzyna, J.A.; Krakowska, P.; Semyrka, G. Statistical analysis of the main dolomite microfacies parameters in the boundary zone of carbonate platform. Miner. Resour. Manag. 2015, 31, 123–140. [Google Scholar]
  14. Wagner, R. Paleogeografia Dolomitu Głównego-Platforma Gorzowa i N część Platformy Wielkopolskiej. In Algowe Skały Macierzyste Dolomitu Głównego i ich Potencjał Węglowodorowy jako Podstawa dla Genetycznej Oceny Zasobów ropy Naftowej i gazu Ziemnego w Rejonie Gorzowa-Międzychodu. Cz. I, Charakterystyka Geologiczna; Wagner, R., Kotarba, M., Eds.; PGNiG S.A. (Archive): Warsaw, Poland, 2004. (In Polish) [Google Scholar]
  15. Jarzyna, J.A.; Semyrka, R.; Wawrzyniak-Guz, K.; Semyrka, G. Well Logging and Lab Data and Acoustic Instantaneous Attributes to Improve Facies Recognition of Reservoir Rock. In Proceedings of the 74th EAGE Conference and Exhibition Incorporating EUROPEC 2012, Copenhagen, Denmark, 4–7 June 2012. [Google Scholar] [CrossRef]
  16. Webb, P.A. An Introduction to the Physical Characterization of Materials by Mercury Intrusion Porosimetry with Emphasis on Reduction and Presentation of Experimental Data; Micrometrics Instruments Corp.: Norcross, GA, USA, 2011. [Google Scholar]
  17. Smechov, J.M. (Ed.) Trescinovatost Gornych Porod i Trescinnovye Kollektory; Trudy WNIGRI: Leningrad, Russia, 1962. [Google Scholar]
  18. Romm, E.S. Usowierszenstwowanie Metoda Szlifow dla Opriedielienia Paramietrow Triescinowatosci; Trudy WNIGRI: Leningrad, Russia, 1970. [Google Scholar]
  19. Kirby, J.T. Chapter 1 Boussinesq models and applications to nearshore wave propagation, surf zone processes and wave-induced currents. Elsevier Oceanogr. Ser. 2003, 67, 1–41. [Google Scholar]
  20. HESP: Halliburton Entreprise de Services aux Puits. X-tended Range Micro Imager (XRMI™) Tool. Available online: https://hesp.com/index.php/services/open-hole/imaging/xrmi-i-logiq-extended-range-micro-imager (accessed on 9 August 2021).
  21. Serra, O.; Abbott, H.T. The Contribution of Logging Data to Sedimentology and Stratigraphy. Soc. Pet. Eng. J. 1982, 22, 117–131. [Google Scholar] [CrossRef]
  22. Cnudde, V.; Boone, M. High-resolution X-ray computed tomography in geosciences: A review of the current technology and applications. Earth Sci. Rev. 2013, 123, 1–17. [Google Scholar] [CrossRef] [Green Version]
  23. Krakowska, P. Detailed parametrization of the pore space in tight clastic rocks from Poland based on laboratory measurement results. Acta Geoph. 2019, 67, 1765–1776. [Google Scholar] [CrossRef] [Green Version]
  24. PoROSE Help. Available online: www.porose.pl (accessed on 9 August 2021).
  25. Aguilera, R. Analysis of naturally fractured reservoirs from conventional well logs. JPT 1976, 6, 764–771. [Google Scholar] [CrossRef]
  26. Sowiżdżał, K.; Stadtműller, M. Methodology of 3D Fracture Reservoir Modeling. In Proceedings of the GEOPETROL 2010 Conference Proceedings, Zakopane, Poland, 29 September 2010; pp. 105–111, (In Polish, Summary in English). [Google Scholar]
  27. Stadtműller, M. Well logging interpretation methodology for carbonate formation fracture system properties determinantion. Acta Geoph. 2019, 67, 1933–1943. [Google Scholar] [CrossRef] [Green Version]
  28. Luthi, S.M.; Souhaite, P. Fracture apertures from electrical bore-hole scans. Geophysics 1990, 55, 821–833. [Google Scholar] [CrossRef]
  29. Stadtműller, M.; Kowalik, J. Possibilities of Fracture Aperture Evaluation Based on Well Logs-Methodical Aspects. In Proceedings of the GEOPETROL 2012 Conference Proceedings, Zakopane, Poland, 29 September 2012; pp. 355–358, (In Polish, Summary in English). [Google Scholar]
  30. Domenico, S.N. Rock lithology and porosity determination from shear and compressional wave velocity. Geophysics 1984, 49, 1188–1195. [Google Scholar] [CrossRef]
Figure 1. Location of the study area in the background of Polish Lowland (a) Gorzów Platform, (b) Grotów Peninsula(magnified); black arrow in (a) indicates position of the Gorzów Platform; black arrow in (b) indicates G-10 Well position ([14,15], modified).
Energies 14 06034 g001
Figure 2. Cumulative pore volume (a) and incremental pore volume (b) vs. pore size curves for samples of different porosity and pore distribution, G-5 borehole.
Energies 14 06034 g002
Figure 3. Relationship between permeability and total porosity or effective porosity_MICP, grainstone microfacies: (a) data from G-1 borehole; (b) data from G-6 borehole.
Energies 14 06034 g003
Figure 4. Relationship between effective porosity_MICP vs. total porosity: (a) all data; (b) data from G-5 borehole; par—parallel; per—perpendicular; un—undescribed cutting of plug.
Energies 14 06034 g004
Figure 5. Relationships between effective porosity_MICP vs. bulk density_MICP: (a) decimal logarithm of average diameter of capillary, ADC vs. effective porosity_MICP; (b) all data.
Energies 14 06034 g005
Figure 6. Mutual relations between well logging data in G-5 borehole; division according to shaliness; (a) GR vs. DT, (b) RHOB vs. DT; (c) PHI vs. DT, (d) PHI vs. RHOB.
Energies 14 06034 g006
Figure 7. Microfracture_porosity Index vs. PORO: (a) full data set, G-1 and G-2 boreholes; (b) full data set, G-5 and G-6 boreholes; (c) data after selection, G-1 and G-2; (d) data after selection, G-5 and G-6.
Energies 14 06034 g007
Figure 8. Mezzofracture_porosity Index vs. PORO: (a) full data set, G-1 and G-2 boreholes; (b) full data set, G-5 and G-6 boreholes; (c) data after selection, G-1 and G-2; (d) data after selection, G-5 and G-6.
Energies 14 06034 g008
Figure 9. Relation between mezzofracture permeability and Mezzofracture_porosity Index; boreholes G-5 and G-6.
Energies 14 06034 g009
Figure 10. Relation between permeability and porosity from laboratory measurements. G-6 borehole.
Energies 14 06034 g010
Figure 11. Results of the processing and interpretation of electric imager log for macrofracture determination in the selected depth section of the G-10 well: GRTC—gamma ray log without uranium component; GRTO—total gamma ray; MD—measured depth, changed; FR_—fractures; FPI—fracture porosity index.
Energies 14 06034 g011
Figure 12. Histogram of the estimated apertures—colors are related to the aperture size.
Energies 14 06034 g012
Figure 13. Results of the permeability and porosity analysis (taking into account micro-, mezzo- and macrofractures in the Main Dolomite, Ca2, G-10 borehole; symbols as in Figure 1).
Energies 14 06034 g013
Figure 14. (a) Micro-CT image of the full clayey limestone samples and object size classification, Y-Z plane. Colors: red: 1–99 voxels; orange: 100–999; yellow: 1000–9999; green: 10,000–99,999; light blue: 100,000–999,999; dark blue: above 1,000,000 voxels. Scale: 1 voxel = 0.6 × 0.6 × 0.6 µm3. (b) Micro-CT image of the largest fracture in the clayey limestone sample, object size classification, Y-Z plane. Red color refers to the object selection; description as in Figure 14a. Scale: 1 voxel = 0.6 × 0.6 × 0.6 µm3. (c) Micro-CT image of the objects with a volume above 1,000,000 voxels (without the largest object visible in the Figure 14b) in the clayey limestone sample, object size classification, X-Z plane. Colors are the same as in Figure 14a. Scale: 1 voxel = 0.6 × 0.6 × 0.6 µm3.
Energies 14 06034 g014aEnergies 14 06034 g014b
Table 1. Simple statistics (MIN—minimum, AVER—average, MED—median, MAX—maximum) of the petrophysical parameters obtained from the MICP experiment and helium porosity method on samples from all boreholes in the study.
Parameter/
Statistics
MDTPSD_MICPD_MICPP_MICPDAC_MICPLOG10
(DAC)
SA_MICPHysteresis
(g/cm3)(%)(g/cm3)(g/cm3)(%)(μm) (m2/g)(%)
All plugs (136)
MIN2.660.002.461.870.000.00−1.560.006.00
AVER2.8611.002.812.5210.421.16−0.480.5554.34
MED2.8610.52.822.5010.180.30−0.530.515.00
MAX2.9933.193.042.8824.0549.001.691.4485.00
MD—material density_HM; TP—total porosity, HM; SD_MICP—skeletal density; D_MICP—bulk density from the MICP experiment; P_MICP—effective porosity; DAC_MICP—diameter of average capillary; LOG10(DAC)—decimal logarithm of average capillary diameter; SA_MICP—specific area; Hysteresis—HM and MICP indexes’ mean parameters obtained from the helium and mercury injection porosimetry experiments.
Table 2. Simple statistics (MIN—minimum, AVER—average, MED—median, MAX—maximum) of the petrophysical parameters obtained from the well logging measurement and interpretation in the G-5 borehole.
Parameter/
Statistic
DTGRRHOBPHIVDOLVANHVCL
(μs/ft)(API)(g/cm3)(dec)(dec)(dec)(dec)
MIN4582.530.3000
AVER52312.794.810.550.350.03
MED50282.8130.550.380.02
MAX69812.96200.970.950.13
DT—slowness from sonic log; GR—intensity of natural radioactivity; RHOB—bulk density from gamma-gamma log; PHI, VDOL, VANH and VCL—porosity, volume of dolomite, volume of anhydrite and volume of shaliness from the comprehensive interpretation of well logs, respectively.
Table 3. Fracture porosity and fracture permeability obtained from the thin section analyses of micro- and mezzofractures and porosity (PORO) and permeability (PERM) from well logging interpretation (boreholes G-1, G-2, G-5 and G-6 in the study area).
MicrofracturesMezzofractures
WellFracture PorosityFracture PermeabilityPOROPERMWellFracture PorosityFracturePOROPERM
Permeability
(%)(mD)(%)(mD)(%)(mD)(%)(mD)
G-12.8324.84310.800.132G-10.2171.0410.800.132
1.0371.4373.400.8640.1000.2014.600.087
2.3353.2347.300.0100.0480.1120.604.471
0.8021.11114.600.0870.1130.2119.002.880
0.3320.46010.600.0360.3082.5119.001.191
0.8791.21713.200.0010.99913.2018.600.319
0.1550.21519.900.1690.2711.3417.800.095
0.1140.15813.300.3530.2021.1810.700.045
0.4270.59114.600.0810.0762.975.100.012
0.0740.10217.702.0490.75930.070.700.001
0.3200.44318.701.2240.1561.691.800.001
1.3211.83019.702.805G-20.2629.162.800.001
0.8831.22320.604.4710.143.403.900.001
0.6340.87819.002.8800.4228.004.400.001
0.1670.23219.001.1910.060.9013.100.001
0.1740.24118.902.8060.098.8015.800.015
0.4720.65421.105.8080.2824.0015.500.056
5.7067.90418.600.3190.2129.7022.200.002
2.7523.81214.500.0250.225.6014.900.075
3.8995.40117.800.0950.072.9014.200.698
1.2161.68510.700.045G-50.2720.602.100.001
2.3003.18518.900.2830.214.509.600.001
1.0991.5225.100.0120.133.0020.001.283
1.2361.7110.700.0010.1723.202.600.001
2.4413.3811.800.0010.083.103.000.001
G-25.4347.5272.800.0010.236.102.600.001
1.1481.5903.900.0010.183.909.800.001
3.5884.9704.400.0010.163.104.000.001
0.0000.0003.100.0010.163.801.600.001
0.2960.41013.100.001G-60.687.200.300.001
2.3673.27911.400.0010.1910.8017.800.001
2.9894.14014.000.0150.4712.108.700.045
3.7225.15514.800.0370.6664.155.100.001
0.7911.09513.600.0530.5924.208.402.274
0.2540.35212.000.1600.647.0014.600.003
3.3504.63915.800.0151.42474.513.6052.075
1.0471.45117.100.0540.73113.0011.5071.430
5.0316.96915.500.0561.53426.007.4061.152
3.2334.47822.200.0022.15836.305.3039.569
0.2330.32216.700.0841.07256.006.4011.820
5.4497.54816.200.0350.76213.007.502.483
3.5334.89414.900.075
2.6913.72714.200.698
2.5333.50917.200.001
G-512.58617.4322.100.001
1.9912.7580.700.001
2.8613.9630.500.001
5.3597.4239.600.001
1.3061.81011.000.001
8.72112.08020.001.283
0.8021.11111.600.001
1.2491.7303.600.001
2.8413.9362.600.001
1.2501.7311.500.001
2.5143.4823.000.001
3.7515.1952.600.001
1.0781.4939.800.001
3.5154.8694.000.001
1.8952.6241.600.001
3.8085.2741.600.001
G-68.13311.2640.300.001
8.69612.04519.107.306
4.9506.85617.800.001
8.86912.2848.700.045
4.7576.5895.100.001
9.75013.5057.100.001
4.6696.4678.402.274
2.9844.13414.600.003
5.1987.20013.6052.075
8.43611.68411.5071.430
11.79016.3307.4061.152
12.80017.7295.3039.569
11.22515.5486.4011.820
5.9948.3027.502.483
7.43110.2938.200.898
Table 4. Simple statistics (MIN—minimum, AVER—average, MAX—maximum) of the porosity from logs and laboratory data integration. G-10 borehole.
Parameter/
Statistics
MICRO_FPMEZO_FPMACRO_FPMATRIX_P
(%)(%)(%)(%)
MIN0.010.000.000.31
AVER0.380.040.045.87
MAX1.820.281.0017.86
Table 5. Simple statistics (MIN—minimum, AVER—average, MAX—maximum) of the permeability from logs and laboratory data integration. G-10 borehole.
Parameter/
Statistics
K_MICRO_FRK_MEZO_FRK_MACRO_FRK_MATRIXK_SUMK_SUM_MAC
(mD)(mD)(mD)(mD)(mD)(mD)
MIN0.030.000.000.000.030.03
AVER0.060.130.320.020.220.51
MAX0.131.239.540.321.7310.12
Table 6. Petrophysical parameters of the clayey limestone sample.
XRDQ (%)C (%)D (%)H (%)P (%)M (%)Ch (%)Σil (%)
5.372.82.40.41.515.62.017.6
MICPTIV
(mL/g)
TPA (m2/g)MPDV (μm)MPDA (μm)APD (μm)D (g/cm3)SD (g/cm3)P
(%)
0.00170.0085.9867.3763.722.672.680.0637
NMRKp1 (%)Kp2 (%)Kp3 (%)Kp_nmr (%)Kpef_nmr (%)Sw_nmr (%)Kp_μ CT (%)Vp/Vs
0.470.080.030.580.1181.040.41.95
Q—quartz; C—calcite; D–dolomite; H—halite; P—pyrite; M—micas; Ch—chlorite, Σil—sum of clay minerals; TIV—total intrusion volume; TPA—total pore area; MPDV—median pore diameter volume; MPDA—median pore diameter area; APD—average pore diameter; D—bulk density; SD—skeletal density; P—effective porosity; Kp1—volume of irreducible water; Kp2—volume of capillary water; Kp3—volume of free water; Kp_nmr, Kpef_nmr and Sw_nmr—total porosity, effective porosity and bound water saturation from NMR, respectively; Kp_μ CT—micro computed tomography porosity; Vp/Vs—p- and S-wave velocity ratio.
Publisher’s Note: MDPI stays neutral with regard to jurisdictional claims in published maps and institutional affiliations.