Article

Vitrinite Equivalent Reflectance Estimation from Improved Maturity Indicator and Well Logs Based on Statistical Methods

by
Sebastian Waszkiewicz
* and
Paulina I. Krakowska-Madejska
Faculty of Geology, Geophysics and Environmental Protection, AGH University of Science and Technology, Al. Mickiewicza 30, 30-059 Krakow, Poland
*
Author to whom correspondence should be addressed.
Energies 2021, 14(19), 6182; https://doi.org/10.3390/en14196182
Submission received: 20 August 2021 / Revised: 24 September 2021 / Accepted: 24 September 2021 / Published: 28 September 2021
(This article belongs to the Special Issue Well Logging Applications)

Abstract

:
Estimation and correct determination of vitrinite equivalent reflectance in rock is crucial for the assessment of the source rock in both conventional and unconventional hydrocarbon deposits. These parameters can be determined in laboratories on rock samples. Laboratory measurements provide only point information. However, the use of well logs could overcome discontinuities in the data and provide parameters throughout a study interval. Attention has been paid to the estimation of TOC based on well logs. Vitrinite equivalent reflectance estimation is less well discussed and most papers reported cases with high TOC content in analyzed deposits. In this paper, the estimation of improved Ro is presented using a calculated maturity indicator with well logs. As the organic matter content is not high, additional steps were required for the calculation. To improve the quality of the fit and to find similar intervals, the data were grouped using cluster and neural network analysis. The next step was to use the resistivity log to improve the obtained maturity indicator. Due to the changing properties of kerogen with the type and degree of thermal maturity, this approach turned out to be reliable. The use of resistivity significantly increased the correlation coefficient and reduced errors. The method was tested on two wells with different type and maturity of kerogen. The obtained results are satisfactory, which makes it possible to use the method even in formations with a low organic matter content.

1. Introduction

Estimation and correct determination of vitrinite reflectance (Ro) and the content of total organic carbon (TOC) are the main steps in describing source rock in both conventional and unconventional hydrocarbon deposits. Determination of these parameters using laboratory measurements has been widely used in the petroleum industry [1]. Unfortunately, this approach allows measurement and determination of parameters only from geological samples that provide point information. The desire to obtain more continuous information using laboratory measurements is associated with the need to collect and test a large section of the core, which significantly affects both time and, above all, costs.
Well logs may assist in determining vitrinite reflectance as continuous information. Moreover, various statistical methods, such as neural networks, unsupervised machine learning, and multilinear regression provide an opportunity to combine several well logs and laboratory data to obtain a more credible result in the form of different petrophysical or geochemical parameters or lithology prediction [2,3,4,5,6,7,8,9,10]. Well logs enable the evaluation of electrofacies, in which beds are characterized by similar parameters but are different among other electrofacies. The most important well logs cover natural radioactivity (GR), neutron porosity (NPHI), bulk density (RHOB), compressional slowness (DT), and electrical resistivity logs (LLD, LLS). Some of the logs are significantly affected by the presence of organic matter, such as sonic (increase), neutron (decrease), bulk density (decrease), and electric resistivity (increase) logs. Hence, electrical resistivity logs appear to be very useful in improving the formation maturity factor. Kadkhodaiea and Rezaeea [11] used acoustic and electrical resistivity logs in their studies to estimate the parameter and achieved promising results. The main introduced factor of the mentioned method is ΔRRS, which is defined as the separation between cumulative frequency values of resistivity ratio (RR) and sonic log data. Moreover, a calibration chart was presented for Ro estimation based on ΔRRS data.
Currently, shale gas deposits in Poland are under intense consideration because of gas saturation and perspectives in exploitation [12,13,14,15,16,17,18,19]. Hence, estimation of basic parameters, such as Ro or TOC content in the shale gas formations based on well logs and laboratory data become a key task for researchers [1,11,20,21,22,23,24].
The assessment of the thermal maturity of pre-Devonian shales is difficult due to the lack of vitrinite macerals used in the basic petrographic method [25]. Such sediments may contain organic matter with the optical properties of vitrinite but with a different chemical composition (derived from other organic precursors). Moreover, in this type of rocks, microfossils may appear—organoclasts (e.g., zoclasts) which also optically resemble vitrinite (e.g., graptolites) [26,27]. The presence of bitumen and animal remains allow the measurement of a parameter that is a substitute for vitrinite reflectance and, like it, can be used to assess thermal maturity [28,29,30,31,32,33].
The paper presents an expanded method for vitrinite equivalent reflectance based on well logs and the use of advanced statistical methods. The method for evaluating the thermal maturity of organic-rich shale from well logs is described in detail by Zhao et al. [34]. In this paper, a maturity indicator (Im) was defined, which refers to the kerogen element composition and type. Moreover, the core of the paper is a petrophysical equation that allows Im from well logs based on neutron log response to be obtained. The expanded method assumes improvement of Im calculation by delivering electrofacies data from well logs. Moreover, the improved maturity factor together with an electrical resistivity log (LLD) is an input for vitrinite equivalent reflectance estimation. The proposed expanded method is useful not only for formations characterized by a high total organic carbon content but also for formations with low TOC content. It is one of the most significant advantages of the described method.

2. Materials and Methods

The geological material consisted of Paleozoic core samples taken from two wells, labelled A and B, in Poland (Eastern Europe). The wells are located on the Lublin Synclinorium (southeast Poland) (Figure 1) [15,35,36,37,38,39,40].
Probed rock samples were from a depth greater than 2800 m of the present deposition and represent Silurian gas-bearing shales [41,42,43].
All plugs for the laboratory measurements were probed horizontally to the bedding. The analyzed formation contained kerogen that, due to the values of the hydrogen and oxygen index, could be read from the Van Krevelen diagrams [44,45]. The laboratory measurement of reflectance was carried out on the basis of microscopic optical tests in reflected light [46]. Measurements of the reflectance were performed on the material represented by zooclasts—fragments of graptolites. Then, on the basis of the measurements, the vitrinite equivalent reflectance was calculated. Total organic carbon content was evaluated based on Rock-Eval pyrolysis [47].
The method in the presented work is based on the equation proposed by the study of Zhao et al. [34] using the hydrogen index as a basis for estimating the thermal maturity of organic-rich shales (Equation (1)).
I m = V c l Φ c l ϕ Φ f V k Φ k 9 T O C ρ b ,
where Im—maturity indicator (unitless); Vcl—volume of clay in v/v; Vk—volume of kerogen in v/v; Φ c l , Φ f , Φ k are hydrogen indices of clays, pore fluids, and kerogen; ϕ is porosity v/v; TOC—total organic carbon in %wt; ρ b —is the density of shale in g/cm3.
The basis of neutron log measurements in a rock formation is connected to the interaction between the neutron and hydrogen. This is due to the fact that hydrogen nuclei, because of their mass, are effective in slowing down the fast neutrons. The rate of deceleration of neutrons emitted by the tool is closely related to the number of hydrogen atoms in the rock formation. Hydrogen atoms in a rock formation occur mainly in the fluids that saturate the pore space. Therefore, the neutron tool is used to evaluate porosity [49,50].
Hydrogen atoms are also found in organic matter in rock. Their content varies depending on the type and thermal maturity of the kerogen. As maturity increases, the amount of hydrogen (H) and oxygen atoms (O) decreases. The type and maturity of the kerogen can be determined using Van Krevelen diagrams [44,45]. Both the presence of H atoms and their variability depends on the degree of rock maturity, which affects the neutron logs. This allows using the neutron index to determine the thermal maturity of organic matter. The neutron porosity of clays is much higher than that of other minerals, and the neutron porosity of the pore media is close to 100% (Table 1).
Therefore, the tool response in shale with organic matter can be simplified (Equation (2)):
Φ N = V c l Φ c l + ϕ Φ f + V k Φ k ,
where Φ N is neutron log response in clay formation.
The kerogen content can be determined from the organic carbon content using Equation (3):
V k = κ T O C ρ b ρ k ,
where κ is a coefficient corresponding to the type and maturity of the kerogen, and ρ k is the density of kerogen in g/cm3.
Using the hydrogen index equation for any mineral or rock can be presented in the form of the Equation (4):
H = 9 χ ρ M ,
where H is the hydrogen index, χ is the number of hydrogen in each molecule, and M is the molar mass we get the hydrogen index of the kerogen expressed as
Φ k = 9 ρ k χ M ,
thanks to which we obtain Equation (6):
  κ χ M = V c l Φ c l + ϕ Φ f + V k Φ k 9 T O C ρ b ,
where the left part of the equation is called the maturity indicator κ χ M , becoming the basis of the method presented in Equation (1) [34].
However, the direct application of the discussed method to data from shale rocks with a lower organic matter content does not always provide satisfactory results (very low determination coefficient for the association between measured and calculated Ro). In order to improve the obtained results, a number of data preparation procedures must be carried out. Likewise, the transition from lab data to well logs requires a series of steps. The developed scheme of the applied calculations and analyses is shown in Figure 2.
Clustering is a type of unsupervised machine learning method [51,52]. The method is used to combine objects containing various features into homogeneous groups, called clusters. The members of each group are similar within the cluster, but different from the members of the other clusters. Among the methods of clustering can be distinguished:
  • Hierarchical methods, showing the data structure and allowing for manual selection of the number of clusters;
  • Non-hierarchical methods, in which the number of clusters is selected before the analysis and then the data are assigned to them, e.g., the k-means method.
Artificial neural networks can also be used to divide data into groups [53]. The self-organizing networks proposed by Kohonen [53] are the most popular. SOM (self-organizing maps) are capable of mapping high-dimensional data into clusters that are similar to each other. SOM networks are a type of unsupervised network. This means that no output examples are given for the input data during training. Training is a self-learning process, and the networks consist of two layers: input and output.
The use of both cluster analysis and SOM to determine groups of data with similar parameters (electrofacies) measured by well logs has been confirmed in previous studies. Many researchers [54,55,56] have demonstrated the validity of using grouping methods in organic rich shales formations.
The transition from the domain of laboratory samples to continuous well logs measurement requires the correct determination of the number of parameters necessary to calculate the maturity index. One of them is to obtain a continuous TOC parameter. Various methods for determining the TOC are available in the literature. The most popular are the methods described by Schmoker [57] or Passey [58]. The use of empirical methods such as regression or multiple regression also give interesting results [59]. By applying prior cluster analysis, the calculation of the required parameters can be performed in detail.
Carrying out steps to prepare the data is not always sufficient, especially in very heterogeneous rocks. Therefore, the determined maturity index can be improved with well logs. For this purpose, instead of estimating vitrinite equivalent reflectance as a function of the maturity index, multiple regression was performed (Equation (7)):
R 0 = a 1 I M + a 2 L L D + b ,
where Ro is the vitrinite equivalent reflectance in %, Im is the maturity indicator (unitless), LLD is the electrical resistivity log in ohmm, and a1, a2, b are estimated regression coefficients.
The use of a true electrical resistivity log seems to be justified due to the significant influence of organic matter on this measurement. Organic matter presence significantly increases the electrical resistivity response. This causes considerable difficulty in determining parameters such as water saturation [60,61]. However, in the discussed work it becomes a factor influencing the improvement of vitrinite equivalent reflectance estimation.
Several applications were used in the analysis: Statistica (StatSoft) and Techlog (Schlumberger).

3. Results

3.1. Core Data Domain

According to Table 2, for the interval in which the vitrinite equivalent reflectance was determined, it is clear that the TOC content is not high. The other samples on which the Rock-Eval pyrolysis was performed also gave similar results. For well A, the average TOC content was 0.45% (standard deviation SD = 0.44%), while for well B it was 0.49% (SD = 0.79%). The low content of TOC made the application of the described method more difficult due to the lower effect on well logs in the form of slight curves anomalies Therefore, it was necessary to apply a series of steps that allowed the correct application of the method.
The application of Equation (1) requires the determination of the type of kerogen in both wells. The appropriate graphs were used for this purpose. Based on them, especially in the case of well B, we observed the inert kerogen (Figure 3 and Figure 4).
The application of the above Formula (1) for laboratory samples of the Upper Silurian from well A and the Lower Silurian from well B did not bring the expected results. The relationship between maturity indicator and vitrinite equivalent reflectance was R2 = 0.27 for well A and R2 = 0.44 for well B. Such a low fit did not allow the equation to be directly applied to the rest of the data.

3.2. Well Log Domain

The basic problem that could have caused the poor results was the significant depth interval between the samples and the heterogeneity of the rock formation. Therefore, the first step before calculating the continuous parameters from well logs was the determination of electrofacies.
For this purpose, cluster analysis was applied using the k-means algorithm and artificial neural networks—self-organizing maps (SOM). The following logs were used for the analysis: GR (natural gamma-ray), LLD (deep resistivity), LLS (shallow resistivity), NPHI (neutron porosity), RHOB (bulk density), and DT (compressional slowness). The results obtained with the use of both tools were convergent, allowing the determination of intervals with similar parameters. The Upper Silurian interval in well A was divided into five different clusters, while in the B well a total of three clusters (Figure 5) were separated in the Upper and Lower Silurian rocks.
The next step necessary to determine the continuous parameters was to calculate the porosity and clay volume. For this purpose, standard petrophysical interpretation procedures were applied on the well logs. Another equally important step was the determination of the total organic carbon content.
The TOC was calculated (Table 3) using linear regression between the TOC measured in the laboratory and the acoustic log (travel transit time, compressional slowness, DT). Satisfactory results were obtained by narrowing the interval to the previously designated classes. For the A well, the measure of matching R2 was 0.71, while for the B well it was 0.85 (Figure 6).
Evaluated continuous parameters allowed calculation of the maturity indicator. The result was then compared with the results from the Ro measurements in order to find the relationship that would be useful in the calculation of the continuous vitrinite equivalent reflectance (Figure 7 and Figure 8). In the case of the A well, the result was R2 = 0.77, while for the B well, R2 = 0.54.
The use of, inter alia, cluster analysis increased the result. However, it was still not fully satisfactory, especially in the case of well B. Therefore, in order to improve the result, multiple regression was performed using the electrical resistivity log (LLD) (Equation (6)). The use of the LLD log as a supportive measurement significantly improved the adjustment to vitrinite equivalent reflectance (Table 4, Figure 6 and Figure 7). The obtained matches allowed for continuous estimation of vitrinite equivalent reflectance in the previously designated clusters.
The last step was the application of the obtained Equations (8) and (9) to calculate vitrinite equivalent reflectance in selected electrofacies and to present the results with well logs (Figure 9 and Figure 10).
R 0 W E L L A = 0.2153 I M + 0.0007 L L D + 0.985 ,
R 0 W E L L B = 0.0785 I M + 0.0008 L L D + 2.0937 ,

4. Discussion

The conducted analyses confirmed the validity of using the Ro determination method based on the maturity indicator. The obtained results are consistent with the research carried out by Zhao et al. [34]. Similar to the work of the above-mentioned authors, in one of the wells, the vitrinite equivalent reflectance increases with the growth of the maturity indicator, while in the other well the opposite is true. It is related to the different degree of thermal maturity of the organic matter. Undoubtedly, it is influenced by the different temperature and depth of burial, which are factors that significantly affect the degree of transformation of organic matter [62].
In contrast with the research by Zhao et al. [34], the research area is not that rich in organic matter. The TOC contents in the analyzed formation are significantly lower. This undoubtedly had an impact on the measurements taken. However, the application of the procedure, especially the use of cluster analysis, allowed satisfactory results to be obtained.
The problem of vitrinite equivalent reflectance estimation was also discussed in the work by Waliczek et al. [63]. The research on rock samples concerned the estimation of Ro depending on Tmax temperature value. The developed method could probably complement the methodology used by the authors. In the study by Waliczek et al., the obtained R2 for the estimated and measured Ro matches in the range of 0.7–0.87 depending on the type of kerogen.
As their research and research by Yang et al. [64] have shown, kerogen resistivity also depends on sample type and maturity, which results in the fact that the electrical resistivity log can be successfully used to estimate, among other values, Ro.
This is confirmed by own research. The use of the LLD log significantly increased the matching of the maturity indicator and Ro. Importantly, apart from an increase in the measure of fit R2, a decrease in the RMSE error was also observed. In the case of the A well, the RMSE error decreased from 0.04 to 0.03, while for the B well, it decreased from 0.11 to 0.09. R2 and RMSE values provide the possibility of comparing the models and building credible associations. Satisfactory values of R2 and RMSE is subjective and depends on the formation heterogeneity and interpreter experience. For a complex reservoir, even R2 above 0.7 is suitable. The repeatability of gaining a high R2 fit and improvement of RMSE value in both wells provide a chance of obtaining similar results in other wells and reservoirs. The presented approach can be easily used for continuous Ro estimation.

5. Conclusions

The article presents a method for determining vitrinite equivalent reflectance based on well logs. During the research, we concluded the following:
  • The parameter Im can be successfully used to estimate Ro in formations with a lower TOC content, provided that additional steps are used in its calculation, among other things, through the use of electrofacies.
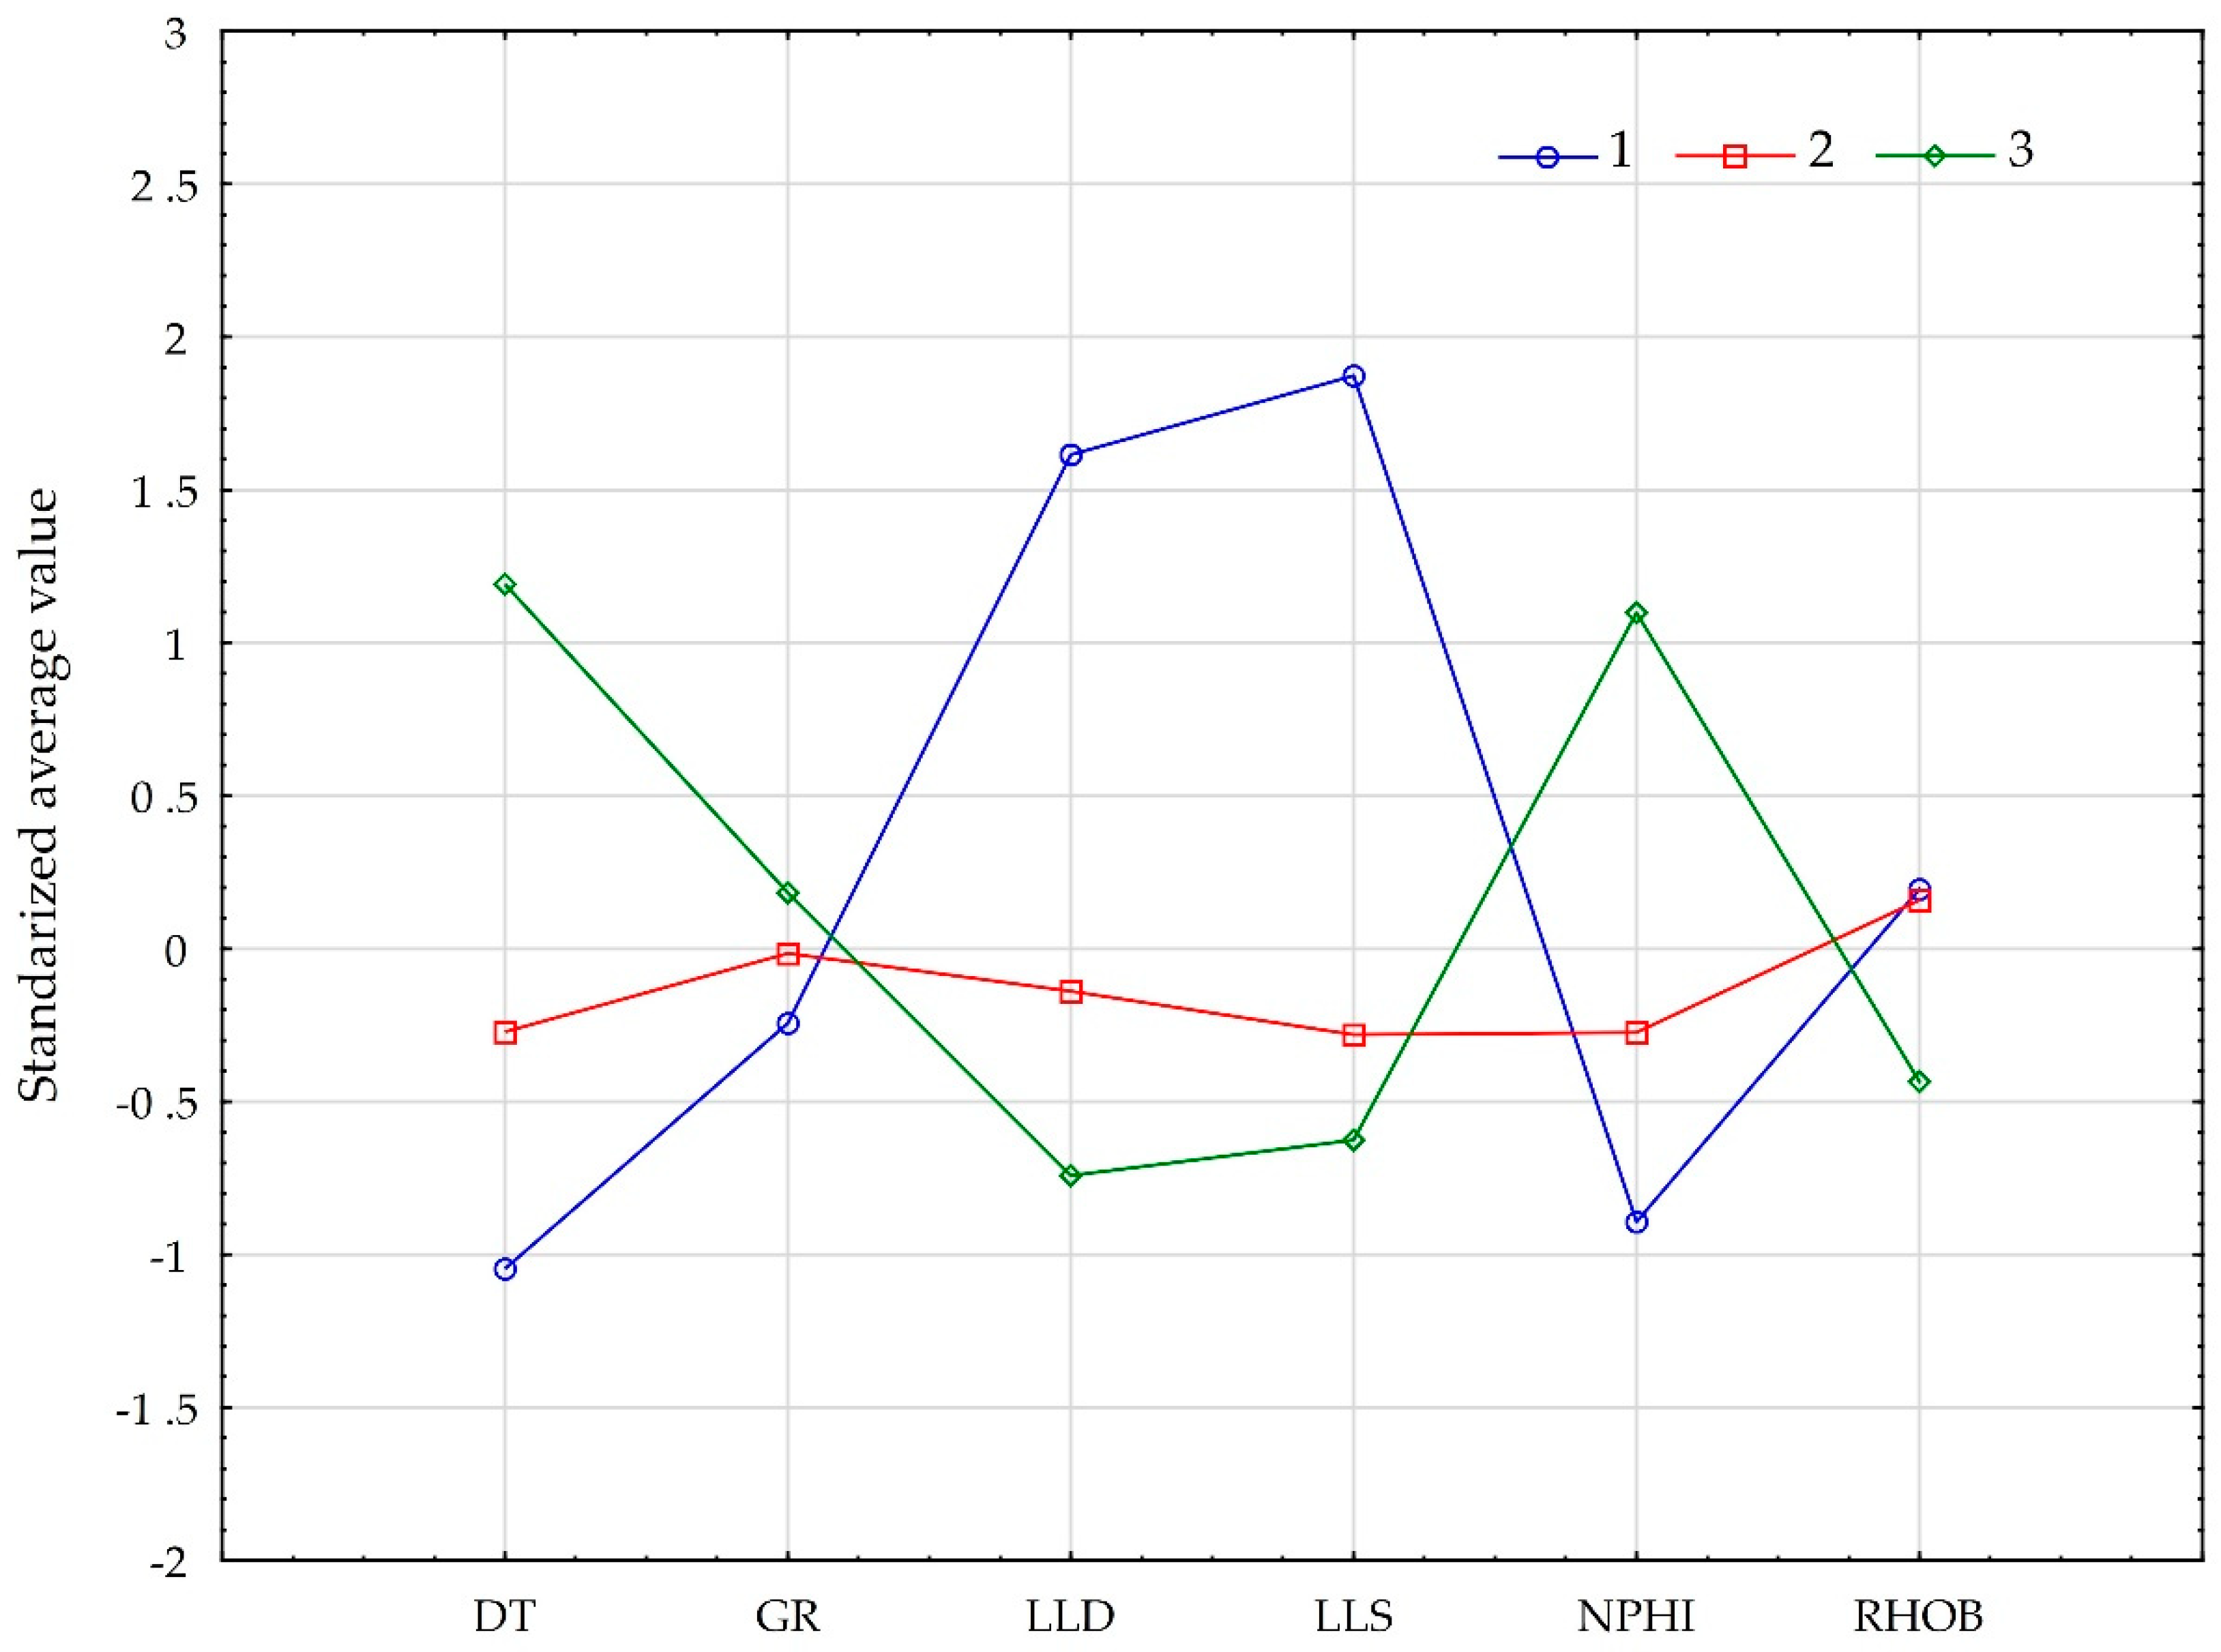
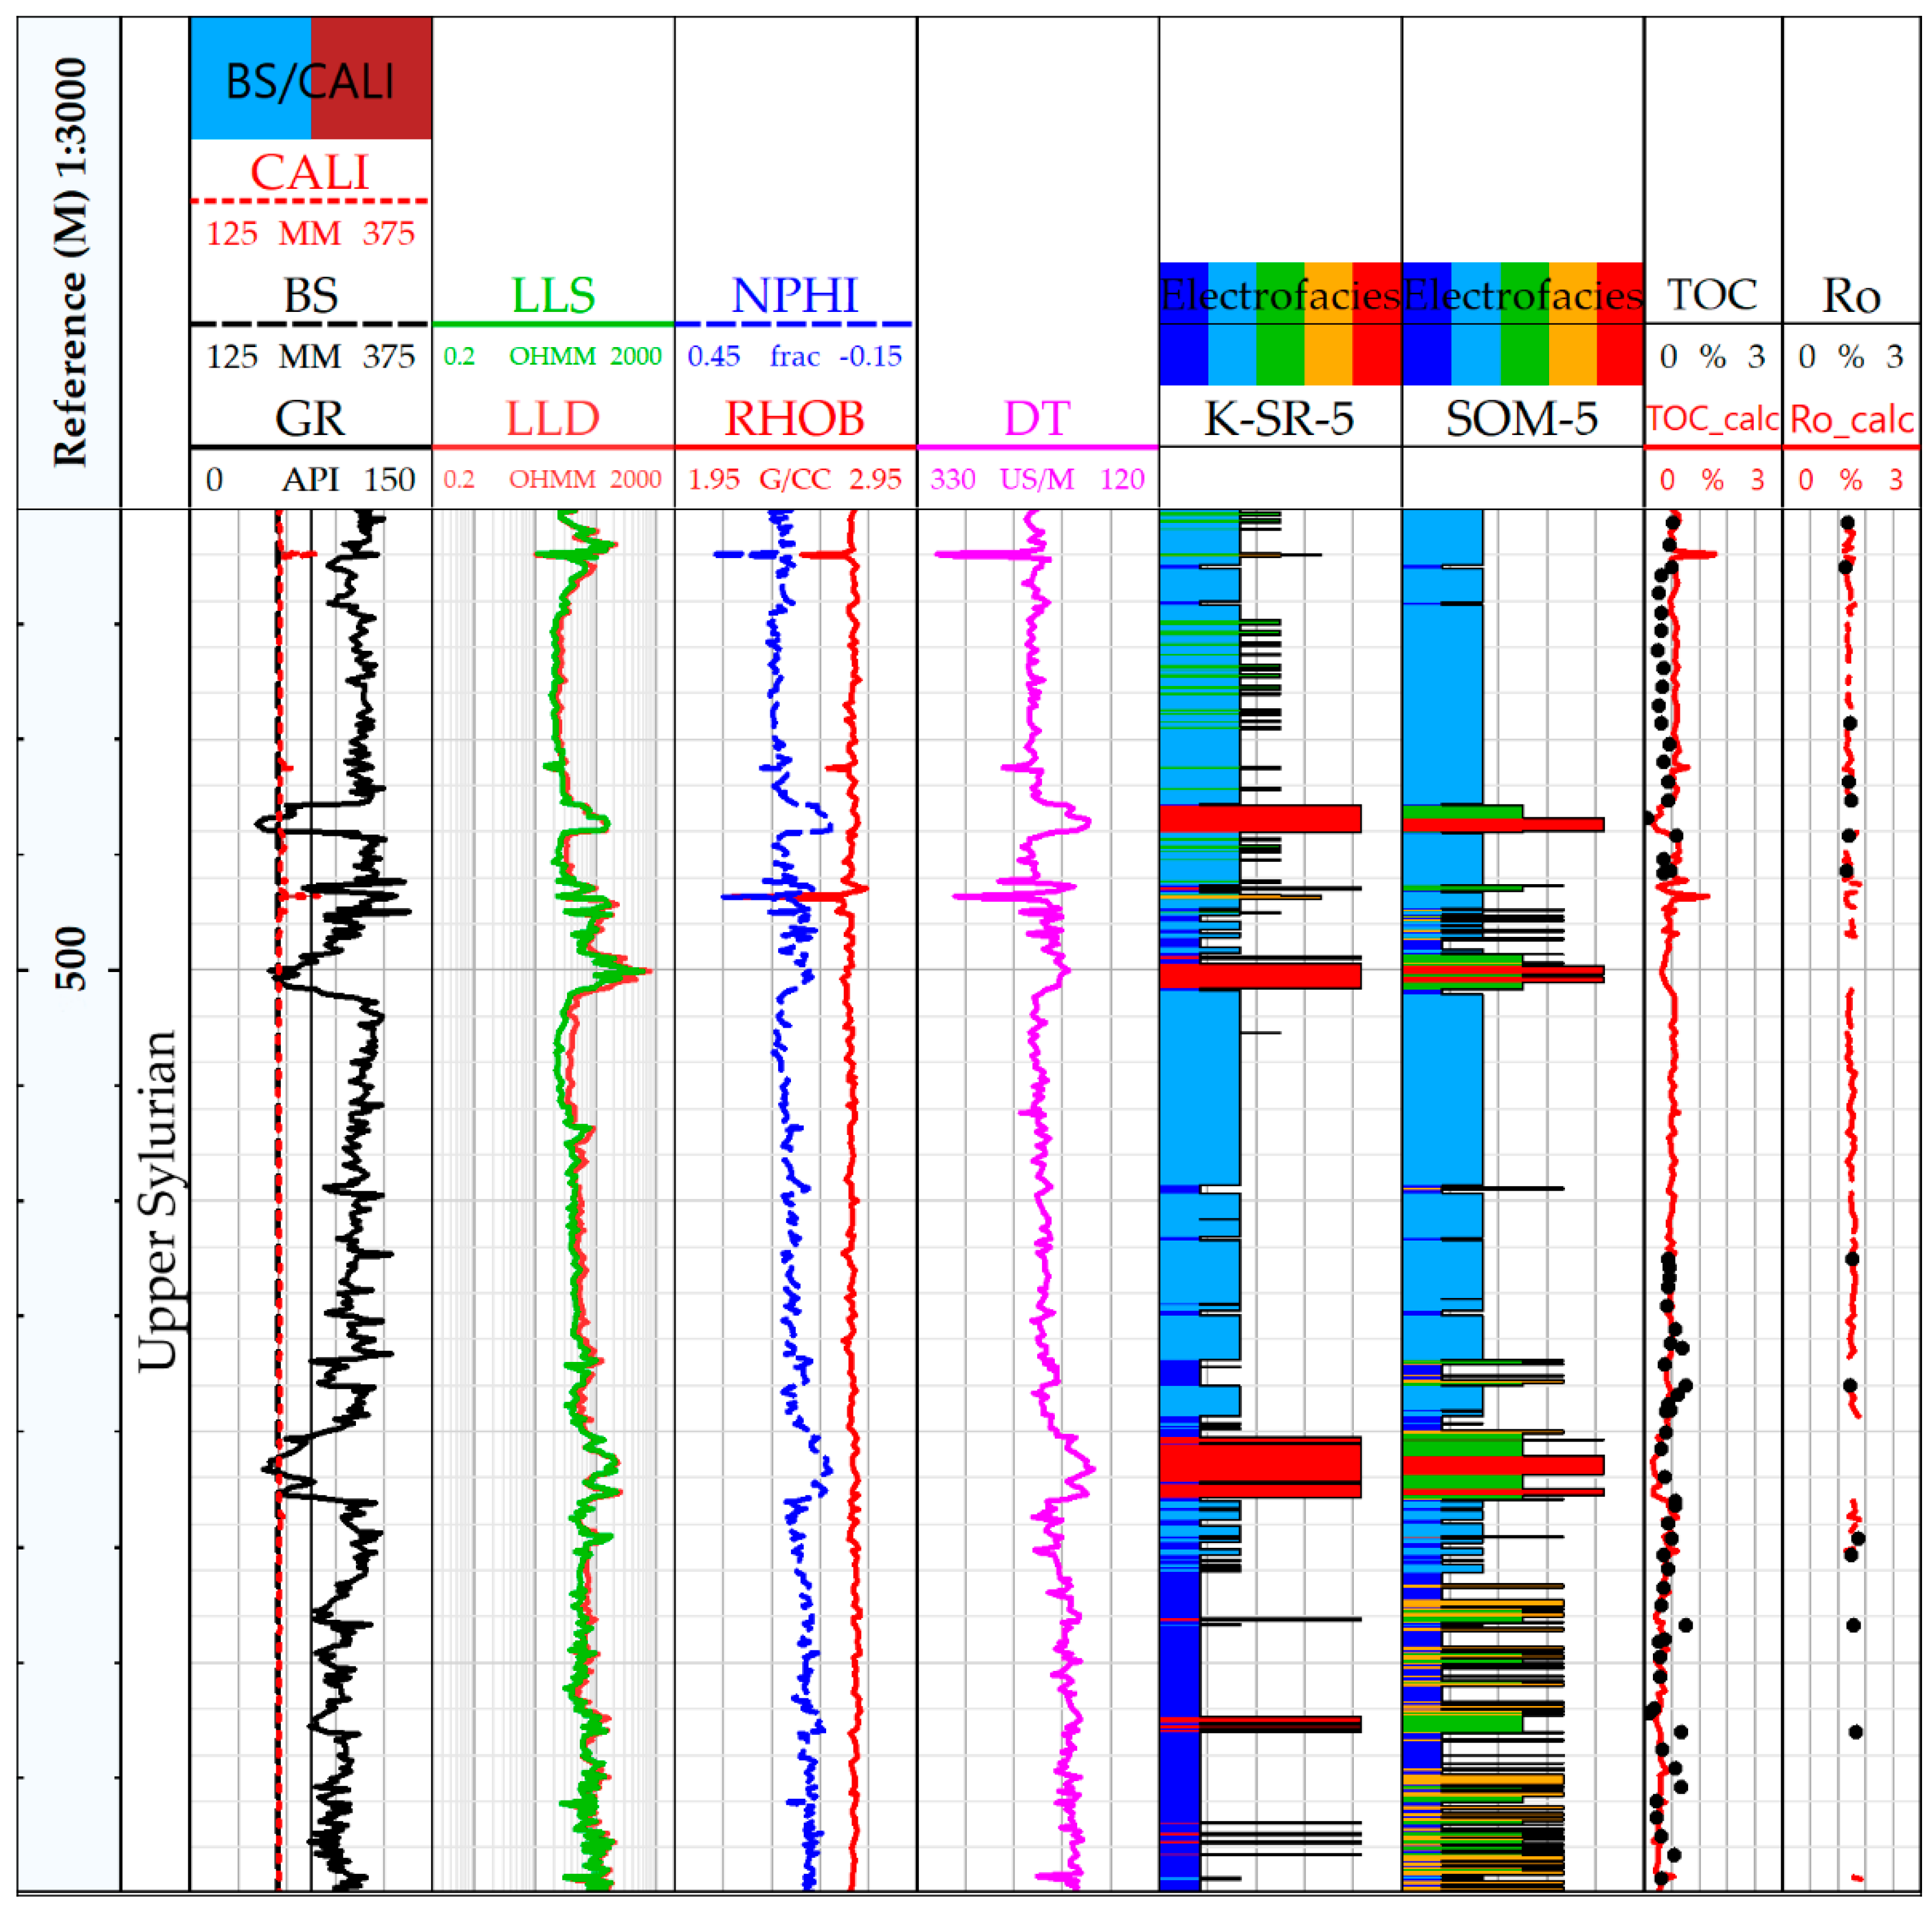
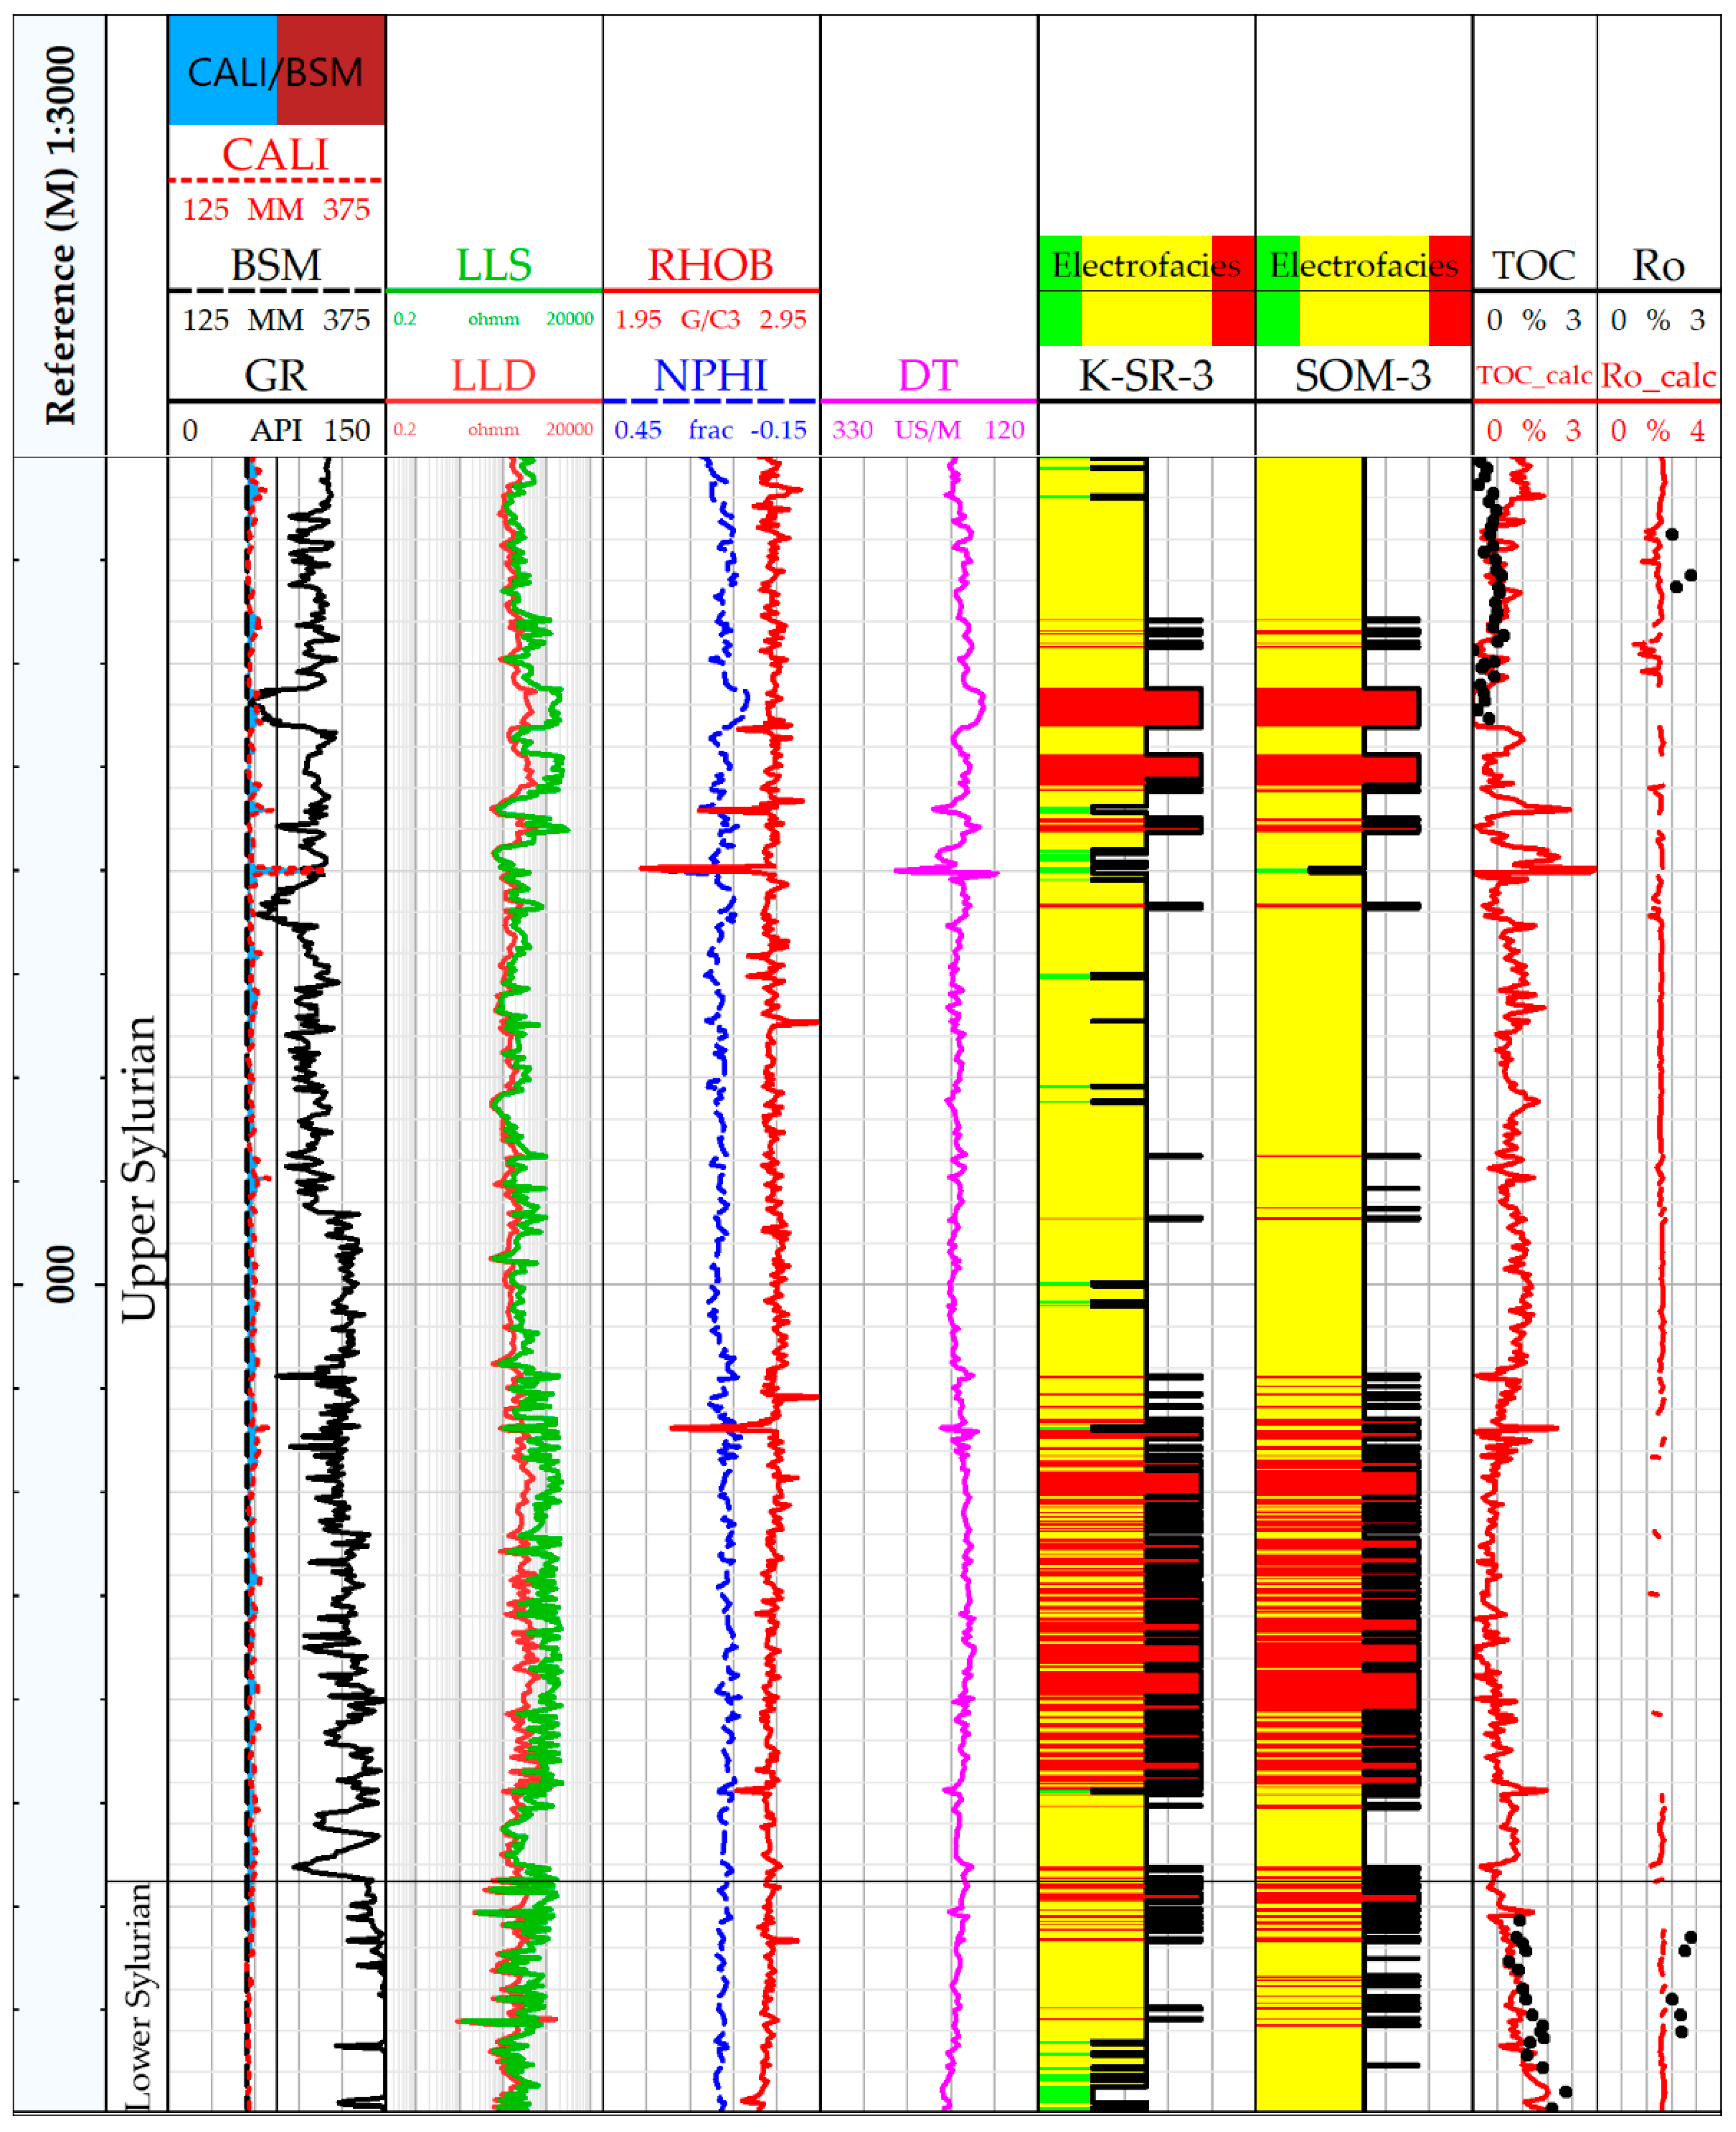
  • The use of cluster analysis and neural networks can be successfully used in the determination of electrofacies. The results obtained by both methods were similar.
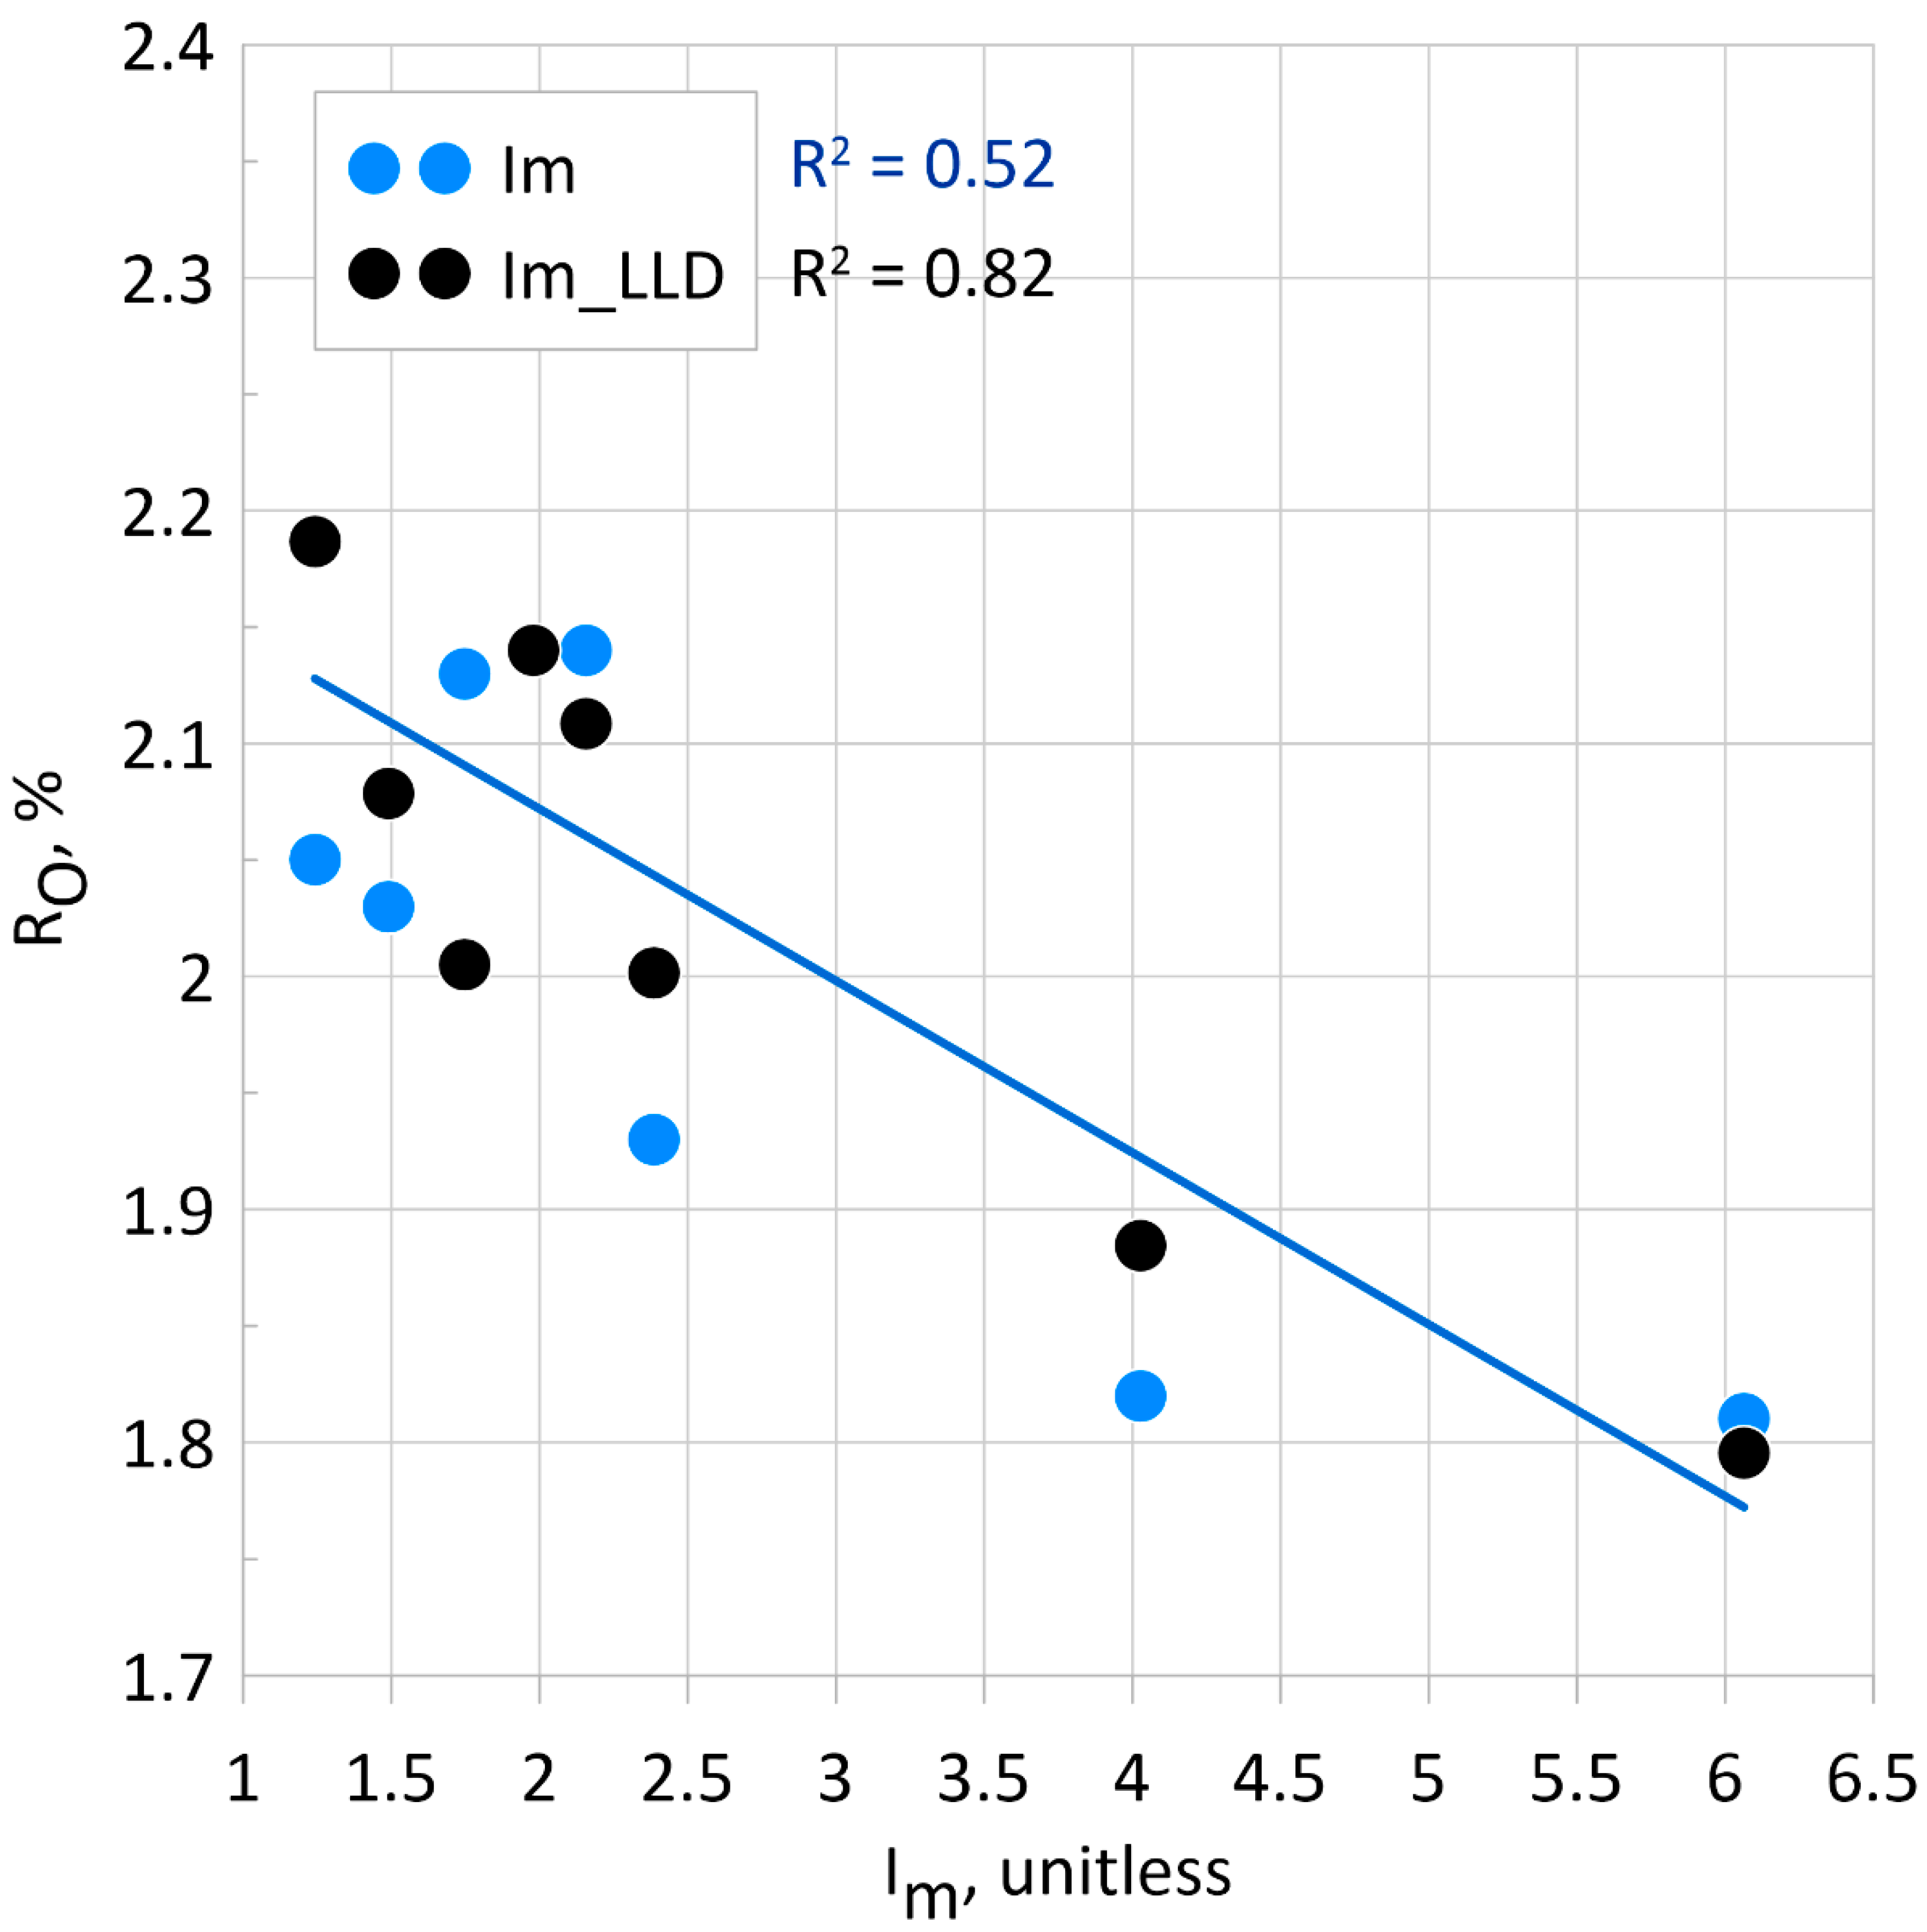
  • The use of resistivity log significantly improved the adjustment of the Im to Ro parameter. In the case of well A, the R2 coefficient increased from 0.77 to 0.94, and in the case of well B, it increased from 0.52 to 0.82. Importantly, the calculated RMSE error also decreased.
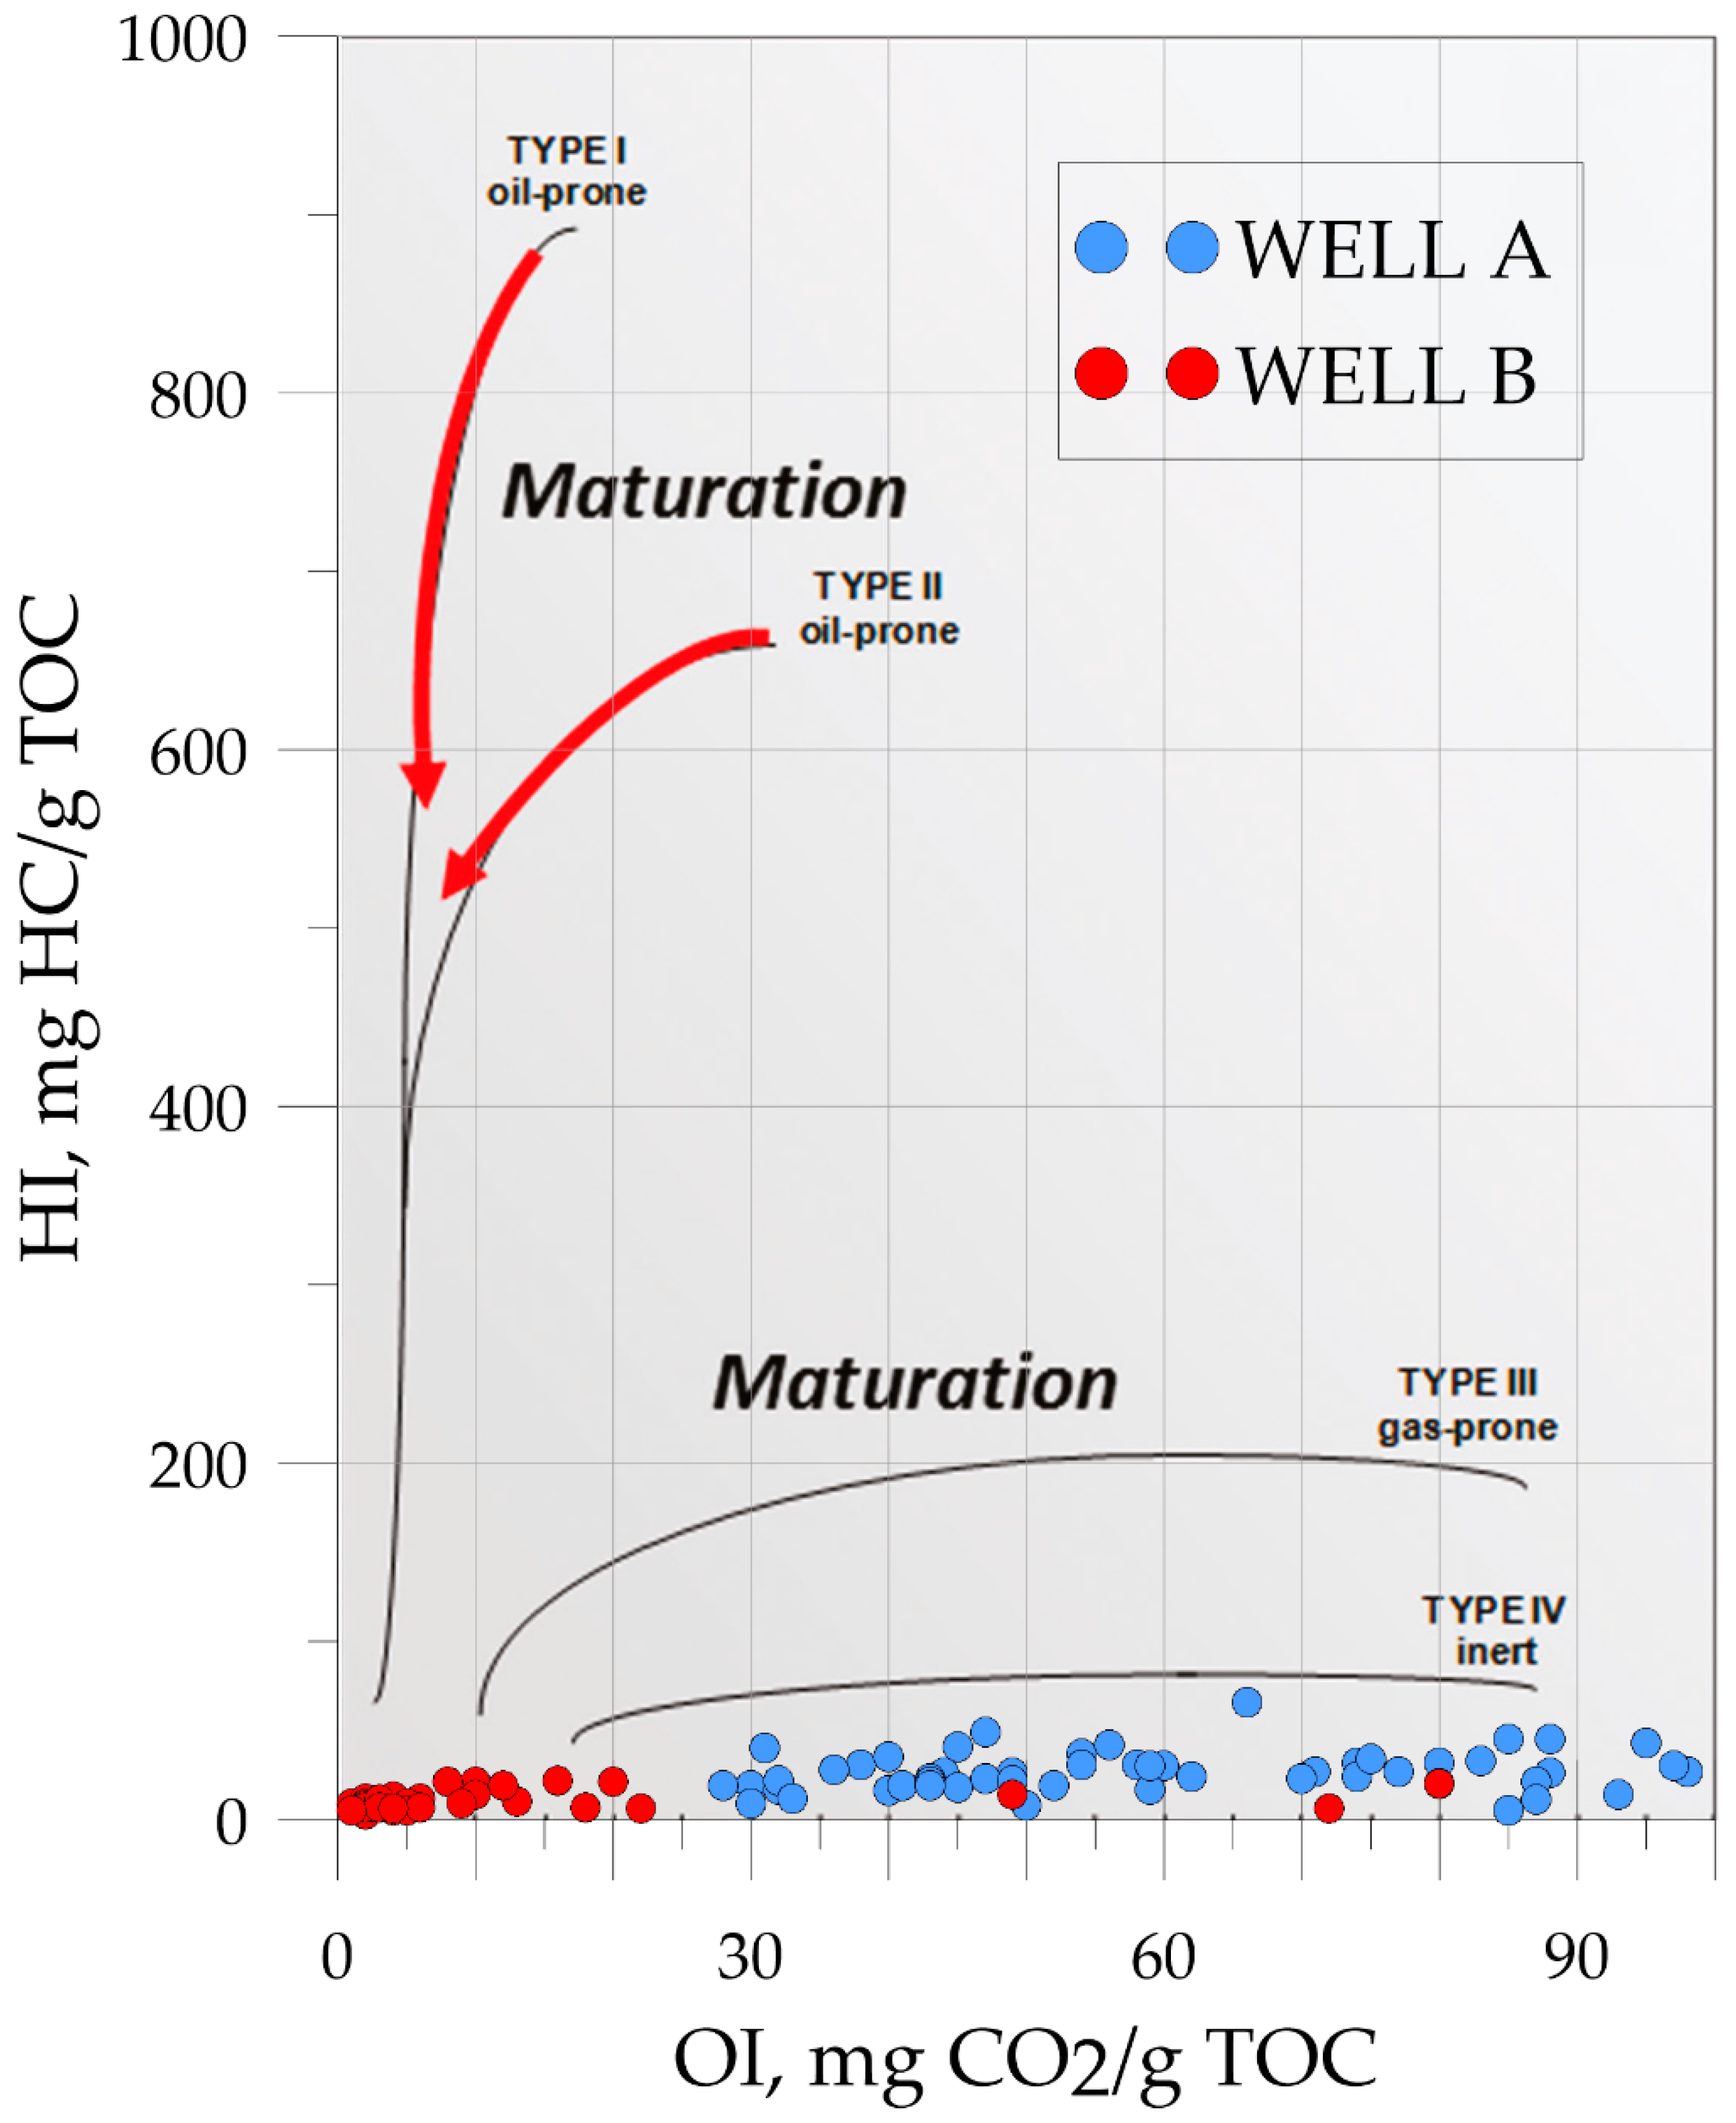
  • The methodology used was applied to two different wells. In both cases, the calculated parameters were improved. The trend shift between the measured parameters is due to the different types of kerogen in the formation.

Author Contributions

Conceptualization, S.W. and P.I.K.-M.; methodology, S.W.; software, S.W.; validation, S.W.; formal analysis, S.W.; investigation, S.W.; resources, S.W. and P.I.K.-M.; writing—original draft preparation, S.W. and P.I.K.-M.; writing—review and editing, S.W. and P.I.K.-M.; visualization, S.W. and P.I.K.-M.; supervision, P.I.K.-M.; funding acquisition, P.I.K.-M. All authors have read and agreed to the published version of the manuscript.

Funding

The publication was supported in 50% by the Faculty of Geology, Geophysics and Environmental Protection, AGH University of Science and Technology in Krakow, Poland—grant number 16.16.140.315, and in 50% by the Initiative for Excellence—Research University (IDUB) grant at AGH University of Science and Technology in Krakow, Poland.

Institutional Review Board Statement

Not applicable.

Informed Consent Statement

Not applicable.

Data Availability Statement

Restrictions apply to the availability of these data. Data were collected at the AGH University of Science and Technology, Krakow, Poland.

Acknowledgments

The authors thank Polish Oil & Gas Company for all the materials. Statistica software (StatSoft Poland) and Techlog (Schlumberger) software was available at the AGH University of Science and Technology in Kraków (Poland). We thank our colleague Marta Waliczek (Department of Fossil Fuels), Editor and Reviewers for valuable discussion.

Conflicts of Interest

The authors declare no conflict of interest.

References

  1. Sadeghtabaghi, Z.; Talebkeikhah, M.; Rabbani, A.R. Prediction of vitrinite reflectance values using machine learning techniques: A new approach. J. Pet. Explor. Prod. 2020, 11, 651–671. [Google Scholar] [CrossRef]
  2. Antariksa, G.; Muammar, R.; Lee, J. Performance evaluation of machine learning-based classification with rock-physics analysis of geological lithofacies in Tarakan Basin, Indonesia. Journal of Petroleum Science and Engineering. Available online: https://www.sciencedirect.com/science/article/abs/pii/S0920410521009050 (accessed on 24 September 2021).
  3. Gu, Y.; Zhang, D.; Lin, Y.; Ruan, J.; Bao, Z. Data-driven lithology prediction for tight sandstone reservoirs based on new ensemble learning of conventional logs: A demonstration of a Yanchang member, Ordos Basin. J. Pet. Sci. Eng. 2021, 207, 109292. [Google Scholar] [CrossRef]
  4. Bolandi, V.; Kadkhodaie-Ilkhchi, A.; Alizadeh, B.; Tahmorasi, J.; Farzi, R. Source rock characterization of the Albian Kazhdumi formation by integrating well logs and geochemical data in the Azadegan oilfield, Abadan plain, SW Iran. J. Pet. Sci. Eng. 2015, Complete, 167–176. [Google Scholar] [CrossRef]
  5. Dubois, M.K.; Bohling, G.C.; Chakrabarti, S. Comparison of four approaches to a rock facies classification problem. Comput. Geosci. 2007, 33, 599–617. [Google Scholar] [CrossRef]
  6. He, J.; La Croix, A.D.; Wang, J.; Ding, W.; Underschultz, J.R. Using neural networks and the Markov Chain approach for facies analysis and prediction from well logs in the Precipice Sandstone and Evergreen Formation, Surat Basin, Australia. Mar. Pet. Geol. 2019, 101, 410–427. [Google Scholar] [CrossRef]
  7. Horrocks, T.; Holden, E.J.; Wedge, D. Evaluation of automated lithology classification architectures using highly-sampled wireline logs for coal exploration. Comput. Geosci. 2015, 83, 209–218. [Google Scholar] [CrossRef]
  8. Shen, C.; Asante-Okyere, S.; Ziggah, Y.Y.; Wang, L.; Zhu, X. Group Method of Data Handling (GMDH) Lithology Identification Based on Wavelet Analysis and Dimensionality Reduction as Well Log Data Pre-Processing Techniques. Energies 2019, 12, 1509. [Google Scholar] [CrossRef] [Green Version]
  9. Puskarczyk, E.; Jarzyna, J.A.; Wawrzyniak-Guz, K.; Krakowska, P.I.; Zych, M. Improved recognition of rock formation on the basis of well logging and laboratory experiments results using factor analysis. Acta Geophys. 2019, 67, 1809–1822. [Google Scholar] [CrossRef] [Green Version]
  10. Pavičić, I.; Briševac, Z.; Vrbaški, A.; Grgasović, T.; Duić, Ž.; Šijak, D.; Dragičević, I. Geometric and Fractal Characterization of Pore Systems in the Upper Triassic Dolomites Based on Image Processing Techniques (Example from Žumberak Mts, NW Croatia). Sustainability 2021, 13, 7668. [Google Scholar] [CrossRef]
  11. Kadkhodaie, A.; Rezaee, R. Estimation of vitrinite reflectance from well log data. J. Pet. Sci. Eng. 2017, 148, 94–102. [Google Scholar] [CrossRef] [Green Version]
  12. Poprawa, P. Lower paleozoic oil and gas shale in the baltic-podlasie-Lublin basin (Central and Eastern Europe)—A review. Geol. Q. 2020, 64, 515–566. [Google Scholar] [CrossRef]
  13. Lis, J. Analiza sedymentologiczna drobnoziarnistych osadów górnoordowicko-dolnosylurskich basenu podlasko-lubelskiego. Przegląd Geol. 2010, 58, 259–262. [Google Scholar]
  14. Ma, L.; Taylor, K.G.; Dowey, P.J.; Courtois, L.; Gholinia, A.; Lee, P.D. Multi-scale 3D characterisation of porosity and organic matter in shales with variable TOC content and thermal maturity: Examples from the Lublin and Baltic Basins, Poland and Lithuania. Int. J. Coal Geol. 2017, 180, 100–112. [Google Scholar] [CrossRef]
  15. Poprawa, P.; Pacześna, J. Rozwój ryftu w późnym neoproterozoiku-wczesnym paleozoiku na lubelsko-podlaskim skłonie kratonu wschodnioeuropejskiego—Analiza subsydencji i zapisu facjalnego. Prz. Geol. 2002, 50, 49–63. [Google Scholar]
  16. Podhalańska, T.; Feldman-Olszewska, A.; Roszkowska-Remin, J.; Janas, M.; Pachytel, R.; Głuszyński, A.; Roman, M. Prospective zones of unconventional hydrocarbon reservoirs in the cambrian, ordovician and silurian shale formations of the East European Craton marginal zone in Poland. Geol. Q. 2020, 64, 342–376. [Google Scholar] [CrossRef]
  17. Papiernik, B.; Botor, D.; Golonka, J.; Porębski, S.J. Unconventional hydrocarbon prospects in ordovician and silurian mudrocks of the East European Craton (Poland): Insight from three-dimensional modelling of total organic carbon and thermal maturity. Ann. Soc. Geol. Pol. 2019, 89, 511–533. [Google Scholar] [CrossRef]
  18. Bojanowski, M.J.; Kędzior, A.; Porębski, S.J.; Radzikowska, M. Origin and significance of early-diagenetic calcite concretions and barite from Silurian black shales in the East European Craton, Poland. Acta Geol. Pol. 2019, 69, 403–430. [Google Scholar] [CrossRef]
  19. Puskarczyk, E. Application of multivariate statistical methods and artificial neural network for facies analysis from well logs data: An example of Miocene deposits. Energies 2020, 13, 1548. [Google Scholar] [CrossRef] [Green Version]
  20. Shalaby, M.R.; Malik, O.A.; Lai, D.; Jumat, N.; Islam, M.A. Thermal maturity and TOC prediction using machine learning techniques: Case study from the Cretaceous–Paleocene source rock, Taranaki Basin, New Zealand. J. Pet. Explor. Prod. Technol. 2020, 10, 2175–2193. [Google Scholar] [CrossRef]
  21. Abarghani, A.; Ostadhassan, M.; Bubach, B.; Zhao, P. Estimation of thermal maturity in the Bakken source rock from a combination of well logs, North Dakota, USA. Mar. Pet. Geol. 2019, 105, 32–44. [Google Scholar] [CrossRef]
  22. Medellin, D.; Eghbali, A.; Wang, Y.; Torres-Verdín, C. Pore-size-dependent fluid substitution method for improved estimation of nmr porosity, permeability, and relaxation times. In Proceedings of the SPWLA 60th Annual Logging Symposium Transactions, The Woodlands, TX, USA, 15–19 June 2019; pp. 1–6. [Google Scholar] [CrossRef]
  23. Hussein, H.S.; Abdula, R.A. Multiple linear regression approach for the vitrinite reflectance estimation from well logs: A case study in Sargelu and Naokelekan Formations—Shaikhan-2 Well, Shaikhan oil field, Iraq. Egypt. J. Pet. 2018, 27, 1095–1102. [Google Scholar] [CrossRef]
  24. Sheikh, N.; Giao, P.H. Evaluation of shale gas potential in the Lower Cretaceous Sembar Formation, the Southern Indus Basin, Pakistan. J. Nat. Gas Sci. Eng. 2017, 44, 162–176. [Google Scholar] [CrossRef]
  25. Cheshire, S.; Craddock, P.R.; Xu, G.; Sauerer, B.; Pomerantz, A.E.; McCormick, D.; Abdallah, W. Assessing thermal maturity beyond the reaches of vitrinite reflectance and Rock-Eval pyrolysis: A case study from the Silurian Qusaiba formation. Int. J. Coal Geol. 2017, 180, 29–45. [Google Scholar] [CrossRef]
  26. Goodarzi, F.; Norford, B.S. Graptolites as indicators of the temperature histories of rocks. J. Geol. Soc. 1985, 142, 1089–1099. [Google Scholar] [CrossRef]
  27. Goodarzi, F. Organic petrography of graptolite fragments from Turkey. Mar. Pet. Geol. 1984, 1, 202–210. [Google Scholar] [CrossRef]
  28. Ferreiro Mählmann, R.; Le Bayon, R. Vitrinite and vitrinite like solid bitumen reflectance in thermal maturity studies: Correlations from diagenesis to incipient metamorphism in different geodynamic settings. Int. J. Coal Geol. 2016, 157, 52–73. [Google Scholar] [CrossRef]
  29. Petersen, H.I.; Schovsbo, N.H.; Nielsen, A.T. Reflectance measurements of zooclasts and solid bitumen in Lower Paleozoic shales, southern Scandinavia: Correlation to vitrinite reflectance. Int. J. Coal Geol. 2013, 114, 1–18. [Google Scholar] [CrossRef]
  30. Jacob, H. Classification, structure, genesis and practical importance of natural solid oil bitumen (“migrabitumen”). Int. J. Coal Geol. 1989, 11, 65–79. [Google Scholar] [CrossRef]
  31. Bertrand, R.; Malo, M. Dispersed Organic Matter Reflectance and Thermal Maturation in Four Hydrocarbon Exploration Wells in the Hudson Bay Basin: Regional Implications; Open File 7066; Geological Survey of Canada: Ottawa, BC, Canada, 2012; 52p. [Google Scholar] [CrossRef]
  32. Radke, M.; Welte, D.H.; Willsch, H. Maturity parameters based on aromatic hydrocarbons: Influence of the organic matter type. Org. Geochem. 1986, 10, 51–63. [Google Scholar] [CrossRef]
  33. Radke, M. Organic geochemistry of aromatic hydrocarbons. In Advances in Petroleum Geochemistry; Brooks, J., Welte, D.H., Eds.; Academic Press: London, UK, 1987; pp. 141–207. ISBN 978-0-12-032001-1. [Google Scholar]
  34. Zhao, P.; Ostadhassan, M.; Shen, B.; Liu, W.; Abarghani, A.; Liu, K.; Luo, M.; Cai, J. Estimating thermal maturity of organic-rich shale from well logs: Case studies of two shale plays. Fuel 2019, 235, 1195–1206. [Google Scholar] [CrossRef]
  35. Botor, D.; Kotarba, M.; Kosakowski, P. Petroleum generation in the Carboniferous strata of the Lublin Trough (Poland): An integrated geochemical and numerical modelling approach. Org. Geochem. 2002, 33, 461–476. [Google Scholar] [CrossRef]
  36. Kufrasa, M.; Krzywiec, P.; Gągała, Ł.; Mazur, S.; Mikołajczak, M. Sequence of deformation at the front of an orogen: Lublin basin case study (Poland). J. Struct. Geol. 2020, 141, 104211. [Google Scholar] [CrossRef]
  37. Kozłowska, A.; Waksmundzka, M.I. Diagenesis, sequence stratigraphy and reservoir quality of the Carboniferous deposits of the southeastern Lublin Basin (SE Poland). Geol. Q. 2020, 64, 422–459. [Google Scholar] [CrossRef]
  38. Poprawa, P. Geological setting and ediacaran–palaeozoic evolution of the western slope of the east european craton and adjacent regions. Ann. Soc. Geol. Pol. 2019, 89, 347–380. [Google Scholar] [CrossRef] [Green Version]
  39. Papiernik, B.; Michna, M. Methodology and results of digital mapping and 3d modelling of the lower palaeozoic strata on the East European Craton, Poland. Ann. Soc. Geol. Pol. 2019, 89, 405–427. [Google Scholar] [CrossRef] [Green Version]
  40. Kufrasa, M.; Stypa, A.; Krzywiec, P.; Słonka, Ł. Late Carboniferous thin-skinned deformation in the Lublin Basin, SE Poland: Results of combined seismic data interpretation, structural restoration and subsidence analysis. Ann. Soc. Geol. Pol. 2019, 89, 175–194. [Google Scholar] [CrossRef] [Green Version]
  41. Porębski, S.J.; Podhalańska, T. Ordovician–silurian lithostratigraphy of the east european craton in Poland. Ann. Soc. Geol. Pol. 2019, 89, 95–104. [Google Scholar] [CrossRef] [Green Version]
  42. Podhalańska, T. Graptolite biostratigraphy and dating of the ordovician–silurian shale succession of the sw slope of the east european craton. Ann. Soc. Geol. Pol. 2019, 89, 429–452. [Google Scholar] [CrossRef] [Green Version]
  43. Bator, D.; Golonka, J.; Zając, J.; Papiernik, B.; Guzy, P. Petroleum generation and expulsion in the Lower Palaeozoic petroleum source rocks at the SW margin of the East European Craton (Poland). Ann. Soc. Geol. Pol. 2019, 89, 153–174. [Google Scholar] [CrossRef] [Green Version]
  44. Tissot, B.P.; Welte, D.H. Sedimentary Processes and the Accumulation of Organic Matter. In Petroleum Formation and Occurrence; Springer: Berlin/Heidelberg, Germany, 1978; pp. 55–62. [Google Scholar]
  45. Hart, B.S.; Steen, A.S. Programmed pyrolysis (Rock-Eval) data and shale paleoenvironmental analyses: A review. Interpretation 2015, 3, SH41–SH58. [Google Scholar] [CrossRef]
  46. ASTM D7708-14. Standard Test Method for Microscopical Determination of the Reflectance of Vitrinite Dispersed in Sedimentary Rocks; ASTM: West Conshohocken, PA, USA, 2014. [Google Scholar]
  47. Espitalie, J.; Deroo, G.; Marquis, F. La pyrolyse Rock-Eval et ses applications. Première partie. Rev. l’Institut Français du Pétrole 1985, 40, 563–579. [Google Scholar] [CrossRef]
  48. Kiersnowski, H.; Dyrka, I. Ordovician-Silurian shale gas resources potential in Poland: Evaluation of Gas Resources Assessment Reports published to date and expected improvements for 2014 forthcoming Assessment. Przegląd Geol. 2013, 61, 354–373. [Google Scholar]
  49. Serra, O. Well Logging Handbook, 1st ed.; TECHNIP: Paris, France, 2008; ISBN 978-2-7108-0912-8. [Google Scholar]
  50. Ellis, D.V.; Singer, J.M. Basic Nuclear Physics for Logging Applications: Gamma Rays. Well Logging Earth Sci. 2007, 247–266. [Google Scholar] [CrossRef]
  51. Marsal, D.; Merriam, D.F. Statistics for Geoscientists; Elsevier: Amsterdam, The Netherlands, 1987; p. 176. [Google Scholar]
  52. Freund, R.J.; Wilson, W.J.; Sa, P. Regression Analysis. Statiscal Modeling of a Response Variable; Singer, T., Ed.; Elsevier Academic Press: Amsterdam, The Netherlands, 2006; ISBN 9780120885978. [Google Scholar]
  53. Kohonen, T. Self-Organized Formation of Topologically Correct Feature Maps. Biol. Cybern 1982, 43, 59–69. [Google Scholar] [CrossRef]
  54. Alizadeh, B.; Najjari, S.; Kadkhodaie-Ilkhchi, A. Artificial neural network modeling and cluster analysis for organic facies and burial history estimation using well log data: A case study of the South Pars Gas Field, Persian Gulf, Iran. Comput. Geosci. 2012, 45, 261–269. [Google Scholar] [CrossRef]
  55. Puskarczyk, E. Artificial neural networks as a tool for pattern recognition and electrofacies analysis in Polish palaeozoic shale gas formations. Acta Geophys. 2019, 67, 1991–2003. [Google Scholar] [CrossRef] [Green Version]
  56. Chang, H.C.; Kopaska-Merkel, D.C.; Chen, H.C. Identification of lithofacies using Kohonen self-organizing maps. Comput. Geosci. 2002, 28, 223–229. [Google Scholar] [CrossRef]
  57. Schmoker, J.W. Determination of Organic Content of Appalachian Devonian Shales from Formation-Density Logs: GEOLOGIC NOTES. Am. Assoc. Pet. Geol. Bull. 1979, 63, 1504–1509. [Google Scholar] [CrossRef]
  58. Passey, Q.R.; Creaney, S.; Kulla, J.B.; Moretti, F.J.; Stroud, J.D. A practical model for organic richness from porosity and resistivity logs. Am. Assoc. Pet. Geol. Bull. 1990, 74, 1777–1794. [Google Scholar]
  59. Waszkiewicz, S.; Karczewski, J.; Krakowska, P.; Jarzyna, J. Wyznaczanie całkowitej zawartości węgla organicznego TOC w skałach łupkowych z wykorzystaniem profilowań geofizyki otworowej na przykładzie danych z basenu bałtyckiego. Nafta-Gaz 2018, 74, 789–795. [Google Scholar] [CrossRef]
  60. Kethireddy, N.; Chen, H.; Heidari, Z. Quantifying the Effect of Kerogen on Resistivity Measurements in Organic-Rich Mudrocks. Petrophysics SPWLA J. Form. Eval. Reserv. Descr. 2014, 55, 136–146. [Google Scholar]
  61. Dabidian, N.; Heidari, Z.; Yang, A. Quantifying the impact of thermal maturity on dielectric permittivity of pure kerogen in organic-rich mudrocks. In Proceedings of the SPE/AAPG/SEG Unconventional Resources Technology Conference 2016, San Antonio, TX, USA, 1 August 2016; pp. 1–3. [Google Scholar] [CrossRef]
  62. Wood, D.A. Thermal maturity and burial history modelling of shale is enhanced by use of Arrhenius time-temperature index and memetic optimizer. Petroleum 2018, 4, 25–42. [Google Scholar] [CrossRef]
  63. Waliczek, M.; Machowski, G.; Poprawa, P.; Świerczewska, A.; Więcław, D. A novel VRo, Tmax, and S indices conversion formulae on data from the fold-and-thrust belt of the Western Outer Carpathians (Poland). Int. J. Coal Geol. 2021, 234, 103672. [Google Scholar] [CrossRef]
  64. Yang, A.; Firdaus, G.; Heidari, Z. Electrical resistivity and chemical properties of kerogen isolated from organic-rich mudrocks. Geophysics 2016, 81, D643–D655. [Google Scholar] [CrossRef]
Figure 1. Oil and gas generation areas in the Silurian and Ordovician deposits [48] (modified).
Energies 14 06182 g001
Figure 2. Flowchart of analyses for continuous Ro estimation.
Energies 14 06182 g002
Figure 3. Cross plot of S2 against TOC with kerogen quality diagram.
Energies 14 06182 g003
Figure 4. Cross plot of HI against OI with modified Van Krevelen diagram [45].
Energies 14 06182 g004
Figure 5. Average values of standardized well logging data in a division into three clusters. Colors differentiate the number of clusters. GR (API)—natural gamma-ray log, LLD (ohmm)—deep resistivity log, LLS (ohmm)—shallow resistivity log, NPHI (%)—neutron porosity, RHOB (g/cm3)—bulk density log, DT (μs/m)—compressional wave slowness log.
Energies 14 06182 g005
Figure 6. Relationship between DT and TOC measured on Rock-Eval pyrolysis (WELL A—blue dots, WELL B—black dots).
Energies 14 06182 g006
Figure 7. Cross plot of Ro and calculated Im and improved Im for well B.
Energies 14 06182 g007
Figure 8. Cross plot of Ro and calculated Im and improved Im for Well A.
Energies 14 06182 g008
Figure 9. The conventional well logs, computed facies, and estimated TOC and Ro in WELL A. CALI (mm)—measurement of well diameter, BS (mm)—bit size, GR (API)—natural gamma-ray log, LLD (ohmm)—deep resistivity log, LLS (ohmm)—shallow resistivity log, NPHI (%)—neutron porosity, RHOB (g/cm3)—bulk density log, DT (μs/m)—compressional wave slowness log. K-SR-5 clusters computed with k-mean algorithm; SOM-5 clusters computed with self-organizing map.
Energies 14 06182 g009
Figure 10. The conventional well logs, computed facies and estimated TOC and Ro in WELL B. Symbol descriptions the same as in Figure 9.
Energies 14 06182 g010
Table 1. Responses of thermal neutron log (DSN-II) of minerals.
MineralResponses (p.u.)
Quartz−1
Dolomite0.9
Calcite0
Pyrite−1.7
Illite9–10
Kaolinite45
ChloriteApproximately 45
Kerogen65
Table 2. Ro, TOC, and petrophysical parameters of wells.
WELLDEPTH (m)Ro(%)TOC (%)Clay (wt%)Porosity (%)
WELL AX413.011.370.6347.25.32
X446.741.470.3862.43.96
X459.301.460.5456.04.17
X463.371.510.5557.46.97
X470.971.460.7254.64.88
X476.221.410.4351.53.84
X562.911.530.5553.86.46
X590.201.480.9353.55.68
X623.141.670.6249.36.00
X642.081.560.9357.84.13
X665.131.600.8150.33.85
average1.500.6454.05.02
WELL BX603.002.090.2659.57.75
X614.532.180.1561.18.56
X819.001.820.4332.50.73
X829.021.810.7143.51.83
X831.711.930.6443.11.47
X161.002.141.2946.62.58
X283.542.430.1428.40.36
average2.060.5245.03.36
Table 3. Statistics of measured and calculated TOC.
WELLTOC Measured (%)TOC Calculated (%)
AverageMinMaxAverageMinMax
Well A0.51 ± 0.170.090.930.53 ± 0.160.131.12
Well B0.56 ± 0.850.0211.50.49 ± 0.77011.23
Table 4. Statistics of measured and calculated Ro.
WELLRo Measured (%)Ro Calculated (%)
AverageMinMaxAverageMinMax
Well A1.47 ± 0.121.201.671.48 ± 0.061.291.72
Well B2.09 ± 0.171.822.182.04 ± 0.081.692.28
Publisher’s Note: MDPI stays neutral with regard to jurisdictional claims in published maps and institutional affiliations.

