Article

Evaporation Heat Transfer and Pressure Drop of Low-Global Warming Potential Refrigerant HFO-1234yf in 6.95-mm Horizontal Smooth Tube

1
Department of Refrigeration and Air-Conditioning Engineering, College of Engineering, PuKyong National University, Busan 48513, Korea
2
R&D Division Institute, LG Electronics Inc., Masan 51722, Korea
*
Author to whom correspondence should be addressed.
Energies 2021, 14(19), 6325; https://doi.org/10.3390/en14196325
Submission received: 15 August 2021 / Revised: 15 September 2021 / Accepted: 28 September 2021 / Published: 3 October 2021
(This article belongs to the Special Issue Heat Exchangers: Cooling and Heating Systems)

Abstract

:
This study investigated the evaporative heat transfer coefficient and pressure drop characteristics of R-1234yf in a horizontal tube with an inner diameter of 6.95 mm under various experimental conditions. The heat transfer coefficient increased with an increase in quality but showed a sharp decrease in the high-quality area. In addition, the heat transfer coefficient increased as the mass flux, heat flux, and saturation temperature increased. Although R-1234yf and R-134a presented similar heat transfer coefficients, that of R-134a was higher. The pressure drop increased with an increase in the quality and mass flux but decreased with an increase in the saturation temperature. The pressure drop of R-134a was larger than that of R-1234yf. In light of the flow pattern diagram by Taitel and Dukler, most of the experiments were included in the annular flow region, and some regions showed intermittent and stratified corrugated flow regions. Kandlikar’s heat transfer coefficient correlation provided the best prediction for the experimental database, with approximately 84% of the predicted data within ±30%. Moreno Quibén and Thome’s equation for pressure drop predicted approximately 88.71% of the data within ±30%.

1. Introduction

Hydrochlorofluorocarbons (HCFCs) and hydrofluorocarbons (HFCs) have been widely used as refrigerants for refrigeration and air-conditioning systems owing to their excellent thermodynamic and chemical stability. However, as the interest in environmental protection increases, HCFCs and HFCs are being regulated because of their high global warming potential. As the regulations on the production and use of these refrigerants are becoming increasingly stringent worldwide, low-global warming potential (GWP) refrigerants, such as hydrofluroolefin (HFO), are attracting attention. In the case of HFO-based refrigerants, the physical properties are similar to those of conventional refrigerants, but their effects on the environment are similar to those of natural refrigerants. The working fluid in this study, R-1234yf, has thermodynamic properties similar to those of R-134a, so it is attracting attention as a replacement refrigerant for R134a. Upon comparing the GWP of the two refrigerants, R-134a has a value of 1430, and is thus classified as a regulated target, whereas R-1234yf has a value of 4. Since conversion to low-GWP refrigerants is important, research on such compounds is essential and is being widely conducted.
In conventional studies on the heat transfer of R-1234yf, Illán-Gómez et al. [1] first studied the condensation heat transfer between R-1234yf and R-134a in a minichannel with an inner diameter of 1.16 mm. It was revealed that R-134 has a higher heat transfer coefficient than R-1234yf. Padiila et al. [2] analyzed the evaporative heat transfer of R-1234yf and R-134a in straight pipes with inner diameters of 7.90 and 10.85 mm. The authors reported no significant difference between the two refrigerants. Saitoh et al. [3] experimentally analyzed the evaporative heat transfer coefficient of R-1234yf in a smooth tube with an inner diameter of 2 mm. Mortada et al. [4] conducted a study on the evaporative heat transfer coefficient and pressure drop of R-1234yf and R-134a in a 1.1 mm inner diameter of a minichannel. As a result, the local heat transfer coefficient was independent of the heat flux, but largely depended on the quality and mass flux. It was determined that R-1234yf has a higher local heat transfer coefficient than R-134a. Lu et al. [5] studied the effect of heat flux and mass flux on the two-phase convective evaporative heat transfer coefficients of R-1234yf and R-134a in a horizontal tube with an inner diameter of 3.9 mm. The results revealed that R-134a and R-1234yf showed a similar trend, and the difference in the heat transfer coefficient between them was very small. The pressure drop of R-134a has been reported to be approximately 5–15% higher than that of R-1234yf. Diani et al. [6] conducted a study on the evaporative heat transfer of R-1234yf and R-134a inside a mini microfin tube. As a result, it was reported that R-134a had a higher heat transfer coefficient and a higher pressure drop than R-1234yf. Choi et al. [7] analyzed experimental data of the evaporative heat transfer coefficient of R-1234yf in horizontal tubes with inner diameters of 1.5 and 3.0 mm. The experimental results showed that the heat transfer coefficient increased with an increase in the heat flux because the nuclei boiling was much stronger in the low-quality region. It was also reported that the heat transfer coefficient increased as the saturation temperature increased and the inner tube diameter decreased. Sempértegui-Tapia et al. [8] studied the evaporative heat transfer of R-1234yf and R-134a in a microchannel with an inner diameter of 1.1 mm. It was observed that the heat transfer coefficient increased when the heat flux increased and the nuclear boiling effect was dominant, while the heat transfer coefficient increased when the mass flow rate increased and the convection effect was dominant. In addition, it was revealed that the heat transfer coefficients of R-134a and R-1234yf were similar. Kedzierski et al. [9] studied the local convective heat transfer of R-1234yf and R-134a in microfin tubes with an inner diameter of 8.8 mm. The comparison results showed that the heat transfer performance of R-1234yf was 5% lower than that of R-134a. Pabon et al. [10] conducted an experimental study on the pressure drop of R-1234yf in a smooth tube with an inner diameter of 3.2–8.0 mm. It was reported that the two-phase pressure gradient of R-1234yf was approximately 20% lower than that of R-134a. Other research on the heat transfer and pressure drop of R-1234yf is summarized in Table 1.
Most previous studies on the heat transfer of R-1234yf [11,12,13,14,15,16,17,18,19] were conducted with small diameters; as such, the research data on evaporative heat transfer at 5 mm or less are insufficient. Therefore, to be applicable in households and small refrigerators, this study analyzes the heat transfer coefficient and pressure drop of R-1234yf in a double-tube heat exchanger with an inner diameter of 6.95 mm.

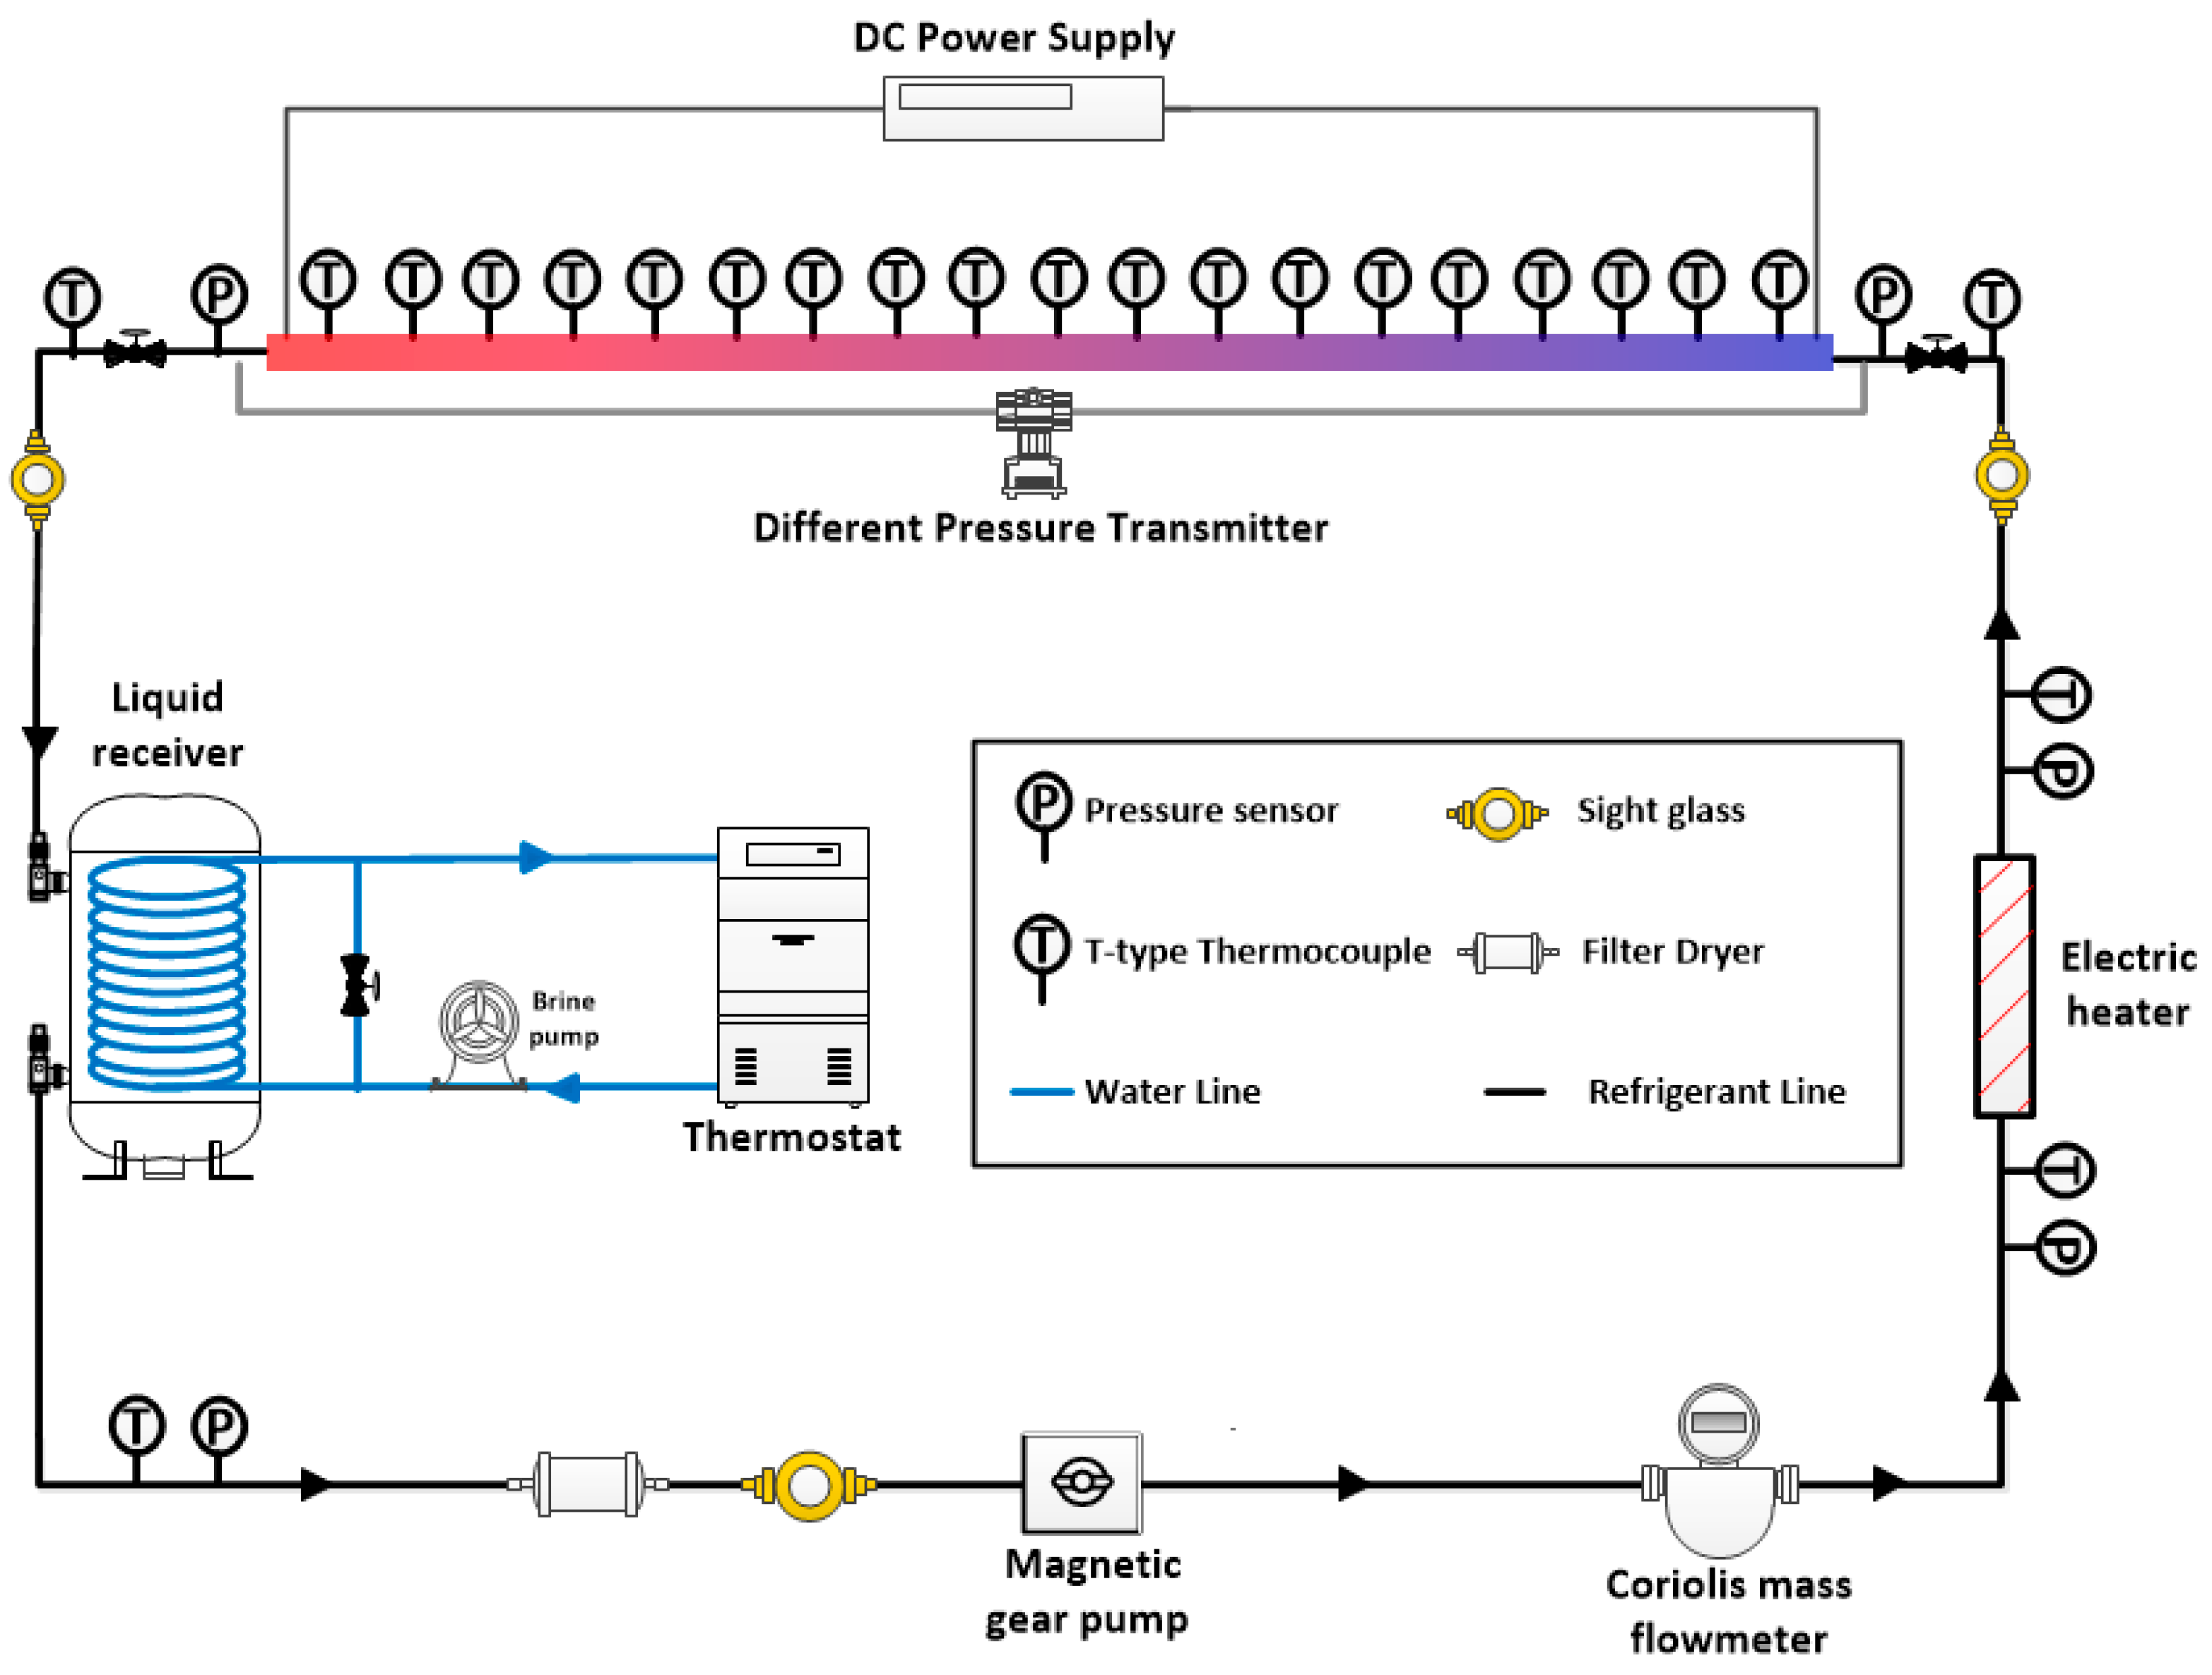
2. Experimental Apparatus and Conditions

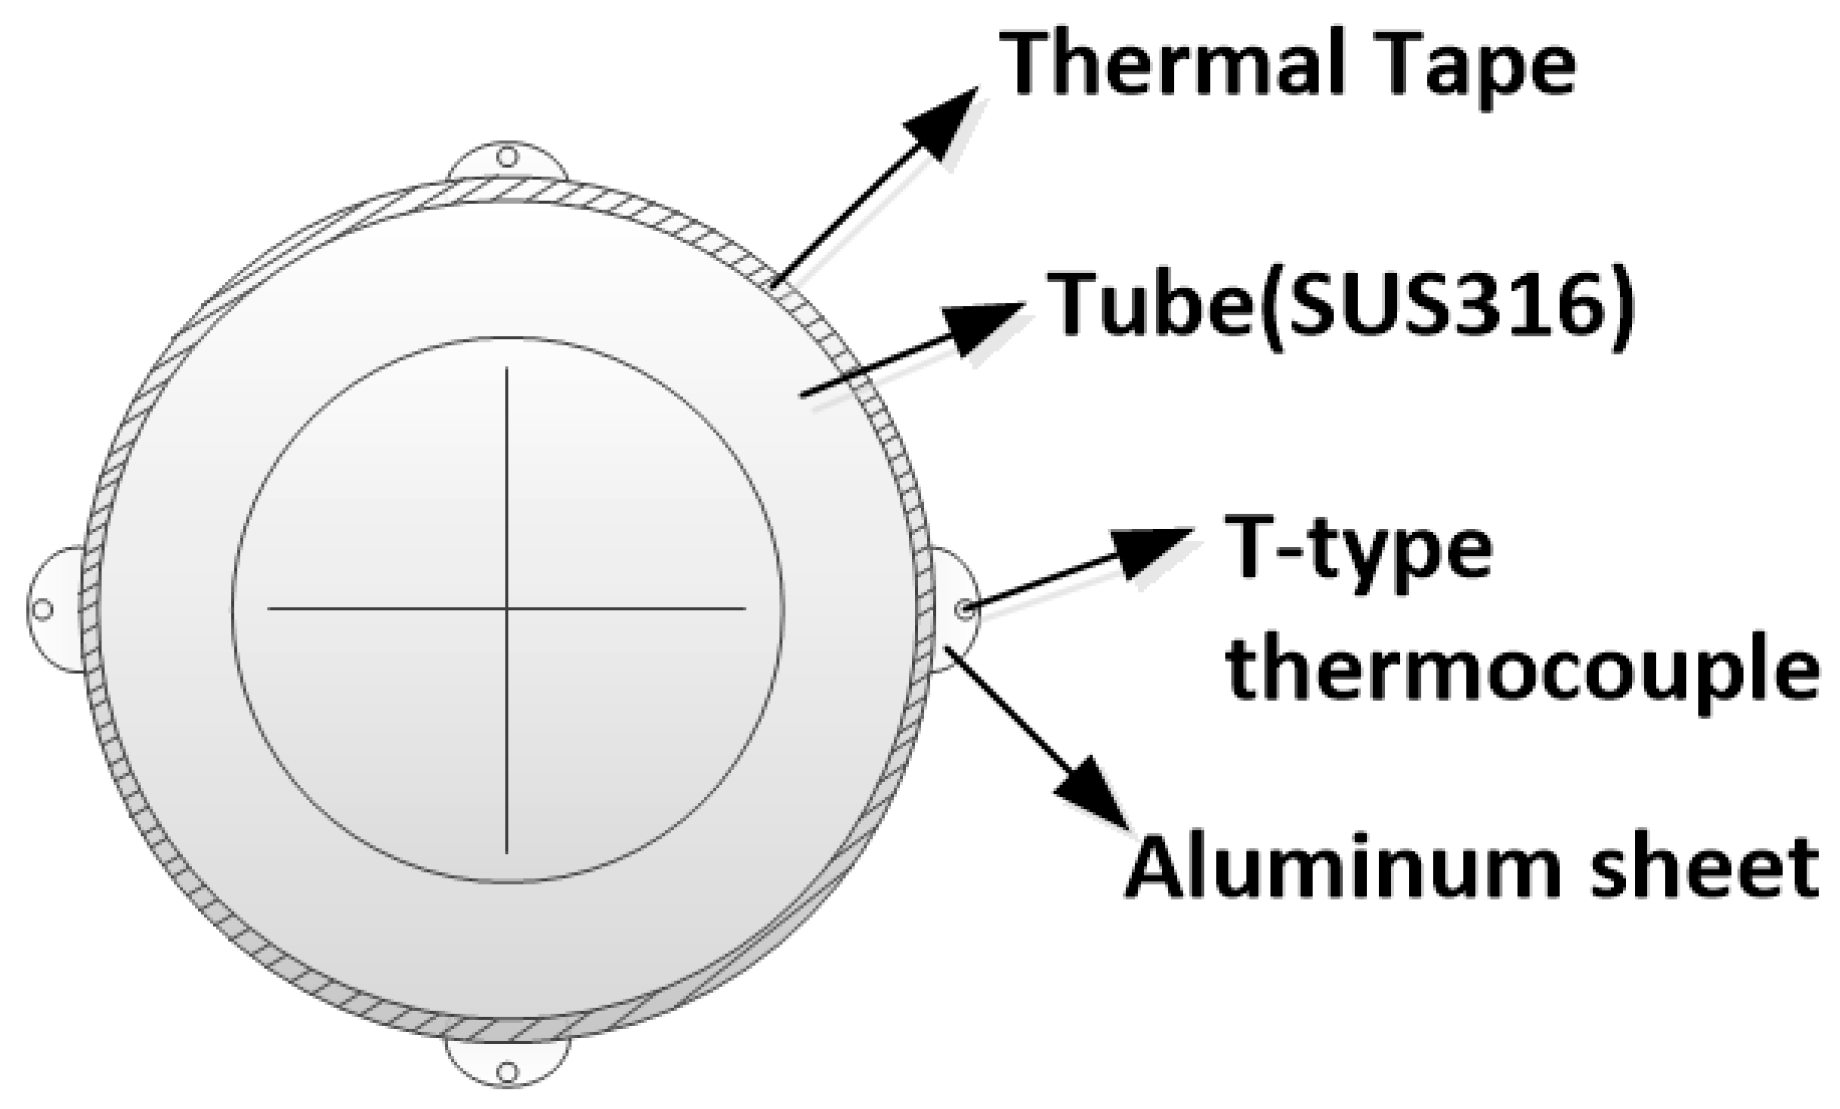
2.1. Experimental Apparatus

A schematic diagram of the experimental apparatus is shown in Figure 1. There were two main loops using refrigerants and brine. The refrigerant loop consisted of a receiver and an inserted heat exchanger, a plate heat exchanger, a magnetic gear pump, a mass flow meter, a preheater, and a test section. The brine loop included a brine pump and a thermostat. In the refrigerant loop, the refrigerant was cooled to a subcooled state in the heat exchanger inserted into the receiver and the plate heat exchanger at the front of the receiver, and then discharged through the gear pump and passed through a mass flow meter. Subsequently, the inlet quality conditions were adjusted through the preheater, and finally, the refrigerant entered the test section. At this time, the quality of the refrigerant at the inlet of the test section was evaluated relative to saturated liquid line (quality = 0). The brine loop consisted of a thermostat, pump, and mass flow meter. The brine cooled by the thermostat circulated within the electric heater unit, and as a result, the temperature of the brine became constant.
The temperatures of the refrigerant and cooling water were measured using an insert type T-type thermocouple. To measure the flow rate of the refrigerant, a Coriolis mass flow meter was used at the rear end of the magnetic gear pump, and a turbine mass flow meter was used for the cooling water. In addition, there were two types of pressure sensors in the entire experimental apparatus: an absolute pressure gauge and a differential pressure gauge. Absolute pressure gauges were installed at both ends of the test section to measure the absolute pressure. A differential pressure gauge was installed at both ends of the test section to measure the pressure drop therein. Because the differential pressure of the test section was small compared with the system pressure, it was difficult to accurately measure the pressure difference of the absolute pressure gauge. Therefore, the pressure drop of the refrigerant was precisely measured using a differential pressure gauge. In addition, it was not possible to connect a pressure sensor to every subsection due to electrical insulation, so the pressure drop of each subsection was assumed to be linear. For the amount of heat supplied to the preheater, the amount of heat applied to the refrigerant was measured using a power meter (WT-210).
Figure 2 presents a detailed schematic of the test section. The subsection was 15 cm in length and consisted of a total of 20 sections. The total length of the test section was 3 m; it was designed to be long enough to obtain high-quality data at low heat flux. The resistivity of the SUS 316 tube used in the test section was 740 nΩ·m, the thermal conductivity was 13.4 W/m·K at 300 K, the outer diameter was 9.25 mm, and the inner diameter was 6.95 mm. Because the voltage was directly applied to the test part, insulating fittings were used at both ends of the test section. In addition, by using a glass fiber insulation material and rubber foam insulation material double insulation, heat generation to the outside was prevented. Figure 3 presents a detailed cross-sectional view of the test part. In principle, the thermocouple had to be electrically insulated from the test section, and the difference between the wall temperature and the measured temperature had to be small. Therefore, a thermal tape, which had high thermal conductivity and which served as an electrical insulator, was used to satisfy the above two conditions. All data were collected for 15 min at 1-s intervals after reaching a steady state. The data were transmitted and recorded to a computer through a data logger, and the standard for a steady-state was a temperature ±0.1 °C, pressure ±10 kPa, and mass flow ±0.2 kg/s.

2.2. Experimental Conditions

In this study, the heat transfer coefficient and pressure drop of the refrigerant were measured by changing the heat flux, mass flux, and saturation temperature. The heat transfer coefficient and pressure drop according to the change in quality were investigated in the mass flow rate range of 100–400 kg/m2s, heat flux of 6–24 kW/m2, and saturation temperature of 5 °C and 10 °C. Because R-1234yf, the working fluid of the experiment, is an air-conditioning refrigerant, the saturation temperature range was set at 5 °C and 10 °C for the experiment. The experimental conditions are presented in Table 2.

3. Data Reduction

3.1. Heat Transfer Coefficient

The thermophysical properties of R-1234yf were calculated using REFPROP (Ver 8.0) [20]. The heat transfer coefficient and pressure drop were calculated from the temperature and pressure of the refrigerant at each point obtained in the experiment using Equations (1)–(10).
The amount of heat transferred to the test section is the amount of heat supplied by the DC power supply and is calculated using Joule’s law.
Q = η · V · I
Q (kW) is the amount of heat applied to the test part, V is the voltage, and I is the current. η is the thermal efficiency of the electric heater in the test section, with a value of 0.89 for single-phase experimental tests. Figure 4 shows the thermal efficiency of the test section for a single-phase test.
The heat flux q (kW/m2) was calculated by dividing the heat transfer area by the calculated heat quantity.
q = Q π D i L
The temperature of the outer wall surface of the tube measured for each test section was used as the average value of the upper, lower, left, and right parts, as shown in Figure 3.
T w o = T t o p + T b o t t o m + T l e f t + T r i g h t 4
Because the temperature of the inner wall surface of the tube is unknown, the temperature of the inner wall surface of the pipe must be calculated indirectly. The heat is generated uniformly in the test section, which is an isotropic material, and because it is thermally and electrically uniform, the temperature of the inner wall of the tube is obtained indirectly by using the one-dimensional heat conduction equation as follows.
T w i = q ˙ r o 2 4 k [ 1 ( r i r o ) 2 ] + q ˙ r o 2 2 k ln ( r i r o ) + T w o
Then, the heat transfer coefficient was calculated from the temperature of the inner wall of the tube, the saturation temperature of the refrigerant, and the heat flux.
h = q T w i T s a t
The quality is defined by the following equation, and the specific enthalpy at each point is calculated by multiplying the heat transfer area from the inlet enthalpy to the measurement point of the heat flux and then dividing the mass flux.
x = i i l , s a t i l v
i = i i n + q · π · D i · L m e a s u r e d G

3.2. Pressure Drop

The pressure drop of the fluid flowing through the phase change inside the pipe is expressed as the sum of the three terms. Pressure drop due to static pressure (∆Pstatic), momentum (∆Pmomentum), and friction (∆Pfriction). The equation below expresses the total pressure drop:
P t o t a l = P s t a t i c + P m o m e n t u m + P f r i c t i o n
Because the measured value is the total pressure drop (∆Ptotal), and the value to be analyzed in this study is the pressure drop due to friction, two terms must be subtracted from the measured pressure drop. In addition, as the experiment was conducted in the range above the saturated point, the influence of the single-phase pressure drop can be ignored.
First, ΔPstatic = 0 because there is no pressure loss due to the static pressure head in the horizontal pipe flow. The pressure drop due to momentum was calculated as follows [21]:
P m o m e n t u m = G 2 [ { ( 1 x ) 2 ρ l ( 1 α ) + x 2 ρ v α } o u t { ( 1 x ) 2 ρ l ( 1 α ) + x 2 ρ v α } i n
Here, the void fraction, α was calculated as follows [22].
α = x ρ g [ ( 1 + 0.12 ( 1 x ) ) ( x ρ g + 1 x ρ l ) + 1.18 ( 1 x ) { g σ ( ρ l ρ g ) } 0.25 G 2 ρ l 0.5 ] 1

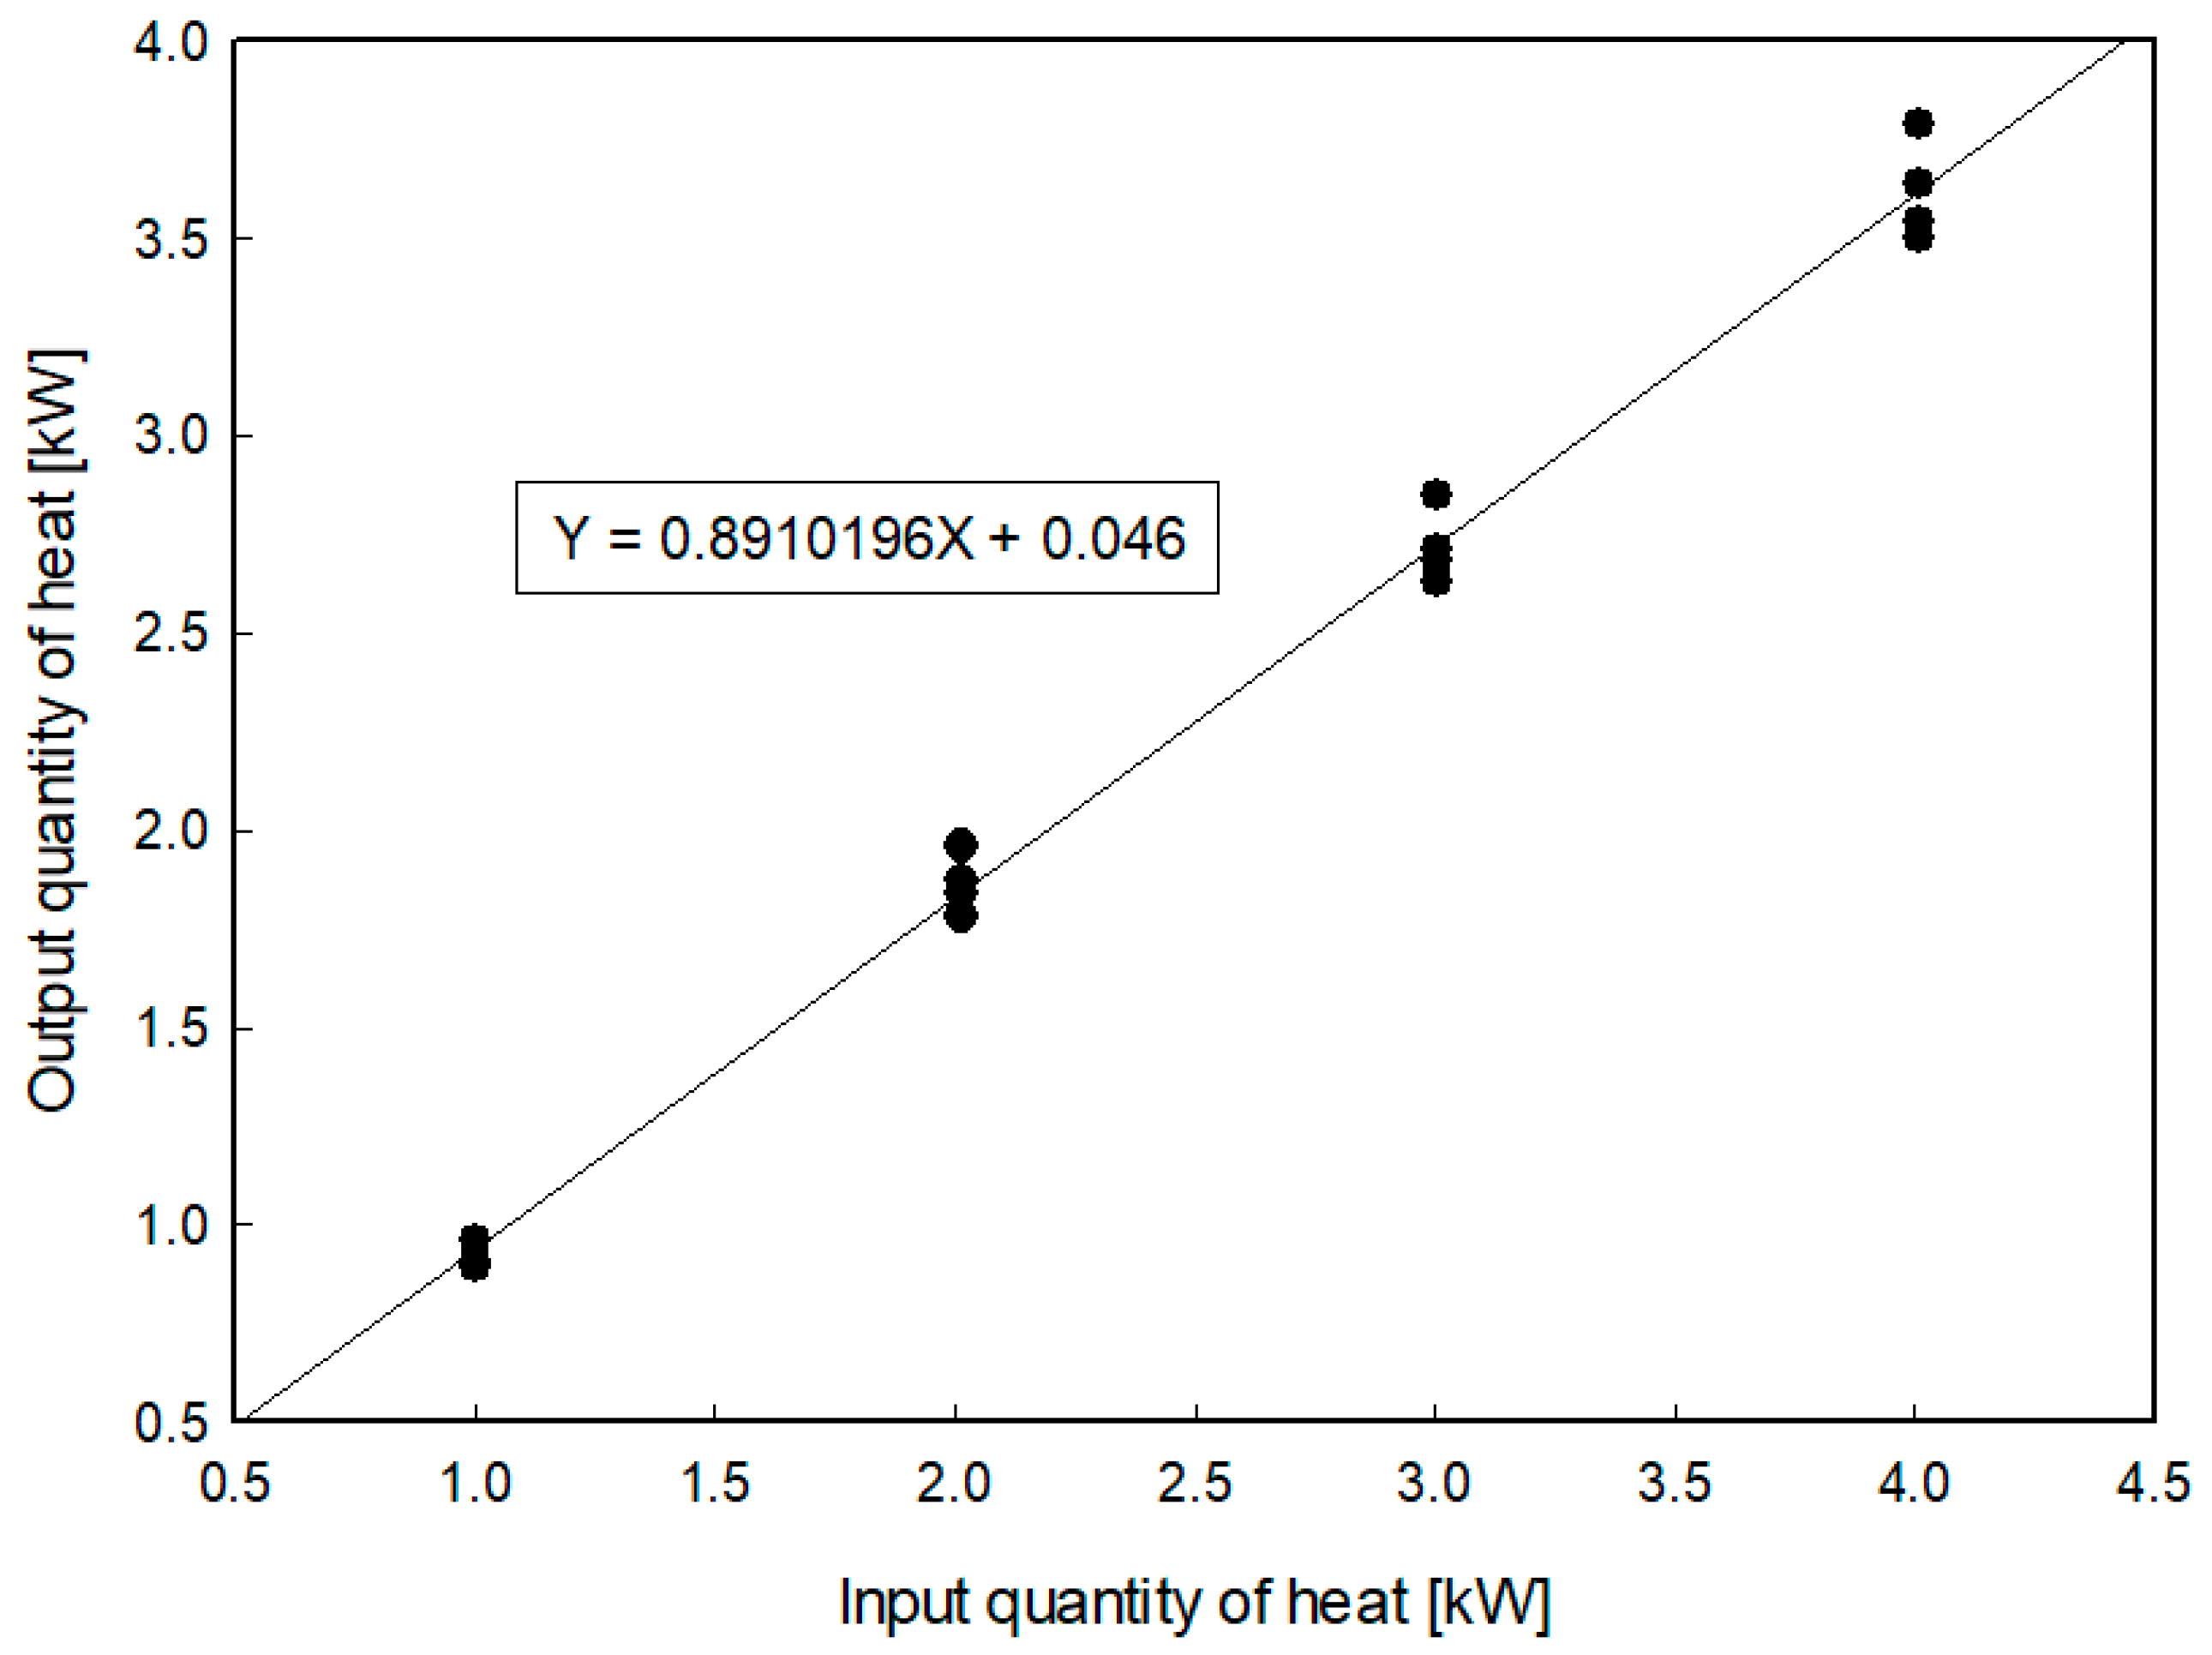
3.3. Uncertainty Analysis

The uncertainty of the heat transfer coefficient and pressure drop was calculated using the Kline and McClintock method [23], and it was found to be 19% and 4.2%, respectively. The uncertainty of the measuring instrument used in this experiment is listed in Table 3.

4. Result and Discussion

4.1. Heat Transfer Coefficient

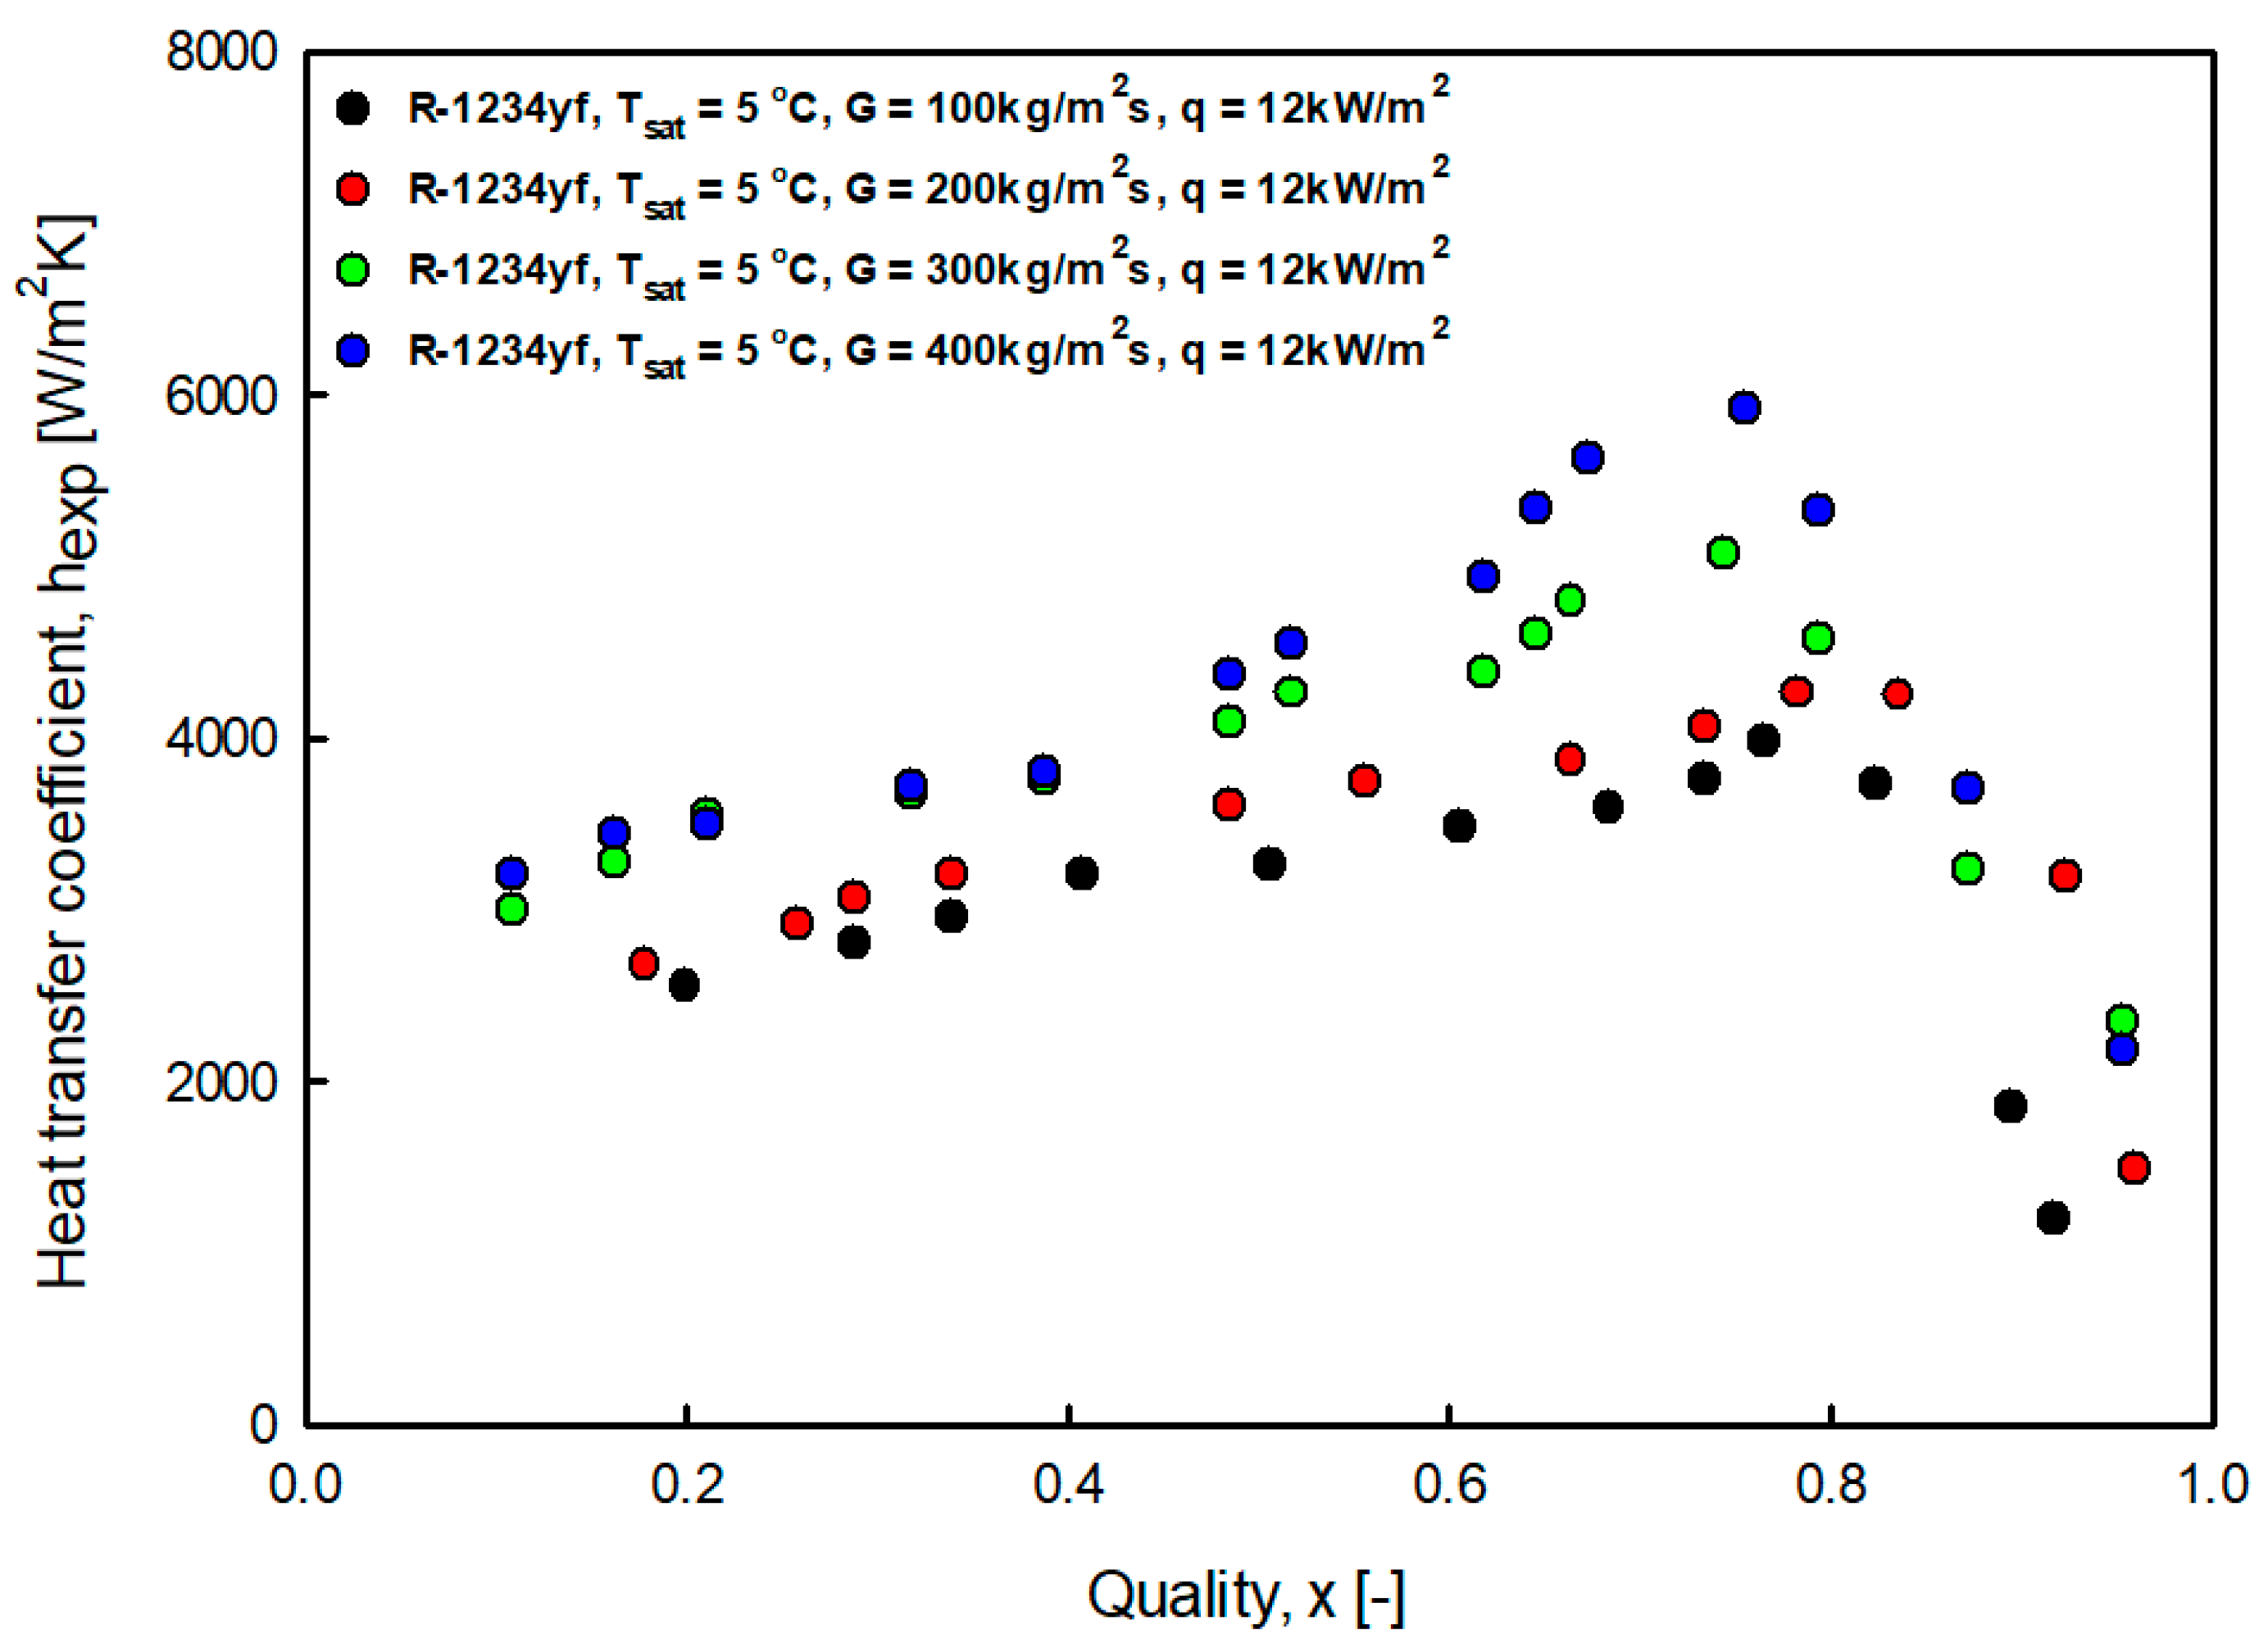
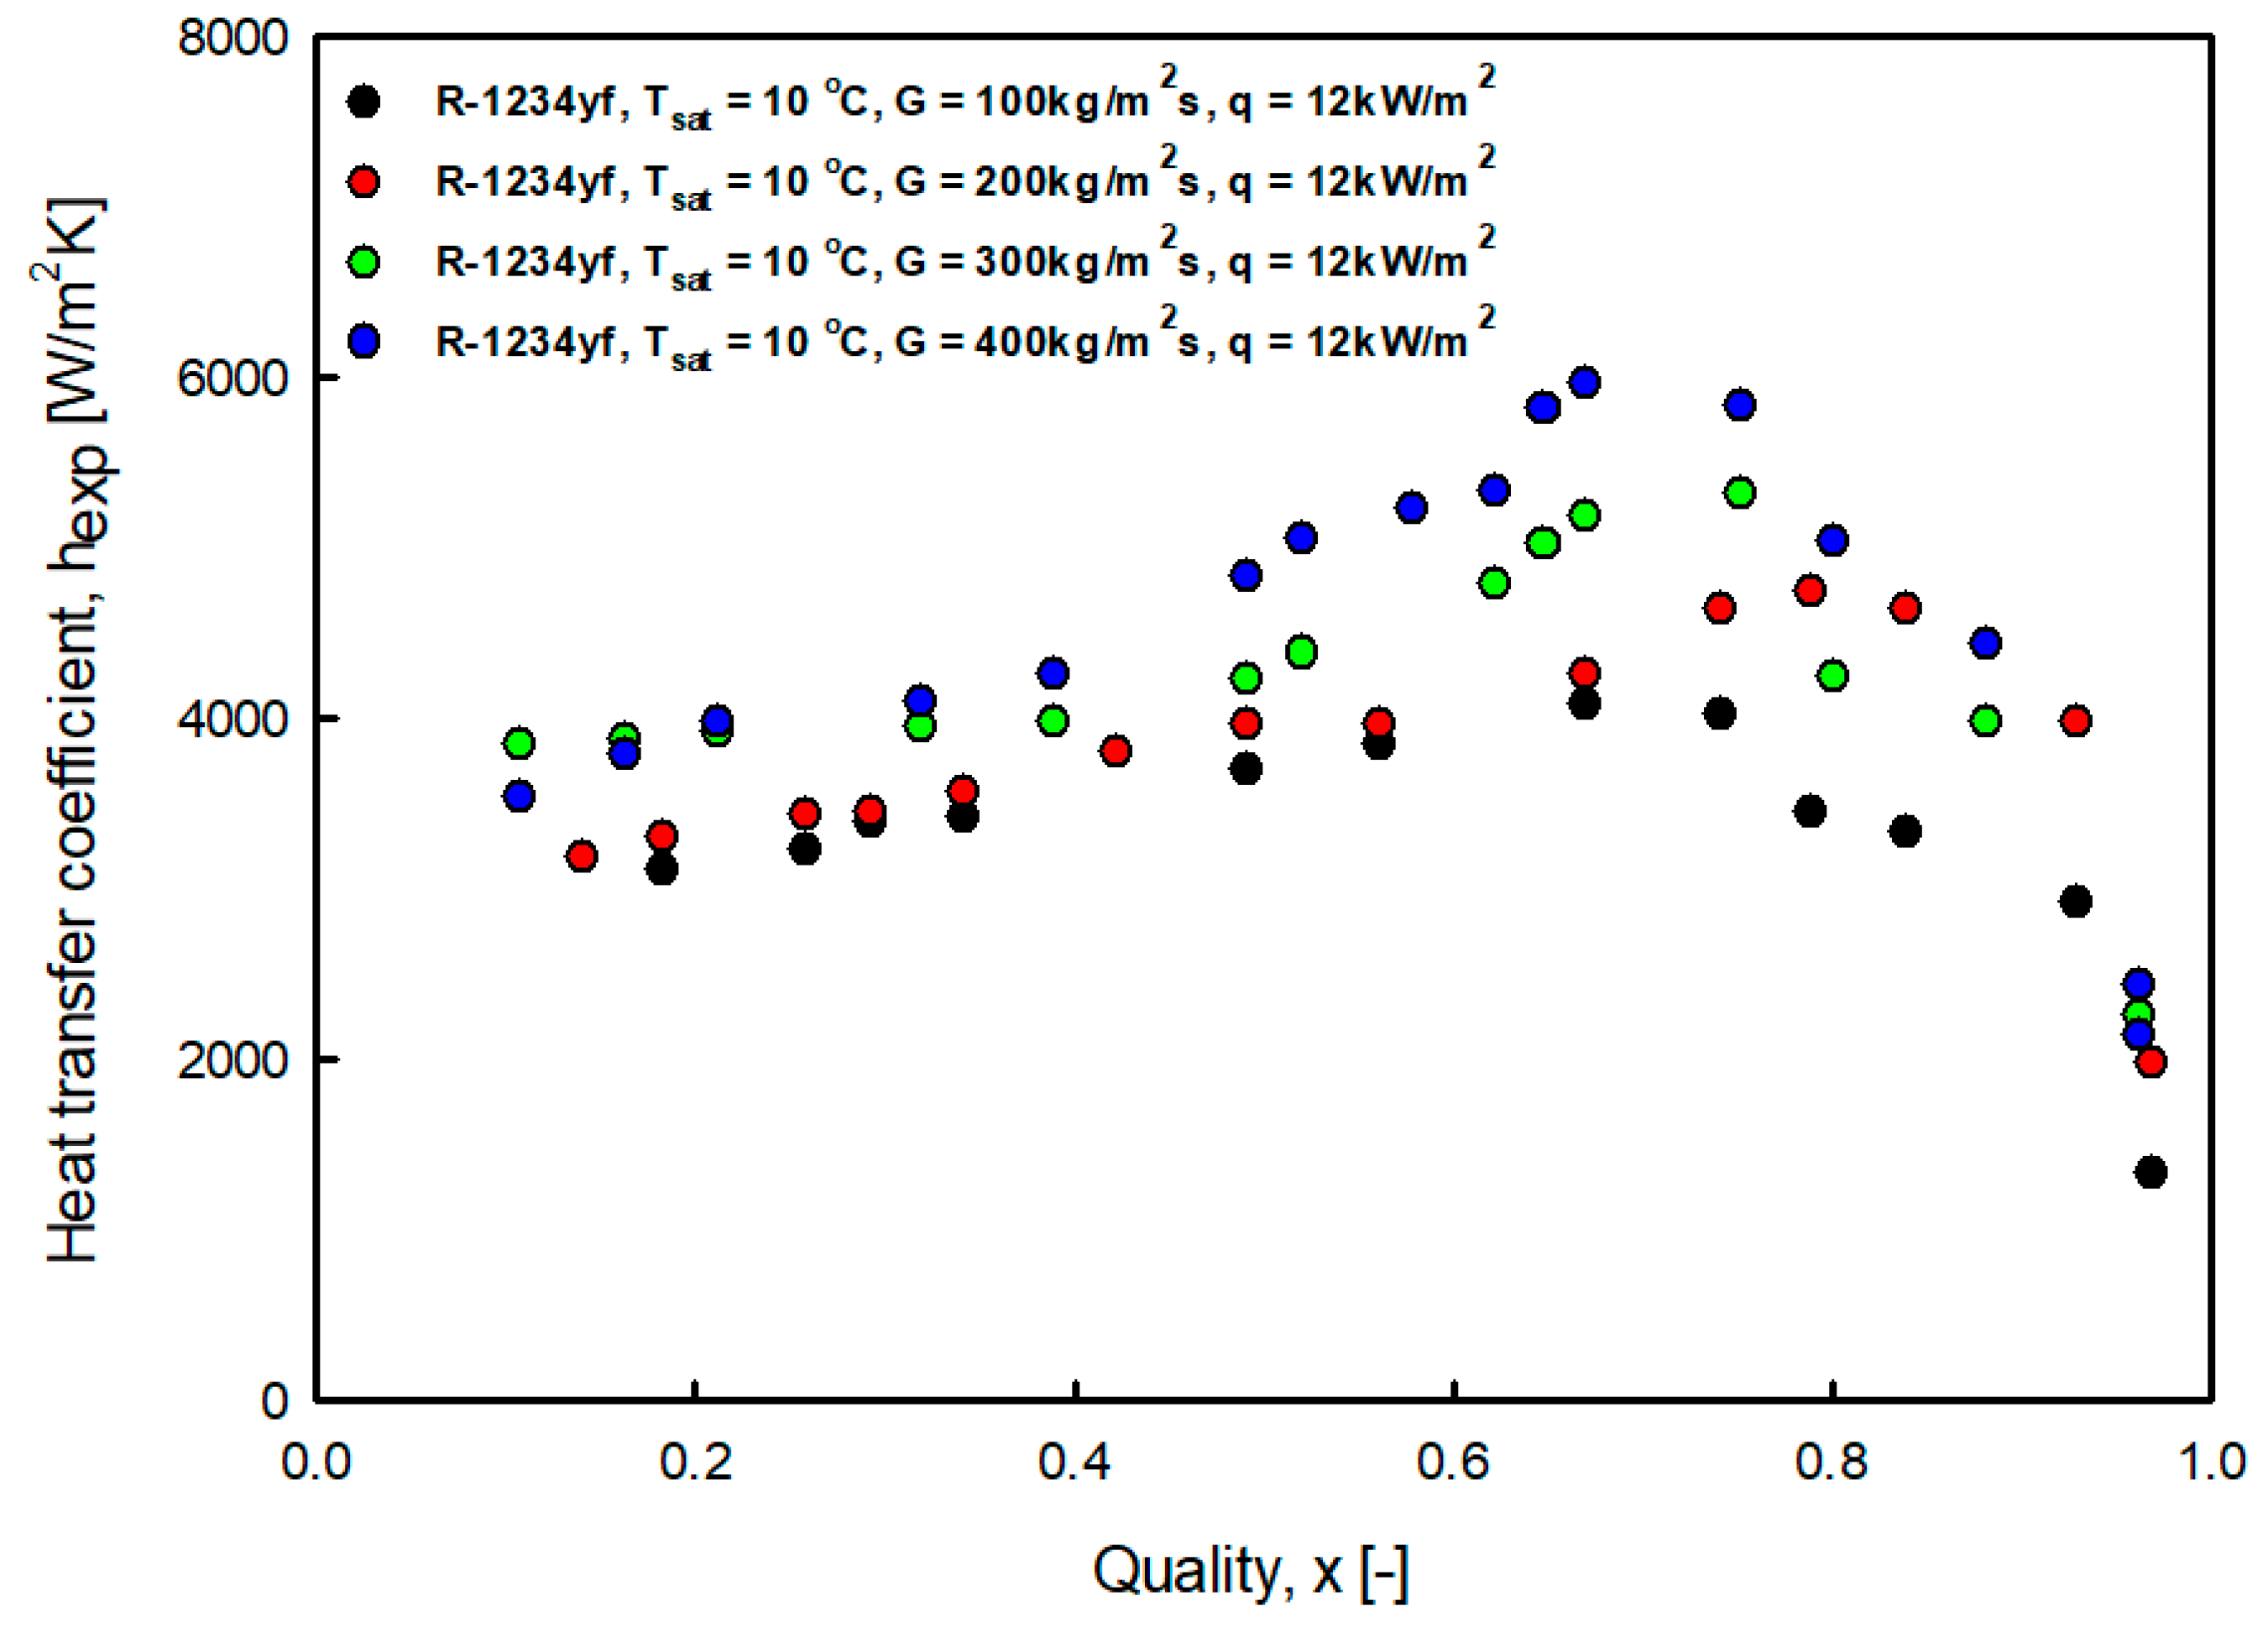
4.1.1. Influence of Mass Flux

Figure 5 and Figure 6 show the heat transfer coefficient for the mass velocity at saturation temperatures of 5 °C and 10 °C. As the quality increased, the heat transfer coefficient also increased, but there was a section in which it rapidly decreased in the high-quality region. This trend was consistent with the results reported in studies by Diani et al. [6], Choi et al. [7], and Sajadi et al. [18]. It was considered that as the quality increased, the vapor ratio increased, forming turbulence, developing annular flow, and increasing the heat transfer coefficient. However, as the liquid film evaporated, the temperature of the heating surface increased, and the heat transfer coefficient rapidly decreased, resulting in a dry out.
In addition, as the mass flow rate increased, the heat transfer coefficient increased. This trend was consistent with the results reported in studies by Mortada et al. [4] and Jige et al. [17]. This is thought to be because the mass velocity of the refrigerant increases, the Reynolds number increases, and the flow pattern develops rapidly. It can be seen that the influence of the mass velocity was negligible in the low-quality region, where nuclear boiling was dominant, but the influence of the mass velocity was significant in the high-quality region, where convective boiling was dominant. Also, beyond mass flux of 200 kg/m2s, the heat transfer coefficient increased significantly. It is thought that beyond a mass flux of 200 kg/m2s, the annular flow rapidly increased.

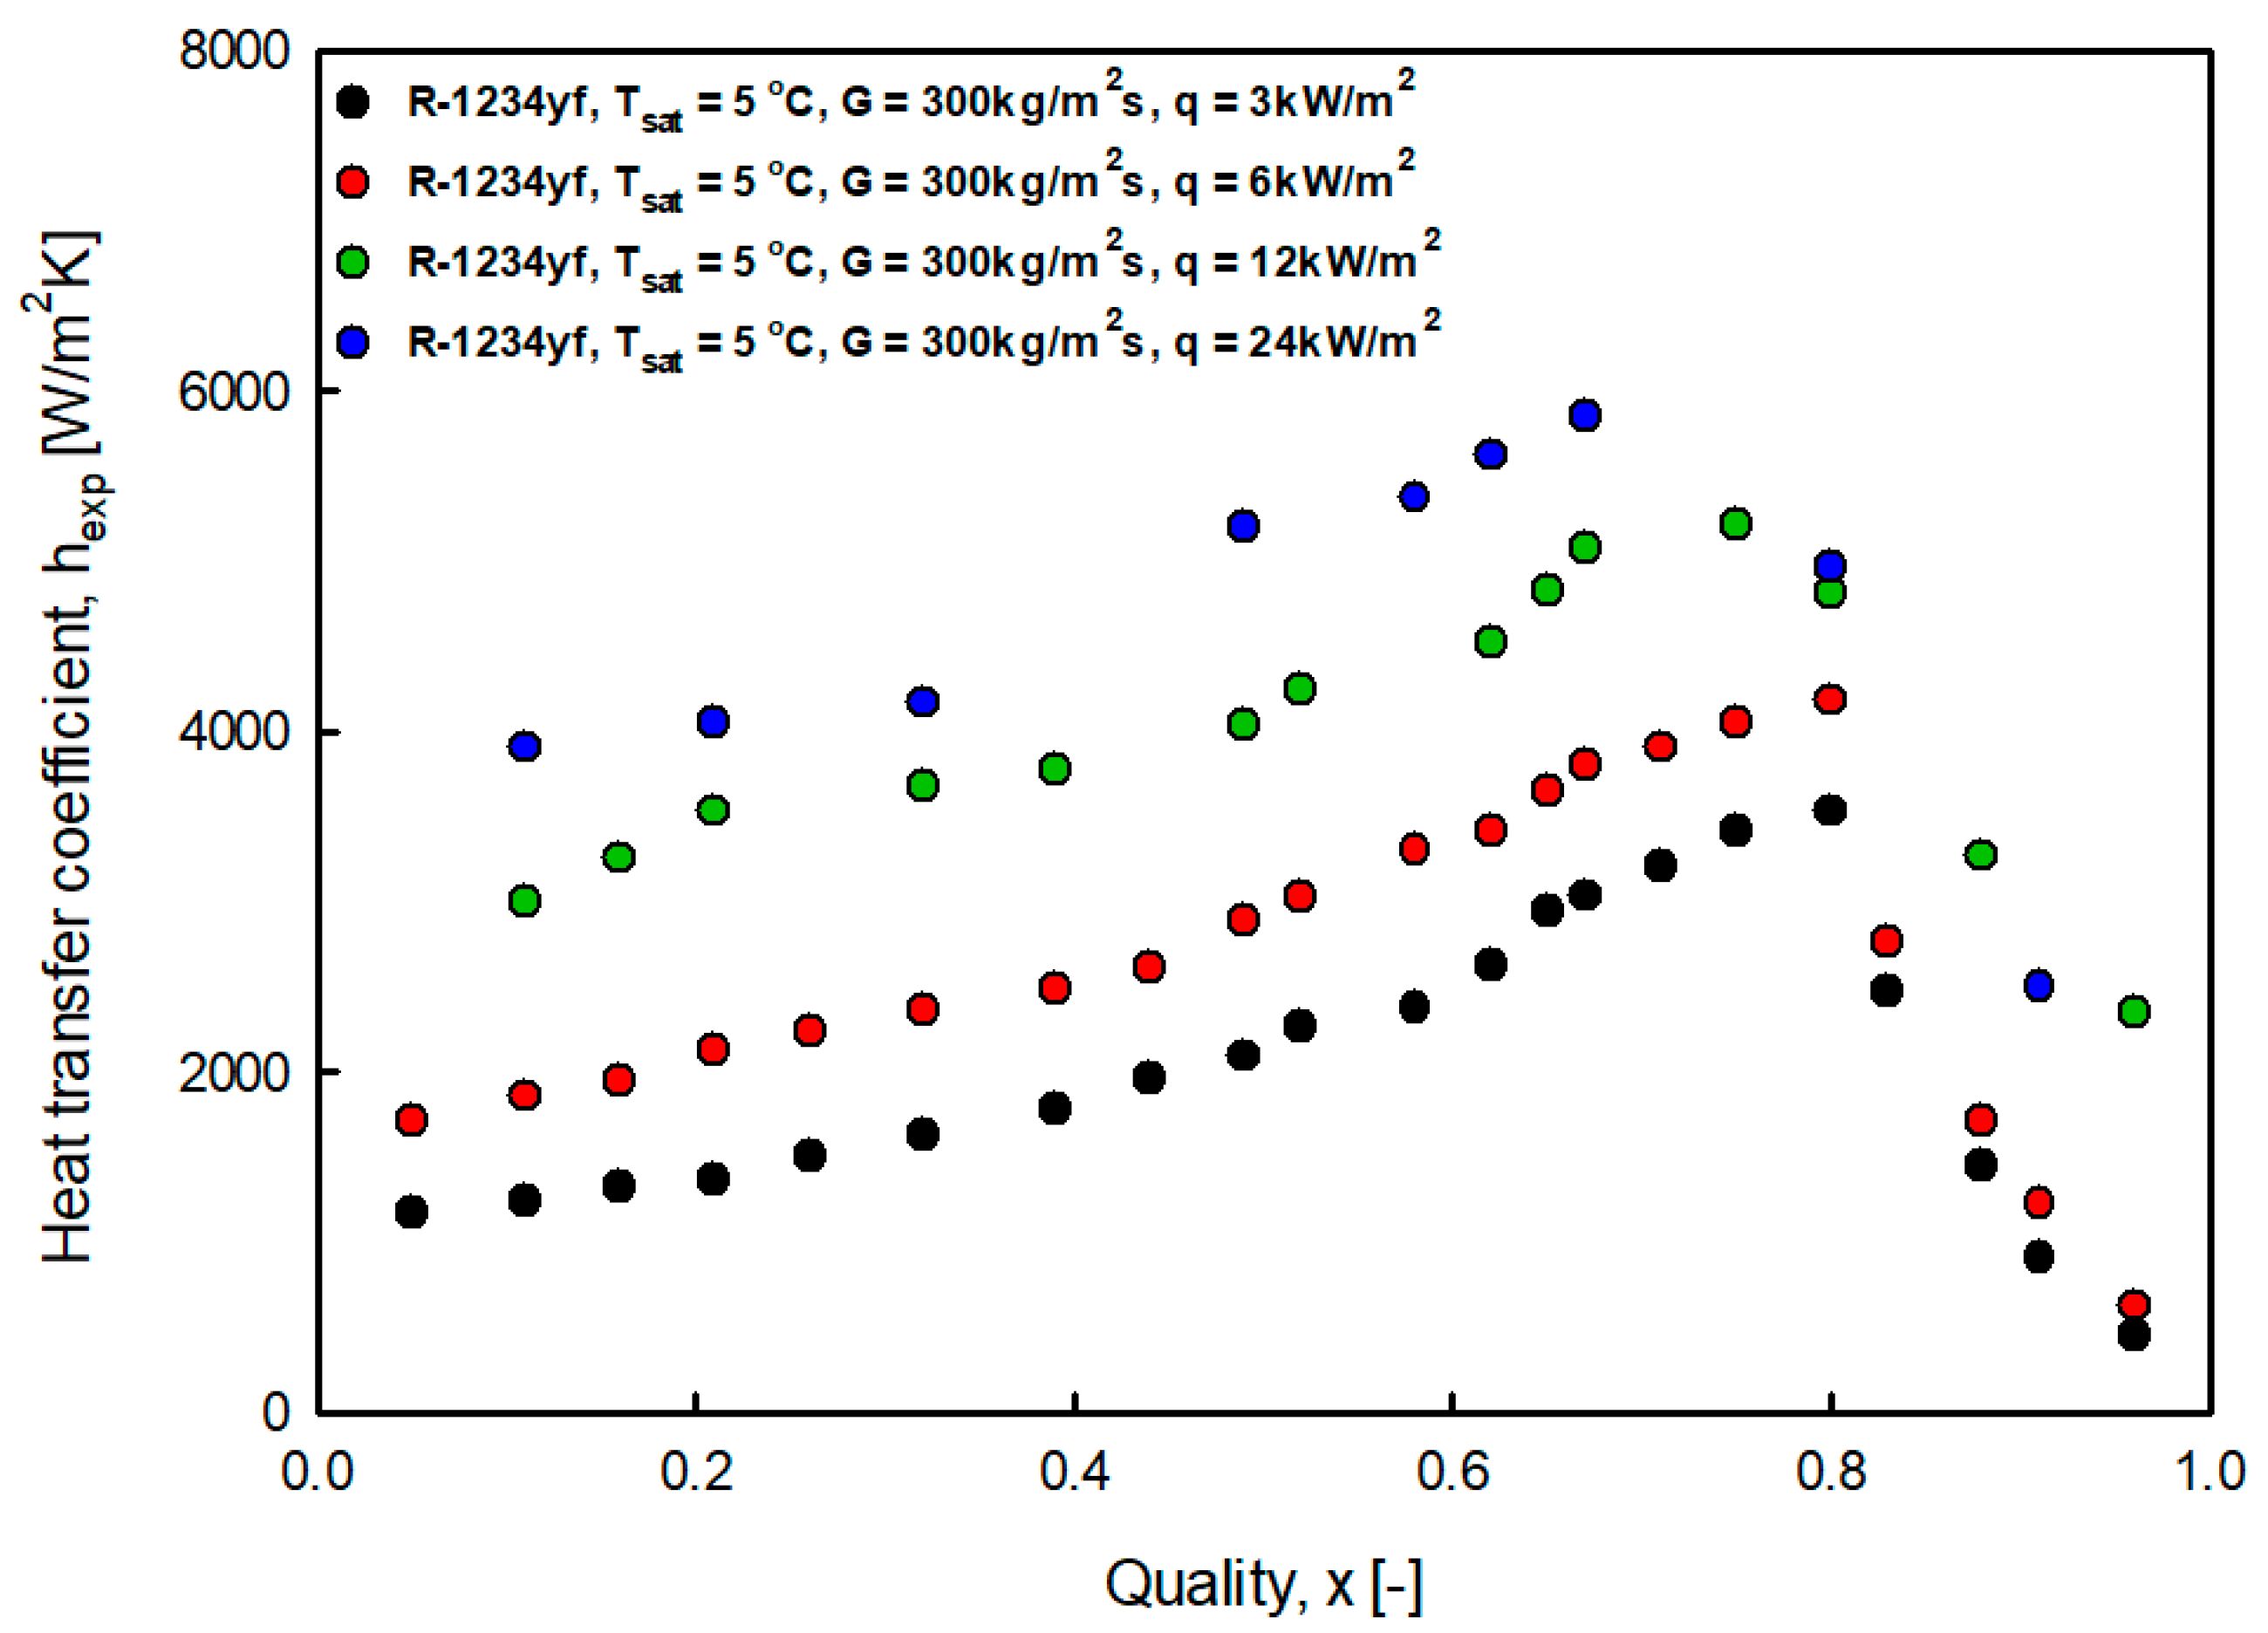
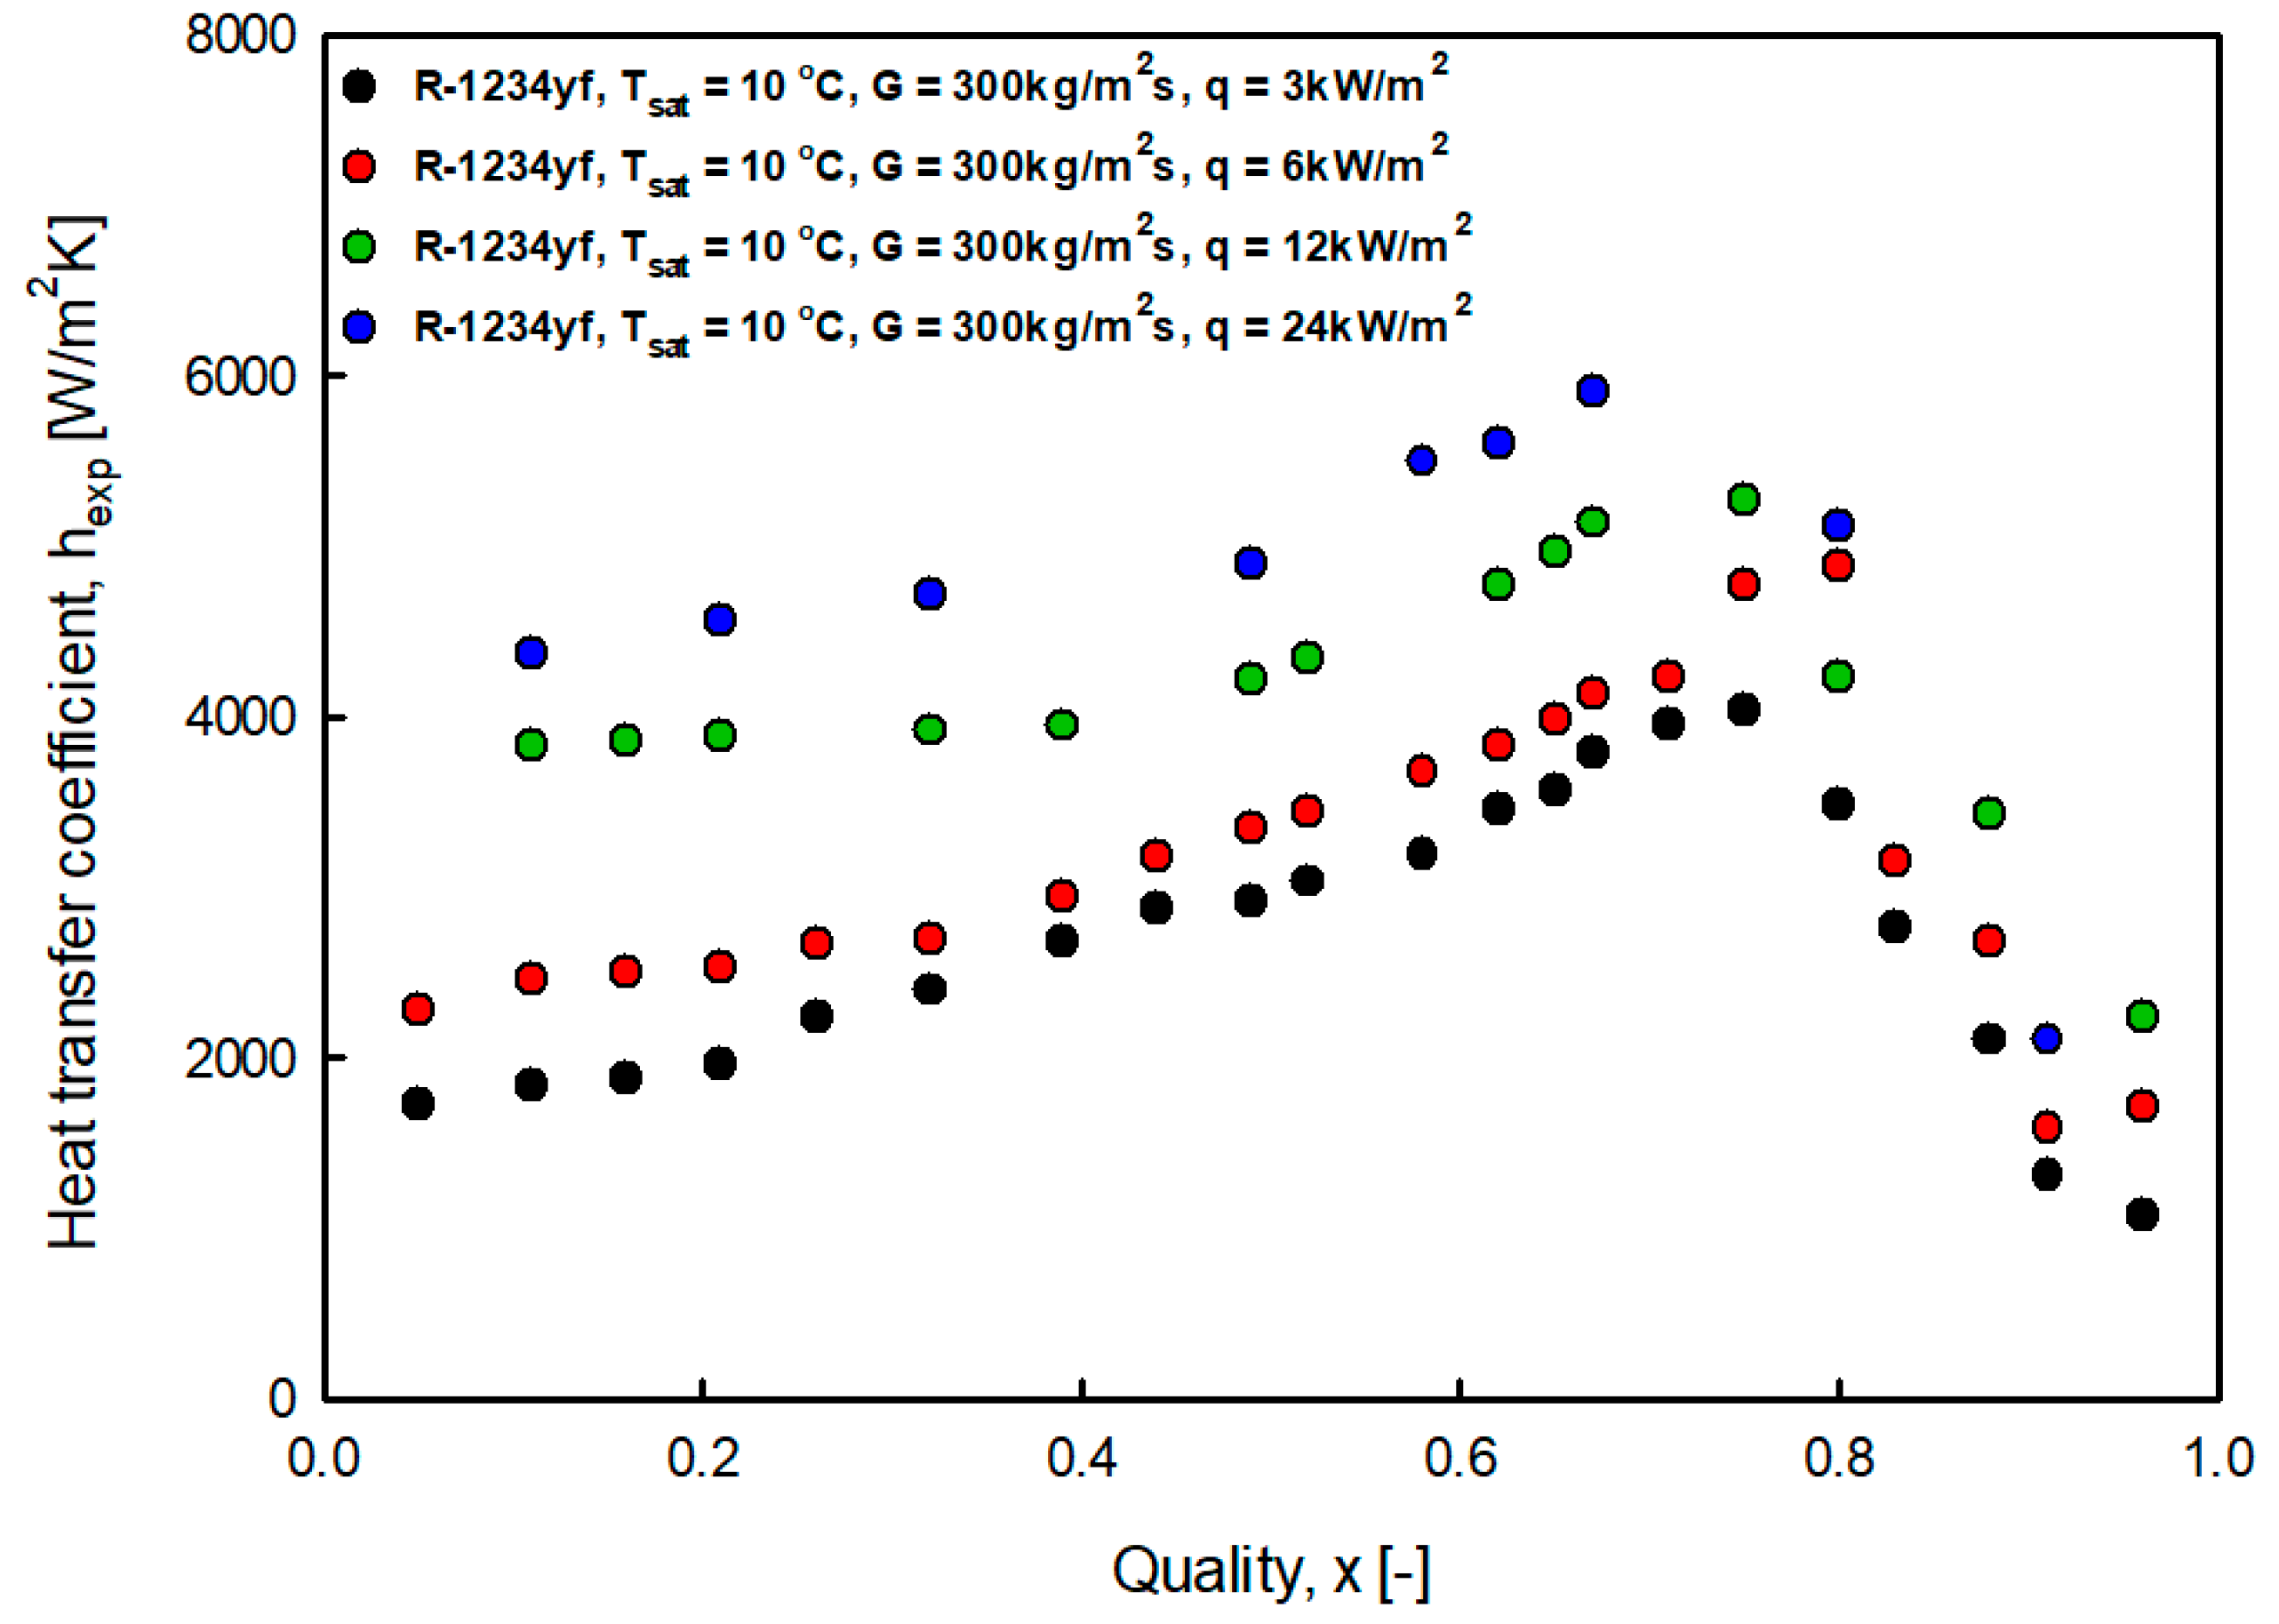
4.1.2. Influence of Heat Flux

Figure 7 and Figure 8 show the heat transfer coefficient according to the heat flux at saturation temperatures of 5 °C and 10 °C. As the heat flux increased, the heat transfer coefficient increased. This trend is consistent with the results reported in studies by Choi et al. [7] and Sempértegui-Tapia [8]. The effect of heat flux was considerable in the low-quality region where nuclear boiling was dominant, but small in the high-quality region where convective boiling was dominant. It is considered that when the heat flux increases, the degree of superheating of the heating surface increases, and nucleation and growth are actively performed. As the quality increases, the flow pattern transitions from bubble flow and slug flow to annular flow.
In this case, the liquid film was sufficiently thin to transfer the heat flux supplied from the heating surface to the gas–liquid interface through conduction and convection. Therefore, the superheat of the heating surface did not satisfy the nucleation condition, and continuous evaporation of the liquid film occurred at the gas–liquid interface. For nuclear boiling to occur continuously, the thermal conductivity of the liquid must be low or the thickness of the liquid film must be sufficiently thick. The results revealed that as R-1234yf transitioned to annular flow in the high-quality, convective boiling was dominant and nuclear boiling was suppressed.

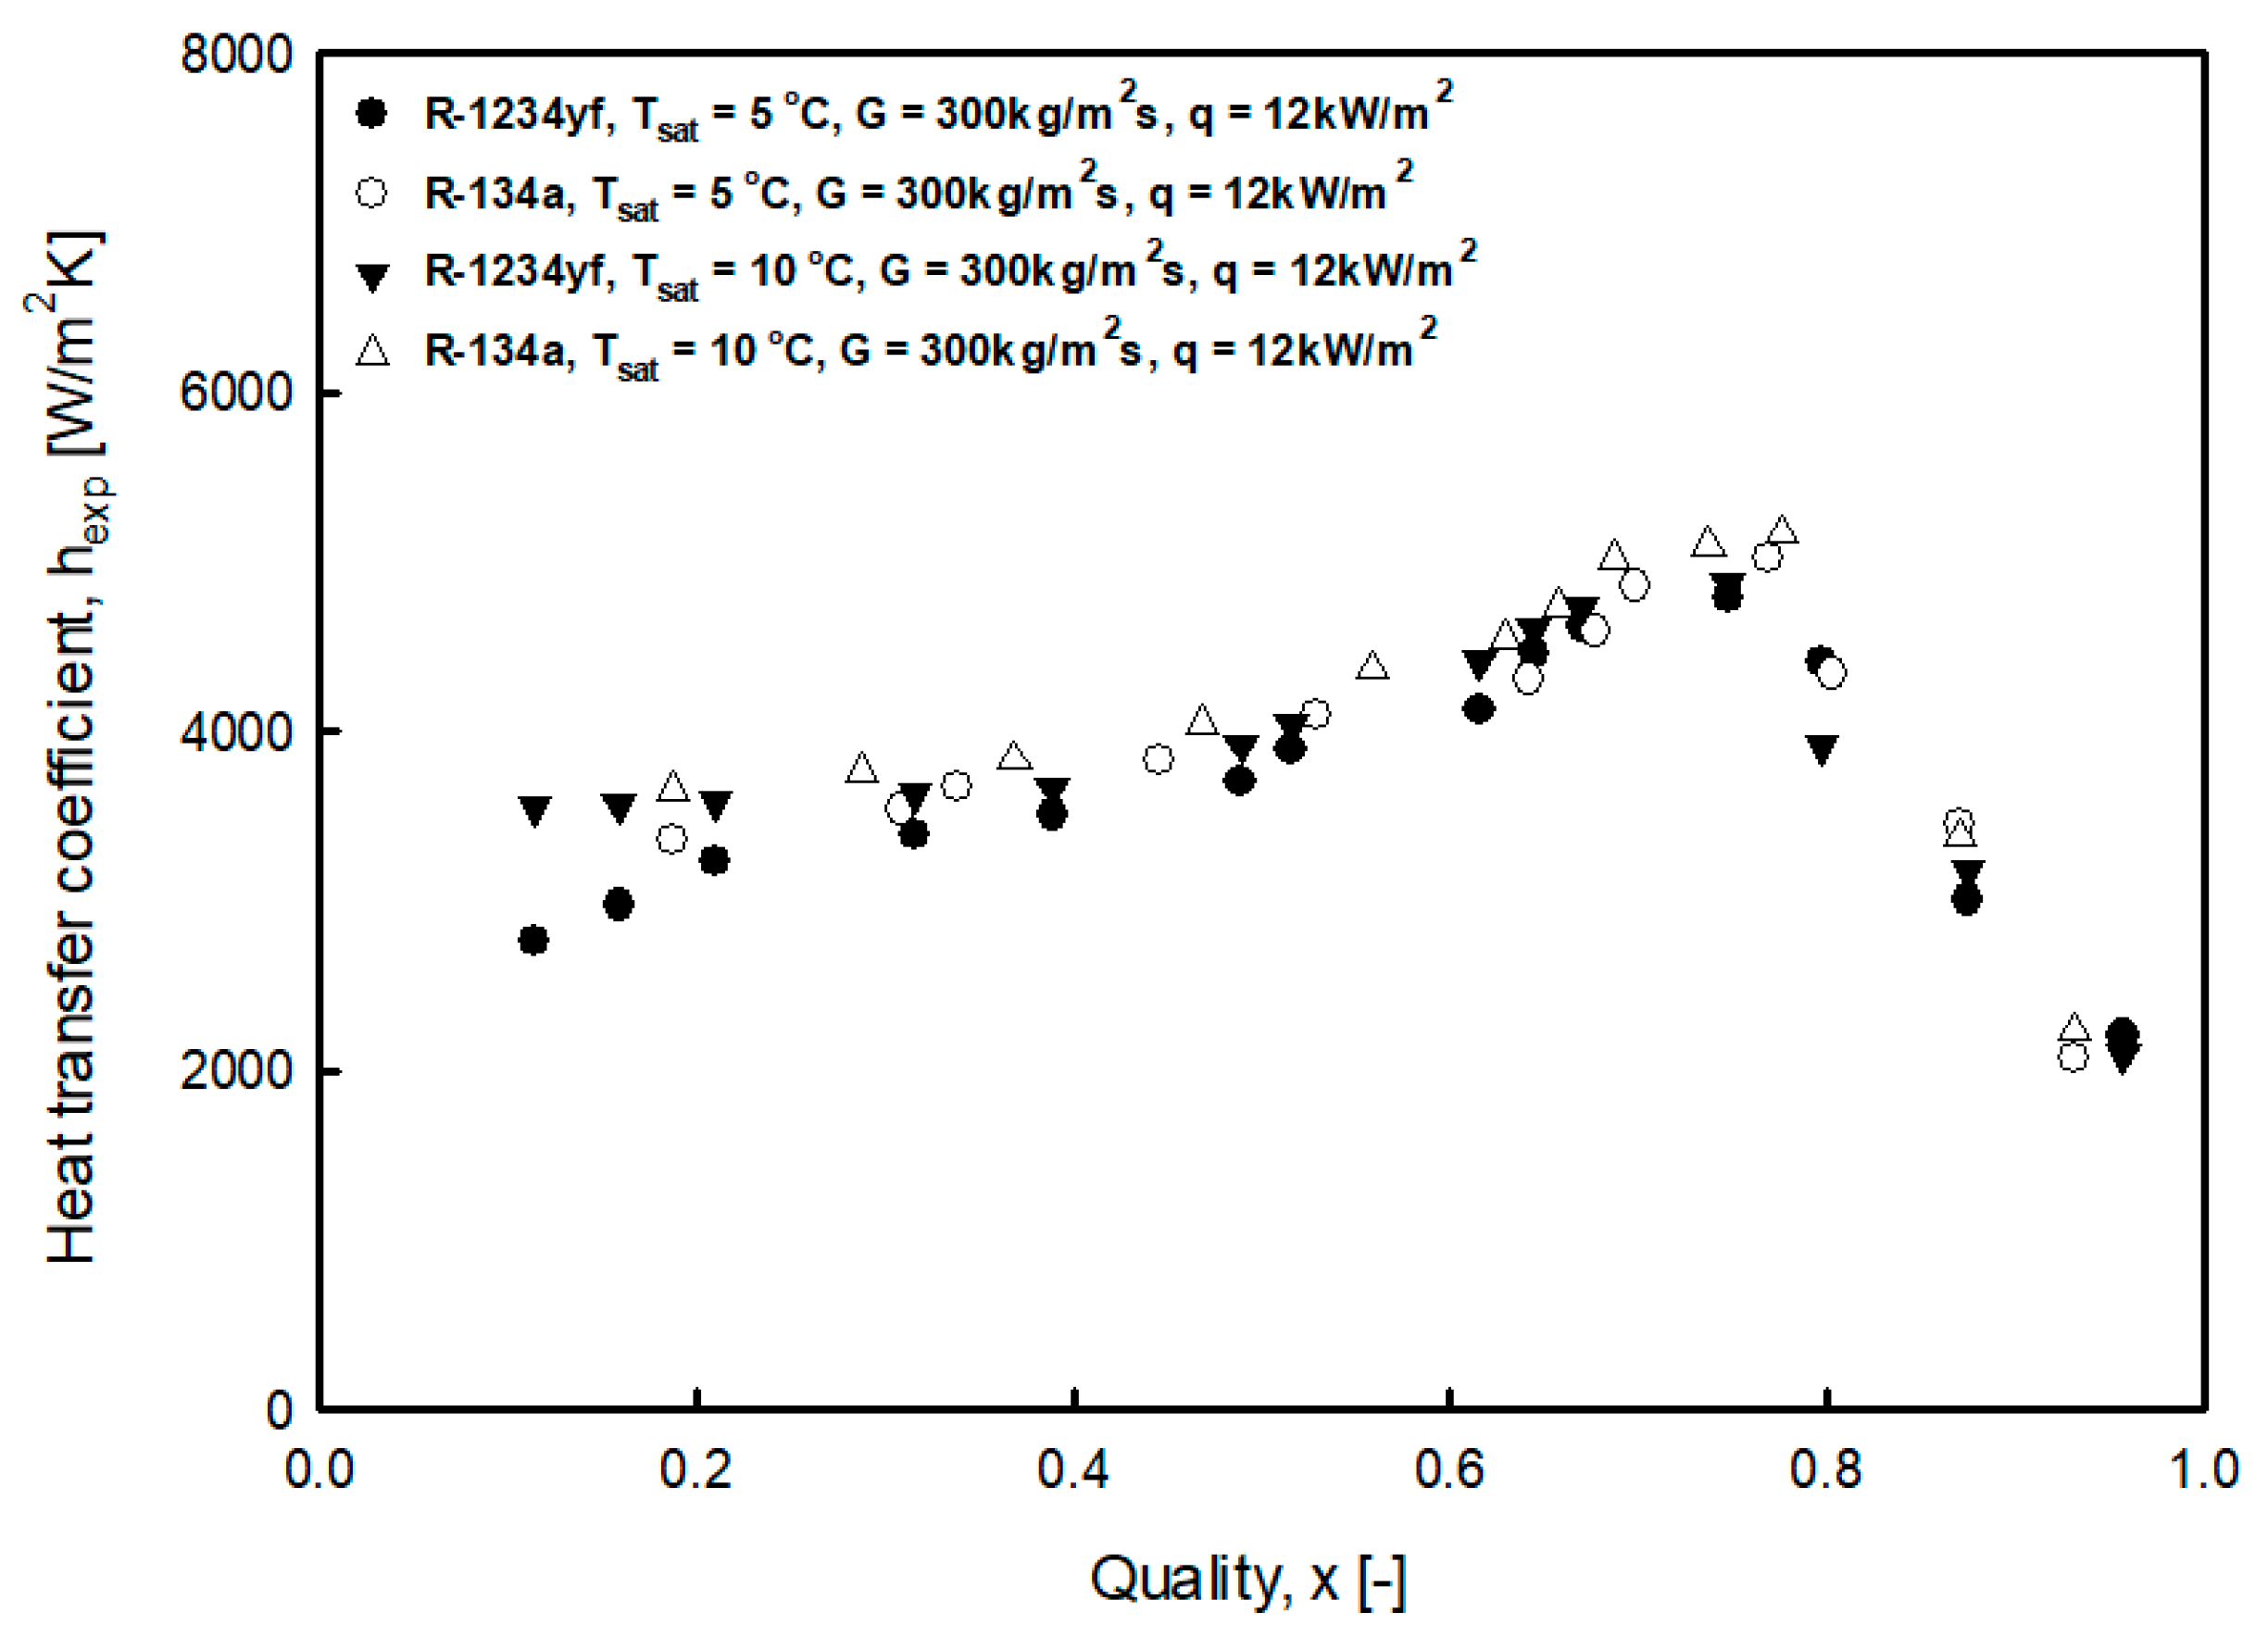
4.1.3. Influence of Saturation Temperature

Figure 9 shows the heat transfer coefficient at a saturation temperature of 5 °C and 10 °C at a mass flow rate of 300 kg/m2s and a heat flux of 12 kW/m2. Concerning the effect of the saturation temperature, the difference in heat transfer coefficient was prominent in the low-quality region where nuclear boiling was dominant, and it decreased toward high-quality region. The surface tension of R-1234yf decreased as the saturation temperature increased. Therefore, as the surface tension decreased, the required superheat for nucleation and bubble growth was reduced; thus, the heat transfer coefficient in the nuclear boiling region increased as the saturation temperature increased under the same conditions.

4.1.4. Comparison of the Heat Transfer Coefficient of R-134a and R-1234yf

Figure 10 shows the heat transfer coefficients of R-1234yf and R-134. The graph reveals that the heat transfer coefficient of R-134a is relatively high. This is related to the physical properties of the compound, as listed in Table 4. For example, the vapor density of R-134 is, on average, 17% lower than that of R-1234yf, which means that R-134a has a higher vapor velocity. Therefore, compared with R-1234yf, it can be confirmed that the turbulence of R-134a is accelerated and the liquid film is thin, so the heat transfer coefficient is high.

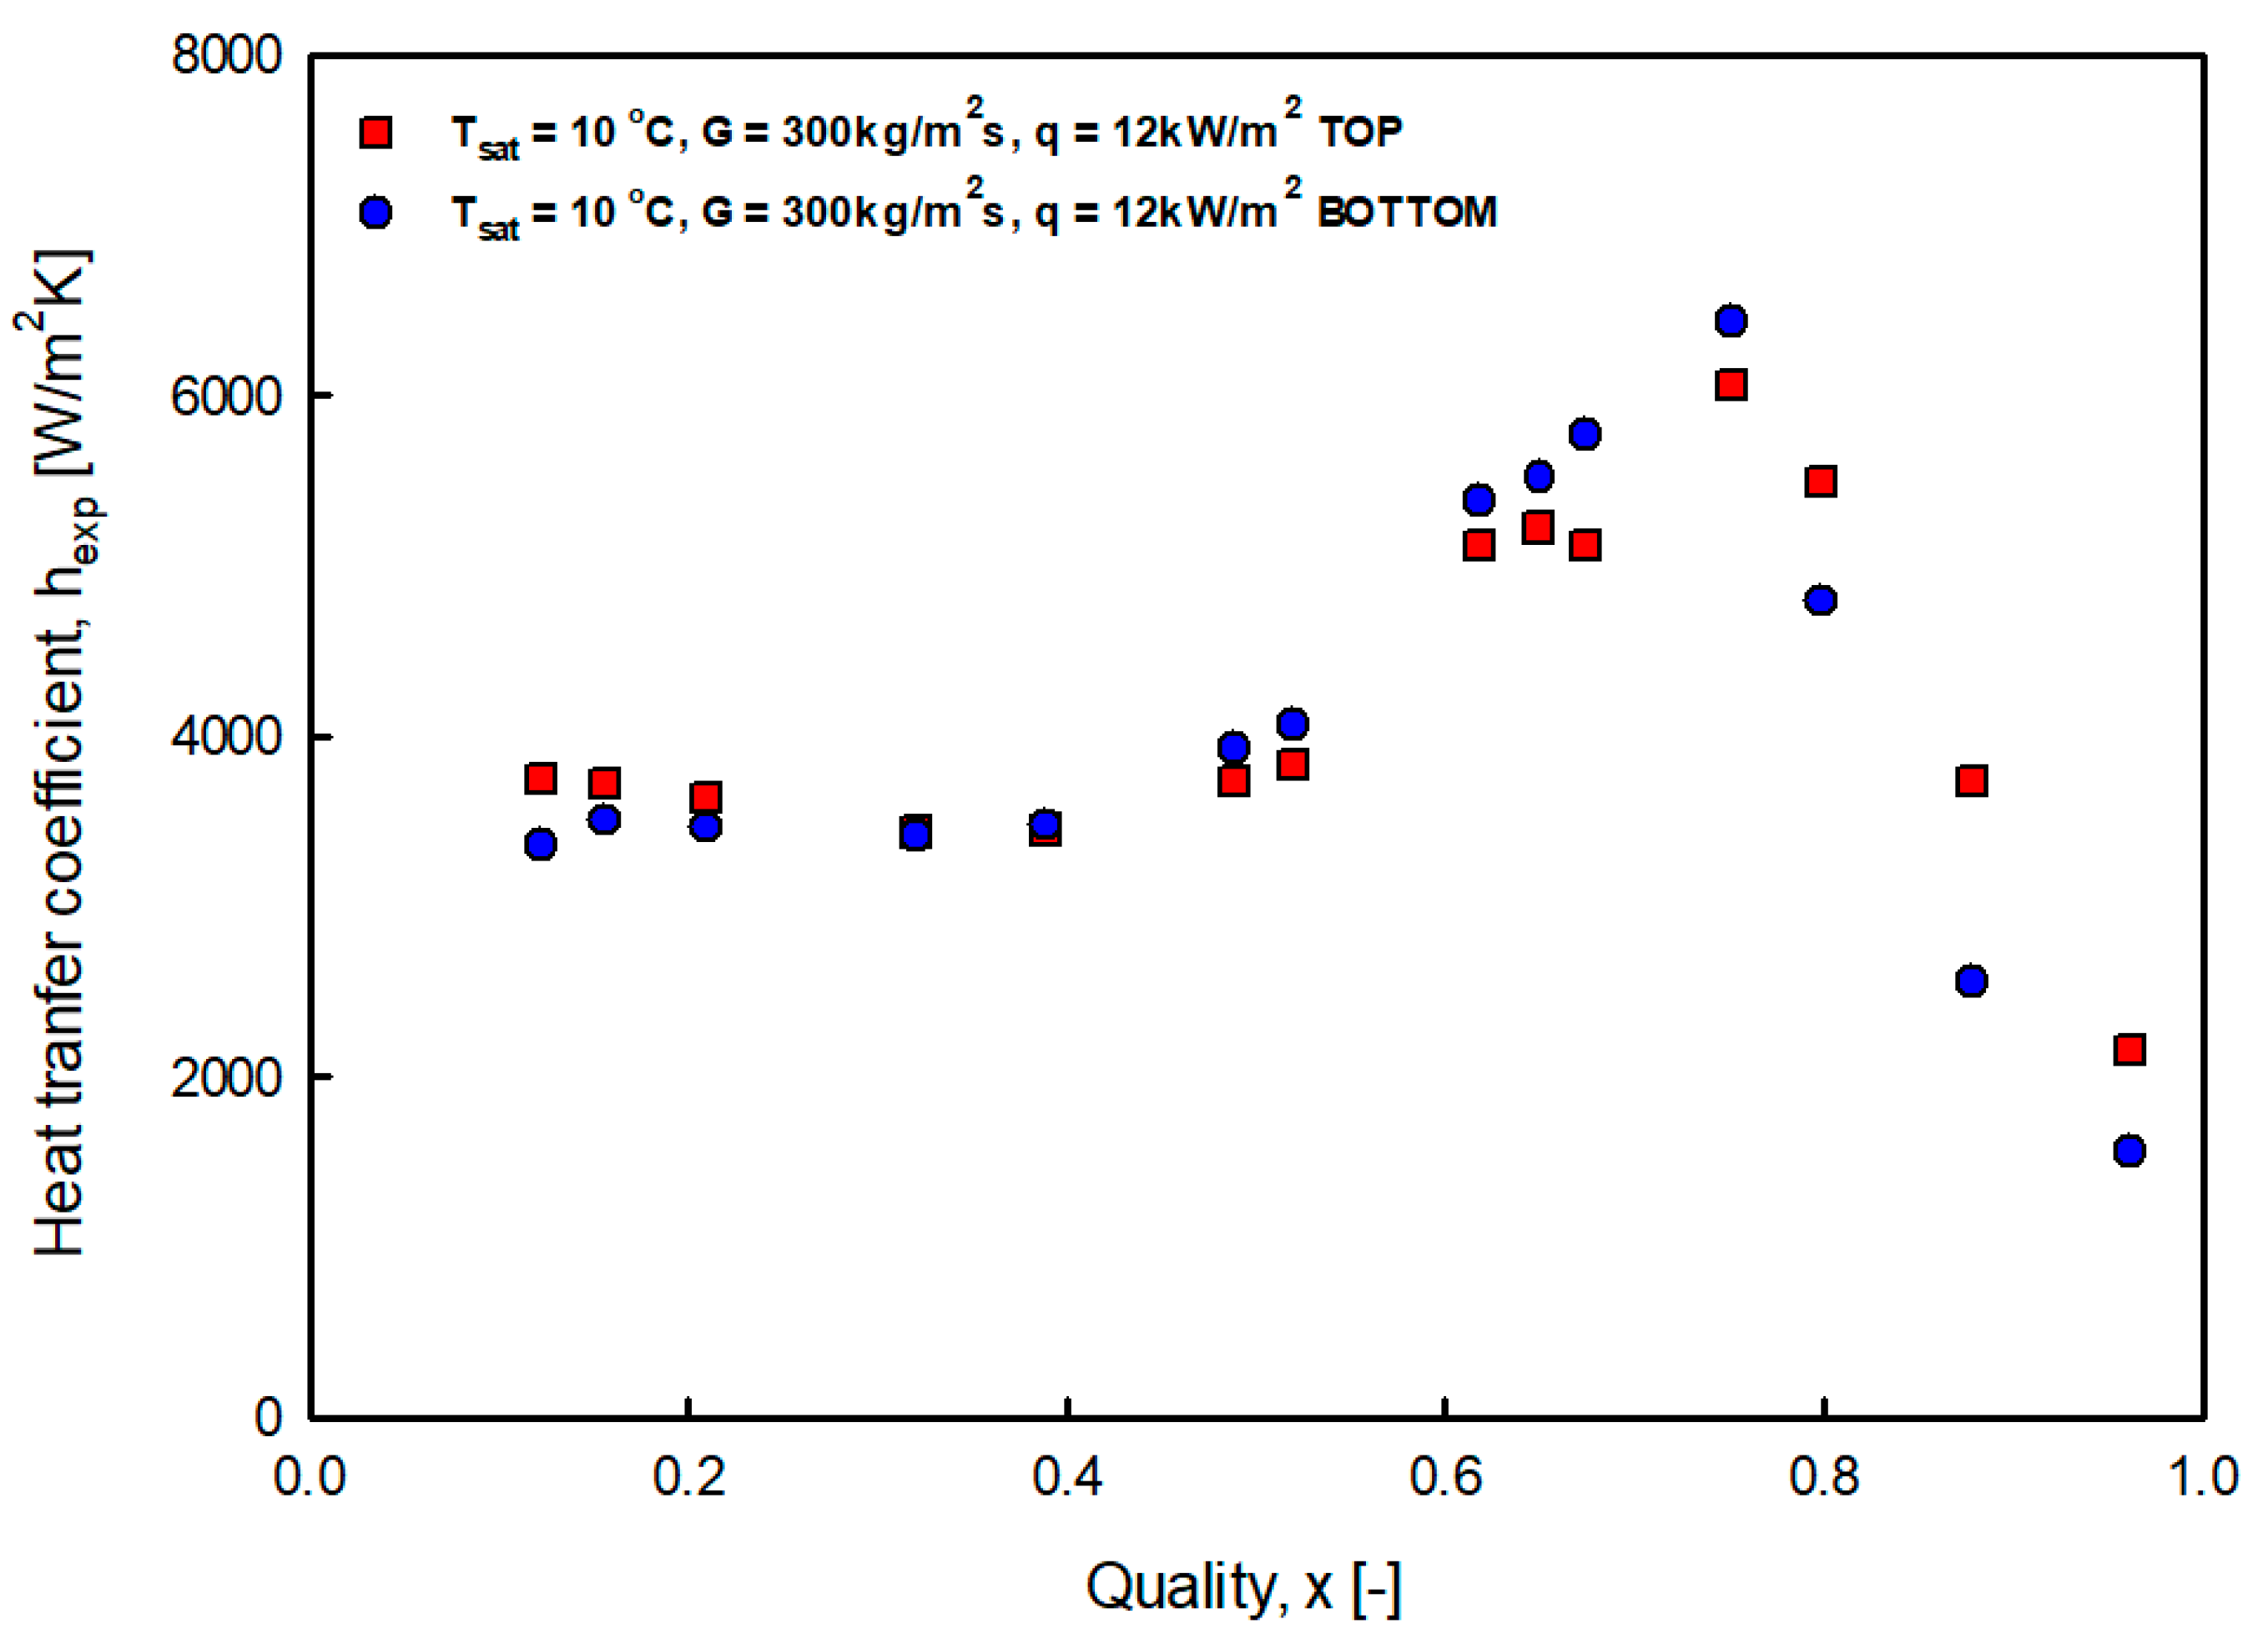
4.1.5. Heat Transfer Coefficient of Top and Bottom Side

Figure 11 shows the difference between the upper and lower heat transfer coefficients. In the low-quality region, the heat transfer coefficient was high and the upper heat transfer coefficient was low; however, in the high-quality region, the trend was different. This was due to the fact that in the low-quality region, where nuclear boiling was dominant, bubbles with relatively large specific volumes rose to the top, and the nuclear boiling in the lower part was activated as compared with the upper part, so that the low part of the heat transfer coefficient was high. When the flow pattern formed, a thick liquid film formed at the bottom of the tube under the influence of gravity. Because the liquid film provided heat resistance, it was concluded that the heat transfer coefficient of the upper part with a relatively thin liquid film was high. In addition, it was confirmed that the dry-out phenomenon that occurred after the thin liquid film disappeared quickly also occurred at the top side.

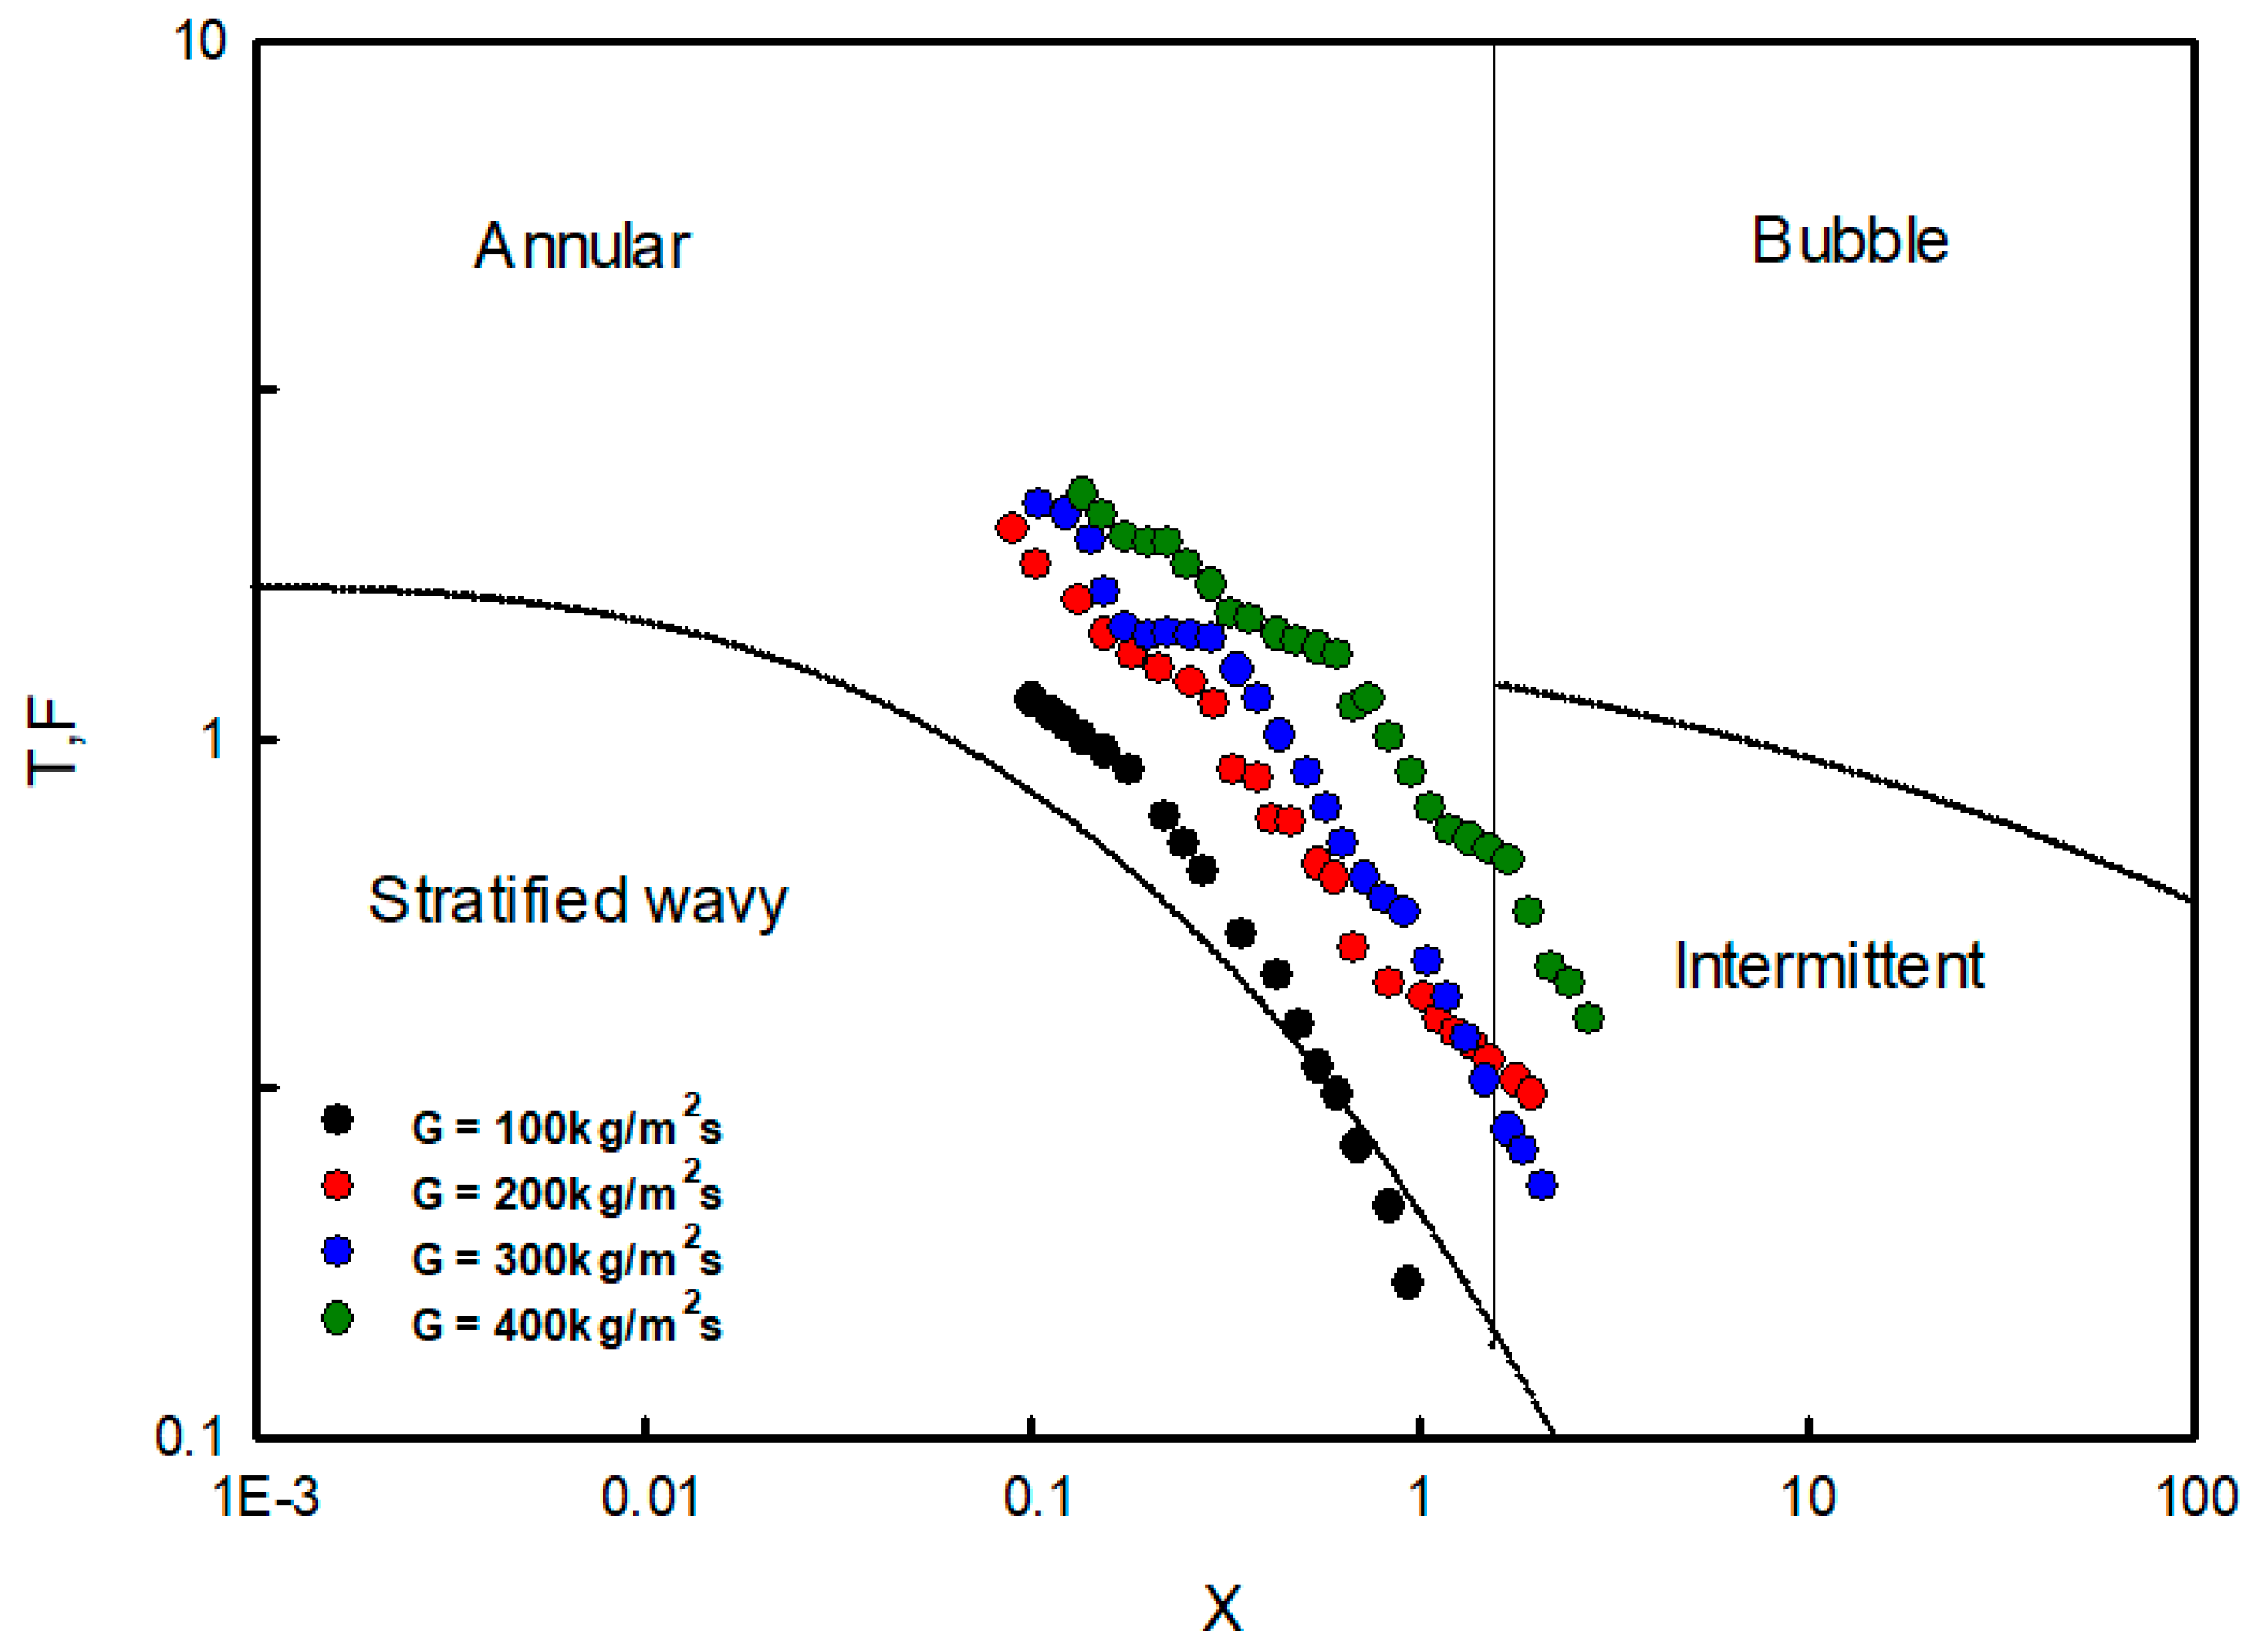
4.1.6. Flow Pattern Map

Figure 12 shows the experimental results of the flow pattern diagram of Taitel and Dukler [24], which was adopted because it can be generally applied to this experiment, since it includes the influence of both the properties and pipe diameter. The horizontal coordinates of the diagram are the Martinelli parameters, and the vertical coordinates are TTD or F.
T T D = [ ( d p d z ) l g ( ρ l ρ v ) cos θ ] 1 2
F = [ ρ v j v 2 g ( ρ l ρ v ) d cos θ ] 1 2
X = [ ρ v j v 2 j l g ( 1 ρ v ρ l ) μ l cos θ ] 1 2
As shown in Figure 12, annular flow occurred under most experimental conditions, although some conditions showed intermittent flow and wavy flow at low heat flux. This was because the refrigerant, flowing in the saturated liquid state, changed the annular, stratified, and wavy flow and exited as a saturated vapor.

4.1.7. Comparison of the Correlations

Figure 13 is a graph comparing the correlations of Gungor and Winterton [25], Kandlikar [26], Liu and Winterton [27], and Shah [28] with our experimental data. Table 5 summarizes the mean absolute error (MAE), mean relative error (MRE), standard deviation (STD), and δ(±30%) of each correlation equation. δ(±30%) is the percentage of data within ±30% of the total data.
M R E = 1 n i = 1 n ( E R i )
M AE = 1 n i = 1 n | E R i |
STD = 1 n i = 1 n ( E R i M R E ) 2
E R i = h p r e d h e x p h e x p × 100
First, the correlation equations of Gungor and Winterton and Shah overestimated the experimental results overall. Kandlikar’s correlation equation predicted 81.6% of the data within ±30%, while that of Liu and Winterton yielded better results for low heat transfer coefficients but showed a tendency to underestimate as the heat transfer coefficient increased. Comparing the best and worst predicted correlations, first, in the case of Gungor-Winterton’s correlation equation, the convective heat transfer coefficient of the liquid phase and pool boiling were mainly used to calculate the convective heat transfer coefficient in the two-phase, and it was found that the error was larger than those of other correlation equations. In the case of Kandlikar’s correlation equation, it is thought that the error was smaller than in other equations due to the arrangement of the required variables for different measurements for each refrigerant, and to the use of a specific constant for each refrigerant.

4.2. Pressure Drop

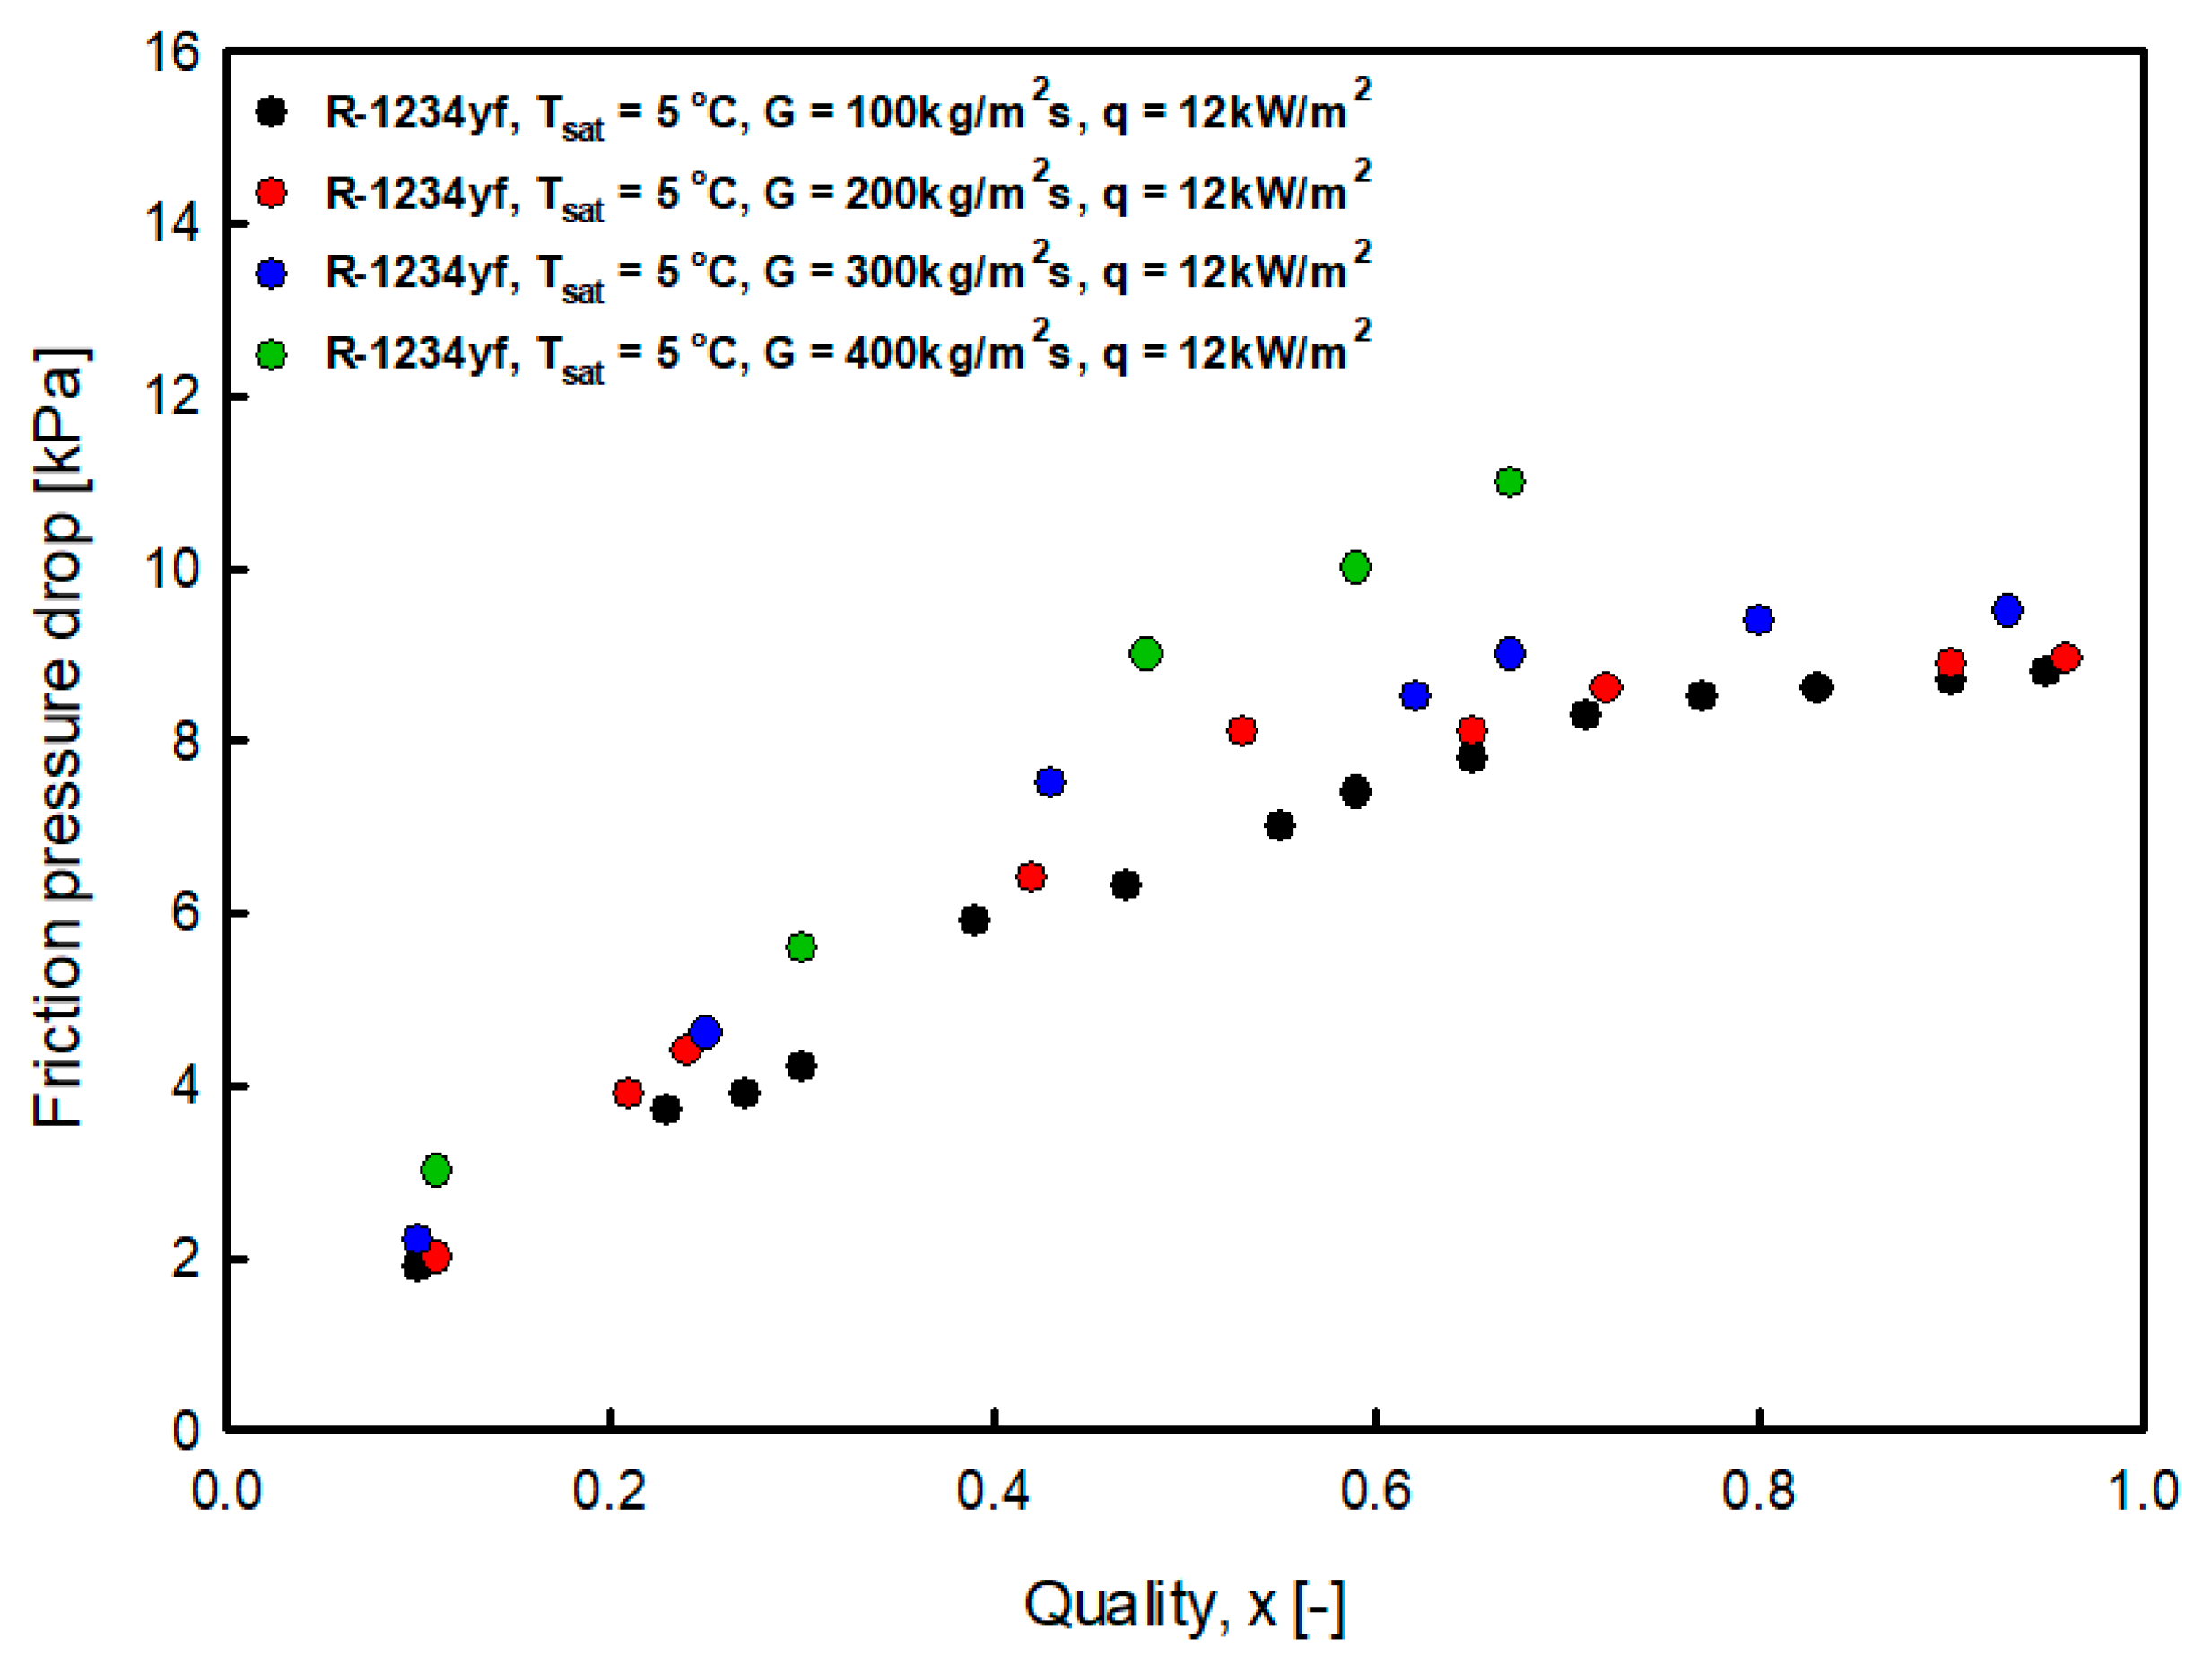
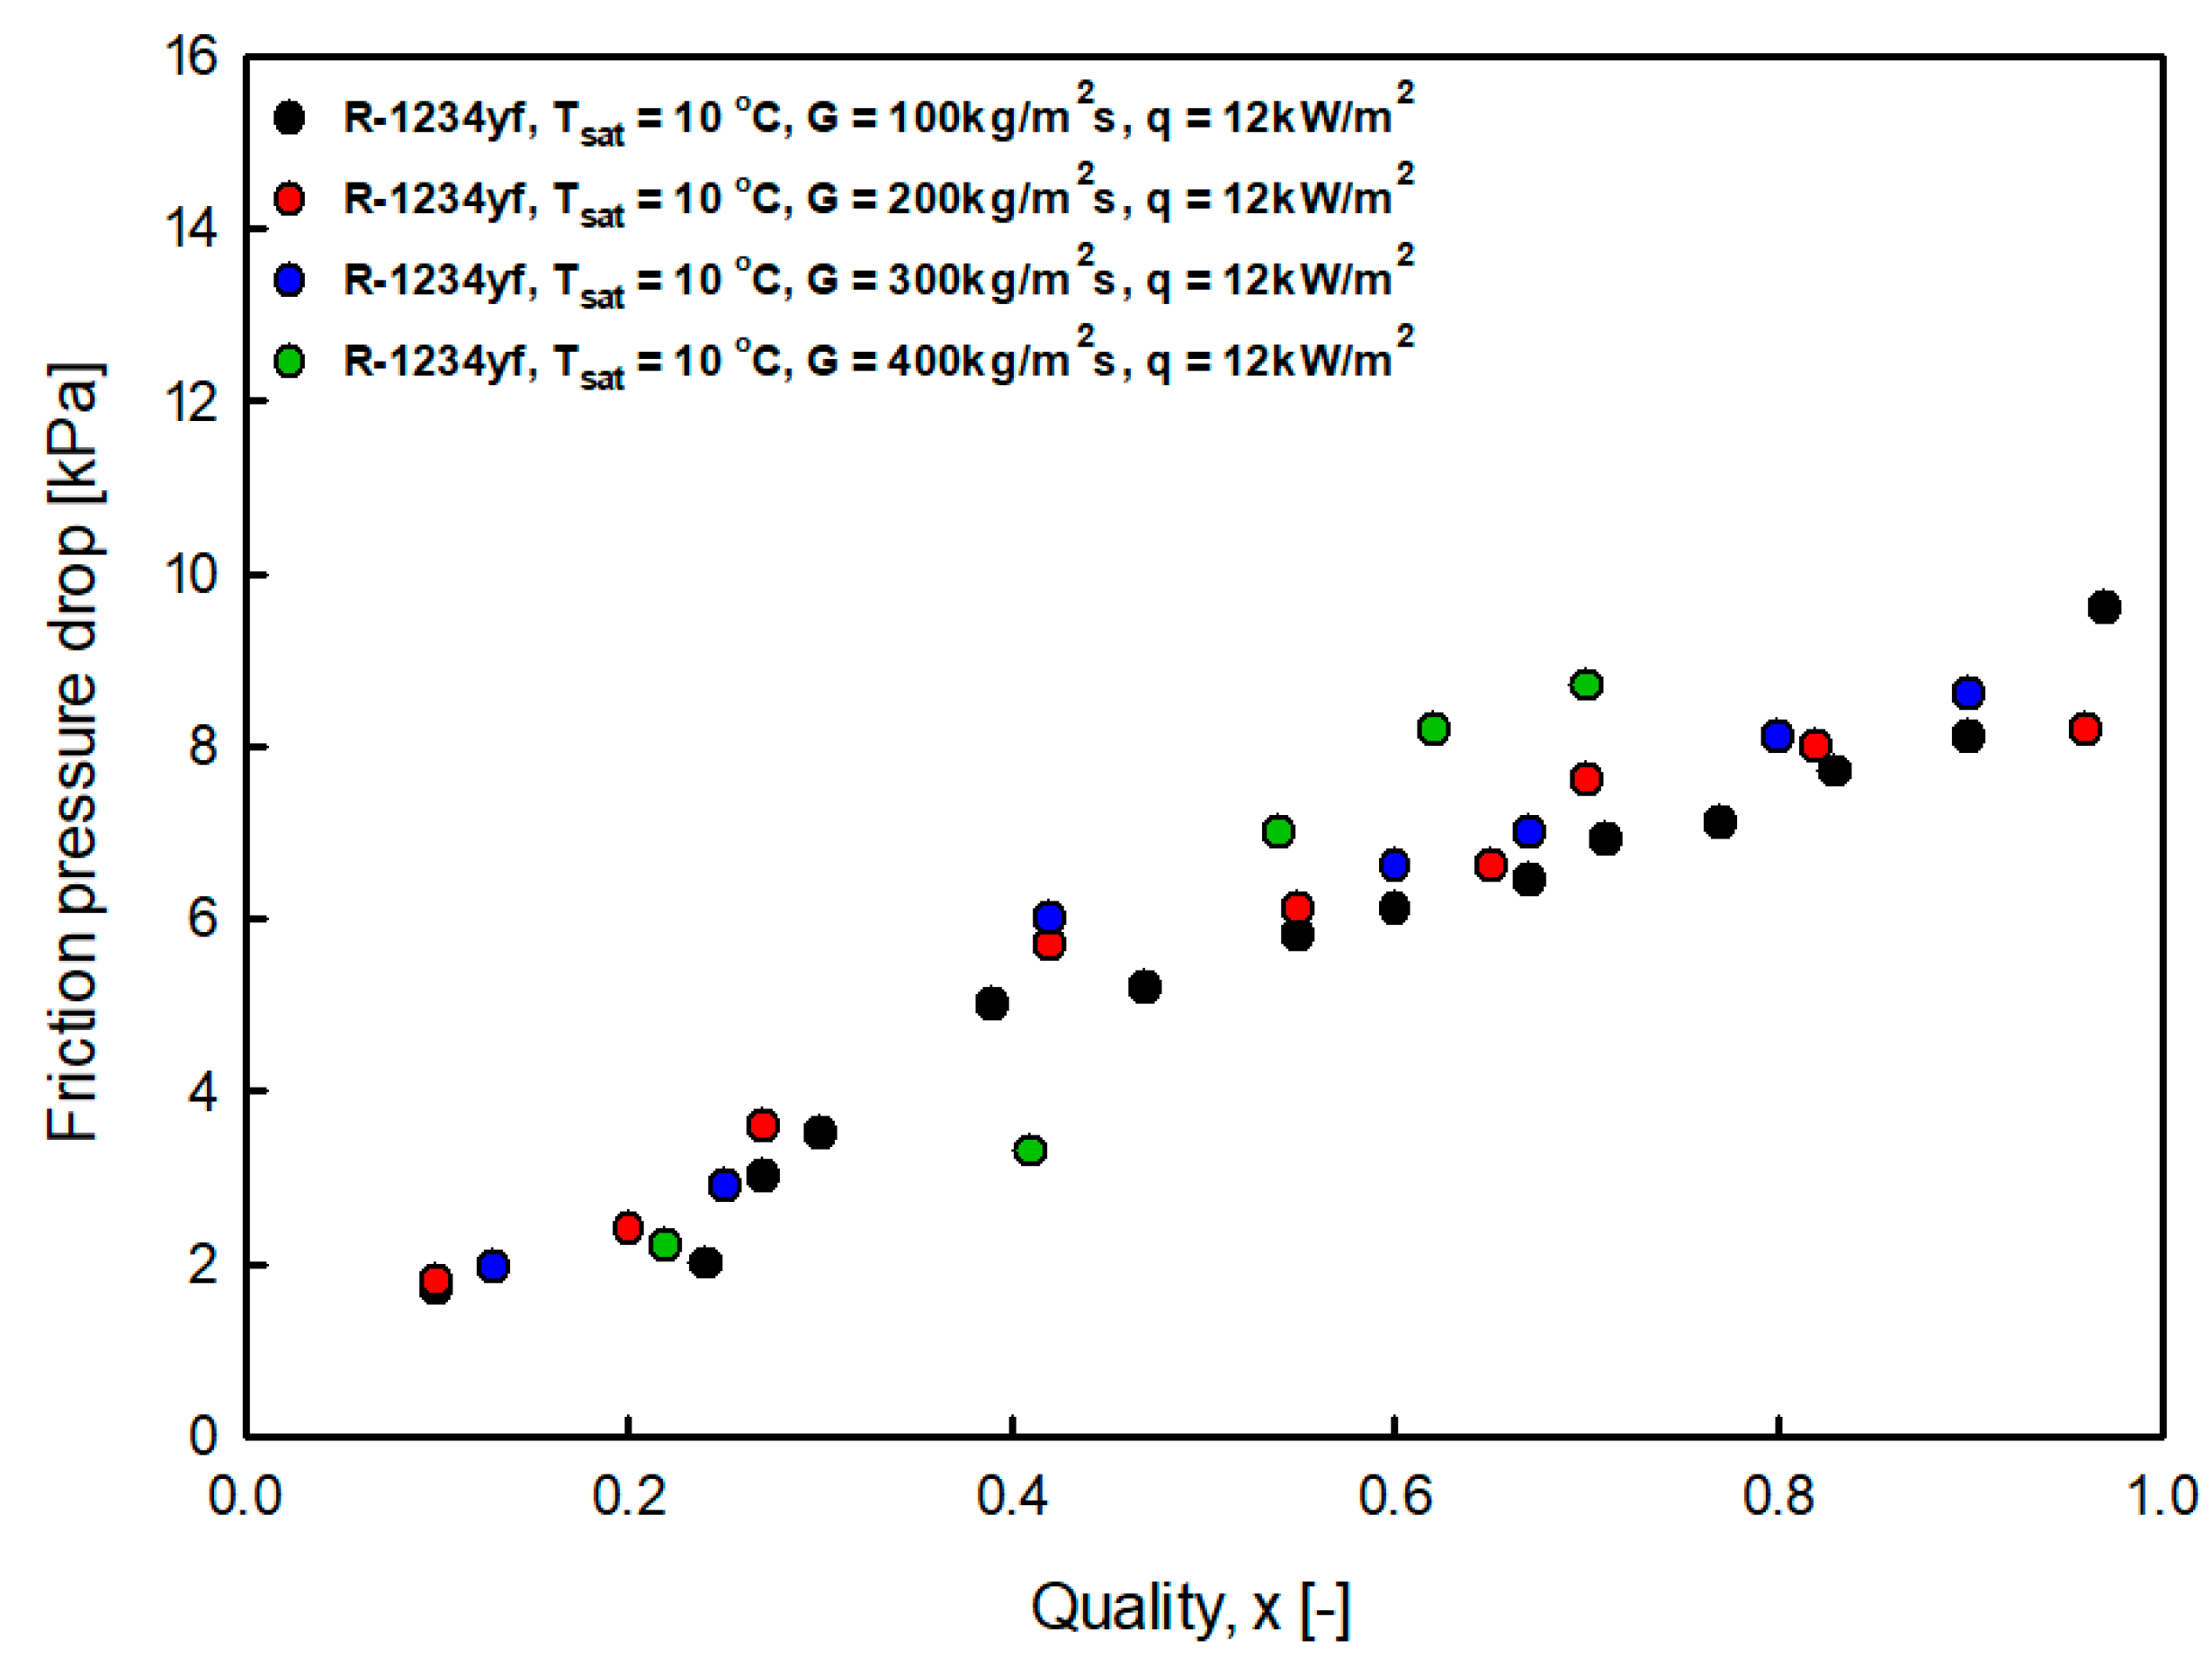
4.2.1. Influence of Mass Flux

Figure 14 and Figure 15 show the pressure drop for mass flux. As the mass flux increased, the shear stress also increased. In addition, the pressure drop increased for the same quality because the interfacial friction increased as the slip ratio between the liquid and vapor increased (Anwar et al. [14]).

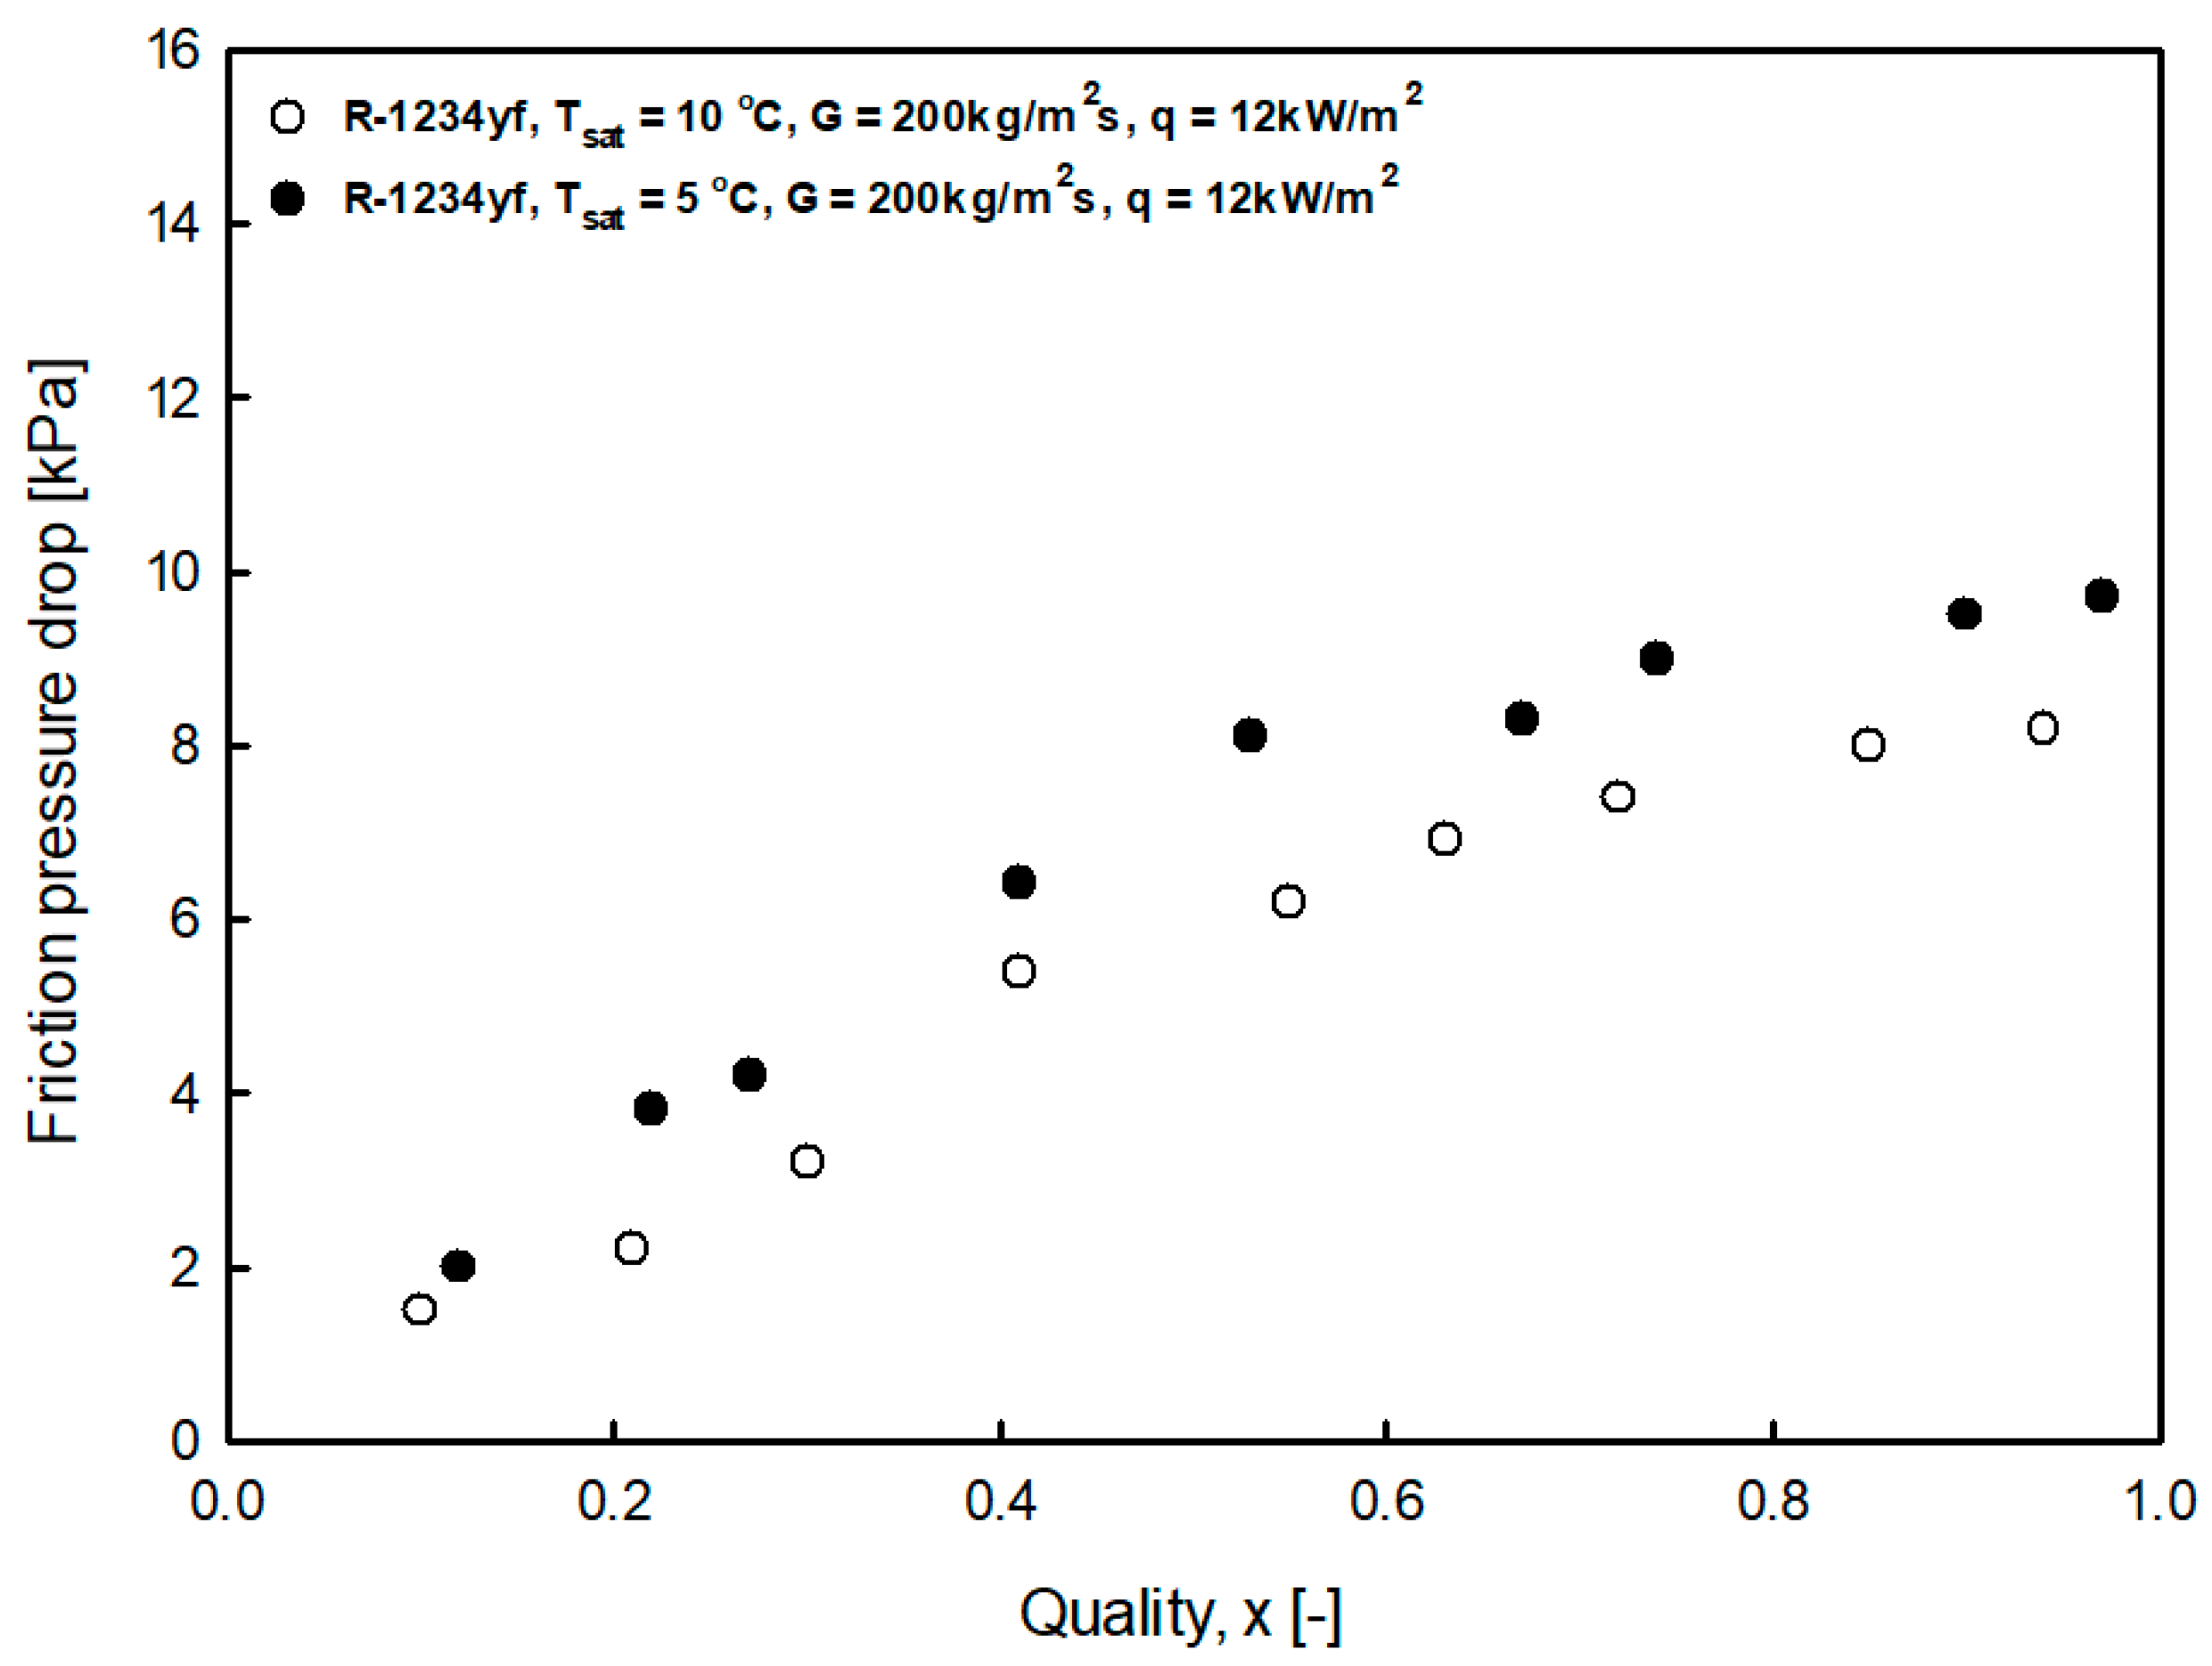
4.2.2. Influence of Saturation Temperature

Figure 16 shows the heat transfer coefficient as the saturation temperature changes. It can be seen that the pressure drop decreased as the saturation temperature increased. This was because, as shown in Table 4, the viscosity and surface tension of R-1234yf decreased as the saturation temperature increased. As a result, the slip ratio between the liquid and vapor reduced, as well as the friction pressure drop.

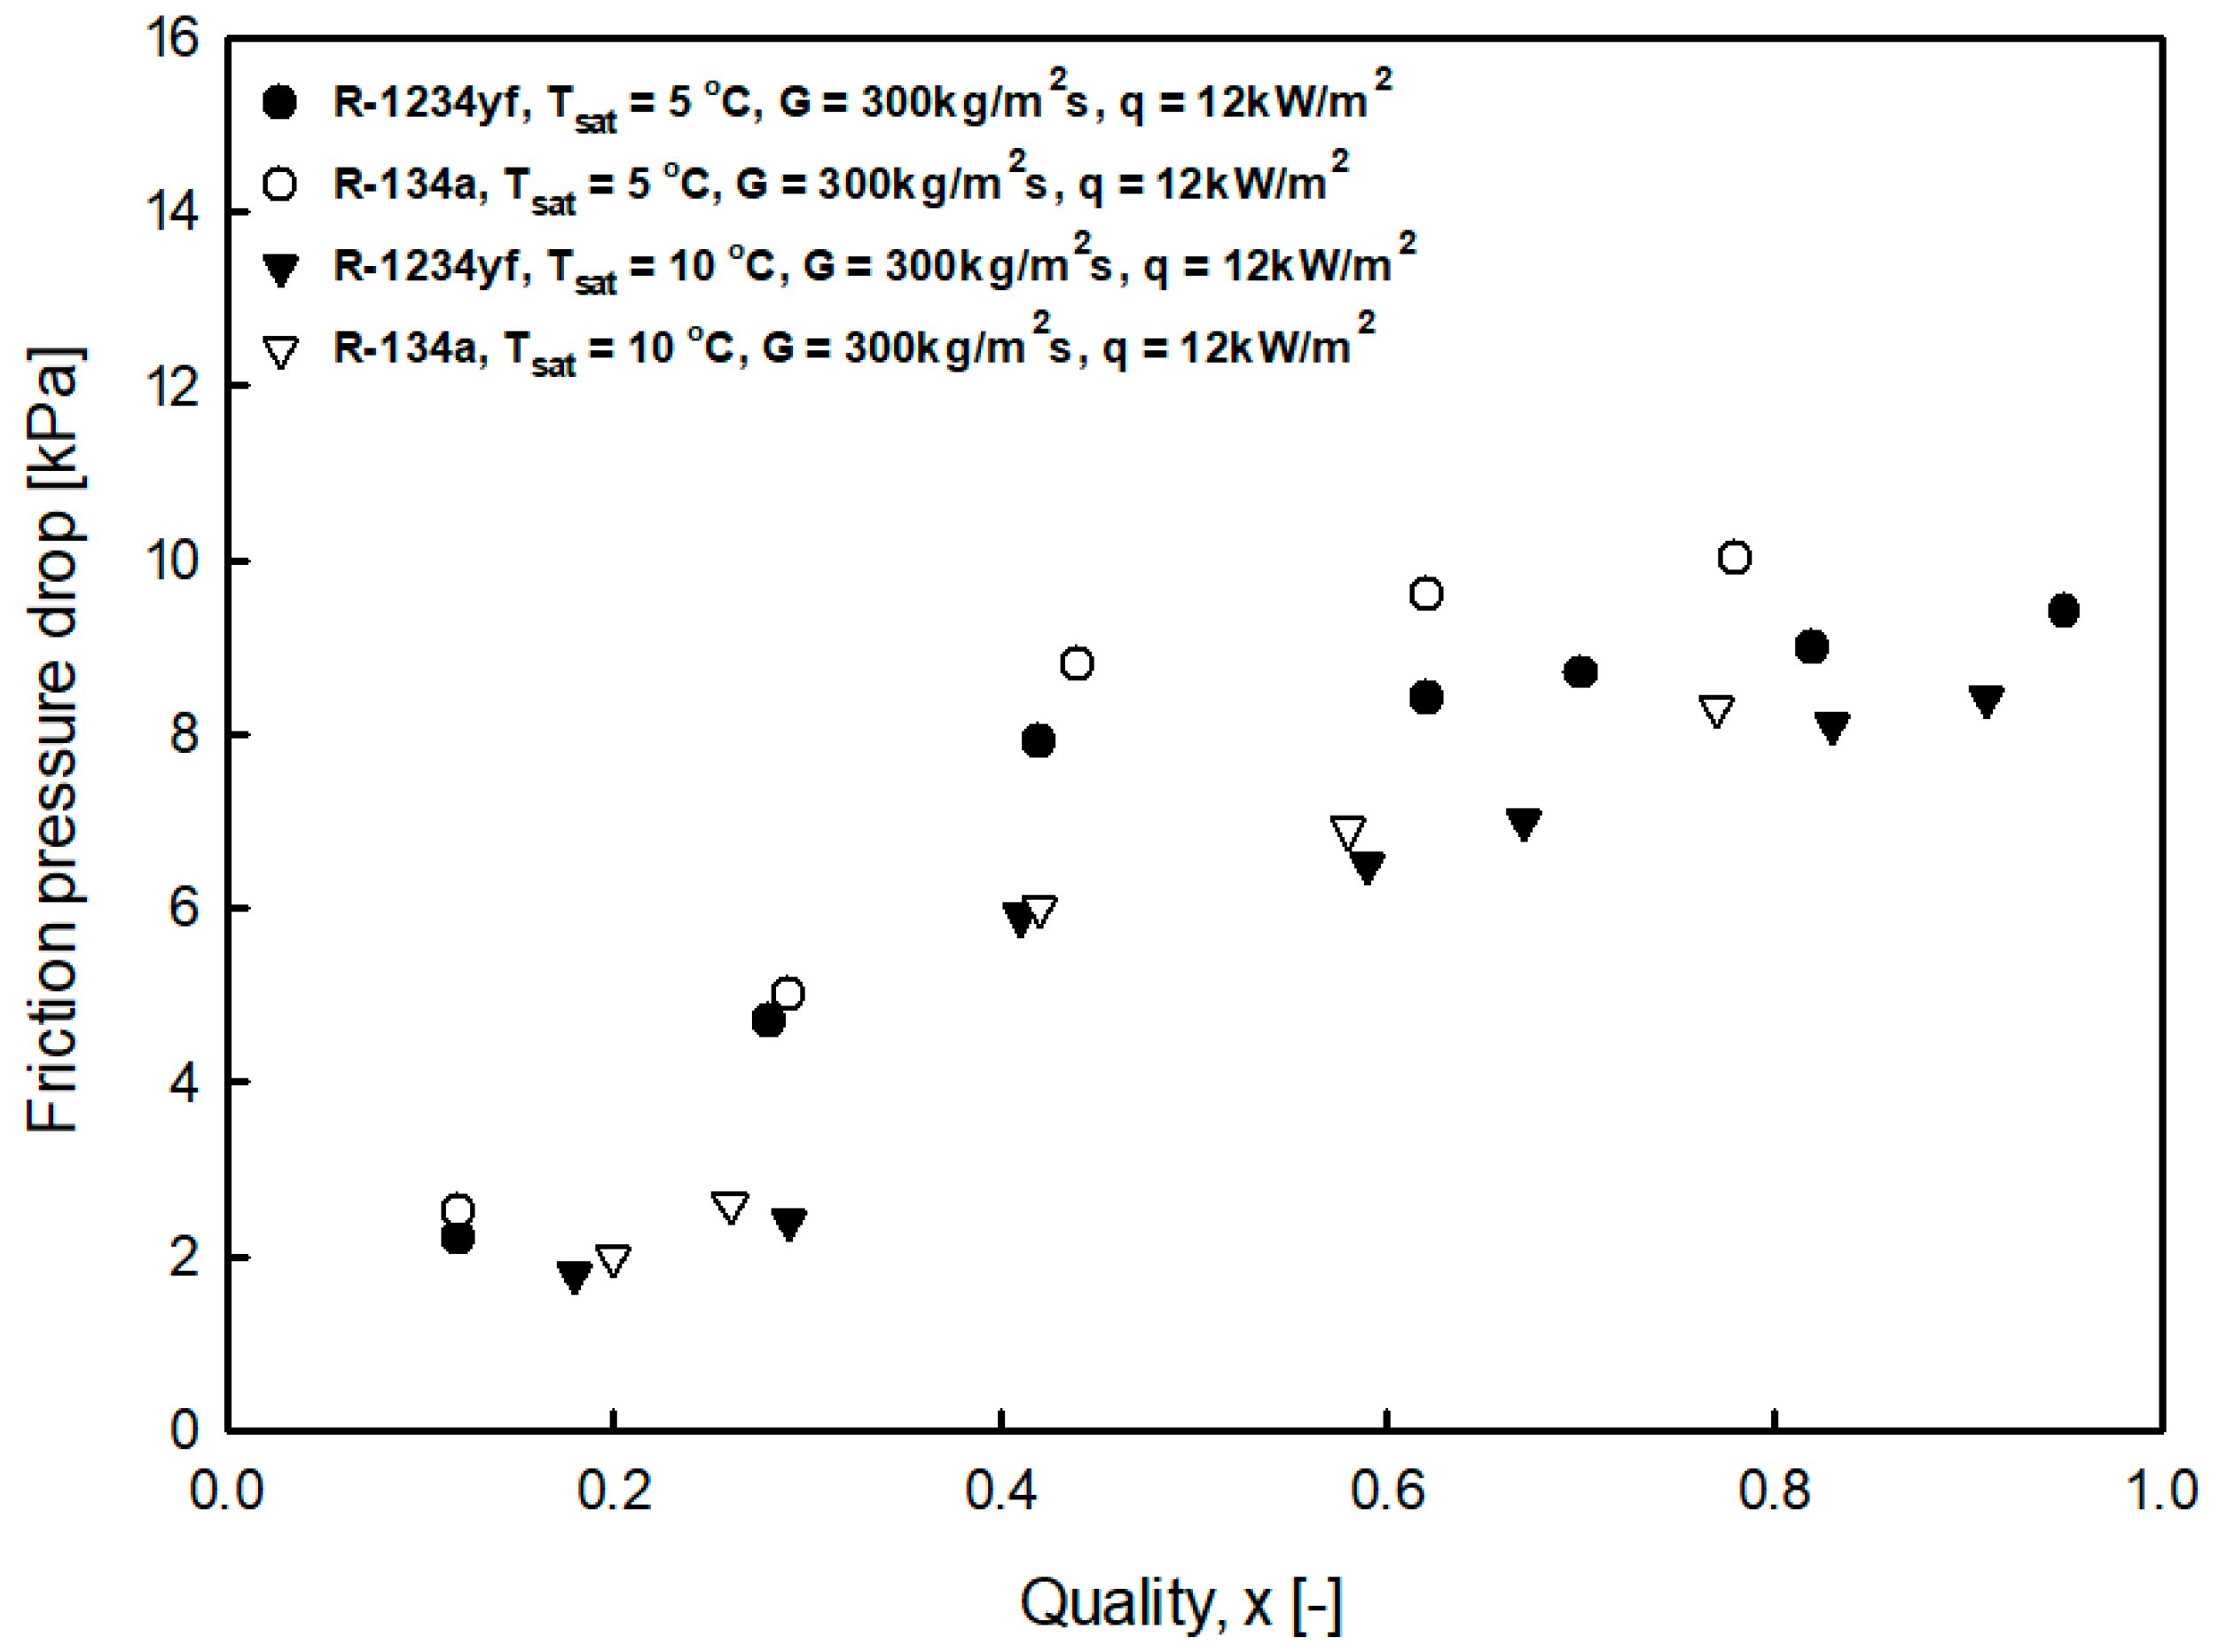
4.2.3. Comparison of the Pressure Drop of R-134a and R-1234yf

Figure 17 shows a graph comparing the pressure drops of R-1234yf and R-134a. It can be seen that the pressure drop was slightly higher for R-134a. This is because the surface tension of R-134a is larger than that of R-1234yf, but the liquid viscosity of R-134a, and the vapor viscosity of R-1234yf is larger, and the pressure drop of R-134a is slightly larger. A similar tendency was reported by Lu et al. [5], Diani et al. [6], Pabon et al. [10], and Yang et al. [15].

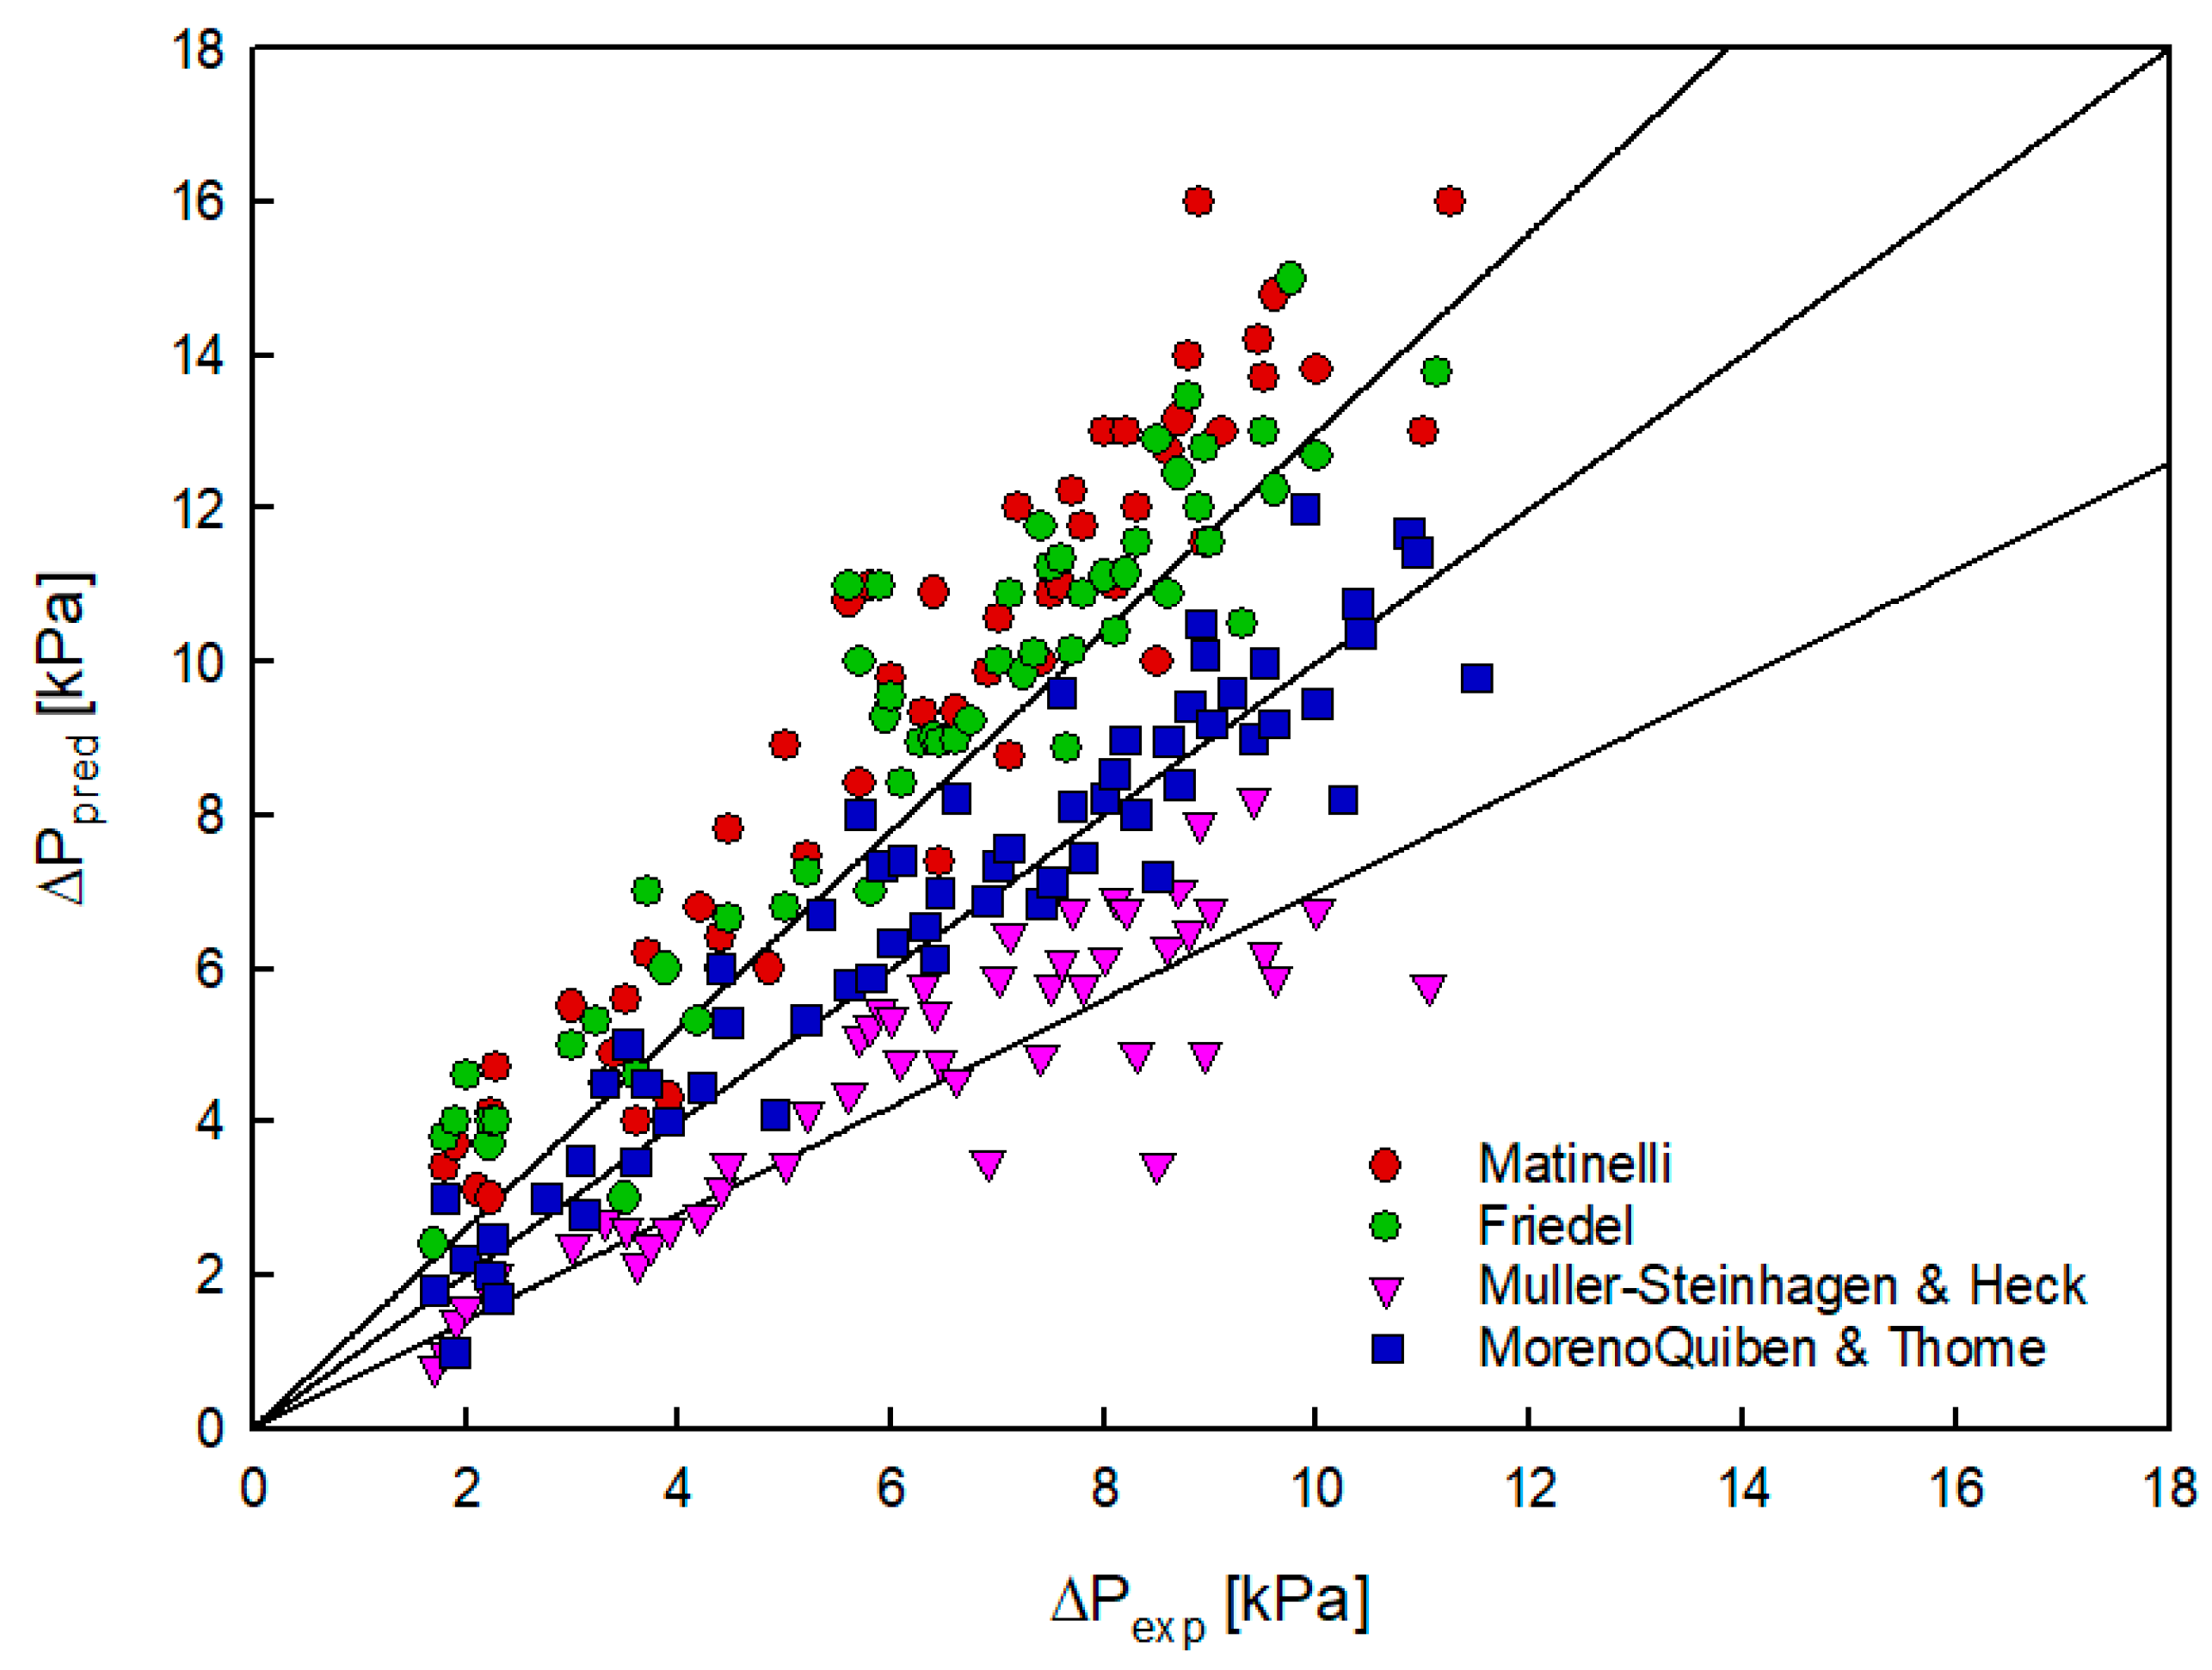
4.2.4. Comparison of the Correlations

Figure 18 compares the well-known correlations of pressure drop reported by Martinelli [29], Friedel [30], Muller-Steinhagen and Heck [31], and Moreno Quibén and Thome [32] with our experimental data. This method is the same as the heat transfer coefficient. Table 6 summarizes the MAE, MRE, STD, and δ (±30%) of each correlation equation. First, the correlation equation of Martinelli and Friedel overestimated the overall experimental results. Muller-Steinhagen and Heck’s correlation equation predicted 67.31% of the data within ±30%, but showed a tendency to slightly underestimate the experimental results. Moreno Quibén and Thome’s correlation equation predicted 88.71% of the data within ±30%. Comparing the best and worst predicted correlations, first, in the case of Lockhart-Martinelli’s correlation equation, which showed the greatest error, a refrigerant completely different from that used in this experiment was applied (Oil, benzene, etc). In addition, there was a large difference depending on the refrigerant because the variables necessary for prediction were fixed. In the case of Moreno Quibén’s correlation equation, which showed the most similar appearance, R-134a, the refrigerant tested to present the correlation equation, showed a tendency which was very similar to the refrigerant used in this experiment (R-1234yf). So Moreno Quibén’s correlation yielded the best predictions.

5. Conclusions

In this study, the heat transfer coefficient and pressure drop of R-1234yf for a smooth tube with an inner diameter of 6.95 mm were experimentally determined. The heat transfer coefficient increased with an increase in the mass flux, saturation temperature, and heat flux. The pressure drop increased with an increase in the mass flow rate and a decrease in saturation temperature. In addition, according to the flow patterns of Taitel and Dukler, most of the experiments were conducted in the annular flow area. When comparing the heat transfer coefficient correlations, Kandlikar’s correlation provided the best prediction for the experimental database, with approximately 84% of the predicted data within ±30%. The Gungor and Winterton correlation overestimated the experimental results as a whole, and the correlation of Liu and Winterton was well predicted at a low heat transfer coefficient, although it tended to be underestimated as the heat transfer coefficient increased. For the pressure drop, Moreno Quibén and Thome’s equation predicted approximately 88.71% of the data within ±30%. As stated, most of the aforementioned studies were conducted with small diameters. Therefore, in this study, the data can be used for the design of an evaporator for households and small refrigerators.

Author Contributions

Conceptualization, J.-H.L.; formal analysis, N.-W.K.; validation, J.-I.Y.; supervision, C.-H.S.; methodology, S.-H.S. All authors have read and agreed to the published version of the manuscript.

Funding

This research received no external funding.

Institutional Review Board Statement

Not applicable.

Informed Consent Statement

Not applicable.

Acknowledgments

In this section, you can acknowledge any support given which is not covered by the author contribution or funding sections. This may include administrative and technical support, or donations in kind (e.g., materials used for experiments).

Conflicts of Interest

The authors declare no conflict of interest.

References

  1. Illán-Gómez, F.; López-Belchí, A.; García-Cascales, J.R.; Vera-García, F. Experimental two-phase heat transfer coefficient and frictional pressure drop inside mini-channels during condensation with R1234yf and R134a. Int. J. Refrig. 2015, 51, 12–23. [Google Scholar] [CrossRef]
  2. Padilla, M.; Revellin, R.; Haberschill, P.; Bensafi, A.; Bonjour, J. Flow regimes and two-phase pressure gradient in horizontal straight tubes: Experimental results for HFO-1234yf, R-134a and R-410A. Exp. Therm. Fluid Sci. 2011, 35, 1113–1126. [Google Scholar] [CrossRef]
  3. Saitoh, S.; Dang, C.; Nakamura, Y.; Hihara, E. Boiling heat transfer of HFO-1234yf flowing in a smooth small-diameter horizontal tube. Int. J. Refrig. 2011, 34, 1846–1853. [Google Scholar] [CrossRef]
  4. Mortada, S.; Zoughaib, A.; Arzano-Daurelle, C.; Clodic, D. Boiling heat transfer and pressure drop of R-134a and R-1234yf in minni channels for low mass fluxes. Int. J. Refrig. 2012, 35, 962–973. [Google Scholar] [CrossRef]
  5. Lu, M.C.; Tong, J.R.; Wang, C.C. Investigation of the two-phase convective boiling of HFO-1234yf in a 3.9 mm diameter tube. Int. J. Heat Mass Transf. 2013, 65, 545–551. [Google Scholar] [CrossRef]
  6. Diani, A.; Mancin, S.; Rossetto, L. Flow boiling heat transfer of R1234yf inside a 3.4 mm ID microfin tube. Exp. Therm. Fluid Sci. 2015, 66, 127–136. [Google Scholar] [CrossRef]
  7. Choi, K.I.; Chien, N.B.; Oh, J.T. Heat Transfer Coefficient during Evaporation of R-1234yf, R-134a, and R-22 in Horizontal Circular Small Tubes. Adv. Mech. Eng. 2015, 2013, 1–8. [Google Scholar] [CrossRef] [Green Version]
  8. Sempértegui-Tapia, D.F.; Ribatski, G. Flow boiling heat transfer of R134a and low GWP refrigerants in a horizontal micro-scale channel. Int. J. Heat Mass Transf. 2017, 108, 2417–2432. [Google Scholar] [CrossRef]
  9. Kedzierski, D.K. Horizontal convective boiling of R1234yf, R134a, and R450A within a micro-fin tube. Int. J. Refrig. 2018, 88, 538–551. [Google Scholar] [CrossRef] [PubMed]
  10. Pabon, J.G.; Khosravi, A.; Nunes, R.; Machado, L. Experimental investigation of pressure drop during two-phase flow of R1234yf in smooth horizontal tubes with internal diameters of 3.2 mm to 8.0 mm. Int. J. Refrig. 2019, 104, 426–436. [Google Scholar] [CrossRef]
  11. Del Col, D.; Bortolin, S.; Torresin, D.; Cavallini, A. Flow boiling of R1234yf in a 1 mm diameter channel. Int. J. Refrig. 2013, 36, 353–362. [Google Scholar] [CrossRef]
  12. Oh, J.T.; Choi, K.I.; Nguyen, C.B.; Kim, K.W. Boiling Heat Transfer of R-1234yf in Horizontal Circular Small Tubes. Int. Refrig. Air Cond. Conf. 2012, 34, 1–7. [Google Scholar]
  13. Kim, K.W.; Chien, N.B.; Choi, K.I.; Oh, J.T. Measurement and correlation of boiling heat transfer coefficient of R-1234yf in horizontal small tubes. J. Mech. Sci. Technol. 2014, 28, 4301–4308. [Google Scholar] [CrossRef]
  14. Anwar, Z.; Palm, B.; Khodabandeh, R. Flow boiling heat transfer, pressure drop and dryout characteristics of R1234yf: Experimental results and predictions. Exp. Therm. Fluid Sci. 2015, 66, 137–149. [Google Scholar] [CrossRef]
  15. Yang, C.Y.; Nalbandian, H.; Lin, F.C. Flow boiling heat transfer and pressure drop of refrigerants HFO-1234yf and HFC-134a in small circular tube. Int. J. Heat Mass Transf. 2018, 121, 726–735. [Google Scholar] [CrossRef]
  16. Choi, K.I.; Oh, J.T.; Saito, K.; Jeong, J.S. Comparison of heat transfer coefficient during evaporation of natural refrigerants and R-1234yf in horizontal small tube. Int. J. Refrig. 2014, 41, 210–218. [Google Scholar] [CrossRef]
  17. Jige, D.; Kikuchi, S.; Mikajiri, N.; Inoue, N. Flow boiling heat transfer of zeotropic mixture R1234yf/R32 inside a horizontal multiport tube. Int. J. Refrig. 2020, 119, 390–400. [Google Scholar] [CrossRef]
  18. Sajadi, B.; Najafizadeh, M.M.; Soleimani, M.; Behabadi, M.A.; Naserinejad, J. The effect of wire-coil inserts on the heat transfer and pressure drop of R1234yf flow boiling. Appl. Therm. Eng. 2019, 152, 615–623. [Google Scholar] [CrossRef]
  19. Zhang, J.; Desideri, A.; Kærn, M.R.; Ommen, T.S.; Wronski, J.; Haglind, F. Flow boiling heat transfer and pressure drop characteristics of R134a, R1234yf and R1234ze in a plate heat exchanger for organic Rankine cycle units. Int. J. Heat Mass Transf. 2017, 108, 1787–1801. [Google Scholar] [CrossRef] [Green Version]
  20. NIST, REFPROP 8.0. Available online: https://www.techstreet.com/standards/nist-refprop-8-0?product_id=1696006 (accessed on 3 October 2021).
  21. Roetzel, W.; Luo, X.; Chen, D. Design and Operation of Heat Exchangers and Their Networks; Convey, M., Adamson, P., Eds.; Academic Press: Cambridge, MA, USA, 2020; pp. 13–69. [Google Scholar]
  22. Rouhani, Z.; Axelsson, E. Calculation of void volume fraction in the subcooled and quality boiling regions. Int. J. Heat Mass Transf. 1970, 13, 383–393. [Google Scholar] [CrossRef]
  23. Kline, J.S.; McClintock, F.A. Describing Uncertainties in Single-Sample Experiments. Mech. Eng. 1953, 75, 3–8. [Google Scholar]
  24. Taitel, Y.L.; Dukler, A.E. A model for predicting flow regime transitions in horizontal and near horizontal gas-liquid flow. AIChE J. 1976, 22, 47–55. [Google Scholar] [CrossRef]
  25. Gungor, K.E.; Winterton, R.H.S. A general correlation for saturated flow boiling and comparisons of correlations with data. Chem. Eng. Res. Des. 1987, 65, 148–156. [Google Scholar]
  26. Kandlikar, S.G. A Gerneral Correlation for Saturated Two-Phase Flow Boiling Heat Transfer Inside Horizontal and Vertical Tubes. J. Heat Transf. 1990, 112, 219–228. [Google Scholar] [CrossRef] [Green Version]
  27. Liu, Z.; Winterton, R.H.S. A general correlation for saturated and subcooled flow boiling in tubes and annuli, based on a nucleate pool boiling equation. Int. J. Heat Mass Transf. 1991, 34, 2759–2766. [Google Scholar] [CrossRef]
  28. Mohammed, S.M. Chart correlation for saturated boiling heat transfer: Equations and further study. ASHRAE Trans. 1982, 88, 185–196. [Google Scholar]
  29. Lockhart, R.W.; Martinelli, R.C. Proposed correlation of data for isothermal two-phase, two-component flow in pipes. Chem. Eng. Prog. 1949, 45, 39–48. [Google Scholar]
  30. Friedel, L. Improved friction pressure drop correlation for horizontal and vertical two-phase pipe flow. Mater. Sci. 1979, 18, 485–491. [Google Scholar]
  31. Müller-Steinhagen, H.; Heck, K. A simple friction pressure drop correlation for two-phase flow in pipes. Chem. Eng. Process. 1986, 20, 297–308. [Google Scholar] [CrossRef]
  32. Moreno Quibén, J.; Thome, J.R. Flow pattern based two-phase frictional pressure drop model for horizontal tubes, Part II: New phenomenological model. Int. J. Heat Fluid Flow 2007, 28, 1060–1072. [Google Scholar] [CrossRef]
Figure 1. Schematic diagram of experimental apparatus.
Energies 14 06325 g001
Figure 2. Schematic diagram of a subsection of horizontal smooth tube.
Energies 14 06325 g002
Figure 3. Detailed view of test section (Front side of the horizontal smooth tube).
Energies 14 06325 g003
Figure 4. Thermal efficiency of electric heater in the test section.
Energies 14 06325 g004
Figure 5. Variation of R-1234yf evaporation heat transfer coefficient with mass flux at saturation temperature 5 °C.
Energies 14 06325 g005
Figure 6. Variation of R-1234yf evaporation heat transfer coefficient with mass flux at saturation temperature 10 °C.
Energies 14 06325 g006
Figure 7. Variation of R-1234yf evaporation heat transfer coefficient with heat flux at saturation temperature 5 °C.
Energies 14 06325 g007
Figure 8. Variation of R-1234yf evaporation heat transfer coefficient with heat flux at saturation temperature 10 °C.
Energies 14 06325 g008
Figure 9. Variation of R-1234yf evaporation heat transfer coefficient with saturation temperature.
Energies 14 06325 g009
Figure 10. Comparison of evaporation heat transfer coefficient of R-134a and R-1234yf.
Energies 14 06325 g010
Figure 11. Heat transfer coefficient of top and bottom side.
Energies 14 06325 g011
Figure 12. Flow pattern of experiment results in Taitel-Dukler map.
Energies 14 06325 g012
Figure 13. Comparison between measured and calculated heat transfer coefficients.
Energies 14 06325 g013
Figure 14. Variation of R-1234yf friction pressure gradient with mass flux at saturation temperature 5 °C.
Energies 14 06325 g014
Figure 15. Variation of R-1234yf friction pressure gradient with mass flux at saturation temperature 10 °C.
Energies 14 06325 g015
Figure 16. Variation of R-1234yf friction pressure gradient with saturation temperature.
Energies 14 06325 g016
Figure 17. Comparison of friction pressure gradient of R-134a and R-1234yf.
Energies 14 06325 g017
Figure 18. Comparison between measured and calculated pressure gradient.
Energies 14 06325 g018
Table 1. Summary of R-123yf heat transfer test results.
AuthorTube Typedi (mm)RefrigerantG (kg/m2s)Tsat (°C)x (-)
Illán-Gómez et al. [1]mini
channel
1.16R-134a
R-1234yf
350–94030–550.1–0.89
Padilla et al. [2]Straight
tube
7.90, 10.85R134a
R1234yf
187–17024.8–20.70.04–0.98
Saitoh et al. [3]Smooth
tube
2.0R1234yf100–400150–0.25
Mortada et al. [4]Rectangular minichannel1.1R134a
R1234yf
20–100-0–1.0
Lu et al. [5]Smooth
tube
3.9R134a,
R1234yf
100–500100.1–0.9
Diani et al. [6]Mini microfin tube3.4R134a
R1234yf
190–940300.1–0.99
Choi et al. [7]Horizontal
tube
1.5,
3.0
R134a
R1234yf
100–6505, 100–1.0
Sempértegui-Tapia et al. [8]micro
channel
1.1R-134a
R-1234yf
200–80031–410.05–0.95
Kedzierski et al. [9]microfin tube8.8R134a
R1234yf
96–3180–8.80.03–0.87
Pabon et al. [10]Smooth
tube
3.2, 4.8,
6.4,
8.0
R134a
R1234yf
200–40020, 300–1.0
Del Col et al. [11]Micro minichannel1.0R134a
R1234yf
200–600310.05–0.9
Oh et al. [12]Horizontal
tube
1.5, 3.0R1234yf50–6000, 5, 100–1.0
Kim et al. [13]Horizontal
tube
1.5,
3.0
R1234yf200–650150–1.0
Anwar et al. [14]Vertical minichannel1.6R134a
R1234yf
100–50027, 320–1.0
Yang et al. [15]Smooth
tube
4.0R134a
R1234yf
200–1200140.191–0.249
Table 2. Experimental conditions.
ParameterUnitValue
Refrigerant-R-1234yf
Quality-0~1
Saturation temperature°C5, 10
Mass fluxkg/m2s100~00
Heat fluxkW/m26~24
Tube lengthmm3000
Tube diametermm6.95
Table 3. Uncertainty analysis.
Flow MeterUncertainty: ±0.1%Flow Meter
T-type thermocoupleUncertainty: ±0.75%T-type thermocouple
Pressure transmitterUncertainty: ±0.25%Pressure transmitter
Differential pressure transmitterUncertainty: ±0.25%Differential pressure transmitter
Table 4. Comparison of properties of R-134a and R-1234yf at saturation temperature.
PropertyUnitTsat = 5 °CTsat = 10 °C
R-134aR-1234yfR-134aR-1234yf
Saturation pressurekPa349.66372.92414.61437.53
Liquid densitykg/m31278.11160.41261.01144.0
Vapor densitykg/m317.13120.74420.22624.267
Liquid thermal conductivityW/mK89.80673.42287.61871.978
Vapor thermal conductivityW/mK11.95412.04412.40212.471
Liquid specific heatJ/kgK1.35521.30801.37041.3274
Vapor specific heatJ/kgK0.92060.948350.94550.9717
Liquid viscosity10−6 N/m2s250.11197.10234.87185.64
Vapor viscosity10−6 N/m2s10.91111.36311.09911.581
Surface tension10−6 N/m10.8448.691910.1388.0364
Table 5. Comparison heat transfer coefficient with correlation.
CorrelationMAEMRESTDδ ± 30%
Gungor and Winterton [25]48.5547.527.3330.6%
Kandilkar [26]17.35−6.2220.381.6%
Liu and Winterton [27]26.97−24.5818.1748.8%
Shah [28]45.8644.4432.0535.3%
Table 6. Comparison pressure drop with correlation.
CorrelationMAEMRESTDδ ± 30%
Martinelli [29]51.8551.8521.912.96%
Friedel [30]48.7148.2125.6219.64%
Muller-Steinhagen and Heck [31]25.51–25.5112.4267.31%
Moreno Quibén and Thome [32]14.127.4519.9588.71%
Publisher’s Note: MDPI stays neutral with regard to jurisdictional claims in published maps and institutional affiliations.

