Article

Ultrasonic Delignification and Microstructural Characterization of Switchgrass

1
Department of Chemical and Biological Engineering, University of Saskatchewan, 57 Campus Drive, Saskatoon, SK S7N 5A9, Canada
2
Agriculture and Agri-Food Canada, Saskatoon Research and Development Centre, 107 Science Place, Saskatoon, SK S7N 0X2, Canada
*
Author to whom correspondence should be addressed.
Energies 2021, 14(2), 263; https://doi.org/10.3390/en14020263
Submission received: 10 November 2020 / Revised: 19 December 2020 / Accepted: 29 December 2020 / Published: 6 January 2021
(This article belongs to the Special Issue New Horizons in Biofuel Production, Technologies, and Emissions)

Abstract

:
This present study was undertaken to investigate the ultrasonic delignification of switchgrass (Panicum virgatum L.) and the effects of ultrasonic irradiation on the molecular and microstructure of switchgrass. We investigated this question using response surface methodology (RSM) featuring a four-factor, three-level Box–Behnken experimental design with acoustic power (120, 180, and 240 W), solid–solvent ratio (1/25, 1/20, and 1/15 g/mL), hammer mill screen size (1.6, 3.2, and 6.4 mm), and sonication time (10, 30, and 50 min) as factors, while delignification (%) was the response variable. The native and treated switchgrass samples were further characterized through crystallinity measurements and electron microscopy. The results of lignin analysis show that the percent delignification ranged between 1.86% and 20.11%. The multivariate quadratic regression model developed was statistically significant at p < 0.05. SEM and TEM micrographs of the treated switchgrass grinds resulted in cell wall disruption at the micro- and nano-scales. XRD analysis revealed a reduction in the mean crystallite size and crystallinity index from 15.39 to 13.13 Å and 48.86% to 47.49%, respectively, while no significant change occurred in the d-spacings. The results of this investigation show that ultrasonic irradiation induces chemical and structural changes in switchgrass, which could enhance its use for biofuel and bioproducts applications.

1. Introduction

Switchgrass (Panicum virgatum L.) is a high-potential energy crop with promising prospects as feedstock for biofuels and bioproducts applications [1,2]. It is prevalent in Southern Canada, Central America, Northern Mexico, and related ecosystems such as savanna, heathland, forest margins, and swamps [3]. Switchgrass, a deep-rooted C4 perennial grass, has attractive agronomic attributes including moderate to high biomass yield, ability to grow in wetlands, adapt to dearth, stand longevity, minimal fertilizer input, resistance to pests and diseases, environmental benefits and vast applications [4]. Herbaceous grasses such as switchgrass store their energy mostly in plant cell walls, which comprise 40% to 80% of the biomass in herbaceous plants, depending on the cultivar and plant maturity [5]. Dien et al. [6] and Yan et al. [7] reported variations in the chemical composition of switchgrass. These variations stemmed from the differences in cultivars and tissue maturity in relation to the time of harvest. Cellulose, hemicellulose, lignin, extractives, and inorganic salts are the main constituents of lignocellulosic biomass [8]. Cellulose and hemicellulose are the starting material for the production of cellulosic ethanol through enzymatic hydrolysis of these insoluble, polymeric carbohydrates into soluble sugars including glucose and xylose [9]. Lignin, another primary constituent of plant cells walls, is a phenolic compound formed by plants through the oxidative polymerization of p-hydroxycinnamyl alcohols and guaiacyl (G), syringyl (S), and p-phydroxyphenyl (H) propanol monolignols, which are similarly linked by an oxidative polymerization mechanism. Unlike softwood lignin (G monolignol unit) and hardwood lignin (G and S monolignol units), lignin in herbaceous grasses is composed of G, S, and H monolignols. Lignin is responsible for structural stability in lignocellulosic biomass [10,11]. Lignin content and composition are often considered as the major limiting factor to enzymatic hydrolysis of cellulosic biomass [12]; however, some studies have reported the role of hemicelluloses, structural pectins, the crystallinity of cellulose, the degree of cellulose polymerization, the degree of acetylation of hemicelluloses and polymer interactions within the cell wall as other significant factors responsible for cell wall recalcitrance [13,14,15,16].
Although switchgrass is rapidly gaining acceptance as a bioenergy feedstock, the complex nature of the cell wall and the recalcitrance associated with the presence of compounds such as lignin encumber its economic viability as a feedstock for cellulosic ethanol production [17]; as such, pretreatment is necessary to maximize its glucose yield. Understanding the structural and compositional properties of switchgrass is pivotal for efficient and effective pretreatment strategies for this feedstock and its use for biofuel production. Lignocellulosic biomass pretreatment enhances the hydrolysis of carbohydrates to fermentable sugars by modifying structural and chemical composition of the biomass. The high cost of pretreatment relative to other unit processes, except for feedstock production cost, in cellulosic ethanol production hinders the conversion of lignocellulosic biomass for biofuels and biorefinery applications [18]. An ideal pretreatment strategy should be economical, should deconstruct lignin optimally, should be effective for various lignocellulosic substrates, should have minimal glucan loss, should avoid the use of corrosive chemical reagents, should reduce waste generation and environmental pollution, and should generate low levels of fermentation inhibitors [9,16,19].
In recent years, interest has increased in treatments without chemical reagents and pollution due to environmental concerns. As a pollution-free pretreatment approach, ultrasonic irradiation is now widely used in many industrial processes. Ultrasonication is a physicochemical treatment process that releases energy in the form of acoustic waves of frequencies greater than 16–20 kHz [20]. Acoustic waves produce acoustic cavitation due to pressure variation within the fluid. The collapse of cavitation bubbles results in a speedy increase in local temperature and pressure within the fluid. The chemical and physical effects of ultrasonic waves can be harnessed for the pretreatment of different lignocellulosic biomass [21], indicating the possibility of adopting it in cellulosic ethanol production technology. In ultrasonication pretreatment, the biomass feedstock is usually suspended in an aqueous medium and subjected to ultrasonic wave treatment [22]. Application of ultrasound treatment generates microscopic cavitation bubbles that disintegrate the cellulose and hemicellulose fractions, hence increasing the accessibility to cellulose-degrading enzymes that is required for hydrolysis of these polymeric carbohydrates [23]. The sonochemical and mechano-acoustic effects of ultrasonic irradiation result in delignification and surface erosion of lignocellulosic biomass during the treatment. Ultrasonication pretreatment can be direct or indirect. In direct ultrasonication, a sonication probe (sonotrode) is inserted directly into the medium being sonicated, while for indirect sonication, the acoustic waves are transmitted through a water bath containing the sample vessel [24]. Direct ultrasonication is more suitable for processing slurries of lignocellulosic biomass. The effectiveness of an ultrasonication pretreatment relies on two major factors, namely, cavitation intensity and the active cavitation volume within a treatment medium. Additionally, the duration of sonication, processing temperature, biomass characteristics, reactor configuration, and frequency of ultrasound, sonication power, amplitude of sonication, and efficiency of the ultrasound transducer also affect ultrasonic pretreatment process kinetics [25,26]. The application of ultrasonic irradiation in enzymatic saccharification of cellulosic biomass and other processes in biofuel production has been widely reported [27,28,29,30]. Many literature reports have described an improved efficiency in ultrasonic pretreatment when integrated with other pretreatment methods [26,28,31]. Ur Rehman et al. [24] examined several studies on the use of ultrasonic pretreatment on various biomass feedstocks.
The pretreatment of switchgrass using the ultrasonication method has received minimal attention. Therefore, the objectives of this work were to investigate ultrasonic delignification of switchgrass to enhance its enzymatic digestibility, and to examine the molecular and microstructural changes in ultrasonic-treated switchgrass for biofuel and bioproducts applications.

2. Materials and Methods

2.1. Biomass Sample Collection and Preparation

Switchgrass (Panicum virgatum L.) of variety “Cave-in-rock” procured from a farm in the Nappan area (45.77° N, 64.24° W) of Novia Scotia, Canada, in February of 2019 was used in this study. The switchgrass was harvested in October 2018, and was swathed and air dried in a storage building for 2 months before collection. The switchgrass samples collected were already chopped and stored in plastic bags. The moisture content of the switchgrass samples was 9.1% (w.b.) as received. The particle sizes of the native switchgrass samples were manually distributed to the size equivalent of the output of a farmhand model (F890-A) tub grinder with a screen size of 51 mm. The geometric mean length of the chopped switchgrass was determined using a chopped forage size analyzer specified in ANSI/ASAE standard S424.1 MAR 92 [32]. The chopped native switchgrass samples were further comminuted using a hammer mill (Serial no. 6M13688; Glen Mills Inc., Maywood, NJ, USA) with three different screen sizes (6.4, 3.2 and 1.6 mm) to increase the surface area of the biomass, and then stored in air-tight polyethylene bags until needed.

2.2. Measurement of Physical Properties of the Native Switchgrass

Physical properties of the untreated switchgrass grind were determined for the 6.4, 3.2, and 1.6 mm hammer mill screen sizes. The geometric mean diameter of the native switchgrass grinds was determined using ANSI/ASAE standard S319.4 [33]. In this process, 100 g of the ground sample was placed on a stack of sieves arranged from the largest to the smallest opening. The sieve series were selected based on the range of particle sizes in the samples. For grinds from the 6.4 mm hammer mill screen opening, U.S. sieve numbers 10, 16, 20, 30, 50 and 70 (sieve opening sizes: 2.000, 1.190, 0.841, 0.595, 0.297 and 0.210 mm, respectively) were used. For grinds from the 3.2 and 1.6 mm hammer mill screen openings, U.S. sieve numbers 16, 20, 30, 50, 70 and 100 (sieve opening sizes: 1.190, 0.841, 0.595, 0.297, 0.210 and 0.149 mm, respectively) were used. A Ro-Tap sieve shaker (W. S. Tyler Inc., Mentor, OH, USA) was used for particle size analysis. The endpoint was decided by determining the mass on each sieve at 1 min intervals after an initial sieving time of 10 min. The test for normality was conducted using SPSS software version 26 (IBM SPSS, Armonk, NY, USA).
The particle and bulk density of the untreated samples at the 6.4, 3.2 and 1.6 mm hammer mill screen sizes were determined. Particle density was measured using a gas displacement pycnometer (AccuPyc 1340, Micromeritics Instruments Corp., Norcross, GA, USA) at a temperature of 24 ± 0.7 °C. Results were obtained for 10 replicates of each sample. Bulk density of the switchgrass grinds was measured using a standard 0.5 L cylindrical container (SWA951, Superior Scale Co. Ltd., Winnipeg, MB, Canada). The grinds were placed on the funnel and continuously dropped at the center of the cylindrical container. A tiny wire was used to stir the grind to keep the material flowing through the funnel. The bulk density of the switchgrass grinds in kg m−3 was determined by computing the mass per unit volume. The porosity of each of the samples was determined using Equation (1).
= 1 ρ b ρ p ,
where is the porosity, while ρ b (kg m−3) and ρ p (kg m−3) are bulk and particle density, respectively.

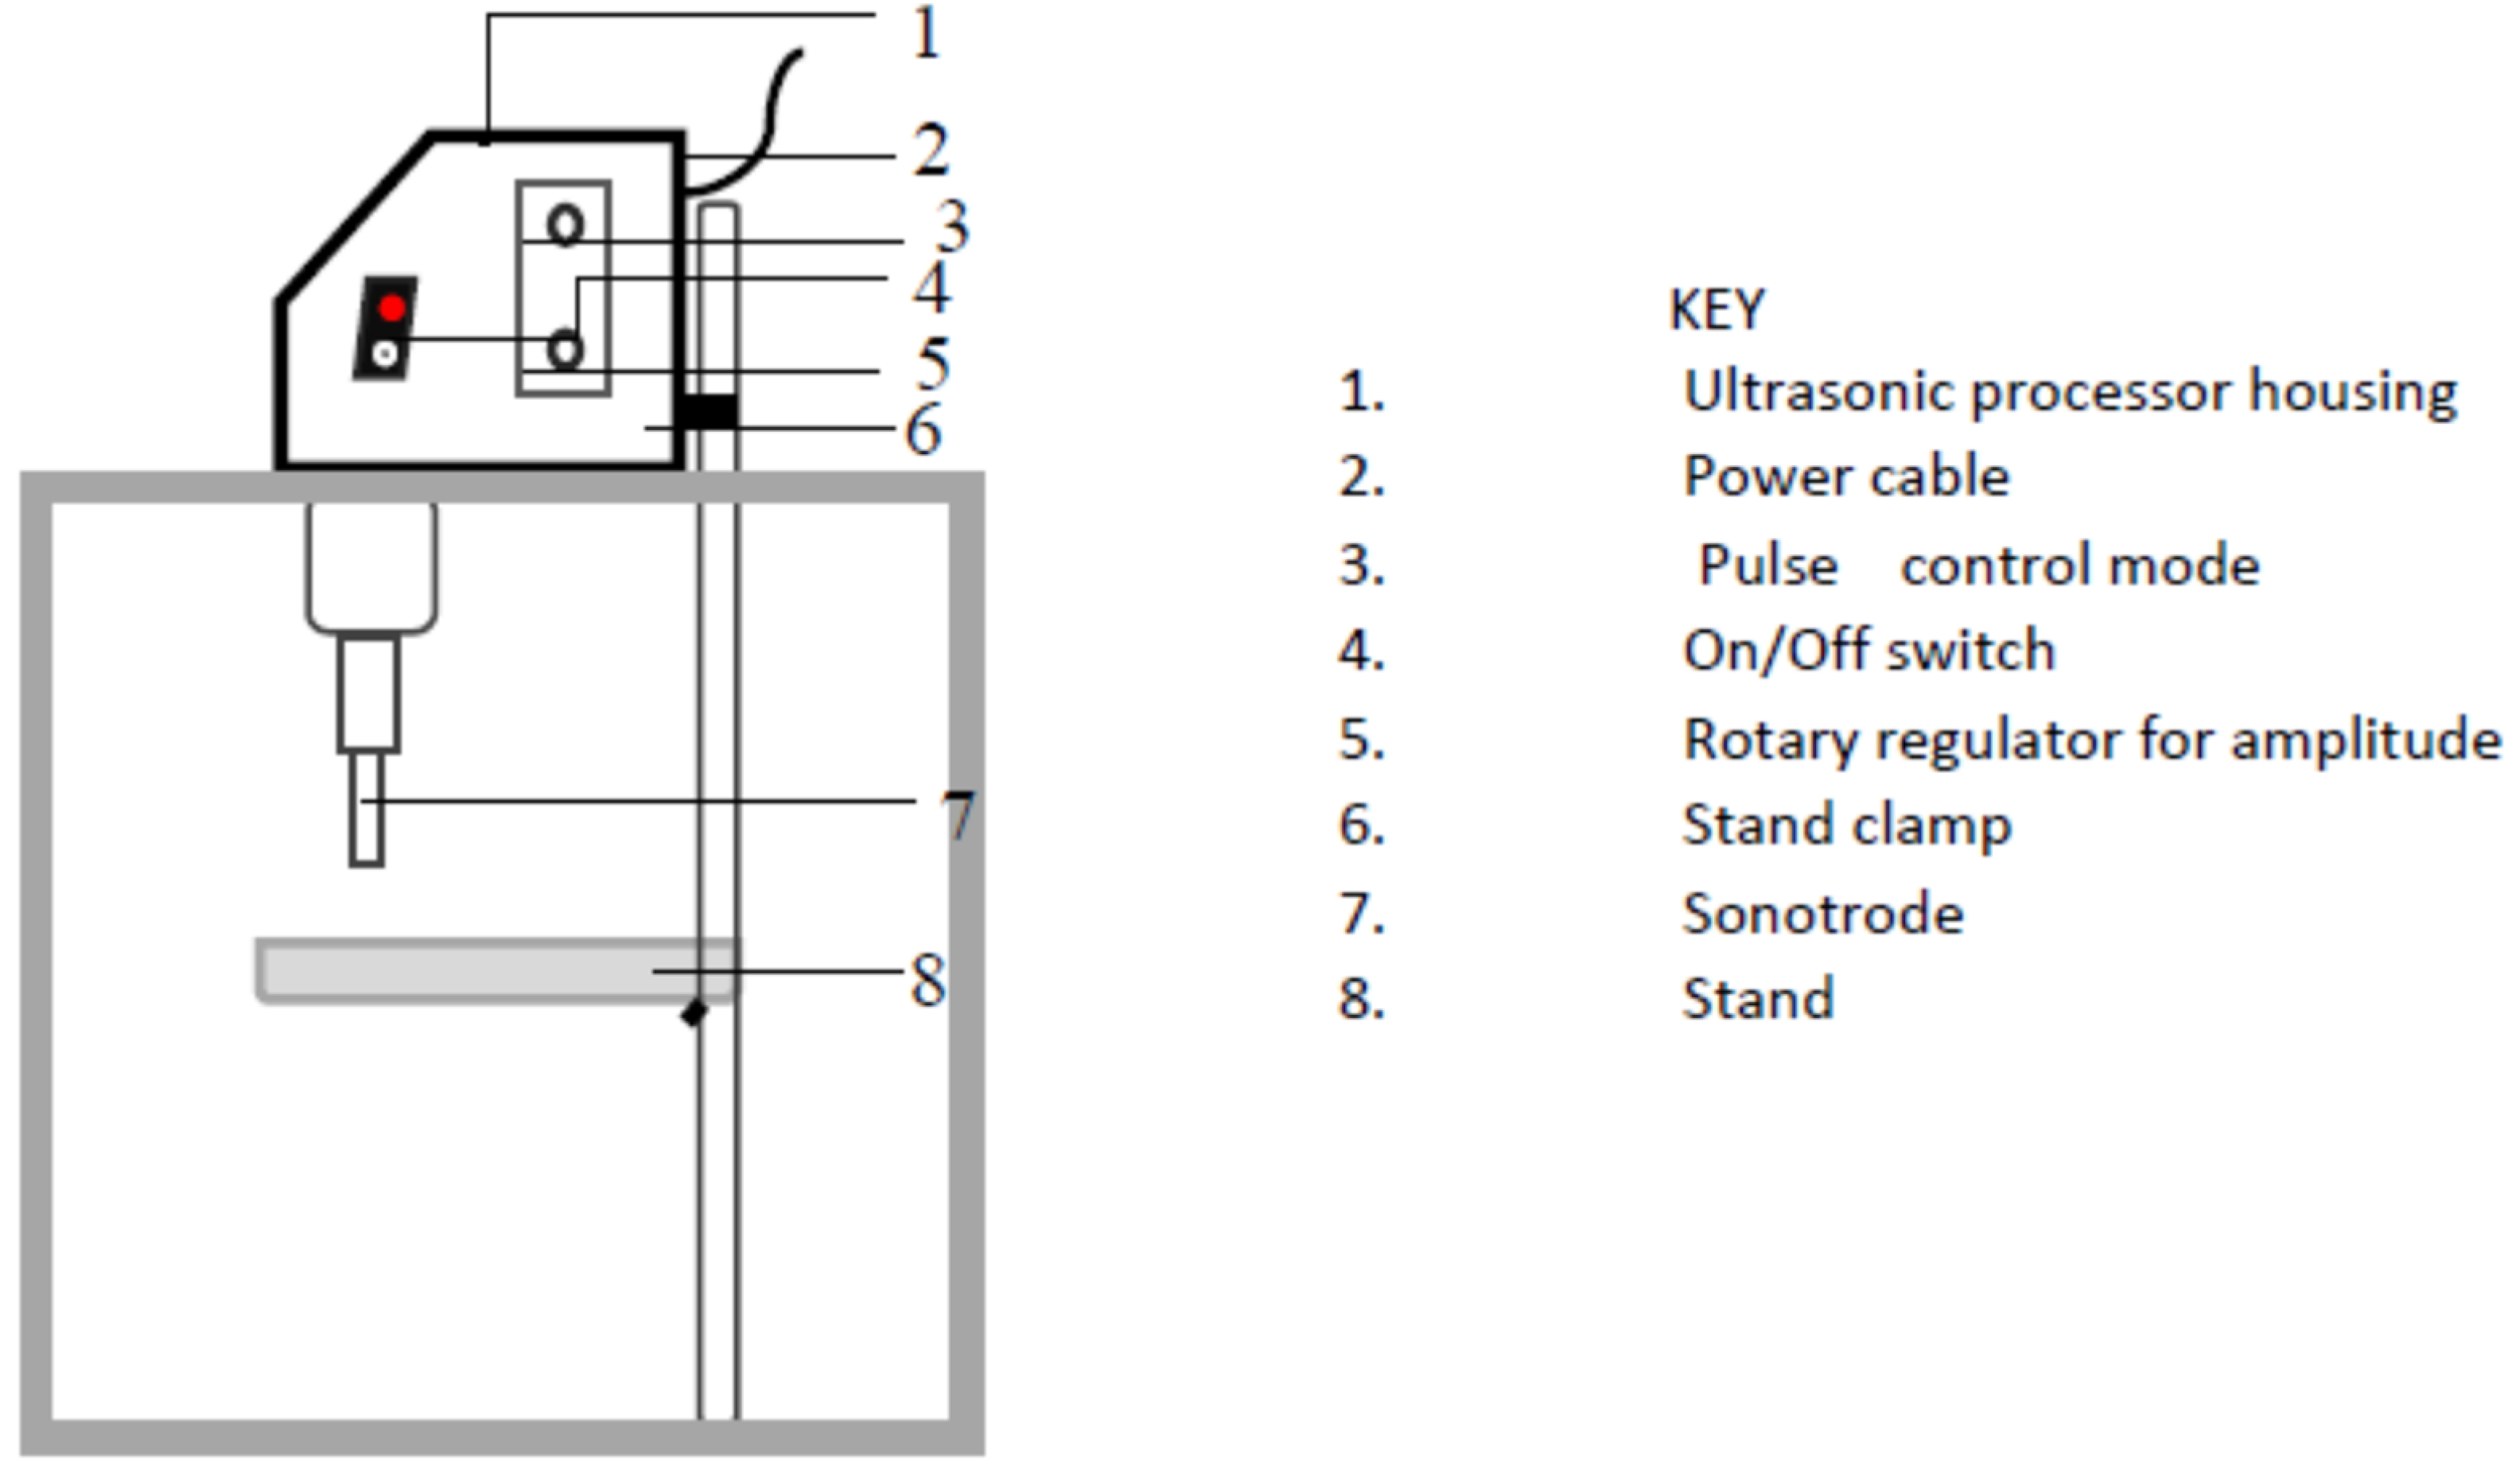
2.3. Ultrasonic Pretreatment

The switchgrass grinds were suspended in distilled water, and then subjected to ultrasonic irradiation using an ultrasonic processor (model UP400S, Hielscher Ultrasonics GmbH, Teltow, Germany) under fixed conditions of frequency of 24 kHz and sonotrode tip of 7 mm diameter as depicted in Figure 1. The ultrasonic treatments were carried out in a 250 mL graduated beaker at three levels of acoustic power (120, 180, and 240 W), solid-solvent ratio (1/25, 1/20, and 1/15 g/mL), hammer mill screen size (1.6, 3.2, and 6.4 mm), and sonication time (10, 30, and 50 min). The sonotrode tip was placed at 20 mm beneath the solvent surface and 17 mm from the bottom of the beaker. The sample was treated at 0.9 pulse mode. The treated samples were filtered with Whatman filter paper and air-dried at room temperature.

2.4. Design of Experiment

The actual values and coded factor values of four independent variables used in this study are presented in Table 1. The regression equation shows the impact of sonication time, acoustic power, solid–solvent ratio, and hammer mill screen size on the percent delignification of the ultrasonic treated switchgrass assessed using analysis of variance (ANOVA) and response surface methodology (RSM) developed with Design Expert version 7.1. software (Stat-Ease, Inc., Minneapolis, MN, USA). The parameters studied were sonication time, acoustic power, solid–solvent ratio, and hammer mill screen size. The independent variables were considered to have influence on the response variable. The percent delignification, which is the response variable, was determined after the ultrasonication experiments. The regression equation is shown as:
y 1 = β 0   +   i = 1 4 β i x i +   i = 1 4 β ii x i 2 + i = 1 3 j = i + 1 4 β ij x i x j   ,
where y 1 = delignification (%); x 1 = solid-solvent ratio (g/mL); x 2 = sonication time (min); x 3 = acoustic power (W); x 4 = hammer mill screen size (mm); β0, βi, βii and βij = the regression coefficients of intercept terms, linear terms, quadratic terms, and linear interaction terms in the equation, respectively.

2.5. Characterization

2.5.1. Lignin and Ash Composition Analysis

Approximately 300 mg of extractives-free native and ultrasonic-treated switchgrass samples were used to quantify the lignin components of the samples using a modified NREL protocol [34]. The samples, oven dried at 105 °C after extractive removal using acetone, were mixed/macerated with 3 mL of 72% H2SO4 for 2 h and thereafter diluted with water and autoclaved at 121 °C for 1 h. The residues were collected by vacuum filtration. The retentate was dried at 105 °C for 24 h and weighed to determine the quantity of acid insoluble lignin. The total acid soluble lignin was measured using the absorbance of the acid hydrolysate determined with ultraviolet visible light spectrophotometer (Evolution 60S, Thermo Scientific, Madison, WI, USA) at a wavelength of 240 nm. The total ash content in the native sample before and after extractive removal was determined using the NREL standard method, where 0.5–2 g of the sample was heated at 575 ± 20 °C in a preheated muffle furnace (model no. F-A1730; Thermolyne, Dubuque, IA, USA) in triplicate [35]. Delignification was computed using Equation (3).
Delignification   ( % ) =   L 1   L 2   L 1   × 100 ,
where L 1 ( % ) and L 2   ( % ) are total lignin content of the native and ultrasonic-treated switchgrass samples, respectively.

2.5.2. Scanning Electron Microscopy (SEM)

The surface morphology of samples was studied using a Field Emission Hitachi SU8000 Scanning Electron Microscope (Hitachi High-Tech Corp., Tokyo, Japan). The samples were coated with gold to provide a gold layer with a thickness of 10 nm using a vacuum sputter coater (Q150T ES, Quorum Technologies, Sussex, UK). The images were collected under the following instrument conditions: accelerating voltage of 3.0 kV, working distance (WD) of 7.7 mm, and with a magnification of ×200.

2.5.3. Transmission Electron Microscopy (TEM)

The switchgrass grinds were rehydrated in 0.1 M sodium cacodylate for 24 h then fixed in 2% gluteraldehyde for 24 h. The samples were osmicated and dehydrated through a graded ethanol series for propylene oxide transition to Epon/Araldite resin. The samples were sectioned to 90 nm and mounted on a 200-mesh copper grid and images were taken with a Hitachi HT7700 (Hitachi High-Tech Corp., Tokyo, Japan) transmission electron microscope at a voltage of 80 kV.

2.5.4. X-ray Diffraction (XRD) Measurement

The effect of ultrasonic irradiation on the crystalline structure of switchgrass was investigated using a Rigaku Ultima IV X-Ray Diffractometer (Rigaku Americas Corp., The Woodlands, TX, USA), equipped with a Cu Kα radiation source (0.154056 nm), a CBO optical, and a Scintillation Counter detector. The diffractometer was operated at 40 kV and 44 mA. The measurements were conducted on the Multipurpose Attachment, with para-focusing mode. A Kβ filter (Ni foils) was placed at the receiving end. The diffraction intensities were measured in the range of 5–65°, using a step size of 0.02° at a rate of 0.6° per minute for all the samples. The crystallinity indices of the treated and untreated samples were computed using the relationship given in Equation (4) [36]. The crystal information file (.cif) for cellulose Iβ with reference code JINR0001 collected from Cambridge Crystallographic Data Centre (CCDC) was used to simulate the theoretical powder diffraction pattern for cellulose Iβ at full width at half maximum (FWHM) of 4.5° and 5.0° and a wavelength of 1.54056 Å using Mercury version 4.3.1 (CCDC, Cambridge, UK) software. The theoretical powder diffraction pattern for cellulose Iβ was used as a reference for indexing the crystallographic planes to the diffraction peaks for the untreated and treated samples. The cellulose Iβ polymorph was adopted in this study because it is prevalent in cellulose of higher plant origin [37,38].
The crystallite sizes of the samples were evaluated using the Scherrer’s equation [38] as given in Equation (5), while the interplanar spacing was obtained using Bragg’s law (Equation (6)). Origin version 2019 (OriginLab Corp., Northampton, MA, USA) software was used to determine FWHM values of the peaks and perform profile fitting using pseudo-Voigt functions.
CrI =   I 200 I Am I 200   × 100 ,
where I 200 and I Am are the maximum intensity and minimum (intensity attributed to the amorphous fraction) intensity of diffraction at approximately 2Ɵ = 22–22.1° and 2Ɵ = 18–18.5.1°, respectively.
L hkl =   0.9 λ β cos θ ,
where L hkl is the crystallite size, and λ ,   β and θ are the X-ray wavelength, full width at half maximum (FWHM) in radians, and scattering angle, respectively.
d hkl =   λ 2 sin θ
where d hkl is the interplanar or d-spacings.

3. Results and Discussion

3.1. Physical Properties of the Native Switchgrass Grinds

The physical properties as well as the chemical composition of biomass feedstock determines the efficacy of ultrasonic treatment. The geometric mean diameter (GMD), porosity, bulk and particle densities of the native switchgrass at a moisture content of 7.4% (w.b.) from the different hammer mill screen sizes are listed in Table 2. The geometric mean diameter of the grinds decreased with an increase in the screen openings. The lowest GMD of 0.42 mm was obtained from the 1.6 mm hammer mill screen size. Lower bulk and particle densities were recorded for larger screen openings. The grinds from the smallest hammer mill screen size (1.6 mm) gave higher bulk and particle densities of 136 kg m−3 and 1059 kg m−3, respectively. The same porosity of 87.2% was recorded for the 1.6 and 3.2 mm screen sizes. Particle size distribution of the native switchgrass grinds obtained from hammer mill using three different screen sizes of 6.4, 3.2 and 1.6 mm are depicted in Table 3 and Figure 2. A Shapiro–Wilk test (p > 0.05) and visual inspection of their histograms showed that the particle size of the grinds from the three different hammer mill screen sizes were approximately normally distributed. The particle size distribution of the grinds from all the screen openings were skewed towards the right and had a lower peak compared to the expected normal distribution, except for the grinds from a screening size of 1.6 mm. The results obtained in this study for switchgrass grinds from 3.2 mm hammer mill screen size are approximately the same as the results reported by Mani et al. [39]. However, the results recorded for switchgrass grinds from 1.6 mm are slightly different from the report of Mani et al. [39], which could be related to differences in moisture content and switchgrass cultivar. The particle size affects the degree and the severity of ultrasonification required to accomplish the specified goal of pretreatment [25].

3.2. Lignin Content and Delignification

The mean acid soluble lignin, acid insoluble (Klason) lignin, ash content after extractives removal, and total ash content of the native switchgrass sample on dry matter basis were determined as 1.1%, 25.75 ± 1.62%, 2.75 ± 0.25%, and 3.17 ± 0.12%, respectively. The total lignin content of the native switchgrass was consistent with values reported by Karunanithy and Muthukumarappan [40] and Chiang Yat et al. [41], and it was higher than values reported in previous studies [42,43,44]. The total ash content was similar to the result obtained by Karunanithy and Muthukumarappan [40] and slightly lower than the values recorded by Youngmi et al. [44] and Huand Wen [42]. Youngmi et al. [44] concluded that harvest and other agronomic factors are associated with the differences in biomass composition. The cave-in-rock switchgrass cultivar harvested in October was reported to contain more lignin and less ash than the July harvest [45]. This could be related to the high lignin content of the switchgrass used in this study relative to values obtained in other works listed above. The results of the percentage lignin content and delignification of the ultrasonic treated switchgrass samples are shown in Table 4. The percent delignification ranged between 1.86% and 20.11%. The highest lignin degradation was recorded at a solid–solvent ratio of 1/25 g/mL, sonication time of 50 min, acoustic power of 180 W and hammer mill screen size of 3.2 mm. The ultrasonic delignification of switchgrass reported in this present work is high as compared to the delignification of switchgrass using conventional heating method and is comparable with the result of microwave delignification (21%) of switchgrass reported by Hu and Wen [42].

3.3. Effect of Independent Variables on Delignification

Table 5 summarizes the analysis of variance of the response variable (delignification) based on the impact of the solid–solvent ratio ( x 1 ), sonication time ( x 2 ), acoustic power ( x 3 ), and hammer mill screen size ( x 4 ) after stepwise multivariate regression. The p value of the model was less than 0.05, while the F value was greater than 2, which indicates a significant model. This implies that changes in the independent variables affected the value of delignification in the multivariate quadratic regression model developed in this study. Moreover, the lack of fit, an essential index for assessing the reliability of a model, was statistically insignificant with a p value more than 0.05 and an F value less than 2. An insignificant lack of fit supports the hypothesis that the model fits the data. However, based on the value of the coefficient of determination (R2) of the developed model, only about 53.2% of the variability of the delignification can be accounted for by the independent variables. The developed quadratic model in terms of coded factors is given in Equation (7). Liu et al. [46] noted that a regression model in terms of coded factors can be used to identify the relative impact of the factors by comparing the factor coefficients. Sonication time, followed by acoustic power, has the highest coefficient, which connotes a factor with the highest impact on the response variable.
Delignification = 6.02   1.77 x 1 + 3.38 x 2 + 2.11 x 3 0.37 x 4 3.44 x 3 x 4 + 2.73 x 1   2 +   3.85 x 2 2 + 3.33 x 3 2

3.3.1. Effects of Sonication Time and Solid-Solvent Ratio (SSR)

The effects of sonication time on the delignification of switchgrass were investigated in the range from 10 to 50 min. The result of a previous study carried out with the same ultrasonic processor used in this present work revealed that increasing sonication time beyond 50 min increased the slurry temperature beyond 60 °C [47]. Optimum cavitation formation at a temperature of 50 °C was recorded by Sun et al. [27]. The analysis of variance (ANOVA) presented in Table 5 shows that sonication time and its quadratic term had a significant effect on delignification at p < 0.05. The perturbation plot of the effects at their center points is shown in Figure 3. The perturbation plot compares the effects of all factors at a point in the design space.
Sonication time has a curve which suggests that the response (delignification) is sensitive to the variation in sonication time. This observation corroborates the result of the ANOVA in Table 5. The effect of sonication time on ultrasonic delignification reported in this study is in line with the reports of other studies [48,49]. On the other hand, the solid–solvent ratio on the perturbation plot gave a steep slope, indicative of the sensitivity of the response variable to its changes. This implies that a change in SSR impacts the value of delignification. However, the effect of SSR within the range (1/25 and 1/15 g/mL) used in this work is statistically insignificant. Table 5 shows that SSR has the least impact on delignification relative to other parameters studied. Highest percentage of delignification, 20.11%, was obtained at a SSR of 1/25 g/mL, which is similar to the result of effective loading for optimizing the delignification of sugar cane bagasse [28]. However, the optimal SSR depends on the nature of biomass and the goal of pretreatment.

3.3.2. Effects of Acoustic Power, Hammer Mill Screen Size (HMSS) and their Interaction

Based on Figure 3, delignification is influenced by changes in acoustic power. Within the range (120–240 W) considered in this study, acoustic power had the second highest relative impact on the response though it is statistically insignificant. The maximum and minimum level of delignification reported in this work occurred at 240 and 120 W, respectively. Ur Rehman et al. [24] noted that acoustic power level greatly impacts the sonication process although increasing acoustic power with other parameters fixed does not generally improve lignin removal. The perturbation plot for HMSS shows a flat line, which suggests that delignification was not sensitive to the changes in HMSS. This observation agrees with the insignificant effect of HMSS on delignification, as shown in Table 5. However, other studies have reported a significant impact of particle size variation on ultrasonic treatment [24,50]. The minimal impact of HMSS on ultrasonic delignification noted in this study could be linked to the minute difference in the geometric mean diameter, density, and particle size distribution of the three levels of HMSS used in this study, as shown in Table 2 and Figure 2. This implies that ultrasonic delignification of switchgrass at HMSS of 6.4, 3.2, and 1.6 mm will produce approximately the same result; hence, HMSS of 6.4 mm should be preferred to reduce the biomass size reduction energy cost. The average specific energy consumption for grinding switchgrass with a HMSS of 1.6 mm was reduced from 51.76 to 23.84 kW h t−1 when the grinding was done with a HMSS of 3.2 mm [39]. Comminution to a small size is an energy-intensive step in the pretreatment of lignocellulosic biomass on a commercial scale. From Figure 4, delignification increases at high acoustic power and HMSS. Increasing acoustic power and HMSS within the range of 1.6 and 4 mm resulted in an increase in delignification with the highest delignification at the highest level of acoustic power and the center point of HMSS. Increasing HMSS beyond the center point produced a low delignification.

3.4. Scanning Electron Microscopy

Scanning electron microscopy (SEM) provides insight on the microstructural modifications of materials after pretreatment relative to the untreated material. Selected SEM micrographs representing observations of the general impact of the ultrasonic pretreatment on the switchgrass grinds are shown in Figure 5. Figure 5a depicts a SEM image of the native switchgrass grind, which exhibits rigid, highly ordered fibrils and a compact structure which is resistant to enzymatic hydrolysis. Micrographs of the switchgrass grinds treated with ultrasound irradiation at different process conditions are presented in Figure 5b–d, showing significant surface disruption and increased fragmentation of the fibrils with a roughened surface. These morphological trends are similar to those observed previously for ultrasonic treated camelina [47]; however, the degree of cracks and cavities on the cell wall of the samples in this study is higher than that observed for camelina straw at the same sonication time. The higher structural deformation observed in this study could be due to the higher acoustic power used and the variation in biomass properties. An increase in acoustic power results in an increase in the occurrence and severity of acoustic cavitation [25].

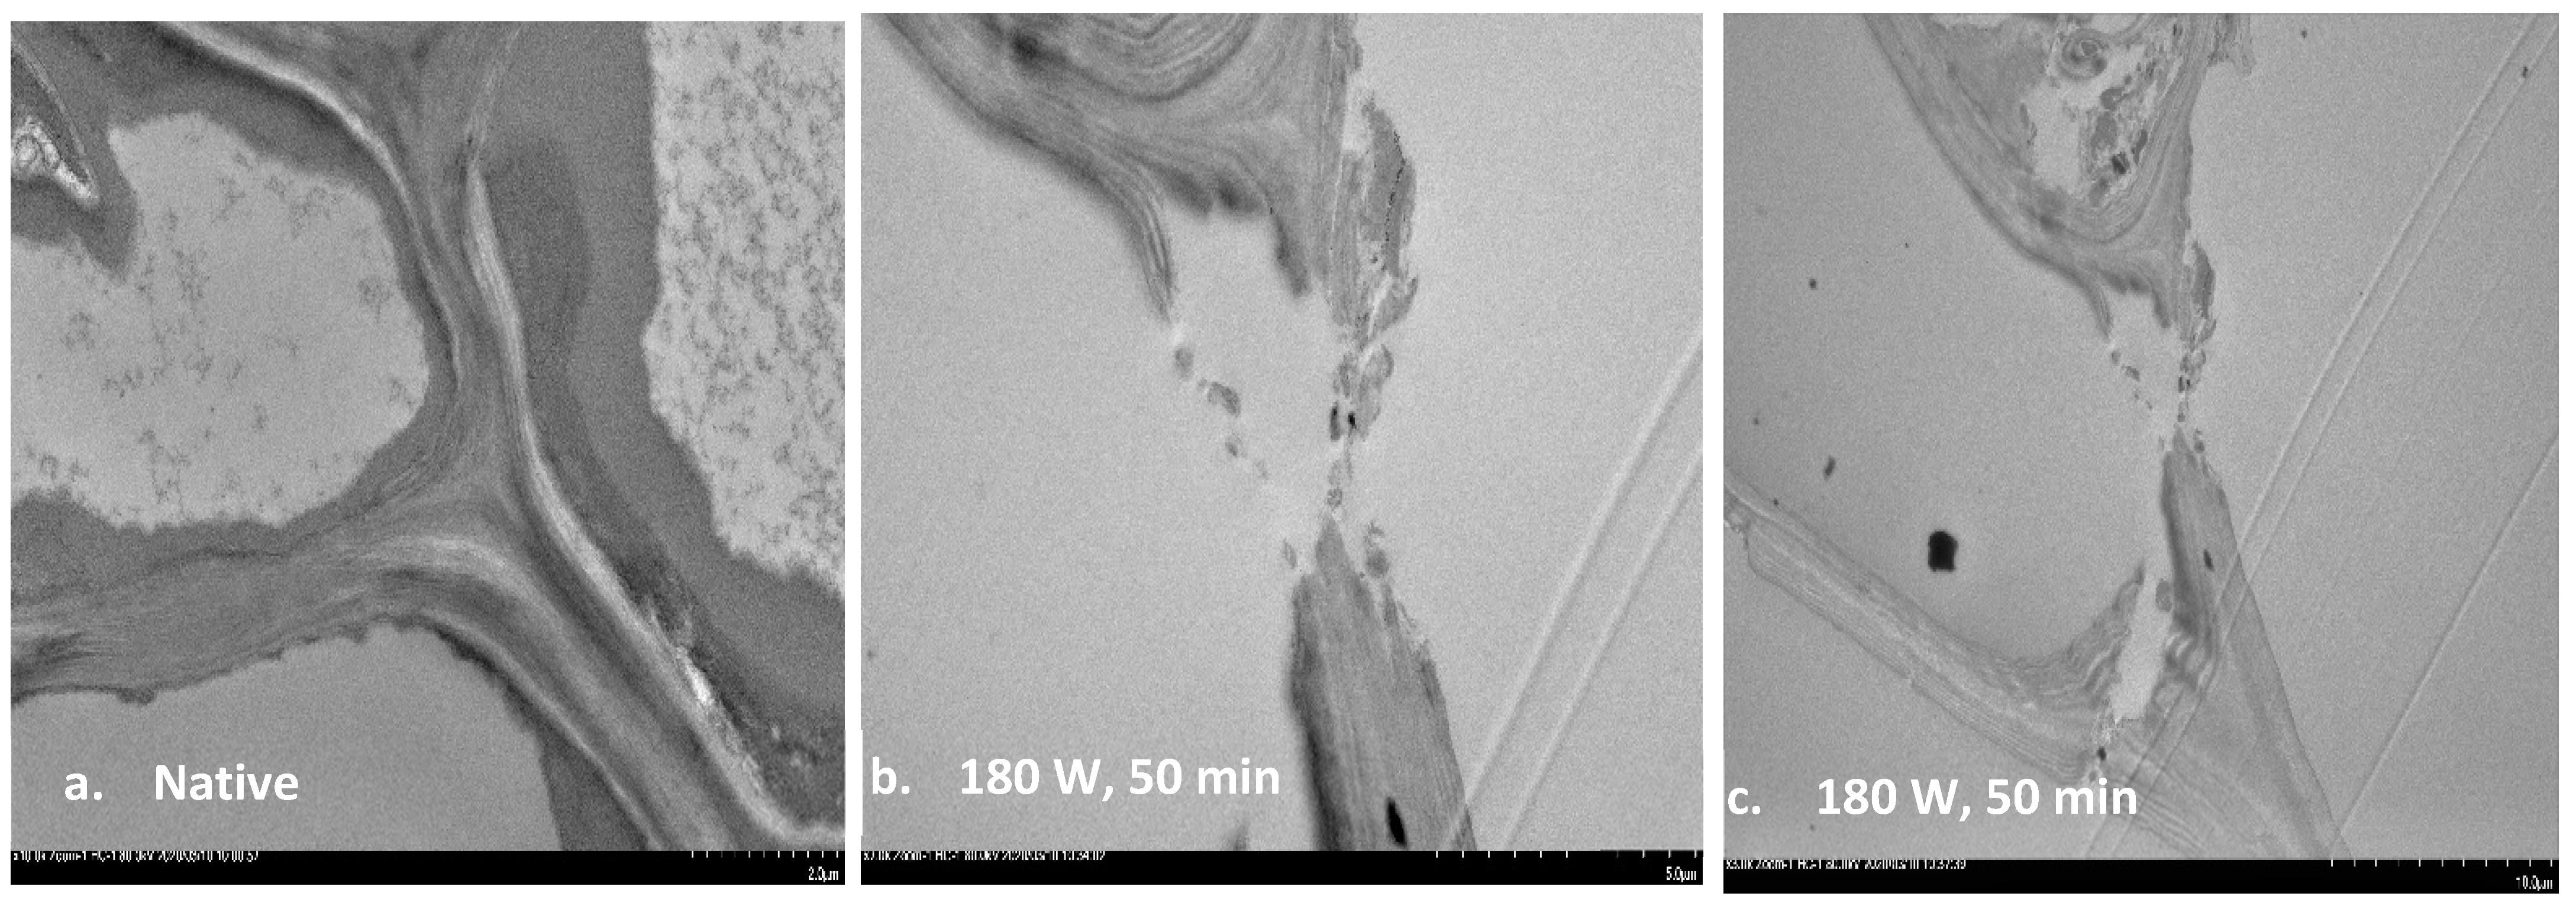
3.5. Transmission Electron Microscopy (TEM)
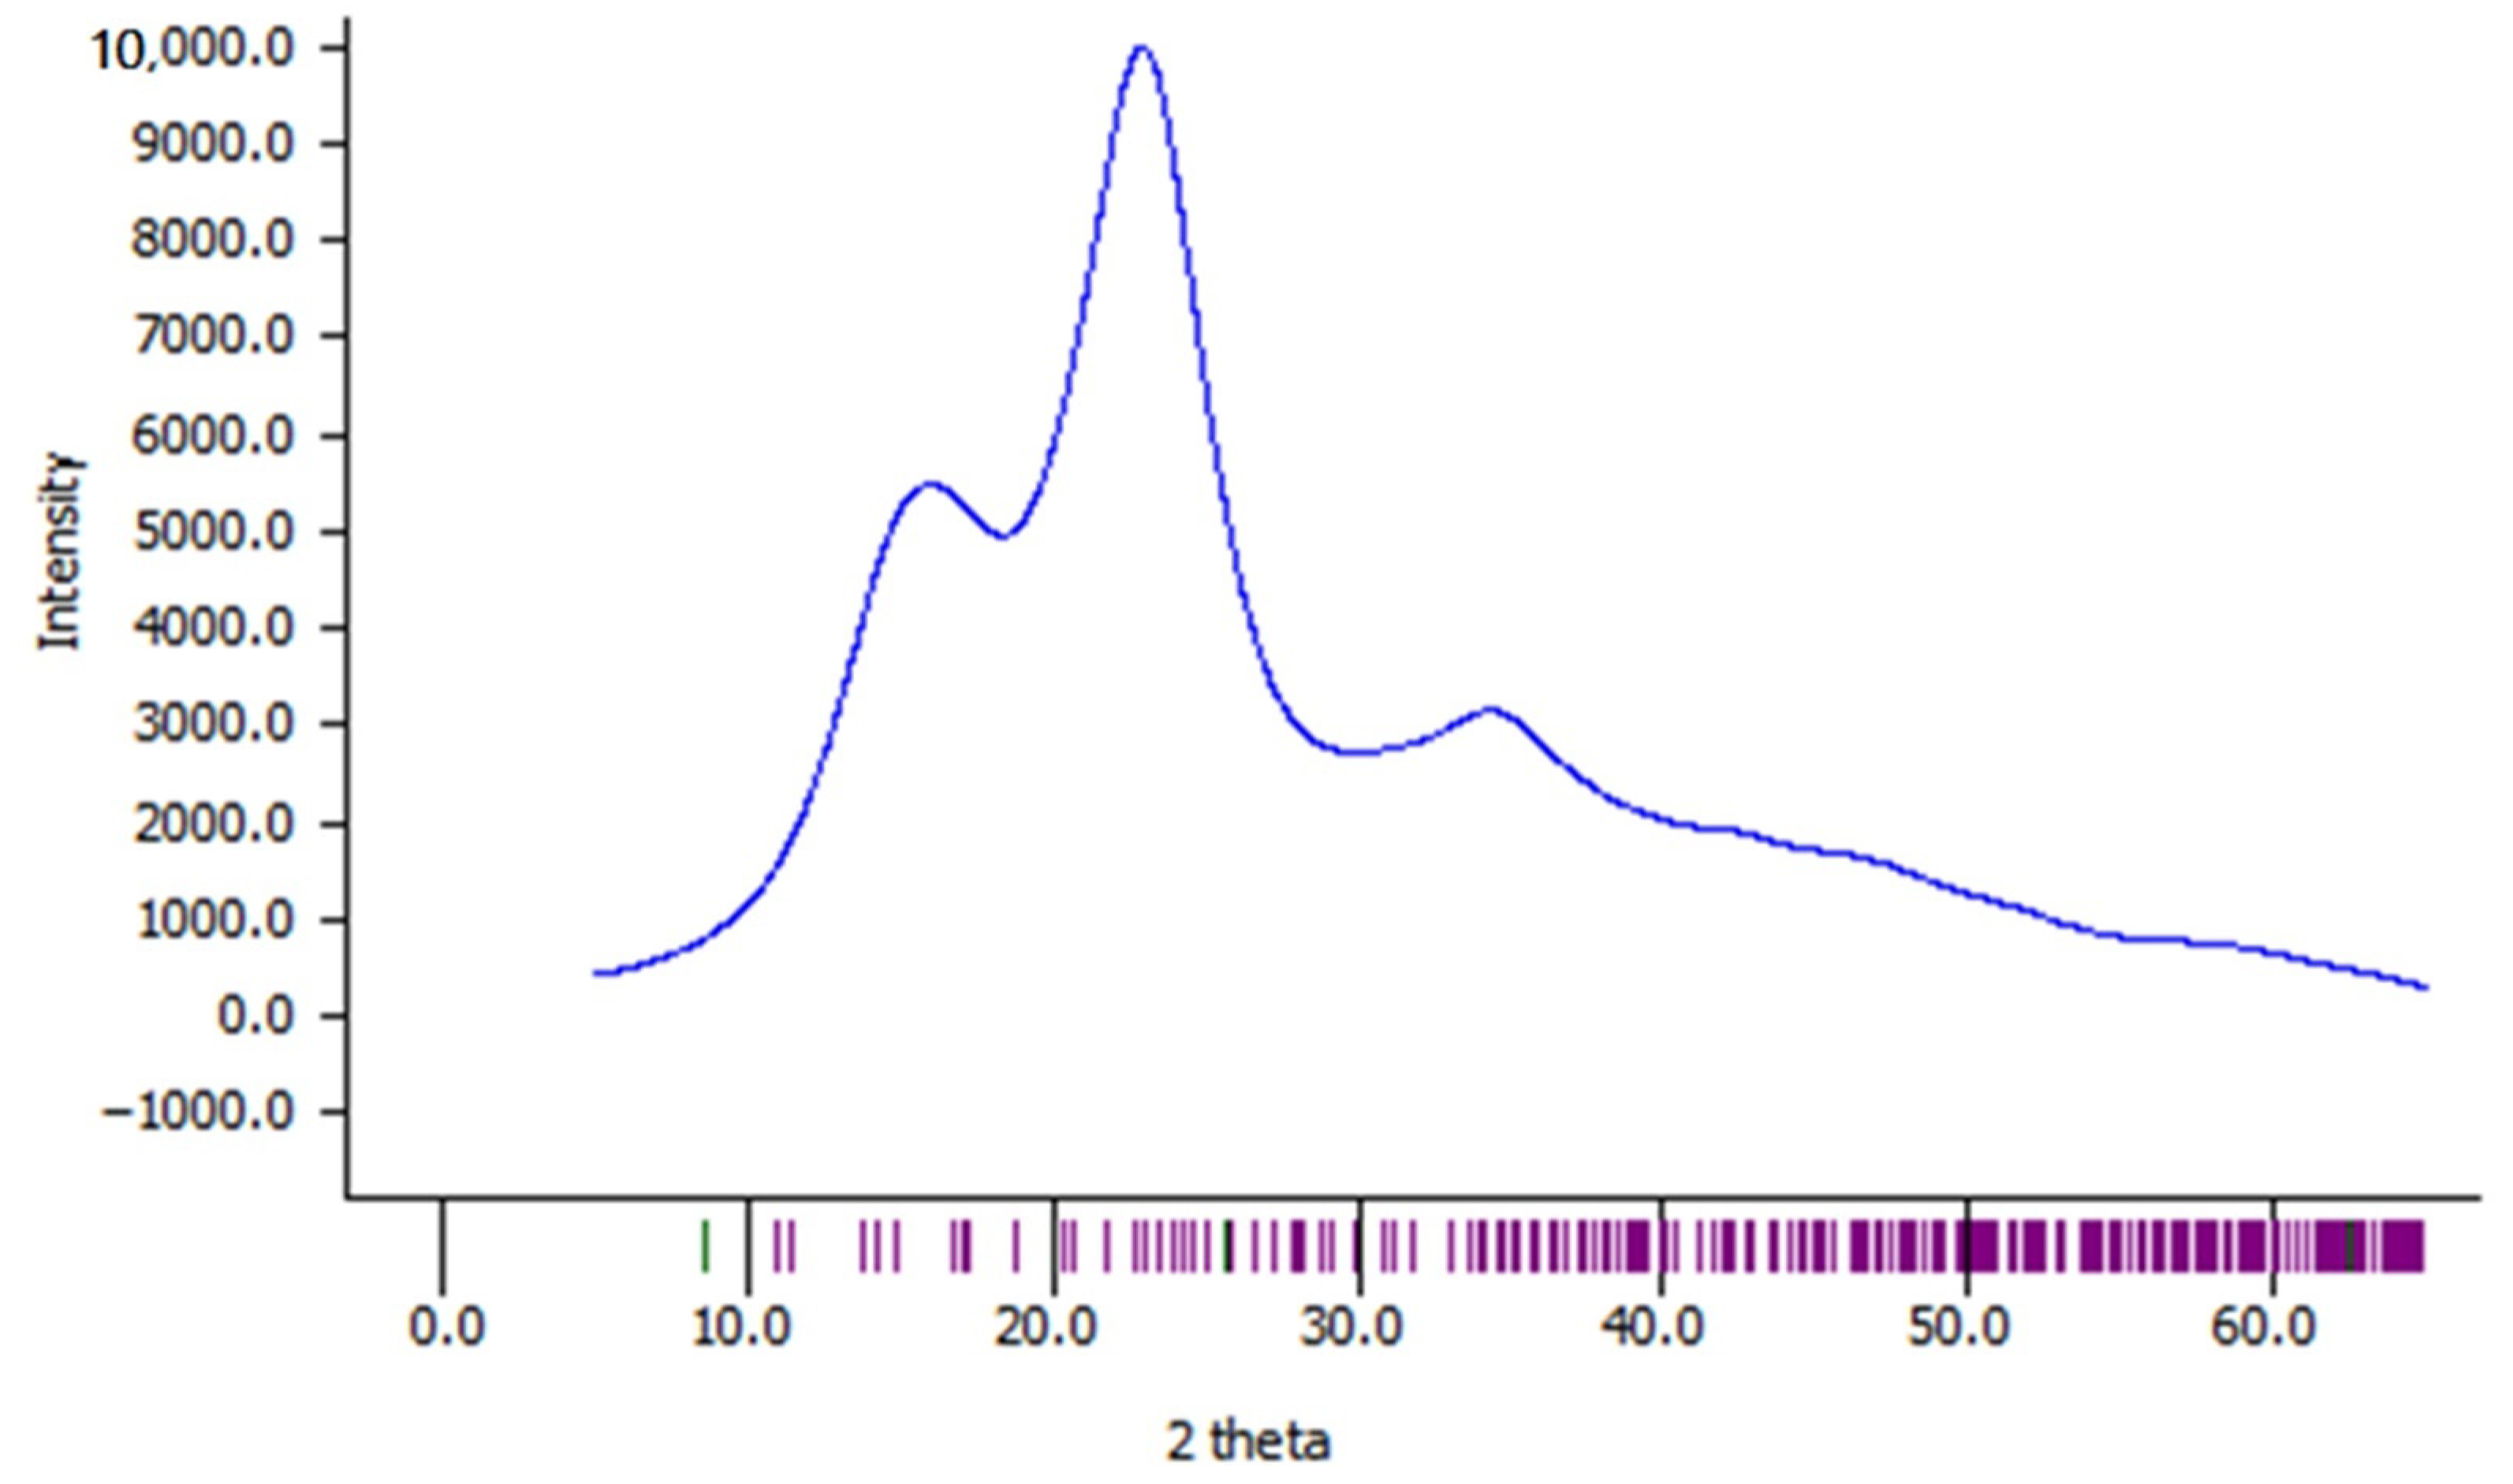
The higher spatial resolution of TEM gives an understanding of the nanoscale effects of biomass pretreatment on the cell wall architecture. The TEM micrographs of native and ultrasonic treated switchgrass grinds are presented in Figure 6. The untreated cell wall in Figure 6a appears denser with minor spacing in the lamella structure. The images of cell wall exposed to the pretreatment conditions (1/25 g/L, 180 W, 50 min and 3.2 mm) where the highest delignification occurred, shown in Figure 6b,c, reveal characteristic evidence of delamination and decreasing contrast as compared to the untreated cell wall. The reduced contrast observed in the ultrasonic treated cell wall could be partly due to reduced lignin content [51]. Sonication results in homolysis of lignin–carbohydrate bonds to liberate lignin and hemicellulose [24].

3.6. XRD Analysis

Cellulose has crystalline and amorphous fractions. X-ray diffraction data give an understanding of the crystalline structure of cellulose and the changes in cellulose structure after pretreatment. The theoretical powder diffraction pattern for cellulose Iβ at FWHM of 5.0° simulated based on the data obtained from CCDC is presented in Figure 7. The calculated XRD profile of cellulose Iβ served as a reference for indexing the crystallographic planes to the diffraction peaks for the untreated and ultrasonic-treated switchgrass grinds. Figure 8 depicts the X-ray diffractometry profiles of the untreated and ultrasonic treated switchgrass samples used in this study. In each profile, three main crystalline peaks induced by the reflections from the (1 1 0), (2 0 0), and (0 0 4) crystallographic planes were observed. The highest peak, which is from (2 0 0) plane, occurred at 2Ɵ~22° in the untreated and the ultrasonic treated (1/25 g/mL, 50 min, 180 W, 3.2 mm) samples, but shifted slightly to a lower angle (21.8°) after ultrasonic pretreatment at a higher acoustic power (240 W). The XRD profiles in this study are consistent with XRD profiles for switchgrass reported in previous studies [52,53], and the calculated XRD profile of cellulose 1β at FWHM of 5° presented in Figure 7. The results of crystallinity indices (CrI), d-spacings, and crystallite sizes of the native and ultrasonic treated switchgrass samples are summarized in Table 6. There was no significant change in the crystalline structure of the native cellulose in the switchgrass samples after ultrasonic pretreatment at the two pretreatment conditions considered [54], which are the pretreatment conditions with the highest delignification recorded in this present study. However, the crystallinity index and crystallite sizes of the native cellulose in the untreated sample were altered after sonication. The mean crystallite size decreased from 15.39 to 13.13 Å after sonication at acoustic power of 180 W and sonication time of 50 min. The impact of the microturbulance and shock wave generated during sonication contributes to polymer degradation and cell wall collapse [25], vis-à-vis the reduction in the crystalline component of the cellulose. The CrI decreased to 47.49% after 50 min of sonication at acoustic power of 180 W, while the change in CrI after 50 min sonication at acoustic power of 240 W was insignificant. Increasing acoustic power tends to reduce the severity of the sonication. Ur Rehman et al. [24] noted that the formation of bubbles near the sonotrode tip at high acoustic power level impedes the transfer of energy from the sonotrode to the liquid medium. This elucidates the minimal sonication effect at higher acoustic power observed in this study. The ultrasonic treament produced no significant change in the d-spacings of the cellulose crystalline structure in the switchgrass samples. This observation was also reported by Sumari et al. [55]. The values of the estimated d-spacings obtained in this study vividly indicated that cellulose 1β is the dominant cellulose allomorph in the switchgrass samples before and after ultrasonic treatment [56].

4. Conclusions

Ultrasonic delignification of switchgrass has been investigated using four-factor Box–Behnken experimental design in response surface methodology. Sonication time (min), acoustic power (W), solid–solvent ratio (g/mL), and hammer mill screen size (mm) were used as process parameters to develop a regression model to predict the percentage of delignification. The model developed was significant at p < 0.05, which suggests that there is a relationship between the percentage of delignification and the process parameters studied. The result of the analysis of variance (ANOVA) indicates that sonication time has the highest impact on ultrasonic delignification followed by acoustic power. The outcome of the ultrasonication showed that the highest delignification of switchgrass occurred at pretreatment conditions of a sonication time of 50 min, a solid–solvent ratio of 1/25 g/mL, an acoustic power of 180 W, and a hammer mill screen size of 3.2 mm. SEM and TEM examinations of the treated sample with the highest delignification showed that ultrasonic irradiation resulted in cell wall disruption at both micro- and nano-scales, while XRD results indicate no change in crystalline structure; however, reduction in crystallinity index and mean crystallite size was observed. Ultrasonic irradiation is capable of degrading lignin and modifying switchgrass structure; therefore, it could be adopted as an option for lignocellulosic biomass pretreatment suggesting its potential application for biofuel production. Due to the low percentage of delignification associated with ultrasonication as compared to some other pretreatment methods, its adoption as a sole pretreatment option, especially at the commercial scale, may not be economically justifiable. However, further investigations in this field will be conducted to investigate the overall pretreatment efficiency of combining ultrasonication and other biomass pretreatment options. Ongoing work is investigating the impact of ultrasonic treatment on polysaccharide composition in switchgrass, along with fermentable sugar yields on enzymatic saccharification of treated biomass.

Author Contributions

Conceptualization, O.O.O. and L.G.T.; methodology, O.O.O. and T.D.; software, O.O.O.; validation, O.O.O., L.G.T. and T.D.; formal analysis O.O.O.; investigation, O.O.O.; resources, L.G.T. and T.D.; data curation, O.O.O.; writing—original draft preparation, O.O.O.; writing—review and editing, L.G.T. and T.D.; visualization O.O.O.; supervision, L.G.T. and T.D.; project administration, O.O.O.; funding acquisition, L.G.T. and T.D. All authors have read and agreed to the published version of the manuscript.

Funding

This research was funded by BIOFUELNET CANADA NETWORK under Theme #1—Biomass and Bioenergy for Northern Latitudes.

Institutional Review Board Statement

Not applicable.

Informed Consent Statement

Not applicable.

Data Availability Statement

Data generated in is this study is contained within the article.

Conflicts of Interest

The authors declare no conflict of interest.

References

  1. Wright, L.L. Historical Perspective on How and Why Switchgrass Was Selected as a “Model” High-Potential Energy Crop; Oak Ridge National Laboratory: Oak Ridge, TN, USA, 2007. [Google Scholar] [CrossRef] [Green Version]
  2. Bhattacharya, A.; Knoll, J.E. Conventional and Molecular Breeding for Improvement of Biofuel Crops: Past, Present, and Future. In Handbook of Bioenergy Crop Plants; Kole, C., Josh, C.P., Shonnard, D.R., Eds.; CRC Press: Boca Raton, FL, USA, 2011; pp. 3–21. [Google Scholar]
  3. Casler, M.D. Switchgrass Breeding, Genetics, and Genomics. In Switchgrass: A Valuable Biomass Crop for Energy; Monti, A., Ed.; Springer: London, UK, 2012; pp. 29–54. [Google Scholar] [CrossRef]
  4. McLaughlin, S.B.; Bouton, J.; Bransby, D.; Conger, B.V.; Ocumpaugh, W.R.; Parrish, D.J.; Taliaferro, C.; Vogel, K.P.; Wullschleger, S.D. Developing Switchgrass as a Bioenergy Crop. In Perspectives on New Crops and New Uses; Janick, J., Ed.; ASHS Press: Alexandria, Egypt, 1999; pp. 282–299. [Google Scholar]
  5. Vogel, K.P.; Jung, H.-J.G. Genetic Modification of Herbaceous Plants for Feed and Fuel. Crit. Rev. Plant Sci. 2001, 20, 15–49. [Google Scholar] [CrossRef]
  6. Dien, B.S.; Jung, H.-J.G.; Vogel, K.P.; Casler, M.D.; Lamb, J.F.; Iten, L.; Mitchell, R.B.; Sarath, G. Chemical composition and response to dilute-acid pretreatment and enzymatic saccharification of alfalfa, reed canarygrass, and switchgrass. Biomass Bioenergy 2006, 30, 880–891. [Google Scholar] [CrossRef] [Green Version]
  7. Yan, J.; Hu, Z.; Pu, Y.; Brummer, E.C.; Ragauskas, A. Chemical compositions of four switchgrass populations. Biomass Bioenergy 2010, 34, 48–53. [Google Scholar] [CrossRef]
  8. Arshadi, M.; Grundberg, H. Biochemical production of bioethanol. In Handbook of Biofuels Production: Processes and Technologies; Luque, R., Campelo, J., Clark, J., Eds.; Woodhead Publishing Limited: Cambridge, UK, 2011; pp. 199–220. [Google Scholar] [CrossRef]
  9. Wi, S.G.; Cho, E.J.; Lee, D.-S.; Lee, S.J.; Lee, Y.J.; Bae, H.-J. Lignocellulose conversion for biofuel: A new pretreatment greatly improves downstream biocatalytic hydrolysis of various lignocellulosic materials. Biotechnol. Biofuels 2015, 8, 1–11. [Google Scholar] [CrossRef] [Green Version]
  10. Boerjan, W.; Ralph, J.; Baucher, M. Ligninbiosynthesis. Annu. Rev. Plant Biol. 2003, 54, 519–546. [Google Scholar] [CrossRef]
  11. Kishimoto, T.; Chiba, W.; Saito, K.; Fukushima, K.; Uraki, Y.; Ubukata, M. Influence of Syringyl to Guaiacyl Ratio on the Structure of Natural and Synthetic Lignins. J. Agric. Food Chem. 2010, 58, 895–901. [Google Scholar] [CrossRef]
  12. Wilkerson, C.G.; Mansfield, S.D.; Lu, F.; Withers, S.; Park, J.-Y.; Karlen, S.D.; Gonzales-Vigil, E.; Padmakshan, D.; Unda, F.; Rencoret, J.; et al. Monolignol Ferulate Transferase Introduces Chemically Labile Linkages into the Lignin Backbone. Science 2014, 344, 90–93. [Google Scholar] [CrossRef] [Green Version]
  13. Cass, C.L.; Lavell, A.A.; Santoro, N.; Foster, C.E.; Karlen, S.D.; Smith, R.A.; Ralph, J.; Garvin, D.F.; Sedbrook, J.C. Cell Wall Composition and Biomass Recalcitrance Differences Within a Genotypically Diverse Set of Brachypodium distachyon Inbred Lines. Front. Plant Sci. 2016, 7, 708. [Google Scholar] [CrossRef] [Green Version]
  14. DeMartini, J.D.; Pattathil, S.; Miller, J.S.; Li, H.; Hahn, M.G.; Wyman, C.E. Investigating plant cell wall components that affect biomass recalcitrance in poplar and switchgrass. Energy Environ. Sci. 2013, 6, 898–909. [Google Scholar] [CrossRef]
  15. Lionetti, V.; Francocci, F.; Ferrari, S.; Volpi, C.; Bellincampi, D.; Galletti, R.; D’Ovidio, R.; De Lorenzo, G.; Cervone, F. Engineering the cell wall by reducing de-methyl-esterified homogalacturonan improves saccharification of plant tissues for bioconversion. Proc. Natl. Acad. Sci. USA 2009, 107, 616–621. [Google Scholar] [CrossRef] [Green Version]
  16. Taherzadeh, M.J.; Karimi, K. Pretreatment of Lignocellulosic Wastes to Improve Ethanol and Biogas Production: A Review. Int. J. Mol. Sci. 2008, 9, 1621–1651. [Google Scholar] [CrossRef] [PubMed] [Green Version]
  17. Mann, D.G.J.; Labbé, N.; Sykes, R.W.; Gracom, K.; Kline, L.; Swamidoss, I.M.; Burris, J.N.; Davis, M.; Stewart, C.N. Rapid Assessment of Lignin Content and Structure in Switchgrass (Panicum virgatum L.) Grown Under Different Environmental Conditions. Bioenergy Res. 2009, 2, 246–256. [Google Scholar] [CrossRef]
  18. Mosier, N.; Wyman, C.; Dale, B.; Elander, R.; Lee, Y.; Holtzapple, M.; Ladisch, M.R. Features of promising technologies for pretreatment of lignocellulosic biomass. Bioresour. Technol. 2005, 96, 673–686. [Google Scholar] [CrossRef] [PubMed]
  19. Alvira, P.; Tomás-Pejó, E.; Ballesteros, M.; Negro, M.J. Pretreatment technologies for an efficient bioethanol production process based on enzymatic hydrolysis: A review. Bioresour. Technol. 2010, 101, 4851–4861. [Google Scholar] [CrossRef]
  20. Kardos, N.; Luche, J.-L. Sonochemistry of carbohydrate compounds. Carbohydr. Res. 2001, 332, 115–131. [Google Scholar] [CrossRef]
  21. Bundhoo, M.Z.; Mudhoo, A.; Mohee, R. Promising Unconventional Pretreatments for Lignocellulosic Biomass. Crit. Rev. Environ. Sci. Technol. 2012, 43, 2140–2211. [Google Scholar] [CrossRef]
  22. Saini, A.; Aggarwal, N.K.; Sharma, A.; Yadav, A. Prospects for Irradiation in Cellulosic Ethanol Production. Biotechnol. Res. Int. 2015, 2015, 157139. [Google Scholar] [CrossRef] [Green Version]
  23. Kumar, A.K.; Sharma, S. Recent updates on different methods of pretreatment of lignocellulosic feedstocks: A review. Bioresour. Bioprocess. 2017, 4, 1–19. [Google Scholar] [CrossRef] [Green Version]
  24. Ur Rehman, M.S.; Kim, I.; Chisti, Y.; Han, J.I. Use of Ultrasound in the Production of Bioethanol from Lignocellulosic Biomass. Energy Educ. Sci. Technol. Part A Energy Sci. Res. 2013, 30, 1391–1410. [Google Scholar] [CrossRef]
  25. Bussemaker, M.J.; Zhang, D. Effect of Ultrasound on Lignocellulosic Biomass as a Pretreatment for Biorefinery and Biofuel Applications. Ind. Eng. Chem. Res. 2013, 52, 3563–3580. [Google Scholar] [CrossRef]
  26. Li, M.-F.; Sun, S.-N.; Xu, F.; Sun, R.-C. Ultrasound-enhanced extraction of lignin from bamboo (Neosinocalamus affinis): Characterization of the ethanol-soluble fractions. Ultrason. Sonochem. 2012, 19, 243–249. [Google Scholar] [CrossRef] [PubMed]
  27. Sun, J.-X.; Sun, R.-C.; Sun, X.-F.; Su, Y. Fractional and physico-chemical characterization of hemicelluloses from ultrasonic irradiated sugarcane bagasse. Carbohydr. Res. 2004, 339, 291–300. [Google Scholar] [CrossRef] [PubMed]
  28. Velmurugan, R.; Muthukumar, K. Ultrasound-assisted alkaline pretreatment of sugarcane bagasse for fermentable sugar production: Optimization through response surface methodology. Bioresour. Technol. 2012, 112, 293–299. [Google Scholar] [CrossRef] [PubMed]
  29. Easson, M.W.; Condon, B.; Dien, B.S.; Iten, L.; Slopek, R.; Yoshioka-Tarver, M.; Lambert, A.; Smith, J. The Application of Ultrasound in the Enzymatic Hydrolysis of Switchgrass. Appl. Biochem. Biotechnol. 2011, 165, 1322–1331. [Google Scholar] [CrossRef]
  30. Song, X.; Zhang, M.; Pei, Z.J. Effects of ultrasonic vibration-assisted pelleting of cellulosic biomass on sugar yield for biofuel manufacturing. Biomass-Convers. Biorefin. 2013, 3, 231–238. [Google Scholar] [CrossRef]
  31. Yu, J.; Zhang, J.; He, J.; Liu, Z.; Yu, Z. Combinations of mild physical or chemical pretreatment with biological pretreatment for enzymatic hydrolysis of rice hull. Bioresour. Technol. 2009, 100, 903–908. [Google Scholar] [CrossRef]
  32. ANSI/ASAE S358.3. In Standard Test for Moisture Content Measurement of Forages; American Society of Agricultural Engineers: St. Joseph, MI, USA, 2012.
  33. ANSI/ASAE S319.4. In Standard Method of Determining and Expressing Fineness of Feed Materials by Sieving; American Society of Agricultural Engineers: St. Joseph, MI, USA, 2017.
  34. Sluiter, A.; Hames, B.; Ruiz, R.; Scarlata, C.; Sluiter, J.; Templeton, D.; Crocker, D. NREL/TP-510-42618 Analytical Procedure—Determination of Structural Carbohydrates and Lignin in Biomass; Revised August 2012; National Renewable Energy Laboratory: Golden, CO, USA, 2008. [Google Scholar]
  35. Sluiter, A.; Hames, B.; Ruiz, R.; Scarlata, C.; Sluiter, J.; Templeton, D. NREL/TP-510-42618 Analytical Procedure—Determination of Ash in Biomass; Issue Date: 7/17/2005; National Renewable Energy Laboratory: Golden, CO, USA, 2008. [Google Scholar]
  36. Segal, L.; Creely, J.J.; Martin, A.E.; Conrad, C.M. Opportunity for New Developments in All Phases of Textile Manufacturing. Literature Cited an Empirical Method for Estimating the Degree of Crystallinity of Native Cellulose Using the X-ray Diffractometer; Sage Publications: Thousand Oaks, CA, USA, 1952; Volume 43. [Google Scholar]
  37. Nishiyama, Y.; Sugiyama, J.; Chanzy, H.; Langan, P. Crystal Structure and Hydrogen Bonding System in Cellulose Iαfrom Synchrotron X-ray and Neutron Fiber Diffraction. J. Am. Chem. Soc. 2003, 125, 14300–14306. [Google Scholar] [CrossRef]
  38. Kim, U.-J.; Eom, S.H.; Wada, M. Thermal decomposition of native cellulose: Influence on crystallite size. Polym. Degrad. Stab. 2010, 95, 778–781. [Google Scholar] [CrossRef]
  39. Mani, S.; Tabil, L.G.; Sokhansanj, S. Grinding performance and physical properties of wheat and barley straws, corn stover and switchgrass. Biomass Bioenergy 2004, 27, 339–352. [Google Scholar] [CrossRef]
  40. Karunanithy, C.; Muthukumarappan, K. Optimization of switchgrass and extruder parameters for enzymatic hydrolysis using response surface methodology. Ind. Crop. Prod. 2011, 33, 188–199. [Google Scholar] [CrossRef]
  41. Yat, S.C.; Berger, A.; Shonnard, D.R. Kinetic characterization for dilute sulfuric acid hydrolysis of timber varieties and switchgrass. Bioresour. Technol. 2008, 99, 3855–3863. [Google Scholar] [CrossRef] [PubMed]
  42. Hu, Z.; Wen, Z. Enhancing enzymatic digestibility of switchgrass by microwave-assisted alkali pretreatment. Biochem. Eng. J. 2008, 38, 369–378. [Google Scholar] [CrossRef]
  43. Hu, Z.-H.; Wang, Y.; Wen, Z. Alkali (NaOH) Pretreatment of Switchgrass by Radio Frequency-based Dielectric Heating. Appl. Biochem. Biotechnol. 2007, 148, 71–81. [Google Scholar] [CrossRef]
  44. Kim, Y.; Mosier, N.S.; Ladisch, M.R.; Pallapolu, V.R.; Lee, Y.; Garlock, R.; Balan, V.; Dale, B.E.; Donohoe, B.S.; Vinzant, T.B.; et al. Comparative study on enzymatic digestibility of switchgrass varieties and harvests processed by leading pretreatment technologies. Bioresour. Technol. 2011, 102, 11089–11096. [Google Scholar] [CrossRef] [PubMed]
  45. Bals, B.; Rogers, C.; Jin, M.; Balan, V.; Dale, B.E. Evaluation of ammonia fibre expansion (AFEX) pretreatment for enzymatic hydrolysis of switchgrass harvested in different seasons and locations. Biotechnol. Biofuels 2010, 3, 1. [Google Scholar] [CrossRef] [PubMed] [Green Version]
  46. Liu, J.; Jianguo, W.; Chunfai, L.; Feng, G. A Multi-Parameter Optimization Model for the Evaluation of Shale Gas Recovery Enhancement Title. Energies 2018, 11, 654. [Google Scholar] [CrossRef] [Green Version]
  47. Olughu, O.O.; Tabil, L.G.; Dumonceaux, T. Effect of Ultrasonic Pretreatment on the Chemical Composition and Pellet Quality of Camelina Straw. In Proceedings of the 2019 ASABE Annual International Meeting, Boston, MA, USA, 7–10 July 2019; p. 1. [Google Scholar] [CrossRef]
  48. García, A.; Alriols, M.G.; Llano-Ponte, R.; Labidi, J. Ultrasound-assisted fractionation of the lignocellulosic material. Bioresour. Technol. 2011, 102, 6326–6330. [Google Scholar] [CrossRef]
  49. Sun, R.-C.; Tomkinson, J. Comparative study of lignins isolated by alkali and ultrasound-assisted alkali extractions from wheat straw. Ultrason. Sonochem. 2002, 9, 85–93. [Google Scholar] [CrossRef]
  50. Esfahani, M.R.; Azin, M. Pretreatment of sugarcane bagasse by ultrasound energy and dilute acid. Asia-Pac. J. Chem. Eng. 2011, 7, 274–278. [Google Scholar] [CrossRef]
  51. Karp, E.M.; Resch, M.G.; Donohoe, B.S.; Ciesielski, P.N.; O’Brien, M.H.; Nill, J.E.; Mittal, A.; Biddy, M.J.; Beckham, G.T. Alkaline Pretreatment of Switchgrass. ACS Sustain. Chem. Eng. 2015, 3, 1479–1491. [Google Scholar] [CrossRef]
  52. Pérez-Pimienta, J.A.; Lopez-Ortega, M.G.; Varanasi, P.; Stavila, V.; Cheng, G.; Singh, S.; Simmons, B.A. Comparison of the impact of ionic liquid pretreatment on recalcitrance of agave bagasse and switchgrass. Bioresour. Technol. 2013, 127, 18–24. [Google Scholar] [CrossRef] [PubMed]
  53. Cheng, G.; Varanasi, P.; Li, C.; Liu, H.; Melnichenko, Y.B.; Simmons, B.A.; Kent, M.S.; Singh, S. Transition of Cellulose Crystalline Structure and Surface Morphology of Biomass as a Function of Ionic Liquid Pretreatment and Its Relation to Enzymatic Hydrolysis. Biomacromolecules 2011, 12, 933–941. [Google Scholar] [CrossRef] [Green Version]
  54. Perez-Maqueda, L.A.; Franco, F.; Avilés, M.A.; Poyato, J.; Perez-Rodriguez, J.L. Effect of Sonication on Particle-size Distribution in Natural Muscovite and Biotite. Clays Clay Miner. 2003, 51, 701–708. [Google Scholar] [CrossRef]
  55. Sumari, S.; Roesyadi, A.; Sumarno, S. Effects of Ultrasound on the Morphology, Particle Size, Crystallinity, and Crystallite Size of Cellulose. Sci. Study Res. 2013, 14, 229–239. [Google Scholar]
  56. Wada, M.; Sugiyama, J.; Okano, T. Native celluloses on the basis of two crystalline phase (Iα/Iβ) system. J. Appl. Polym. Sci. 1993, 49, 1491–1496. [Google Scholar] [CrossRef]
Figure 1. Schematic diagram of the ultrasonic processor (model UP400S).
Energies 14 00263 g001
Figure 2. Particle size distribution of the native switchgrass grinds from different hammer mill screen sizes.
Energies 14 00263 g002
Figure 3. Perturbation plot of effects at center points.
Energies 14 00263 g003
Figure 4. Interaction effects of HMSS and acoustic power with other factors fixed at centre point.
Energies 14 00263 g004
Figure 5. SEM micrographs of (a) native (untreated) switchgrass grind; (bd) ultrasonic treated switchgrass grinds at different treatment conditions.
Energies 14 00263 g005
Figure 6. TEM micrographs of (a) native (untreated) switchgrass grind; (b,c) ultrasonic treated switchgrass grinds at highest delignification.
Energies 14 00263 g006
Figure 7. Calculated X-ray diffractometry profile of cellulose 1β at FWHM of 5°.
Energies 14 00263 g007
Figure 8. X-ray diffractometry profiles of native and ultrasonic treated switchgrass samples.
Energies 14 00263 g008
Table 1. The actual values and coded factor values of the independent variables used in the experiment.
CodeActual Value
z j Solid-Solvent Ratio,
x 1 (g/mL)
Sonication Time,
x 2 (min)
Acoustic Power,
x 3 (W)
Hammer Mill Screen Size,
x 4 (mm)
11/15502406.4
01/20301803.2
−11/25101201.6
Table 2. Physical properties of the native switchgrass grinds at moisture content of 7.4% (w.b.).
Hammer Mill Screen Size (mm)Geometric Mean Diameter (mm)Geometric Standard Deviation (mm)Bulk Density (kg m−3)Particle Density (kg m−3)Porosity (%)
6.40.590.49790 ± 5.384689.37
3.20.500.489116 ± 6.190387.15
1.60.420.429136 ± 4.3105987.16
Table 3. Particle size distribution of the native switchgrass grinds using Shapiro–Wilk’s test of normality.
Hammer Mill Screen Size (mm)Shapiro-Wilk’s TestSkewnessKurtosis
Statistical Valuep-Value
6.40.9700.9000.124−1.206
3.20.8970.3160.787−0.432
1.60.8960.3101.3211.805
Table 4. Lignin content of the ultrasonic treated switchgrass based the Box–Behnken experimental design.
RunsFactorsResponse
x 1
(g/mL)
x 2
(s)
x 3
(W)
x 4
(mm)
Acid Insoluble Lignin
(% Dry Matter)
Acid Soluble Lignin
(% Dry Matter)
Total Lignin
(% Dry Matter)
Delignification
(%)
1−10−1021.451.122.5516.01
2−1−10024.451.225.654.47
301−1023.051.124.1510.06
4001−123.150.723.8511.17
5100124.251.125.355.59
6−100124.451.125.554.84
70−10−121.551.122.6515.64
8−110020.351.121.4520.11
90−10122.651.123.7511.55
10000024.651.025.654.47
11000022.75123.7511.55
12100−122.851.224.0510.43
13000025.151.126.252.23
14010120.551.822.3516.76
15000025.05126.052.98
16010−122.55123.5512.29
17−101021.050.821.8518.62
1800−1122.450.923.3513.04
19110021.951.323.2513.41
20011020.75121.7518.99
211−10025.05126.052.98
2210−1023.05124.0510.43
230−1−1024.351.125.455.21
24000025.25126.252.23
25101022.650.623.2513.41
26001123.850.724.558.57
270−11022.751.123.8511.17
2800−1−125.251.126.351.86
29−100−122.450.823.2513.41
Table 5. Analysis of variance to show the impact of ultrasonic delignification of switchgrass regression model.
SourceDelignification
CoefficientF Valuep ValueLevel of Impact
Coded FactorsActual Factors
Model 2.840.0280 *
b x 1 −1.77−1733.5261.890.18414
a x 2 3.38−0.4086.930.0159 *1
x 3 2.11−0.2022.700.11622
x 4 −0.374.1520.080.77583
x 3 x 4 −3.44−0.0242.400.1373
x 1 2 2.7314,977.5702.530.1274
x 2 2 3.850.0105.020.0365 *
x 3 2 3.330.0013.770.0663
Lack of fit 1.340.4240
* Significant at p < 0.05. a Factor with the highest level of relative impact on delignification; b factor with the lowest level of relative impact on delignification.
Table 6. The crystallinity indices, d-spacings, and crystallite sizes of the untreated and ultrasonic-treated samples in two different pretreatment conditions.
Treatment ConditionCrystallinity Index (%)d-Spacings (Å)Crystallite Size (Å)Mean
(1 1 0)(2 0 0)(0 0 4)(1 1 0)(2 0 0)(0 0 4)
Untreated48.865.404.032.5812.3123.3610.5115.39
50 min, 180 W47.495.484.032.5912.3423.813.2313.13
50 min, 240 W48.765.514.072.5812.1324.2510.6115.66
Publisher’s Note: MDPI stays neutral with regard to jurisdictional claims in published maps and institutional affiliations.

