Article

Peak Ratio Characteristic Value Sequence Based Signal Processing Method for Transit-Time Ultrasonic Gas Flowmeter

School of Mechatronic Engineering and Automation, Shanghai University, Shanghai 200444, China
*
Author to whom correspondence should be addressed.
Energies 2021, 14(2), 426; https://doi.org/10.3390/en14020426
Submission received: 22 December 2020 / Revised: 12 January 2021 / Accepted: 13 January 2021 / Published: 14 January 2021

Abstract

:
The transit-time ultrasonic gas flowmeter plays a vital part in the measurement field with its unique advantages. In recent years, it has developed into a research hotspot in the field of gas flow measurement. However, while the ultrasonic signal propagates in gas, the amplitude fluctuation of the ultrasonic signal is produced under the condition of energy attenuation and unstable flow field. This leads to inaccurate transit time of ultrasonic signal that causes flow calculation errors. Aiming at this problem, a signal processing method is proposed in this paper for the transit-time ultrasonic gas flowmeter based on the peak ratio characteristic value sequence (PRCVS). Through the research on the mathematical model of ultrasonic signal, the ratio of the amplitude of adjacent peaks is defined as the peak ratio characteristic value (PRCV) of the peak. According to the corresponding relationship between the PRCV and the peak serial number, a set of reference PRCVS is established. By matching the characteristic value of the ultrasonic signal with the reference characteristic value sequence, the peak serial number can be determined. In this research, the PRCVS-based signal processing method is applied to the gas flow measurement system based on time-to-digital converter (TDC) that has strict requirements on the peak serial number which can verify the validity of the method. The calibration experiment of basic measurement performance test and the unstable flow field experiment of the curved pipe were performed on the gas flow standard device, which verified the stability and validity of the method proposed in this paper.

1. Introduction

Gas flow measurement and monitoring plays a vital part in effectively managing and saving energy and natural resources [1]. Ultrasonic gas flowmeter is currently one of the fastest developing flowmeter technologies [2], which measures the one-way flow through a closed pipe system under normal conditions. As a gas flow measurement device, it plays a progressively vital part in natural gas trade, chemical industry, metallurgy, etc., particularly in the field of gas transportation and energy saving. [3,4]. Because of the serious energy attenuation of ultrasonic signal in gas, the amplitude of the ultrasonic signal fluctuates [5,6]. With the increase in the flow rate, this problem becomes more serious, and the propagation time is difficult to accurately obtain [4,7]. Therefore, high accuracy and stability should be haven in the signal processing method.
Ultrasonic flowmeter can be divided into the transit-time method [8], Doppler method [9], cross-correlation method [10], etc., according to the principle of signal detection. The most extensively used method is the transit-time method. This method separately measures the transit time of downstream and upstream ultrasonic signals from being sent by the transmitting transducer to being received by the receiving transducer, and then calculates the transit time difference which can calculate the flow rate. Compared with other measurement methods, the transit-time method has less error caused by temperature change [11]. Based on the measurement principle of the transit-time method, some scholars have proposed some methods.
The first method is the cross-correlation method, and its principle is shown in Figure 1. x ( t ) is the downstream ultrasonic signal and y ( t ) is the upstream ultrasonic signal. The cross-correlation function of x ( t ) and y ( t ) is [12]
R x y ( τ ) = lim T 1 T 0 T x ( t ) · y ( t τ ) d t
The cross-correlation function represents the degree of correlation between x ( t ) and y ( t ) with a distance of τ . When τ = Δ t , R x y ( τ ) reaches the maximum, that is, the correlation between x ( t ) and y ( t ) is the largest. Δ t is the transit time difference between the downstream and upstream ultrasonic signals. Brassier et al. processed the ultrasonic signal by cross-correlation method [8]. They chose the wave received for the first time as the reference wave. The reference wave is received by the transducer on the other side of the pipeline after being reflected as the second wave. The reference wave and the second wave are used for cross-correlation calculation to obtain transit time. This method has a certain anti-noise interference ability, but the ultrasonic signal attenuation is more serious and the reflected signal is weak, which increases the design difficulty of signal conditioning circuit and manufacturing cost. Tokio et al. proposed a cross-correlation derivation algorithm [13]. In this patent, the addition modulus operation is used to replace the multiplication operation in traditional cross-correlation algorithm so that the calculation complexity is reduced. However, when the influence of noise is large, due to the calculation error of the algorithm, the incorrect calculation result may appear. Ma performed cross-correlation operation between the real-time dynamic reference waveform and the received waveform [14]. This method effectively overcomes the decline of correlation caused by environmental factors, but the measurement accuracy should be improved. Yang proposed an improved cross-correlation method [15]. First, the ultrasonic signal of each transducer at zero flow rate is pre-stored in the system as the reference waveform, and then during the measurement, the transit time is obtained by the cross-correlation operation between downstream and upstream ultrasonic signals and reference waveform.
The second method is the feature extraction method. The feature extraction method has been a popular research direction of the ultrasonic gas flowmeter in recent years. This method assumes that there is a relatively stable feature in the ultrasonic signal from the maximum value, energy, and peak value. The flow rate can be calculated through the relationship between feature and transit time of the ultrasonic signal. Kobayashi et al. used digital signal processing (DSP) to analyze two cases of ultrasonic signal affected by the influence of noise and the ultrasonic signal attenuation [16]. They proposed to use the average time of zero-crossing point near the maximum peak point as the transit time of the ultrasonic signal. This patent focuses on the implementation of hardware. Tian et al. proposed a method based on the energy peak fitting of the ultrasonic signal [17]. They obtained the range of the optimal echo energy point by analyzing the relationship between the energy signal and the echo energy gradient. The echo energy point as a standard is chosen in the range to locate the four nearest echo energy peak points for linear fitting. The arrival time of ultrasonic signal is determined by the feature point on the fitting straight line corresponding to the echo energy point, so that the transit time of the ultrasonic signal is able to calculate. This method is simulated in MATLAB, as shown in Figure 2. Liu et al. proposed a method based on the echo energy integral [18]. They set the fixed cumulative energy value as a standard, and the area of the echo energy signal rising section was integrated. The feature point is the end position of the fixed cumulative energy value if the fixed cumulative energy value is smaller than the cumulative energy value. Therefore, the transit time of the ultrasonic signal is able to calculate. Mu et al. proposed a method based on the echo signal envelope fitting [19]. They analyzed the envelopes of ultrasonic signal under different flow rates and proposed three echo signal envelope fitting-based methods. They used the mathematical models to get the envelope gradient curves of the upper envelope’s rising section and the lower envelope’s falling section. Then, they used the envelope gradient curves to get the ranges of envelope and linearly distributed peak points. Two feature straight lines are obtained by the least squares fitting of these peak points, which, respectively, represent the upper envelope’s rising section and the lower envelope’s falling section. The feature points are able to be chosen by the points on the feature straight lines to locate the ultrasonic signal fast.
The third method is the threshold comparison method, and its timing principle is shown in Figure 3. First, the threshold V t h 1 is set and the excitation signal is acted on the transmitting transducer, which converts the electrical signal into ultrasonic signal. When the ultrasonic signal is triggered by the threshold V t h 1 , the first peak of the ultrasonic triggered by the trigger threshold is called the trigger wave. The time of the trigger point is the arrival time of the ultrasonic signal. The timing system pulls down the threshold V t h 1 immediately to the zero-crossing position V t h 2 of the ultrasonic signal after the trigger wave is intercepted, and V t h 2 is called the timing threshold. The advantages of the threshold comparison method are that it is a simple method, requires a small amount of calculation, and has low implementation cost. Sun et al. proposed a method where both downstream and upstream ultrasonic signals use the same fixed threshold to get the arrival time [20]. However, the arrival time of the two signals has one or more cycle deviations if the amplitudes of downstream and upstream ultrasonic signals are dissimilar. Zhu et al. proposed a variable ratio threshold and zero-crossing detection-based method [21]. They analyzed the distribution of echo peak points and set the threshold value to separate the feature peak from other peaks to get the corresponding feature points. The transit time is able to calculate by the feature points. But the method has the limitation that as the flow rate increases the peak shift of the ultrasonic signal may increase. Chen et al. proposed a method based on TDC-MAX35101 [22]. When the ultrasonic signal enters the TDC to be measured, the ultrasonic signal is first digitized and then the signal amplitude information is obtained. Then, in a measurement process, it is judged whether the downstream and upstream ultrasonic signals are attenuated. If the attenuation occurs, the current measurement signal is discarded. It reduces the possibility of false triggering of the TDC threshold between the downstream and upstream.
Both feature extraction method and threshold comparison methods solve the problem that the transit time is difficult to measure due to amplitude fluctuation by searching for characteristic points or comparison points. Aiming to address this problem, a PRCVS-based method is proposed for the transit-time ultrasonic gas flowmeter. Through the research on the mathematical model of ultrasonic signal, the ratio of the amplitude of adjacent peaks is defined as the PRCV of the peak. According to the corresponding relationship between the PRCV and the peak serial number, a set of reference PRCVS is established. By matching the characteristic value of the ultrasonic signal with the reference characteristic value sequence, the peak serial number can be determined. In this research, the PRCVS-based method is applied to the gas flow measurement system based on TDC that has strict requirements on the peak serial number which can verify the validity of the method. The calibration experiment of basic measurement performance test and the unstable flow field experiment of the curved pipe were performed on the gas flow standard device, which verified the stability and validity of the method proposed in this paper. But the method has the limitation. The ultrasonic signal waveform and its envelope are determined by the characteristics of the transducer and its installation position. If the transducer is reinstalled or replaced, the PRCV will change, and the reference PRCVS needs to be re-established.

2. Research on PRCVS Based Signal Processing Method

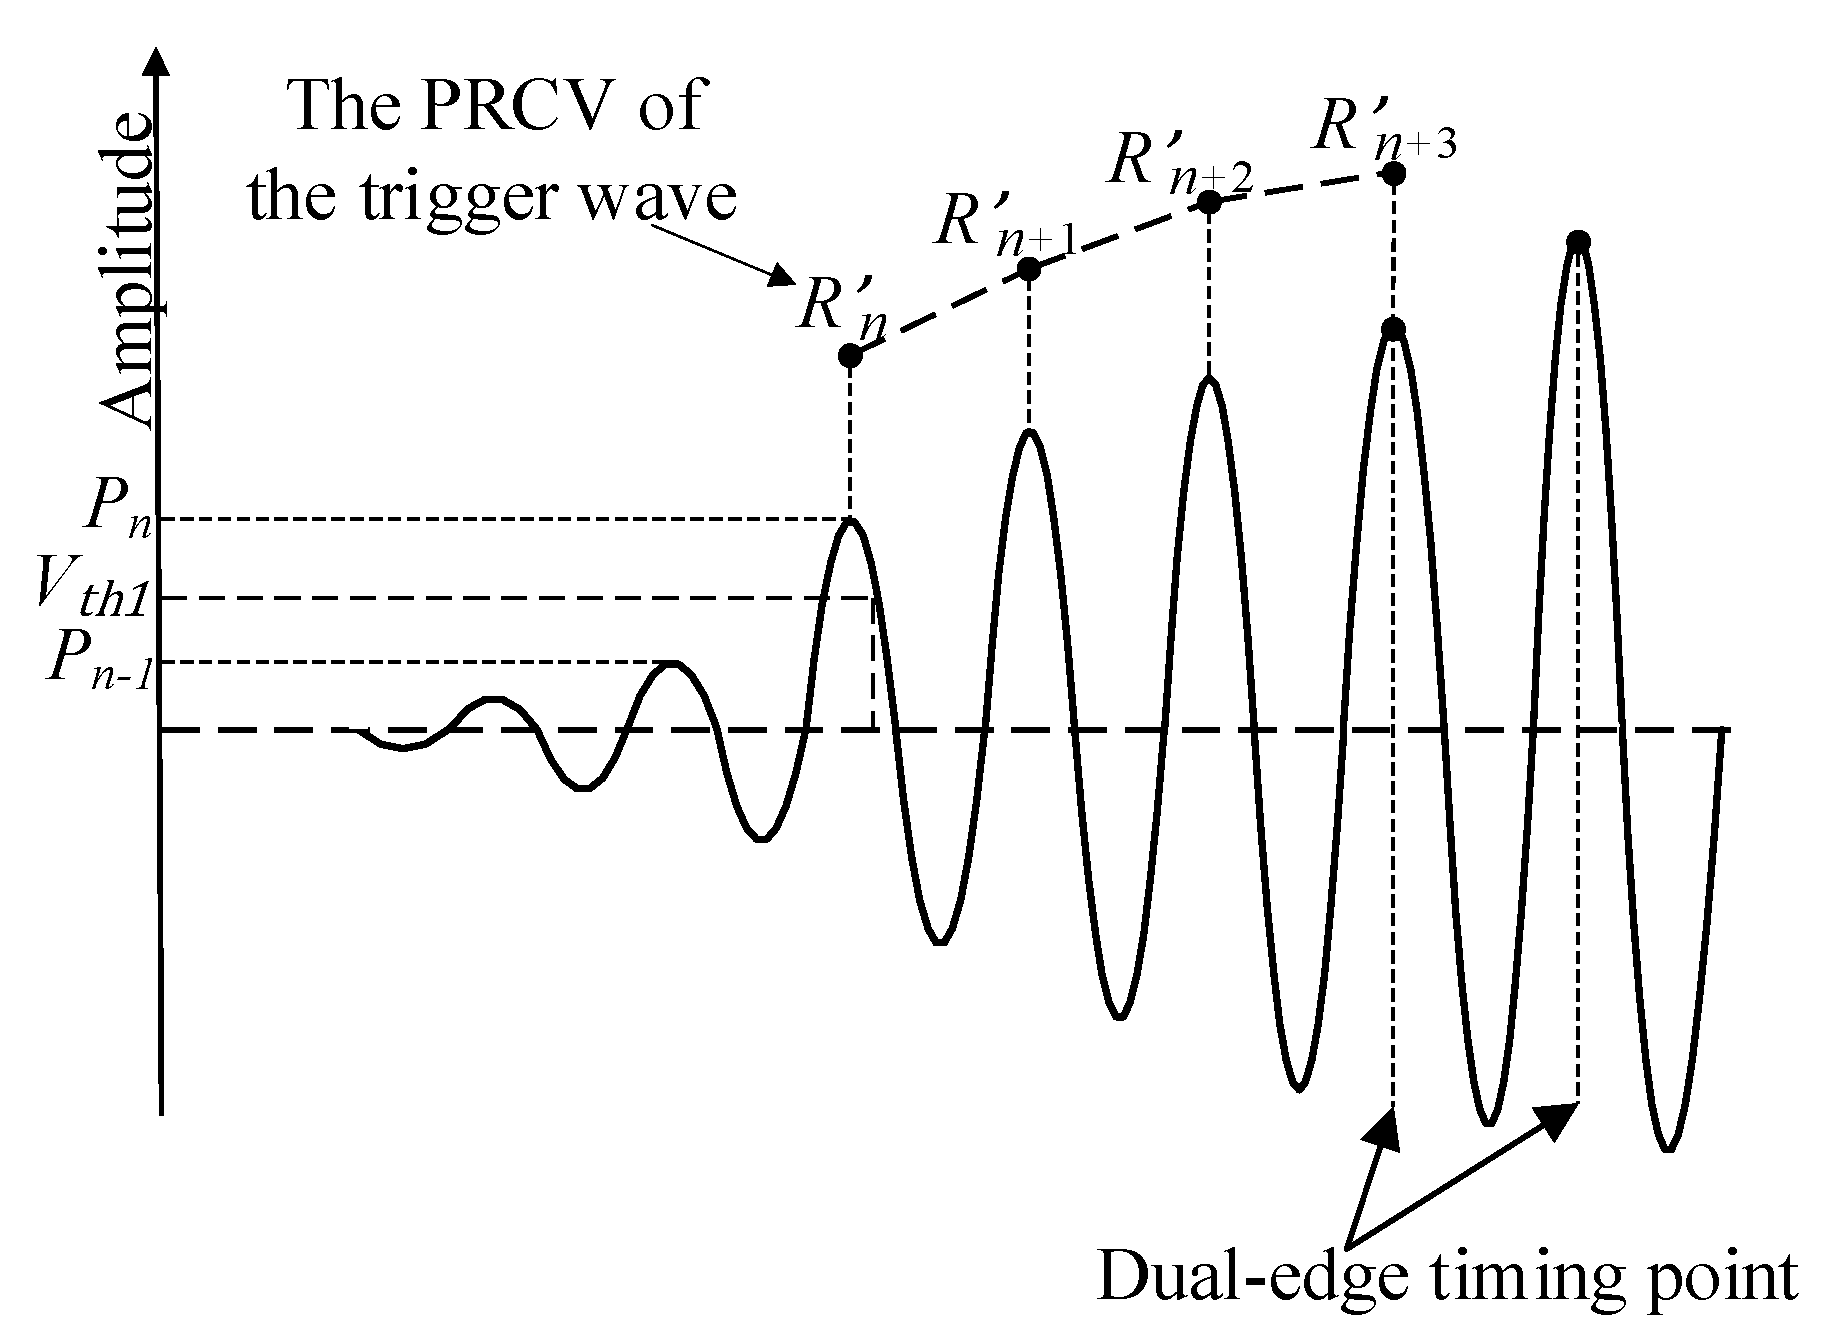
2.1. Research on PRCVS

The mathematical model expressions of ultrasonic signal waveform and its envelope are as follows [23,24,25,26],
s ( t ) = b ( t ) cos ( 2 π f 0 ( t τ ) + φ 0 )
b ( t ) = A 0 ( t τ β ) α e ( t τ β )
where τ is the time delay of ultrasonic signal, that is, the transit time of ultrasonic signal in the channel; f 0 is the center frequency of the transducer; φ 0 is the initial phase of the ultrasonic signal; A 0 is the amplitude of the ultrasonic signal; and α and β are the parameters determined by the transducer’s own characteristic and its placement scene. It provides good approximations while the values for α is between one and three [23].
Figure 4 is the simulation waveform of ultrasonic signal based on model Equations (2) and (3). According to the model Equations (2) and (3), the parameters are set to A 0 = 1 , f 0 = 200   kHz , φ 0 = 0 , τ = 1.75 × 10 5 s , α = 2.5 , β = 2.7 × 10 5 s .
According to Equation (2), it is assumed that t = τ is the starting point of ultrasonic signal amplitude. When t = τ , there must be cos ( 2 π f 0 ( t τ ) + φ 0 ) = 1 at the peak position of the ultrasonic signal. T 0 is equal to 1 f 0 . The time corresponding to the peak of the serial number n is assumed to n T 0 + τ , and the corresponding peak amplitude is assumed to p n = s ( n T 0 + τ ) = b ( n T 0 + τ ) . Similarly, the peak amplitude of the peak serial number n + 1 is p n + 1 = b [ ( n + 1 ) T 0 + τ ] . The ratio p n / p n + 1 is defined as the PRCV R n of the peak serial number n , then
R n = p n p n + 1 = ( n n + 1 ) α e T 0 β
Therefore, the change rate of the PRCV is
R n + 1 R n R n = [ ( n 2 + 2 n + 1 n 2 + 2 n ) α 1 ] 100 %
Formula (4) shows that parameters α and β are constant after installation of the transducer, that is, when the parameters { T 0 , α ,   β } remain unchanged, the PRCV of any peak in the ultrasonic signal is only related to the peak serial number, and has nothing to do with the amplitude of the whole ultrasonic signal. The value of the PRCV becomes larger as the peak serial number becomes smaller. As shown in Figure 5, under different parameters α , the smaller the peak serial number is, the greater the numerical change rate of the PRCV is.
Obviously, for an ultrasonic signal, the corresponding relationship can be established between the value of the PRCV which is independent of the signal amplitude and the peak serial number through Equation (4), so that the peak serial number has the corresponding PRCV. Accordingly, the following definition is made.
Peak Ratio Characteristic Value Sequence. If the initial peak sequence of an ultrasonic signal is numbered from 1 in sequence, the numerical change process of the numerical sequence of a set of peak ratio characteristic value obtained is similar to that of model Equation (3). Then, a data sequence formed by such a set of values of the peak ratio characteristic value is defined as a peak ratio characteristic value sequence.
The PRCVS has the following characteristics:
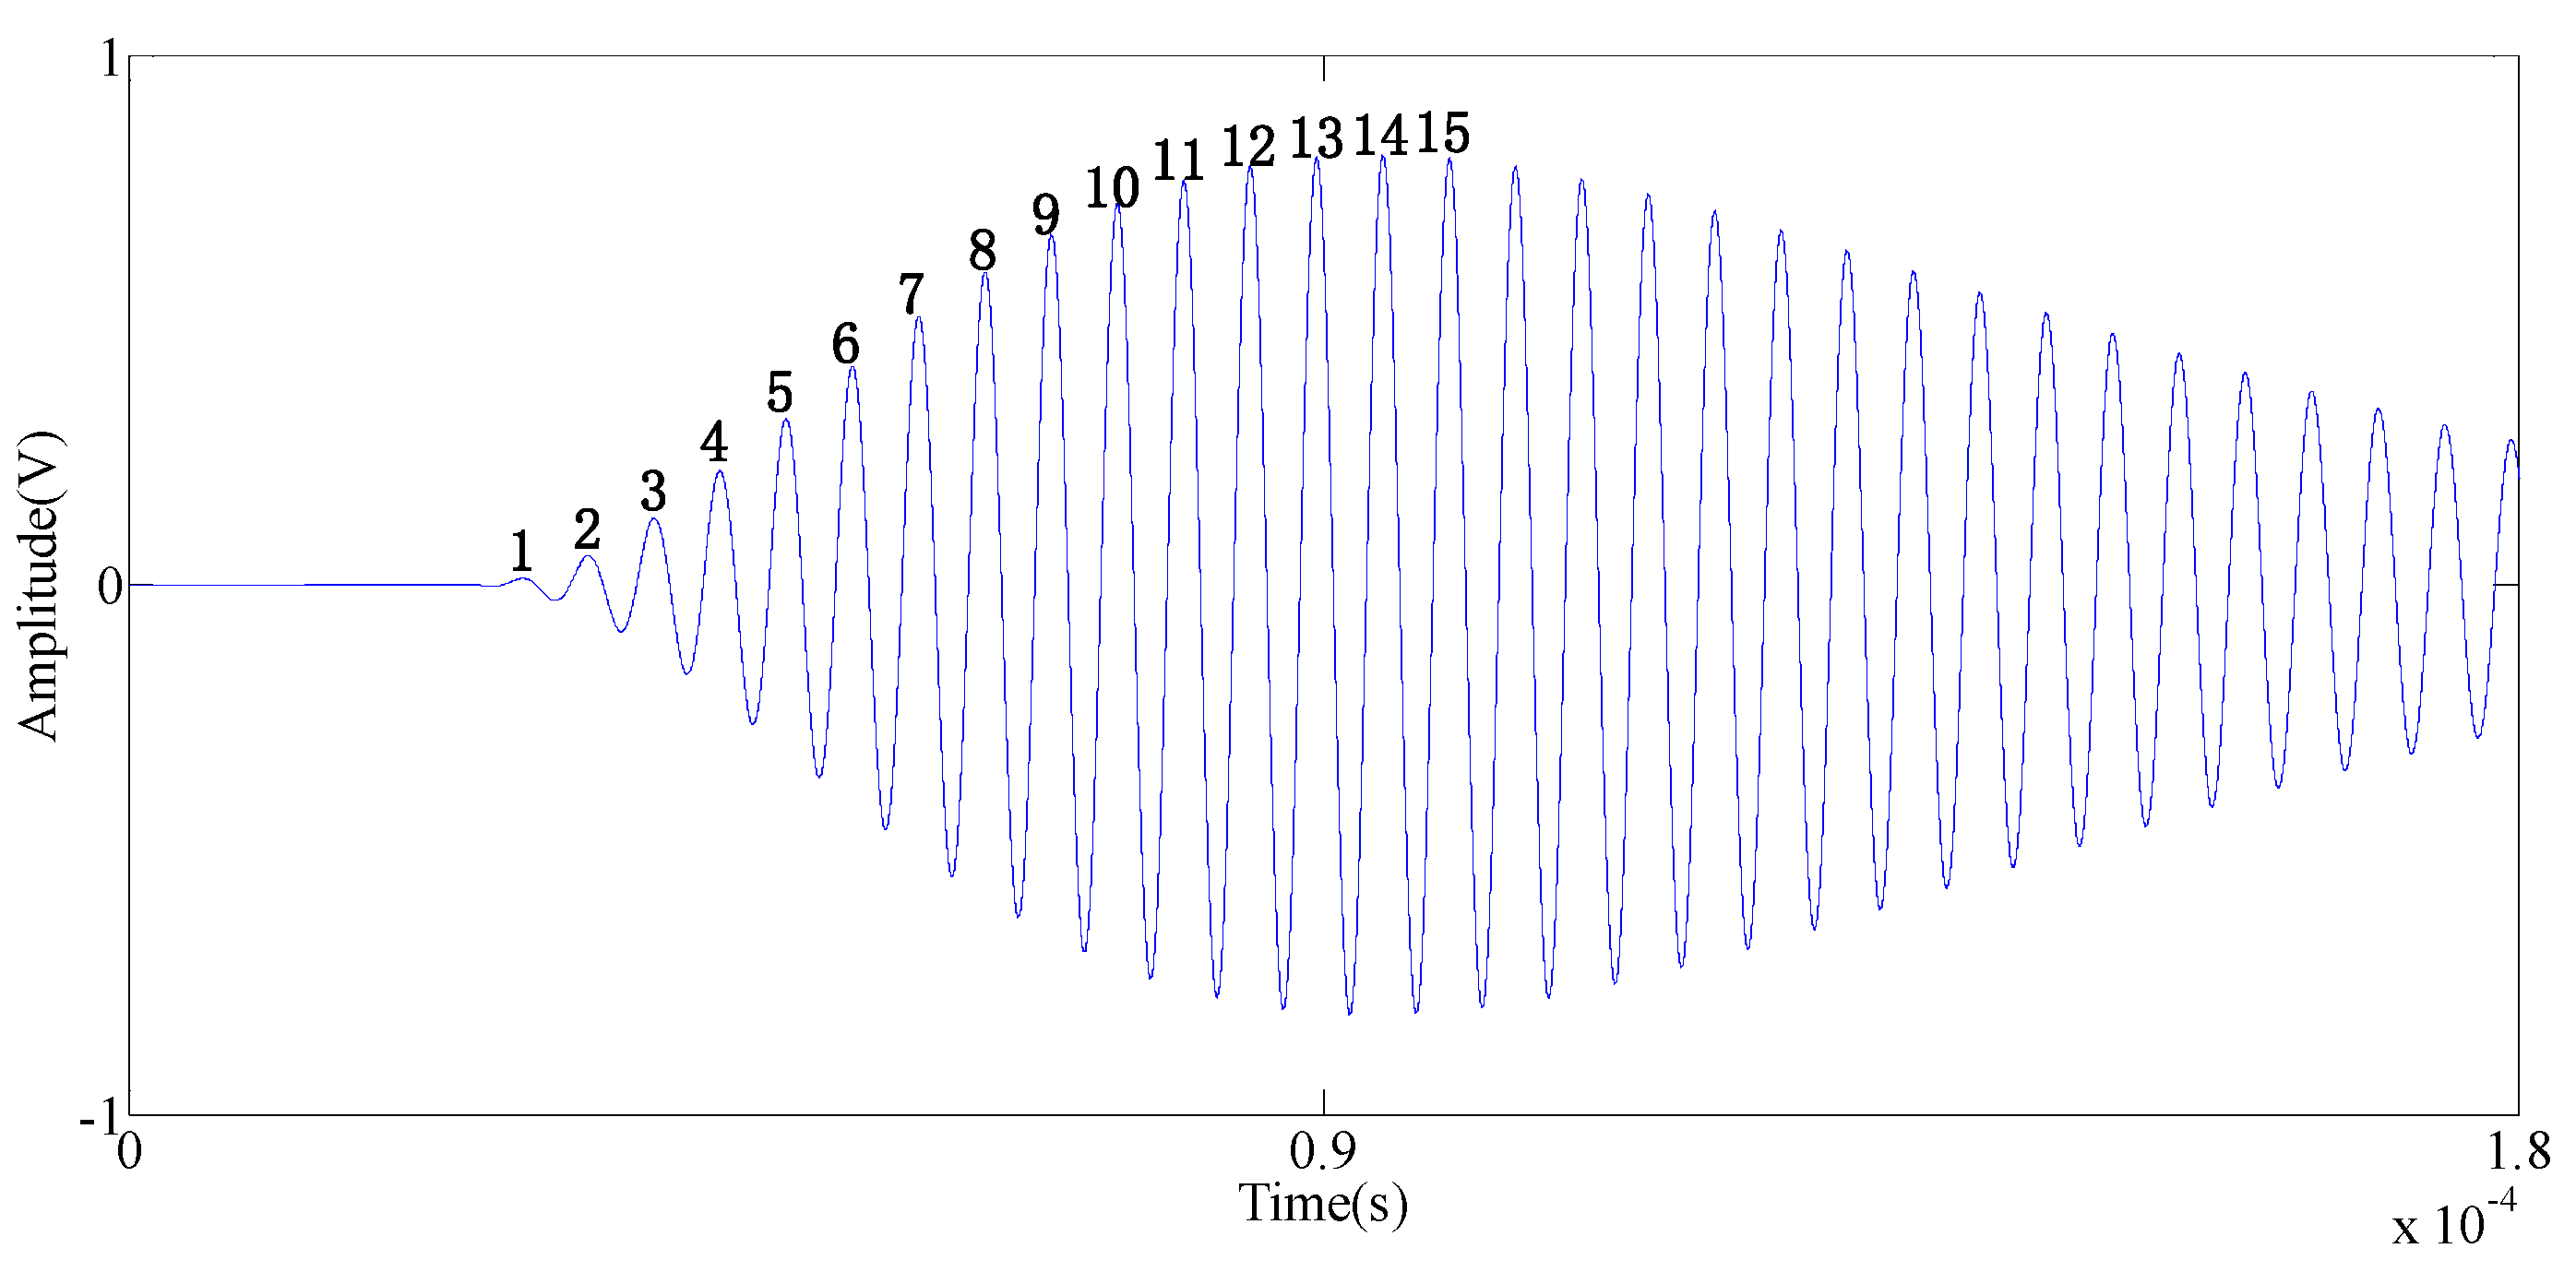
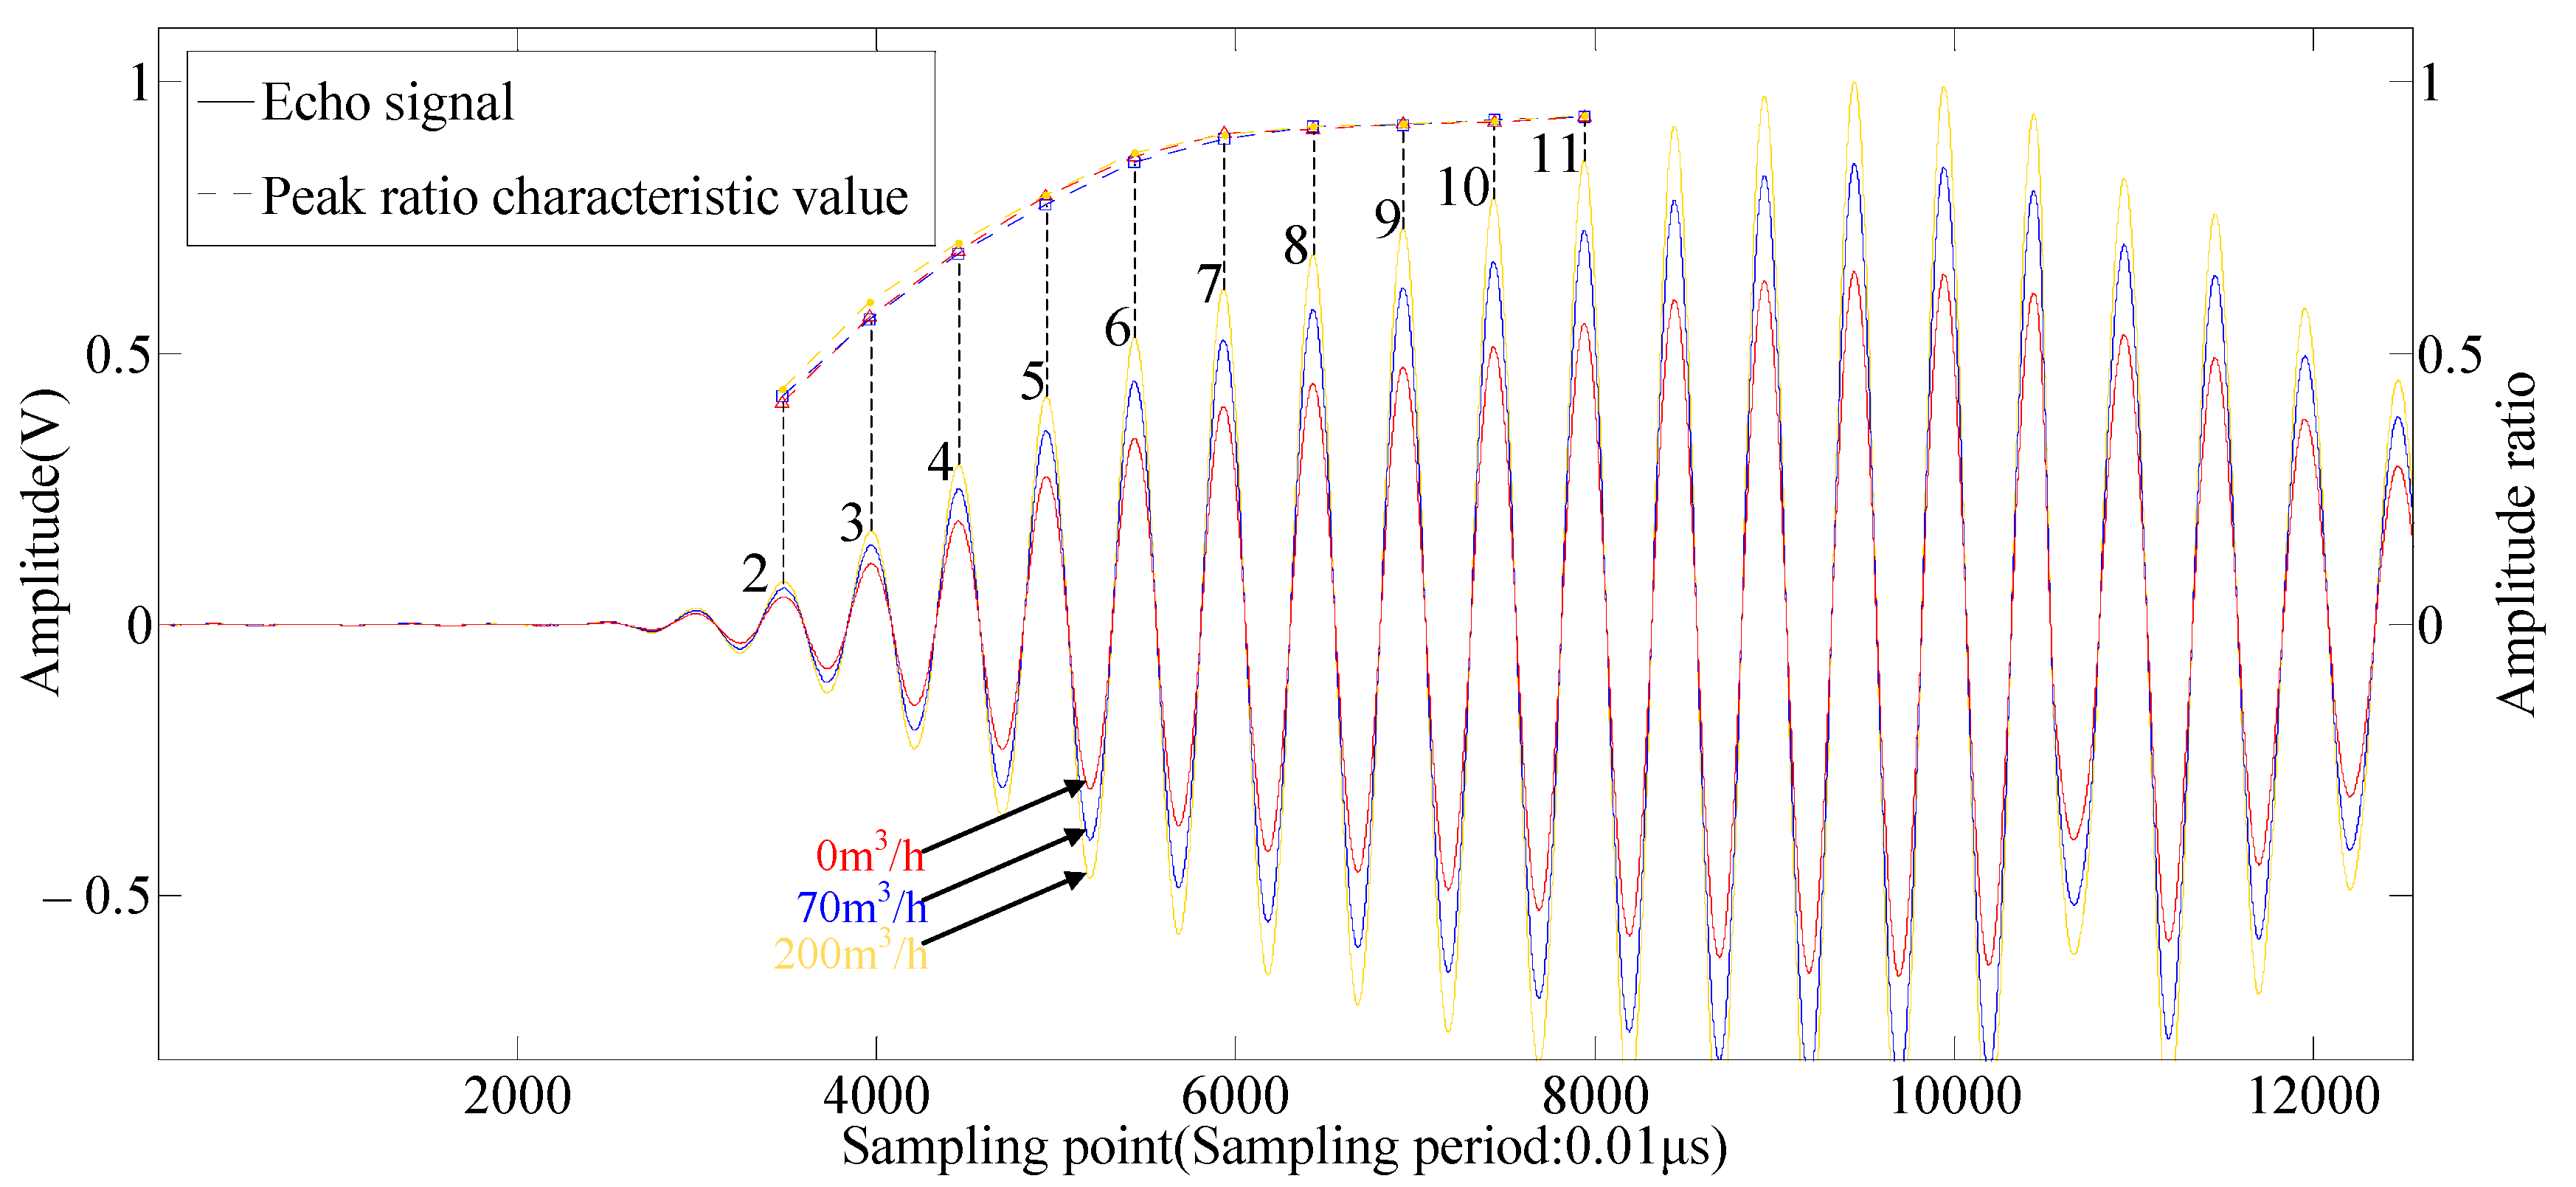
  • In the initial peak sequence of ultrasonic signal, the initial peak serial number corresponds to the unique value of the PRCV, which has nothing to do with the amplitude of the ultrasonic signal. Each group of ultrasonic signals has the same PRCV under the same peak serial number.
  • The PRCVS composed of the value of the PRCV increases monotonically with the increase of the peak serial number. The smaller the peak serial number is, the greater the change of the adjacent value of the PRCV, and the greater the discrimination of the value of the PRCV under the adjacent peak serial number.
Figure 6 shows the value of the PRCV of different peak serial numbers under different flow rates in the experiments. The specific values are shown in Table 1. Table 1 shows that the increasing trend of the value of the PRCV in the gas ultrasonic signal decreases with the increase of the peak serial number. From the second peak to the seventh peak, although the value of the PRCV fluctuates within a certain range, the fluctuation does not affect the identification of the value of the PRCV of the adjacent peak serial number. The values of the PRCV of different peak serial number are obviously distinguished from each other. With increasing serial number, from the eighth peak, the fluctuation of the value of the PRCV causes the distinction between them to no longer be obvious. Obviously, in the three groups of gas ultrasonic signals in Table 1, according to the peak serial number from 2 to 7 of the PRCV and its numerical change characteristic, the value of the PRCV fluctuating within a certain range does not affect the identification of the value of the PRCV of adjacent serial numbers. The values of the PRCV of different peak serial number are obviously distinguished from each other. It is verified that these three ultrasonic signals have the PRCVS.
According to the above analysis, if the stable PRCVS of the ultrasonic signal can be acquired under the zero flow rate of each ultrasonic flowmeter instrument calibration state, this stable PRCVS and the relationship between the value of the PRCV and the peak serial number are taken as a reference template. By comparing with the reference template, the peak serial number can be located by corresponding to a new set of the value of the PRCV between the initial peaks of normal ultrasonic signal of ultrasonic flowmeter at any flow rate. Obviously, the PRCVS and its characteristics provide the basis for solving the problem of amplitude fluctuation of ultrasonic signal.

2.2. Establishment of PRCVS-Based Signal Processing Method

2.2.1. Establishment of Reference PRCVS

The PRCVS-based signal processing method needs to establish a reference PRCVS that provides the corresponding relationship between the value of the PRCV and the peak serial number. When the ultrasonic transducer is matched with the converter, 20 groups of ultrasonic signal with better waveform are selected under zero flow in the calibration condition. After preprocessing, the peak values of each group of ultrasonic signal are obtained, and the corresponding values of the PRCV are calculated. The specific realization of preprocessing will be described in Section 2.2.2.
The value of the PRCV of the ith peak of the jth ultrasonic signal is R i ( j ) . Then, the value of the PRCV of the ith peak in the reference PRCVS is
R i = 1 20 j = 1 20 R i ( j )
Therefore, the sequence { R 1 ,   R 2 , , R i , , R n } is the reference PRCVS, which is stored in the converter system.

2.2.2. Ultrasonic Signal Preprocessing

The PRCVS-based signal processing method locates the peak serial number by the value discrimination of the PRCV. The value of the PRCV is calculated by the adjacent peak value. The accuracy of the peak value directly affects the calculation result of the value of the PRCV. Therefore, this paper preprocesses the collected ultrasonic signals to ensure the accuracy of peak value extraction.
It is necessary to preprocess the ultrasonic signal for the establishment of the reference PRCVS and the ultrasonic signal analysis in the normal operation of the system. The preprocessing has the following three stages:
1.
Interpolation of sampling peak
The sampling peak is the peak value obtained from the original sampling data, which is limited by the sampling frequency and deviates from the true peak value. In order to minimize the sampling deviation and improve the precision of the data, this research chooses to interpolate the original sampling data of the ultrasonic signal, and uses the sine function interpolation method [27], as shown in Equation (7):
y a ( t ) = i = 1 N x a ( i T s ) sin [ π T s ( t i T s ) ] π T s ( t i T s )
where x a is the original sampling data, y a is the interpolated data, and T s is the sampling interval. In this paper, three values are inserted between every two sampled data. The ultrasonic signal curves before and after interpolation are shown in Figure 7a,b.
2.
Peak Value Extraction
The extraction criterion of the peak value is that the value of this point is greater or equal to the values of all data points on the left and right sides. According to the characteristics of the ultrasonic signal waveform, it can be simplified as the maximum point satisfying that the value of the first point on the left is greater than the value of the second point on the left, and the value of the first point on the right is greater than the value of the second point on the right.
3.
Waveform discrimination
Based on the characteristic of PRCVS, the ultrasonic signal that can be used for signal processing based on the peak ratio eigenvalue sequence should meet the following condition:
The amplitude of the first eight peaks of the ultrasonic signal increases monotonically (that is, the values of the first seven PRCV satisfy the second characteristic of the PRCVS).
As long as the above condition is met, the ultrasonic signal can be subsequently calculated according to the characteristics of the PRCVS. Otherwise, the ultrasonic signals that do not meet the waveform discrimination condition are discarded.

2.2.3. Monotonicity Judgment of PRCV

When the reference PRCVS has been established in the system, it is assumed that the ultrasonic signal does not need to be discarded after preprocessing. The jth peak value extracted in a total of s waves in the rising section of the ultrasonic signal amplitude is recorded as P j , where j [ 1 , s ] .The value of the PRCV of the current ultrasonic signal can be calculated by Equation (8).
R j = P j / P j + 1
Therefore, the sequence composed of the values of the PRCV of the current ultrasonic signal is { R 1 , R 2 , , R j , , R s 1 }. If the value of the PRCV in the sequence increases monotonically, it is considered to have the characteristic of the PRCVS, and the ultrasonic signal can be processed continuously, otherwise it is discarded.

2.2.4. PRCV Matching

P m is the peak value of any wave in the rising section of the ultrasonic signal amplitude, where m [ 1 , s ] . Substituting m into Equation (8), the value of the PRCV of the wave is R m . At this time, subscript m cannot be used as the peak serial number of the wave, and the characteristic value matching is needed to determine the peak serial number.
Next, the peak serial number corresponding to R m is determined by the matching operation between R m and the reference PRCVS. Specifically, if R k is the kth element of the reference PRCVS, and satisfies Equation (9):
| R m R k | = min 1 i n | R m R i |
The specific implementation of Equation (9) is to search for R k in the reference PRCVS, so that the following inequality is established:
| R m R k | < | R m R k 1 |   and   | R m R k | < | R m R k + 1 |
Then the distance between R m and R k is the smallest. According to the characteristic of the PRCVS, there is m = k . That is, the peak serial number corresponding to the wave where R m is located is k .
The above is the establishment process of the PRCVS based signal processing method.

3. Application and Verification of PRCVS-Based Method

In this paper, the PRCVS-based method is applied to gas flow measurement system based on TDC that has strict requirements on the peak serial number, and the validity of the method is verified.

3.1. System Hardware Introduction

The transit-time ultrasonic gas flowmeter based on PRCVS consists of the primary instrument and signal processing module, as shown in Figure 8. The center frequency of the transducer selected in this paper is 200 kHz. The signal processing module includes the following six modules:
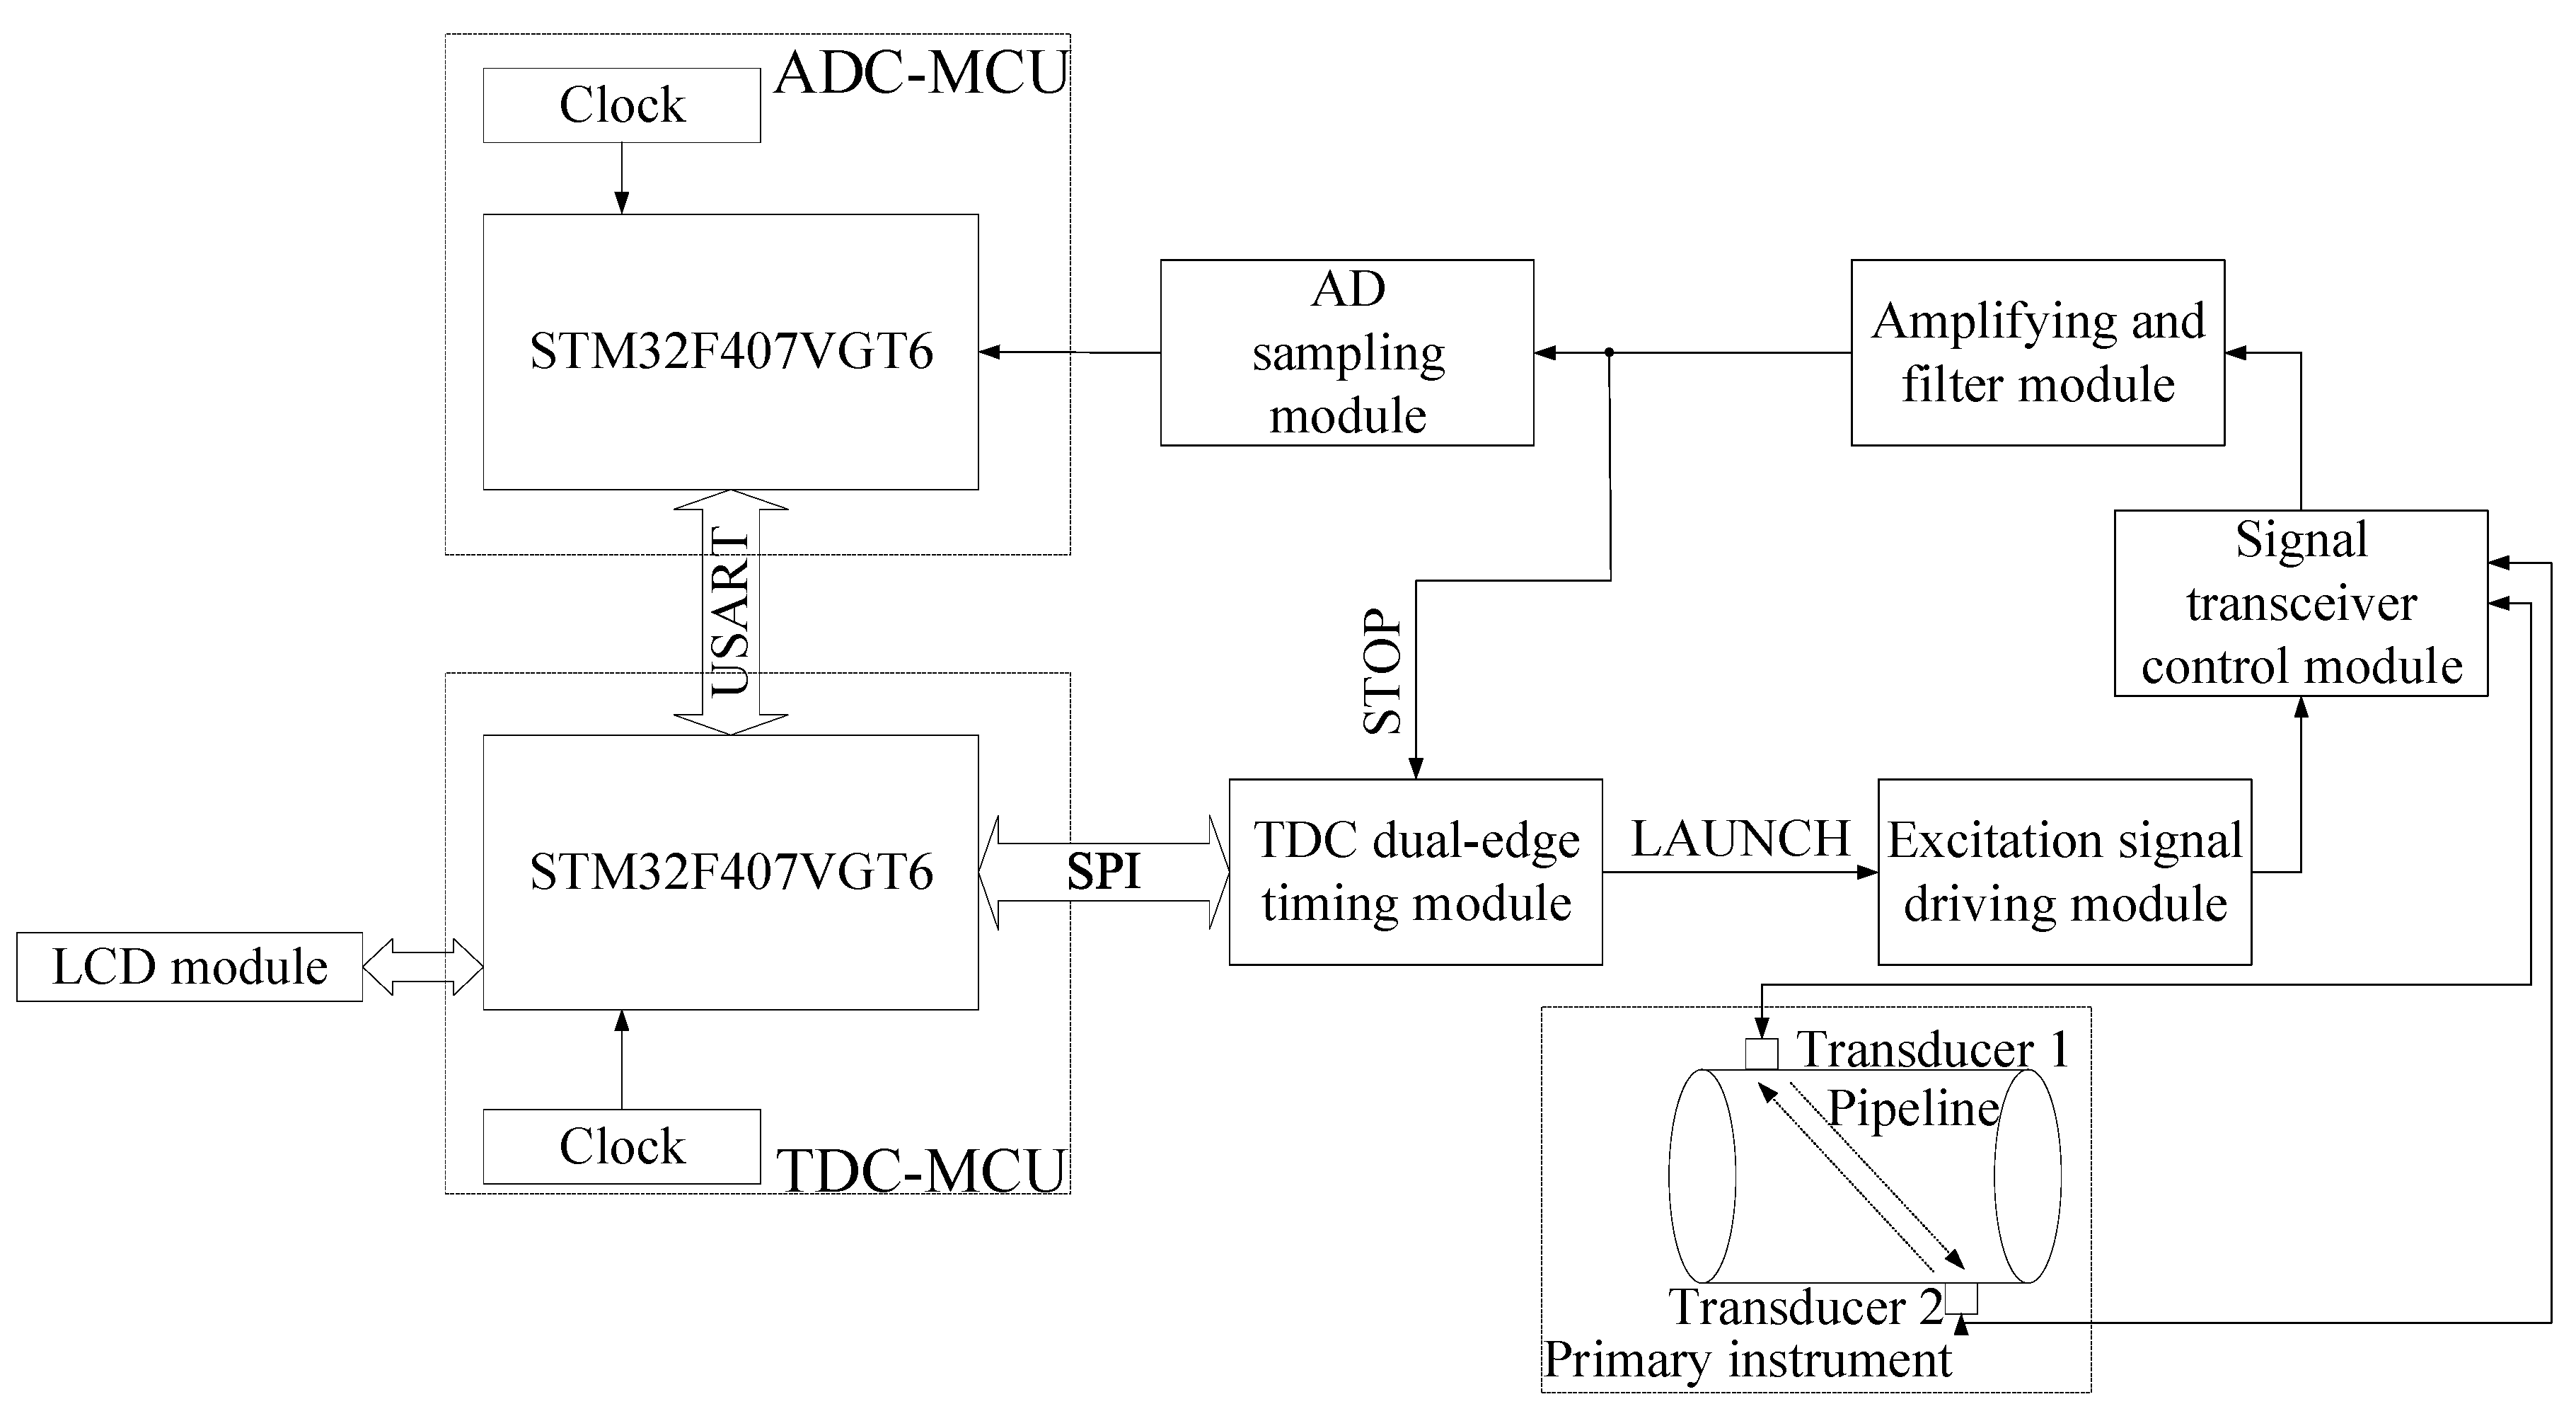
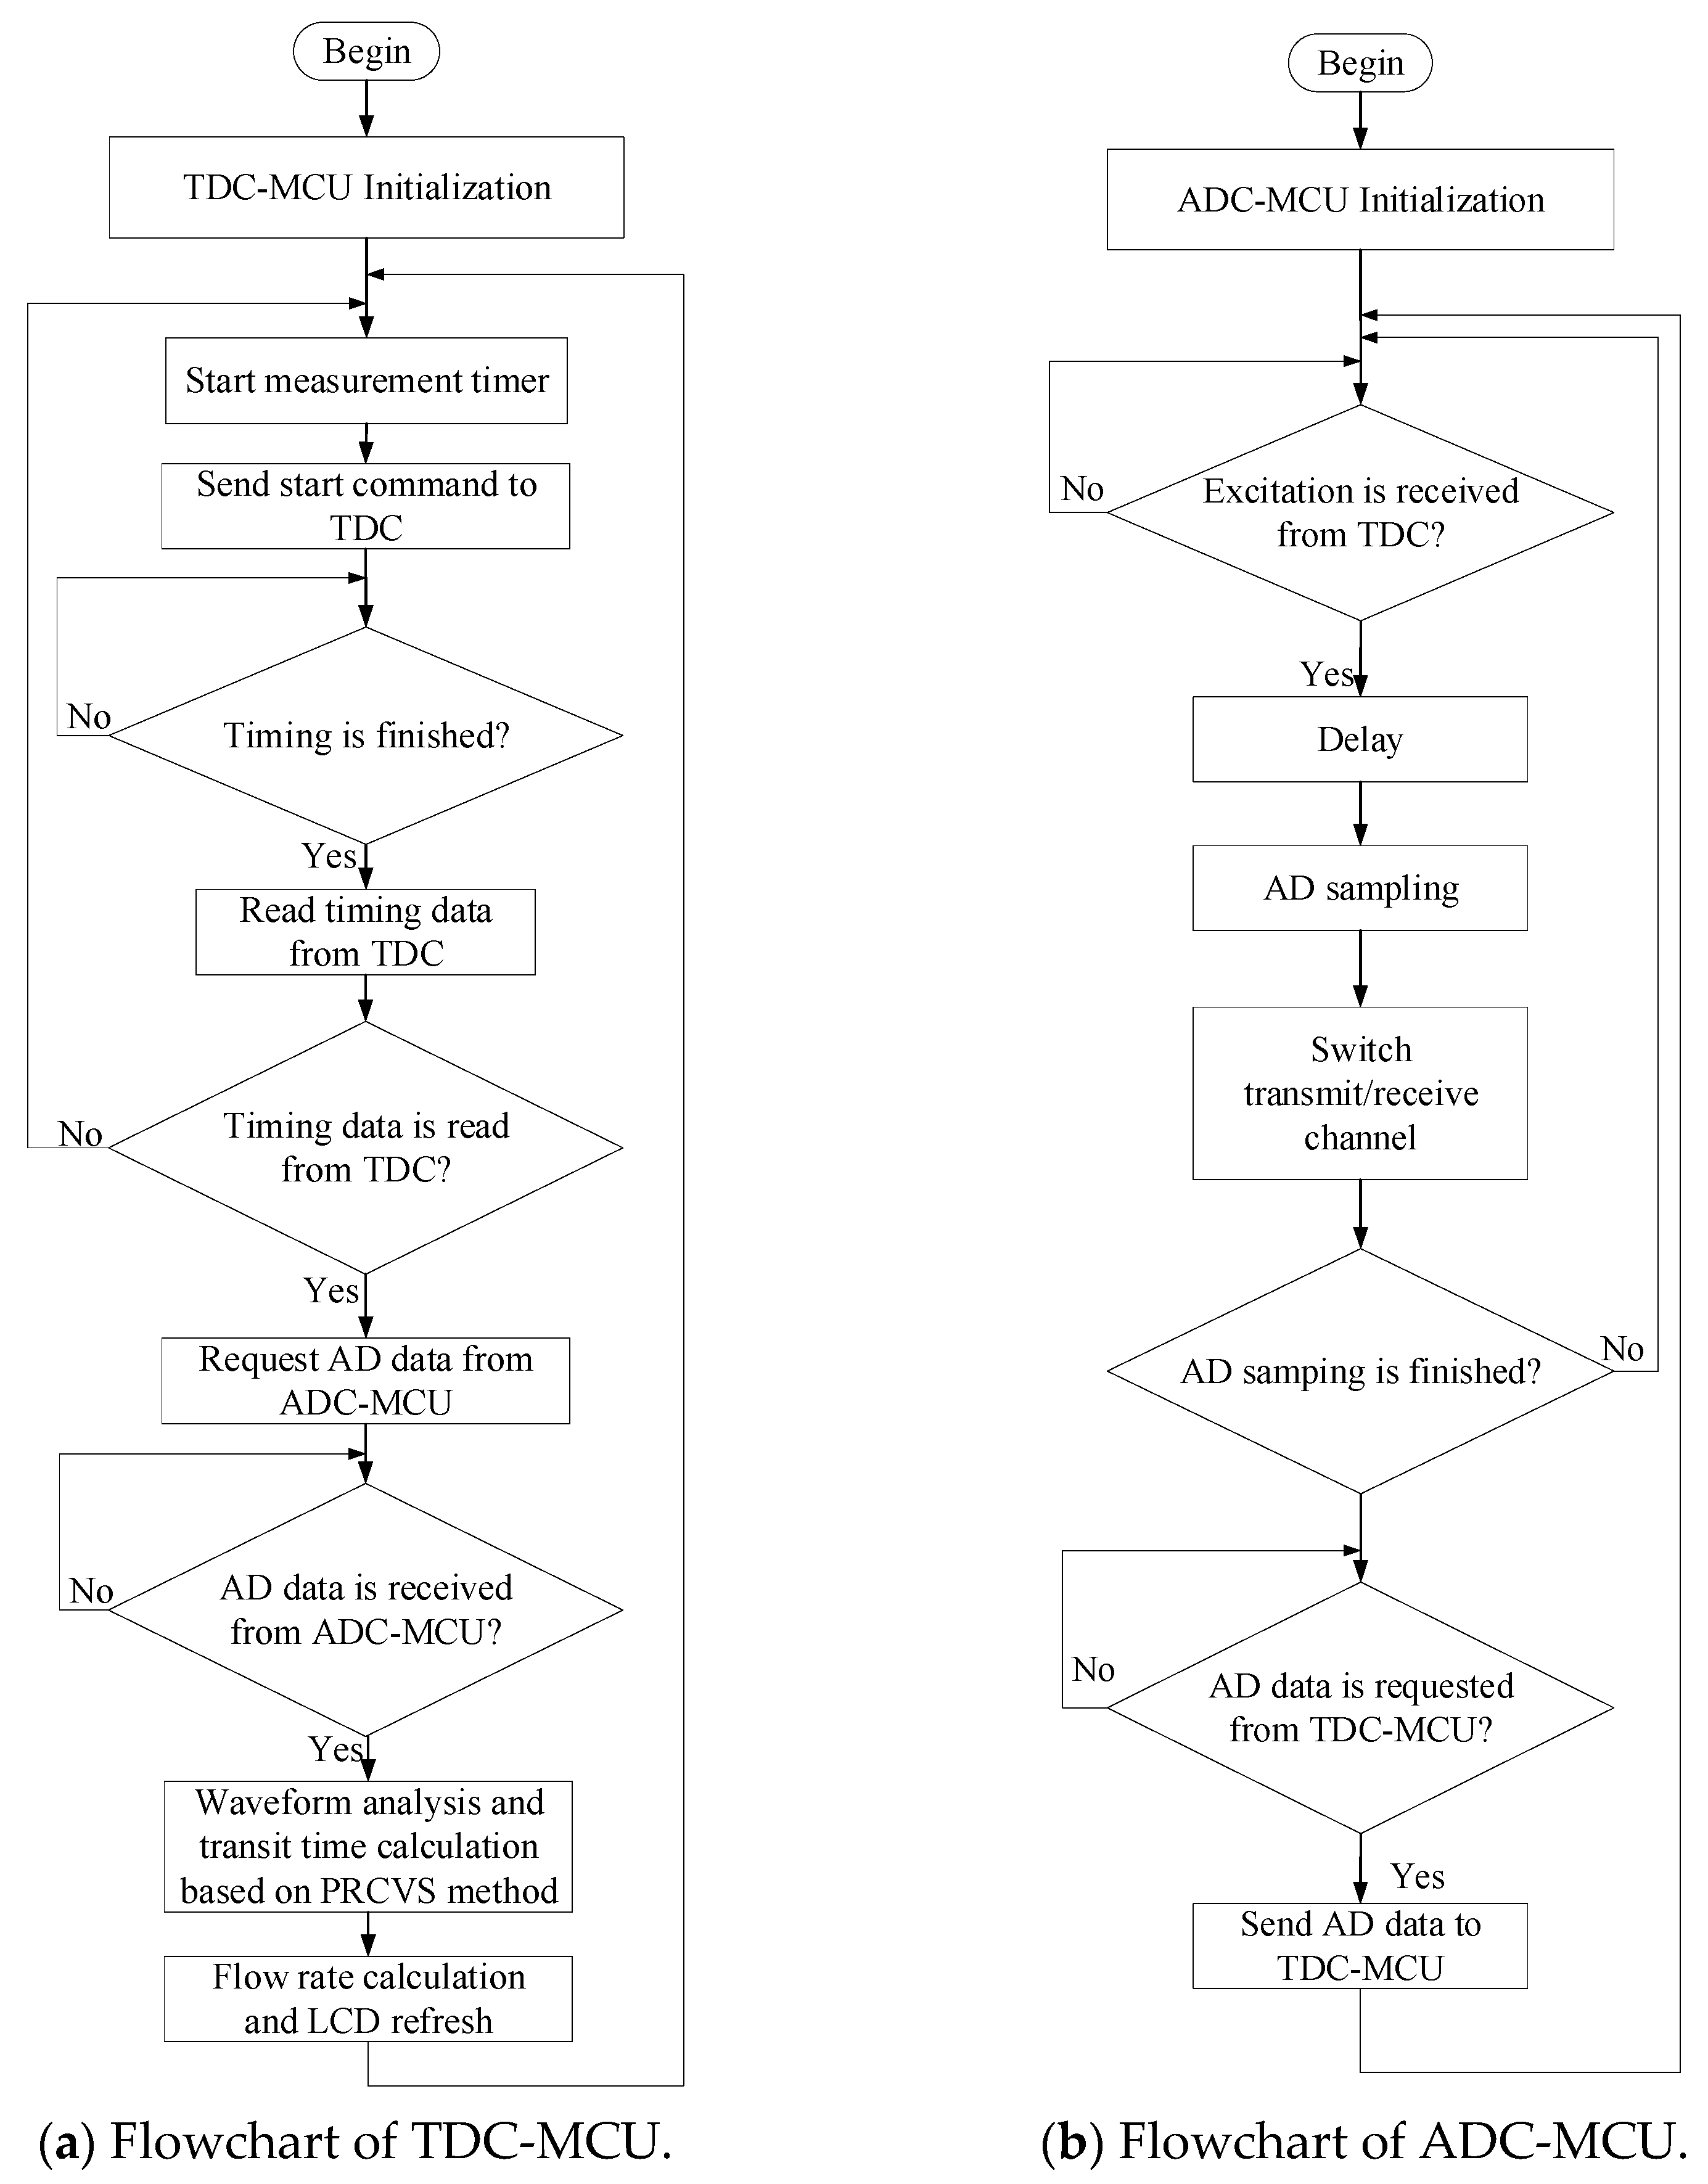
  • Microprocessor module. Two STM32F407VGT6 master chips with the same model are used in the system, which are named TDC-MCU and ADC-MCU, respectively, according to their functions. TDC-MCU is responsible for reading and writing data with two MAX35101 chips of the TDC dual-edge timing module through SPI. ADC-MCU is responsible for AD (analog-to-digital) sampling, so that the AD sampling module performs AD sampling at the appropriate position of the ultrasonic signal and saves the sampled data in ADC-MCU. The AD data are transmitted between TDC-MCU and ADC-MCU through USART.
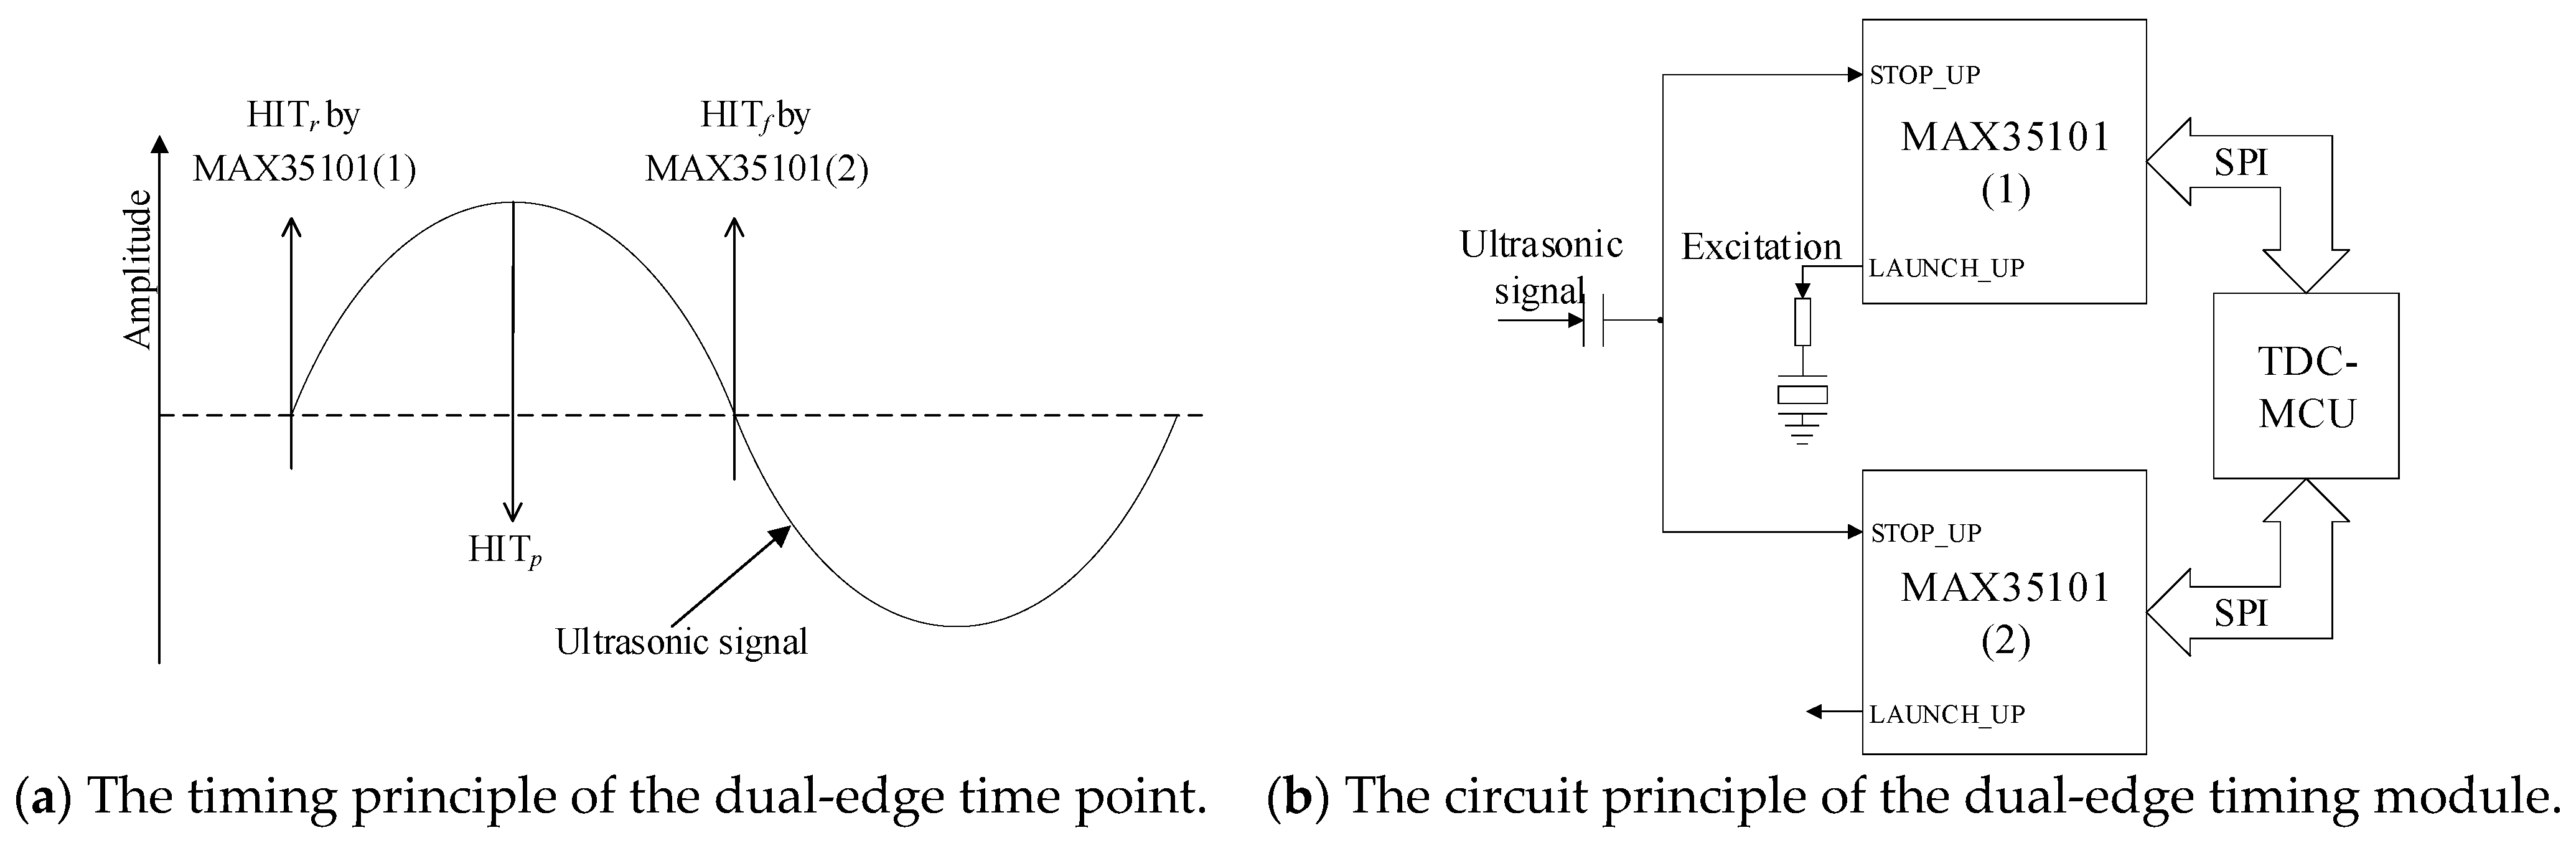
  • TDC dual-edge timing module. In this paper, MAX35101 is used for high-precision timing of transit time, and the TDC-MCU in the microprocessor module controls the transmission of the excitation signal launched from the LAUNCH terminal of the TDC. When the ultrasonic signal is sent to the STOP terminal of the TDC, the transit time is measured. The conventional timing method of MAX35101 is the edge timing, but the edge timing error is caused by the fluctuation of the amplitude when measuring the gas ultrasonic signal. This paper uses the cooperative work of two MAX35101 to realize the dual-edge timing of the ultrasonic signal to correct the edge timing error to obtain the dual-edge time point.
  • Excitation signal driving module. As the amplitude of the excitation signal transmitted by the TDC dual-edge timing module is small, the excitation pulse signal needs to be amplified by the excitation signal driving module to obtain the ultrasonic signal with appropriate amplitude.
  • Signal transceiver control module. The switch channel is switched through the signal transceiver control module, so that the excitation signal and the downstream and upstream related signals are transmitted in the same analog circuit.
  • Amplifying and filter module. After amplifying and filtering, the received ultrasonic signal is sent to TDC dual-edge timing module and AD sampling module respectively.
  • AD sampling module. High-speed AD sampling is used for ultrasonic signal. After obtaining the downstream and upstream transit time and the corresponding AD data, the ADC-MCU packs the downstream and upstream AD data and transmits it to the TDC-MCU. Then, the TDC-MCU performs subsequent calculation and analysis.
In this paper, the transit time is measured by TDC in hardware. Because the threshold V t h 1 is preset, there is n , so that P n 1 < V t h 1 and P n > V t h 1 , then P n is the peak value of the trigger wave. According to Equation (8), the value of the PRCV of the trigger wave is R n . The wave at the first dual-edge timing point is the third wave after the trigger wave so the value of the PRCV is R n + 3 , as shown in Figure 9. The peak serial number corresponding to the trigger wave is determined by the matching operation between the PRCV of the trigger wave and the reference PRCVS. By analogy, the peak serial number of the wave at the dual-edge timing point can be determined.
This paper uses the cooperative work of two MAX35101 in hardware to realize the dual-edge timing of the ultrasonic signal to correct the edge timing error to obtain the dual-edge time point. The two chips obtain the rising edge trigger timing capture point HIT r and the falling edge trigger timing capture point HIT f , respectively, and the dual-edge timing point HIT p is the arithmetic average of the rising edge trigger timing data and the falling edge trigger timing data of the same wave.
In the process of a flow measurement, the microprocessor obtains the rising edge trigger timing data and the falling edge trigger timing data from two MAX35101 chips respectively during the downstream, and then calculates the dual-edge time of the downstream, and performs the same operation in the upstream. In this way, the transit time is calculated through the dual-edge time of the ultrasonic signal. Figure 10a shows the timing principle of the dual-edge time point, and Figure 10b shows the circuit principle of the dual-edge timing module.

3.2. System Software Introduction

Figure 11 shows the flowchart of the software of signal processing. TDC-MCU is the main control chip in charge of controlling the work of the TDC. ADC-MCU is the main control chip in charge of AD data sampling. TDC is the timing chip responsible for launching excitation pulse signals and sampling time capture points. First of all, TDC-MCU, ADC-MCU, and TDC (two MAX35101 chips) are powered on for the first time to realize their initialization, and then the program enters the repeated cycle measurement mode. The TDC-MCU measurement timer starts to count, and when the time point is reached, it enters the timer interrupt service processing program. At this time, the TDC start command is sent, and then the TDC-MCU enters the mode of waiting to read the ultrasonic signal time data. Meanwhile, the TDC sends a specified number of excitation pulse signals at the LAUNCH terminal of the TDC after receiving the start command. Then, the ADC-MCU receives the rising edge of the first excitation pulse signals, and uses this as a sign to delay the specific time, and then performs AD sampling of downstream and upstream ultrasonic signals and switches downstream and upstream transmitting and receiving channels. The TDC is also implemented synchronously with the above functions of ADC-MCU. After sending a specified number of excitation pulse signals, when the ultrasonic signals enter the ultrasonic signal receiving end of the TDC after a period of time propagation, the ultrasonic signals can be captured and the time can be obtained according to the principle of threshold comparison method, and then TDC sends a timing interrupt signal at the STOP terminal to TDC-MCU. After capturing the timing completion interrupt signal at the TDC end, the TDC-MCU reads timing data through SPI from TDC. TDC-MCU requests AD data from ADC-MCU through USART after reading the timing data of downstream and upstream. After receiving the request signal, ADC-MCU sends the prepared data to TDC-MCU, and then proceeds to the next round of data sampling. After receiving all AD data, TDC-MCU performs waveform analysis and transit time calculation according to the acquired data. Finally, the flow rate is calculated and the LCD is refreshed on the TDC-MCU. So far, the TDC-MCU has also completed a round of flow rate measurement.

3.3. Calculation of Transit Time Difference and Flow Rate of PRCVS-Based Signal Processing Method

Through the above analysis, the peak serial number of threshold trigger wave is obtained. The trigger wave serial numbers of the downstream and upstream are, respectively, recorded as k u p and k d n . Δ k = k u p k d n indicates the number of errors of the downstream and upstream ultrasonic signals under the same threshold. If Δ k = 0 , it indicates that the threshold V t h 1 is not triggered by wrong wave. If Δ k > 0 , the peak serial number triggered by the threshold V t h 1 when the flow is upstream is Δ k ahead of the serial number when the flow is downstream. If Δ k < 0 , the peak serial number triggered by the threshold V t h 1 when the flow is downstream is | Δ k | ahead of the serial number when the flow is upstream.
The dual-edge time point of the downstream signal is recorded as HIT u p [ i ] , and the dual-edge time point of the upstream signal is recorded as HIT d n [ i ] , where i [ 1 , 6 ] . The difference of transit time Δ t is calculated with the time point where the peak serial numbers of the downstream and upstream coincide. The calculation method is shown in Equation (11).
Δ t = { 1 6 Δ k ( i = 1 + Δ k 6 HIT d n [ i ] i = 1 6 Δ k HIT u p [ i ] ) ,   Δ k 0 1 6 | Δ k | ( i = 1 6 | Δ k | HIT d n [ i ] i = 1 + | Δ k | 6 HIT u p [ i ] ) ,   Δ k < 0
Ultrasonic signal downstream transit time t u p :
t u p = L c u p = D / sin θ c 0 + v cos θ
Ultrasonic signal upstream transit time t d n :
t d n = L c d n = D / sin θ c 0 v cos θ
In Equations (12) and (13), the angle between the line of two ultrasonic transducers and the line of the pipeline axis is the vocal tract angle θ . The downstream and upstream transit distance of the ultrasonic signal is L . The inner diameter of the pipe is D . The actual downstream transit velocity is c up . The actual upstream transit velocity is c dn . The velocity of sound in the medium is c 0 . Combining Equations (12) and (13), eliminating sound velocity c 0 the velocity v can be obtained from Equation (14):
v = Δ t · tan θ 2 D ( c 0 2 v 2 cos 2 θ )
In Equation (14), Δ t = t d n t u p , because of c 0 2 v 2 cos 2 θ , the Equation (14) is approximated to obtain Equation (15):
v c 0 2 · tan θ 2 D · Δ t
Assuming that the velocity distribution on the pipe diameter section is uniform, the flow rate q v can be obtained by Equation (16):
q v = K 0 · v · S = K 0 · π · D 2 4 · v
In Equation (16), the calibration coefficient is K 0 ; the cross-sectional area of pipe diameter is S and the flow rate is q v .
The transit time difference Δ t obtained by Equation (11) is substituted into Equations (15) and (16) to calculate the gas velocity and flow rate.

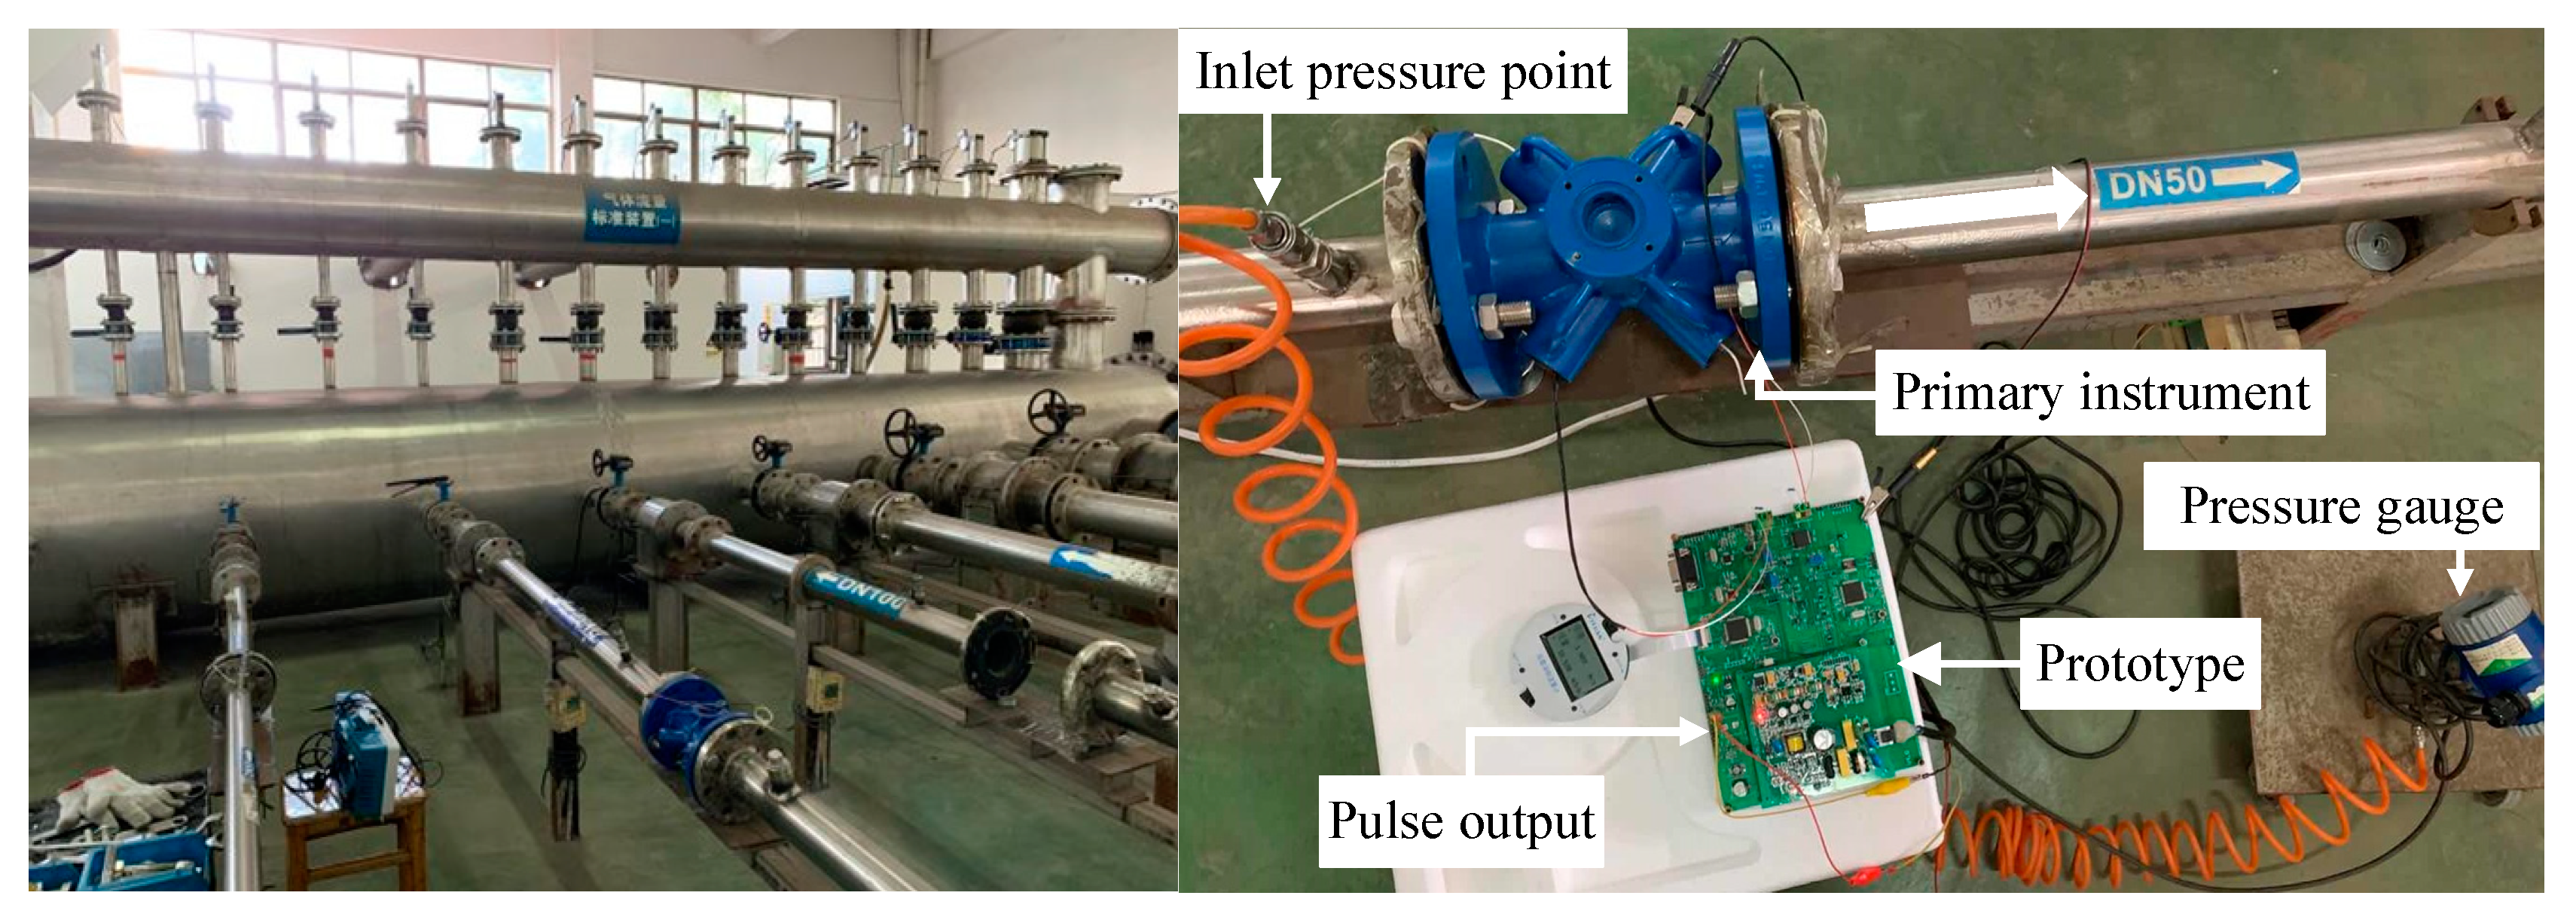
4. Experimental Verification

The calibration experiment of basic measurement performance test and the unstable flow field experiment of the curved pipe were performed on the gas flow standard device in Zhejiang Diyuan Instrument Co., Ltd., Yiwu City, China so as to verify the stability and validity of the method based on PRCVS.

4.1. Calibration Experiment

The prototype is installed in the DN50 (the pipe inner diameter is 50 mm) straight pipe of the gas flow standard device as the tested meter, as shown in Figure 12. According to the Verification Regulation of Ultrasonic Flowmeters [28], the flow rate is set to 10 m3/h, 20 m3/h, 80 m3/h, and 200 m3/h. Each flow rate should be measured 3 times, and the pulse output value of the tested meter was counted within 60 s each time.
The nth (n = 1, 2, 3) actual pulse coefficient of the mth (m = 1, 2, 3, 4) flow rate is K m n . The average actual pulse coefficient K m ¯ of the mth (m = 1, 2, 3, 4) flow rate can be obtained by Equation (17):
K m ¯ = 1 3 n = 1 3 K m n
Using the Equation (18) can calculate the nth (n = 1, 2, 3) actual pulse coefficient error E m n of the mth (m = 1, 2, 3, 4) flow rate:
E m n = K m n K K × 100 %
Using the Equation (19) can obtain the average actual pulse coefficient error at the mth (m = 1, 2, 3, 4) flow rate:
E m ¯ = 1 3 n = 1 3 E m n
Using Equation (20) the repeatability ( E r ) m at the mth (m = 1, 2, 3, 4) flow rate can be acquired:
( E r ) m = [ 1 2 n = 1 3 ( E m n E m ¯ ) 2 ] 1 2
The calibration results are enumerated in Table 2. The standard pulse coefficient (also known as the pulse equivalent) of the meter was set to 5 pulse/m3.
It can be seen in Table 2 that the maximum absolute value of the average actual pulse coefficient error is 1.03%, and the maximum repeatability is 0.27% when the flow range is less than or equal 3 m/s (about 21 m3/h); when the flow range is more than 3 m/s, the maximum absolute value of the average actual pulse coefficient error is 0.51%, and the maximum repeatability is 0.18%. Therefore, the measurement accuracy of the ultrasonic gas flowmeter based on the PRCVS meets the requirements of the 1.0-level accuracy according to the Verification Regulation of Ultrasonic Flowmeters.

4.2. Unstable Flow Field Experiment of the Curved Pipe

After the gas passes through the curved pipe, the flow field is no longer stable at the transducer position [29,30]. The ultrasonic signal is disturbed by more acoustic noise. At the same time, the amplitude fluctuation of ultrasonic signal is more frequent at high velocity. Therefore, the stability and validity of the timing method can be explained by its performance. In industrial sites, because of limitations of the installation position (according to the Chinese standard GB 50093-2013 [31], the length of upstream and downstream straight pipe should be at least 10D and 5D), it is unstable in flow fields which leads to the amplitude of ultrasonic signals always fluctuates. As shown in Figure 13, the experiment is carried out by connecting the curved pipe with the DN50 straight pipe on the gas flow standard device. The distance between the flowmeter and curved pipe is 2D.
Contrasted with the ultrasonic signal of stable flow field in straight pipe, the amplitude attenuation of ultrasonic signal in the curved pipe is greater, and the amplitude fluctuation is intensified. The ultrasonic signal amplitude in the same direction (downstream or upstream) also fluctuates violently. As shown in Figure 14 and Figure 15, the downstream and upstream ultrasonic signal waveforms are sampled at the high velocity in the curved pipe. The amplitude of downstream or upstream ultrasonic signals of the first group is larger than that of the second group, and the amplitude fluctuation of the first group of ultrasonic signals is larger than that of the second group. The maximum peaks of downstream and upstream ultrasonic signals of the first group are 700 mV and 500 mV, respectively, and the maximum peaks of downstream and upstream ultrasonic signals of the second group are 500 mV and 600 mV, respectively.
After the gas flow standard device is connected to the curved pipe, the flow rate is changed and set to 10 m3/h, 73 m3/h, and 200 m3/h, respectively. The experiment is carried out at these three flow rates. The experimental results are shown in Table 3. The standard pulse coefficient of the meter was set to 3 pulse/m3.
As shown in Table 3, due to the influence of the curved pipe, compared with the calibration experimental data under the stable flow field environment of straight pipe, the amplitude fluctuation of the ultrasonic signal increases, which affects the accuracy of flow measurement. The average actual coefficient pulse error is larger, and the repeatability of the data is poor. The maximum absolute value of the average actual pulse coefficient error of the method based on PRCVS is 0.83%, and the maximum repeatability is 0.88%.

5. Conclusions

(1)
The aim of this work is to solve the problem of amplitude fluctuation of the ultrasonic signal when it propagates in gas. This paper defines the ratio of adjacent peak amplitude in the ultrasonic signal as the PRCV of the peak by analyzing the mathematical model of ultrasonic signal. When the transducer is unchanged, the PRCV of the ultrasonic signal of any amplitude is only related to the peak serial number.
(2)
This paper proposes the PRCVS method for transit-time ultrasonic gas flowmeter. According to the corresponding relationship between the PRCV and the peak serial number, a set of reference PRCVS is established. By matching the characteristic value of the ultrasonic signal with the reference characteristic value sequence, the peak serial number can be determined.
(3)
In this paper, the PRCVS-based signal processing method is applied to the gas flow measurement system based on TDC that has strict requirements on the peak serial number which can verify the effectiveness of the method. The calibration experiment of basic measurement performance test and the unstable flow field experiment of the curved pipe were performed on the gas flow standard device, which verified the stability and validity of the method proposed in this paper.

Author Contributions

Methodology, B.L. and Y.G.; Writing-Original Draft Preparation, B.L., Y.G., J.C. and Z.Z.; Writing-Review & Editing, Y.G. All authors have read and agreed to the published version of the manuscript.

Funding

This research received no external funding.

Institutional Review Board Statement

Not applicable.

Informed Consent Statement

Not applicable.

Data Availability Statement

Data sharing not applicable. No new data were created or analyzed in this study. Data sharing is not applicable to this article.

Conflicts of Interest

The authors declare no conflict of interest.

References

  1. Wang, S.H.; Garcia, R. Development of a Digital and Battery-Free Smart Flowmeter. Energies 2014, 7, 3695–3709. [Google Scholar] [CrossRef]
  2. Fan, S.J.; Zhuo, Y. A multi-frequency ultrasonic flowmeter applicable to liquid with gas bubbles. In Proceedings of the 2011 IEEE International Instrumentation and Measurement Technology Conference, Binjiang, China, 10–12 May 2011; pp. 1–4. [Google Scholar] [CrossRef]
  3. Jacobson, S. New developments in ultrasonic gas analysis and flowmetering. In Proceedings of the IEEE International Ultrasonics Symposium Proceedings, Beijing, China, 2–5 November 2008; pp. 508–516. [Google Scholar] [CrossRef]
  4. Mylvaganam, K.S. High-rangeability ultrasonic gas flowmeter for monitoring flare gas. IEEE Trans. Ultrason. Ferroelectr. Freq. Control 1989, 36, 144–149. [Google Scholar] [CrossRef] [PubMed]
  5. Folkestad, T.; Mylvaganam, K.S. Chirp excitation of ultrasonic probes and algorithm for filtering transit times in high-rangeability gas flow metering. IEEE Trans. Ultrason. Ferroelectr. Freq. Control 1993, 40, 193–215. [Google Scholar] [CrossRef] [PubMed]
  6. Fang, M.; Xu, K.J.; Zhu, W.J.; Shen, Z.W. Energy transfer model and its applications of ultrasonic gas flow-meter under static and dynamic flow rates. Rev. Sci. Instrum. 2016, 87, 015107. [Google Scholar] [CrossRef]
  7. Sabatini, A.M. A digital-signal-processing technique for ultrasonic signal modeling and classification. IEEE Trans. Instrum. Meas. 2001, 50, 15–21. [Google Scholar] [CrossRef]
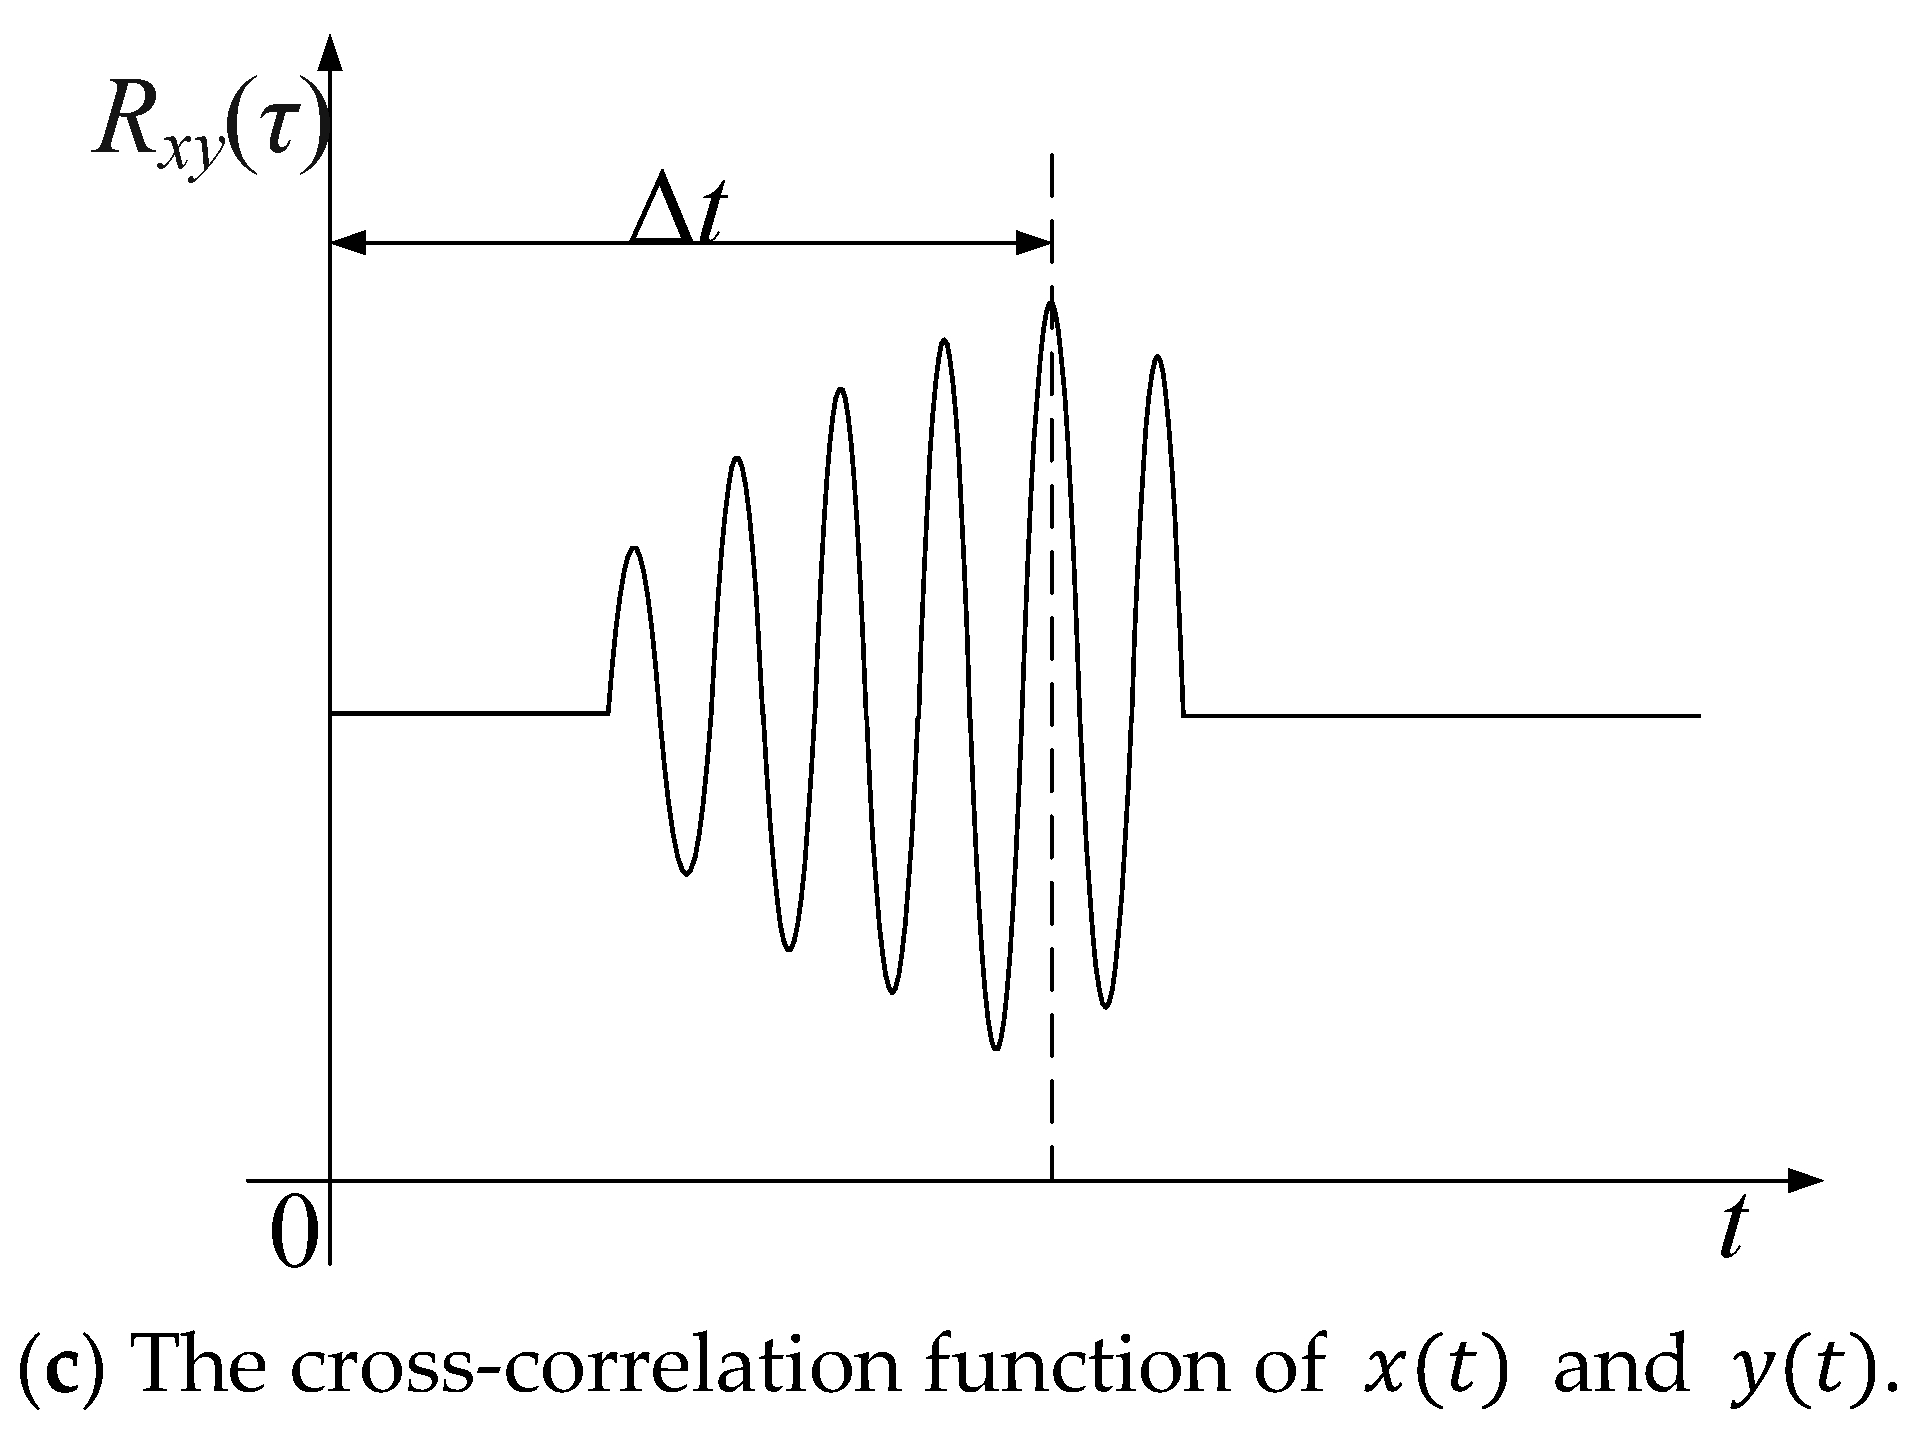
  8. Brassier, P.; Hosten, B.; Vulovic, F. High-frequency transducers and correlation method to enhance ultrasonic gas flow metering. Flow Meas. Instrum. 2001, 12, 201–211. [Google Scholar] [CrossRef]
  9. Calzolai, M.; Capineri, L.; Fort, A.; Masotti, L.; Rocchi, S.; Scabia, M. A 3-D PW ultrasonic Doppler flowmeter: Theory and experimental characterization. IEEE Trans. Ultrason. Ferroelectr. Freq. Control 1999, 46, 108–113. [Google Scholar] [CrossRef]
  10. Worch, A. A clamp-on ultrasonic cross correlation flow meter for one-phase flow. Meas. Sci. Technol. 1999, 9, 622–630. [Google Scholar] [CrossRef]
  11. Lynnworth, L.C.; Liu, Y. Ultrasonic flowmeters: Half-century progress report, 1955–2005. Ultrasonics 2006, 44, e1371–e1378. [Google Scholar] [CrossRef]
  12. Wei, E.Y. Research of Ultrasonic Gas Flowmeter with Signal Track Based on Time-difference Method. Master’s Thesis, Zhejiang University, Zhejiang, China, February 2014. [Google Scholar]
  13. Sugi, T.; Sasaki, T. Ultrasonic Flow Meter. US Patent Specification 7299150B1, 20 November 2007. [Google Scholar]
  14. Ma, Q.Y. Ultrasonic Gas Flowmeter Based on Dynamic Reference Waveform Cross-Correlation Algorithm. In Proceedings of the 2020 39th Chinese Control Conference (CCC), Shenyang, China, 27–29 July 2020; pp. 3066–3070. [Google Scholar] [CrossRef]
  15. Yang, F.L. Development of Smart Ultrasonic Gas Flowmeter. Master’s Thesis, China Jiliang University, Hangzhou, Zhejiang, China, January 2018. [Google Scholar]
  16. Kobayashi, T.; Shigeta, K.; Fujii, T. Transit-Time Difference Type Ultrasonic Flowmeter. US Patent Specification 6647805B2, 18 November 2003. [Google Scholar]
  17. Tian, L.; Xu, K.J.; Mu, L.B.; Liu, B. Energy peak fitting of echo based signal processing method for ultrasonic gas flow meter. Measurement 2018, 117, 41–48. [Google Scholar] [CrossRef]
  18. Liu, B.; Xu, K.J.; Mu, L.B.; Tian, L. Echo energy integral based signal processing method for ultrasonic gas flow meter. Sensor. Actuat. A Phys. 2018, 277, 181–189. [Google Scholar] [CrossRef]
  19. Mu, L.B.; Xu, K.J.; Liu, B.; Tian, L.; Liang, L.P. Echo signal envelope fitting based signal processing methods for ultrasonic gas flow-meter. ISA Trans. 2019, 89, 233–244. [Google Scholar] [CrossRef] [PubMed]
  20. Sun, J.; Lin, W.J.; Zhang, C.Y.; Shen, Z.H.; Zhang, H.L. Time Delay Estimation in the Ultrasonic Flowmeter in the Oil Well. In Proceedings of the International Congress on Ultrasonics, University of Santiago Chile, Santiago, Chile, 11–17 January 2009; pp. 781–788. [Google Scholar] [CrossRef] [Green Version]
  21. Zhu, W.J.; Xu, K.J.; Fang, M.; Shen, Z.W.; Tian, L. Variable ratio threshold and zero-crossing detection based signal processing method for ultrasonic gas flow meter. Measurement 2017, 103, 343–352. [Google Scholar] [CrossRef]
  22. Chen, J.; Chen, S.Y.; Li, B.; Lu, J.W. Research on a transit-time liquid ultrasonic flowmeter under unstable flow fields. Meas. Sci. Technol. 2019, 30, 55902. [Google Scholar] [CrossRef]
  23. Parrilla, M.; Anaya, J.J.; Fritsch, C. Digital signal processing techniques for high accuracy ultrasonic range measurements. IEEE Trans. Instrum. Meas. 1991, 40, 759–763. [Google Scholar] [CrossRef]
  24. Sabatini, A.M. Correlation receivers using Laguerre filter banks for modelling narrowband ultrasonic echoes and estimating their time-of-flights. IEEE Trans. Ultrason. Ferroelectr. Freq. Control 1997, 44, 1253–1263. [Google Scholar] [CrossRef]
  25. Andria, G.; Attivissimo, F.; Giaquinto, N. Digital signal processing techniques for accurate ultrasonic sensor measurement. Measurement 2001, 30, 105–114. [Google Scholar] [CrossRef]
  26. Angrisani, L.; Baccigalupi, A.; Lo Moriello, R.S. Ultrasonic time-of-flight estimation through unscented Kalman filter. IEEE Trans. Instrum. Meas. 2006, 1077–1084. [Google Scholar] [CrossRef]
  27. Lin, M.L.; Yin, B.Z.; Liu, Z.Y. Digital Interpolation Theory and Sinc Interpolation Algorithm on High-speed Sampling Signals. Acta Electron. Sin. 2000, 12, 8–10. [Google Scholar]
  28. JJG 1030-2007. Verification Regulation of Ultrasonic Flowmeters, General Administration of Quality Supervision, Inspection and Quarantine of China. Available online: https://wenku.baidu.com/view/2f9a699189eb172dec63b702.html (accessed on 18 July 2014).
  29. Enayet, M.M.; Gibson, M.M.; Taylor, A.; Yianneskis, M. Laser-Doppler measurements of laminar and turbulent flow in a pipe bend. Int. J. Heat Fluid Flow 1982, 3, 213–219. [Google Scholar] [CrossRef] [Green Version]
  30. Carlander, C.; Delsing, J. Installation effects on an ultrasonic flow meter with implications for self diagnostics. Flow Meas. Instrum. 2000, 11, 109–122. [Google Scholar] [CrossRef] [Green Version]
  31. GB 50093–2013. Code for Construnction and Quality Acceptance of Automation Instrumentation Engineering, General Administration of Quality Supervision, Inspection and Quarantine of China. Available online: https://www.doc88.com/p-0743846824924.html (accessed on 27 March 2019).
Figure 1. The principle of the cross-correlation method.
Energies 14 00426 g001aEnergies 14 00426 g001b
Figure 2. The simulation of the energy peak fitting method.
Energies 14 00426 g002
Figure 3. The timing principle of the threshold comparison method (rising edge trigger).
Energies 14 00426 g003
Figure 4. Simulation waveform of ultrasonic signal.
Energies 14 00426 g004
Figure 5. The rate of change of the value of the peak ratio characteristic value (PRCV).
Energies 14 00426 g005
Figure 6. The value of the PRCV at different flow rates in the gas ultrasonic signal.
Energies 14 00426 g006
Figure 7. The ultrasonic signal curves before and after interpolation.
Energies 14 00426 g007
Figure 8. Diagram of the hardware of the ultrasonic flowmeter.
Energies 14 00426 g008
Figure 9. The PRCV of the trigger wave and the wave at the dual-edge timing point.
Energies 14 00426 g009
Figure 10. The dual-edge timing module.
Energies 14 00426 g010
Figure 11. Flowchart of the software of signal processing.
Energies 14 00426 g011
Figure 12. The calibration experiment site.
Energies 14 00426 g012
Figure 13. The site of the unstable flow field experiment of the curved pipe.
Energies 14 00426 g013
Figure 14. The downstream and upstream waveforms at 200 m3/h of DN50 curved pipe, Ⅰ.
Energies 14 00426 g014
Figure 15. The downstream and upstream waveforms at 200 m3/h of DN50 curved pipe, Ⅱ.
Energies 14 00426 g015
Table 1. Numerical comparison of the value of the PRCV under different flow rates.
Flow Rate
(m3/h)
The Value of the PRCV
Peak 2Peak 3Peak 4Peak 5Peak 6Peak 7Peak 8Peak 9Peak 10
00.4090.5680.6890.7880.8630.9050.9130.9220.926
700.4220.5610.6830.7740.8510.8950.9170.9200.929
2000.4340.5960.7040.7910.8690.9020.9180.9230.928
Table 2. Calibration results.
Flow Rate (m3/h)Actual Pulse Coefficient (1 /m3)Average Actual Pulse Coefficient (1 /m3)Average Actual Coefficient Error (%)Repeatability (%)
105.01335.0069+0.140.14
4.9994
5.0079
205.03915.0517+1.030.27
5.0496
5.0663
794.97774.9770−0.460.11
4.9713
4.9820
2024.96644.9744−0.510.18
4.9838
4.9729
Table 3. Experimental results of unstable flow field experiment of the DN50 curved pipe.
Flow Rate (m3/h)Actual Pulse Coefficient (1/m3)Average Actual Pulse Coefficient (1/m3)Average Actual Coefficient Error (%)Repeatability (%)
103.00913.0250+0.830.47
3.0296
3.0363
732.97622.9811−0.630.88
3.0096
2.9575
2002.96002.9755−0.810.57
2.9938
2.9729
Publisher’s Note: MDPI stays neutral with regard to jurisdictional claims in published maps and institutional affiliations.

