Article

Comparison of Two Power Converter Topologies in Wind Turbine System

Faculty of Electrical Engineering, Bialystok University of Technology, Wiejska 45D, 15-351 Bialystok, Poland
*
Author to whom correspondence should be addressed.
Energies 2021, 14(20), 6574; https://doi.org/10.3390/en14206574
Submission received: 6 September 2021 / Revised: 29 September 2021 / Accepted: 10 October 2021 / Published: 13 October 2021
(This article belongs to the Special Issue Power Electronics in Renewable, Storage, and Charging Systems)

Abstract

:
The article presents comprehensive results of research on two representative topologies of converters used in the path of processing energy generated in a wind turbine and transmitted to the grid. The topology T1 uses a two-level transistor-controlled rectifier as a converter from the generator side, while the T2 topology uses DC/DC boost converter. In both topologies, a three-level back-to-back converter with a line filter L was used as a grid converter. The conclusions indicate the tendency of changes in power losses depending on the aforementioned parameters and can be used at the stage of deciding on the choice of topology, operating parameters or selection of control methods depending on the specific operating conditions of the wind turbine.

1. Introduction

There are several ways to convert the energy generated in a wind turbine and then transfer it to the electrical grid. A converter connected to a three-phase generator that converts energy from a three-phase AC system to DC can be implemented in many configurations [1,2,3,4,5]: rectifier [6,7,8], switch-mode rectifier [9], DC/DC converter [10,11] and inverter [12,13,14,15,16,17,18,19]. Transfer of energy to the grid is usually done with the use of a grid converter in the form of a one- or three-phase grid-connected voltage source converter (VSC) [20] including multilevel converter [8,21].
The turbine generator and the back-to-back converter that works with it should be able, first and foremost, to increase the efficiency of energy conversion and to extend the speed range of the generator in the range of low speeds at which electricity is still produced. The generator, in turn, should be able to cooperate with the wind turbine without the use of a mechanical gearbox [22,23] which significantly reduces the efficiency of the system. In view of this, multipole synchronous generators with permanent magnets are becoming unbeatable in comparison with squirrel cage (IG) [24] or double fed induction generators [24,25,26].
For low and medium power ranges, the predominant solution on the side of the generator is the use of a diode rectifier [8] and a grid converter fully controlled VSC from the grid side. Such a topology has one fundamental flaw, i.e., it limits the range of applications at low speeds due to too low a voltage on the DC bus. In order to eliminate this flaw, the solution are used that extend the work range by adding an additional DC/DC converter which increases the DC voltage [25]. An alternative to this solution is a fully controlled transistor converter on the side of the generator [27,28].
The paper considers two extreme topologies of the generator converter i.e., with a DC/AC converter operating with the transfer of energy from the AC circuit (generator) towards the DC link and with a three-phase diode rectifier and a boost converter. The basic requirement for energy conversion is efficiency with minimal losses in the converter and generator. Losses in the generator depend, inter alia, on the shape of the input current and its THD in the low- and high-frequency ranges. Structures with a diode rectifier do not require information about the position of the rotor, which is their advantage over those with a controlled drive converter. Practically, to convert DC voltage into AC voltage and transfer energy to the grid, there is no alternative to an AC/DC converter operating in inverter mode.
The paper is organised as follows: in Section 2, compared power converters topology is overviewed. The control structures of the converters are discussed in Section 3. The laboratory test stand and experimental results are discussed in Section 4. Finally, conclusions are summarized in Section 5.

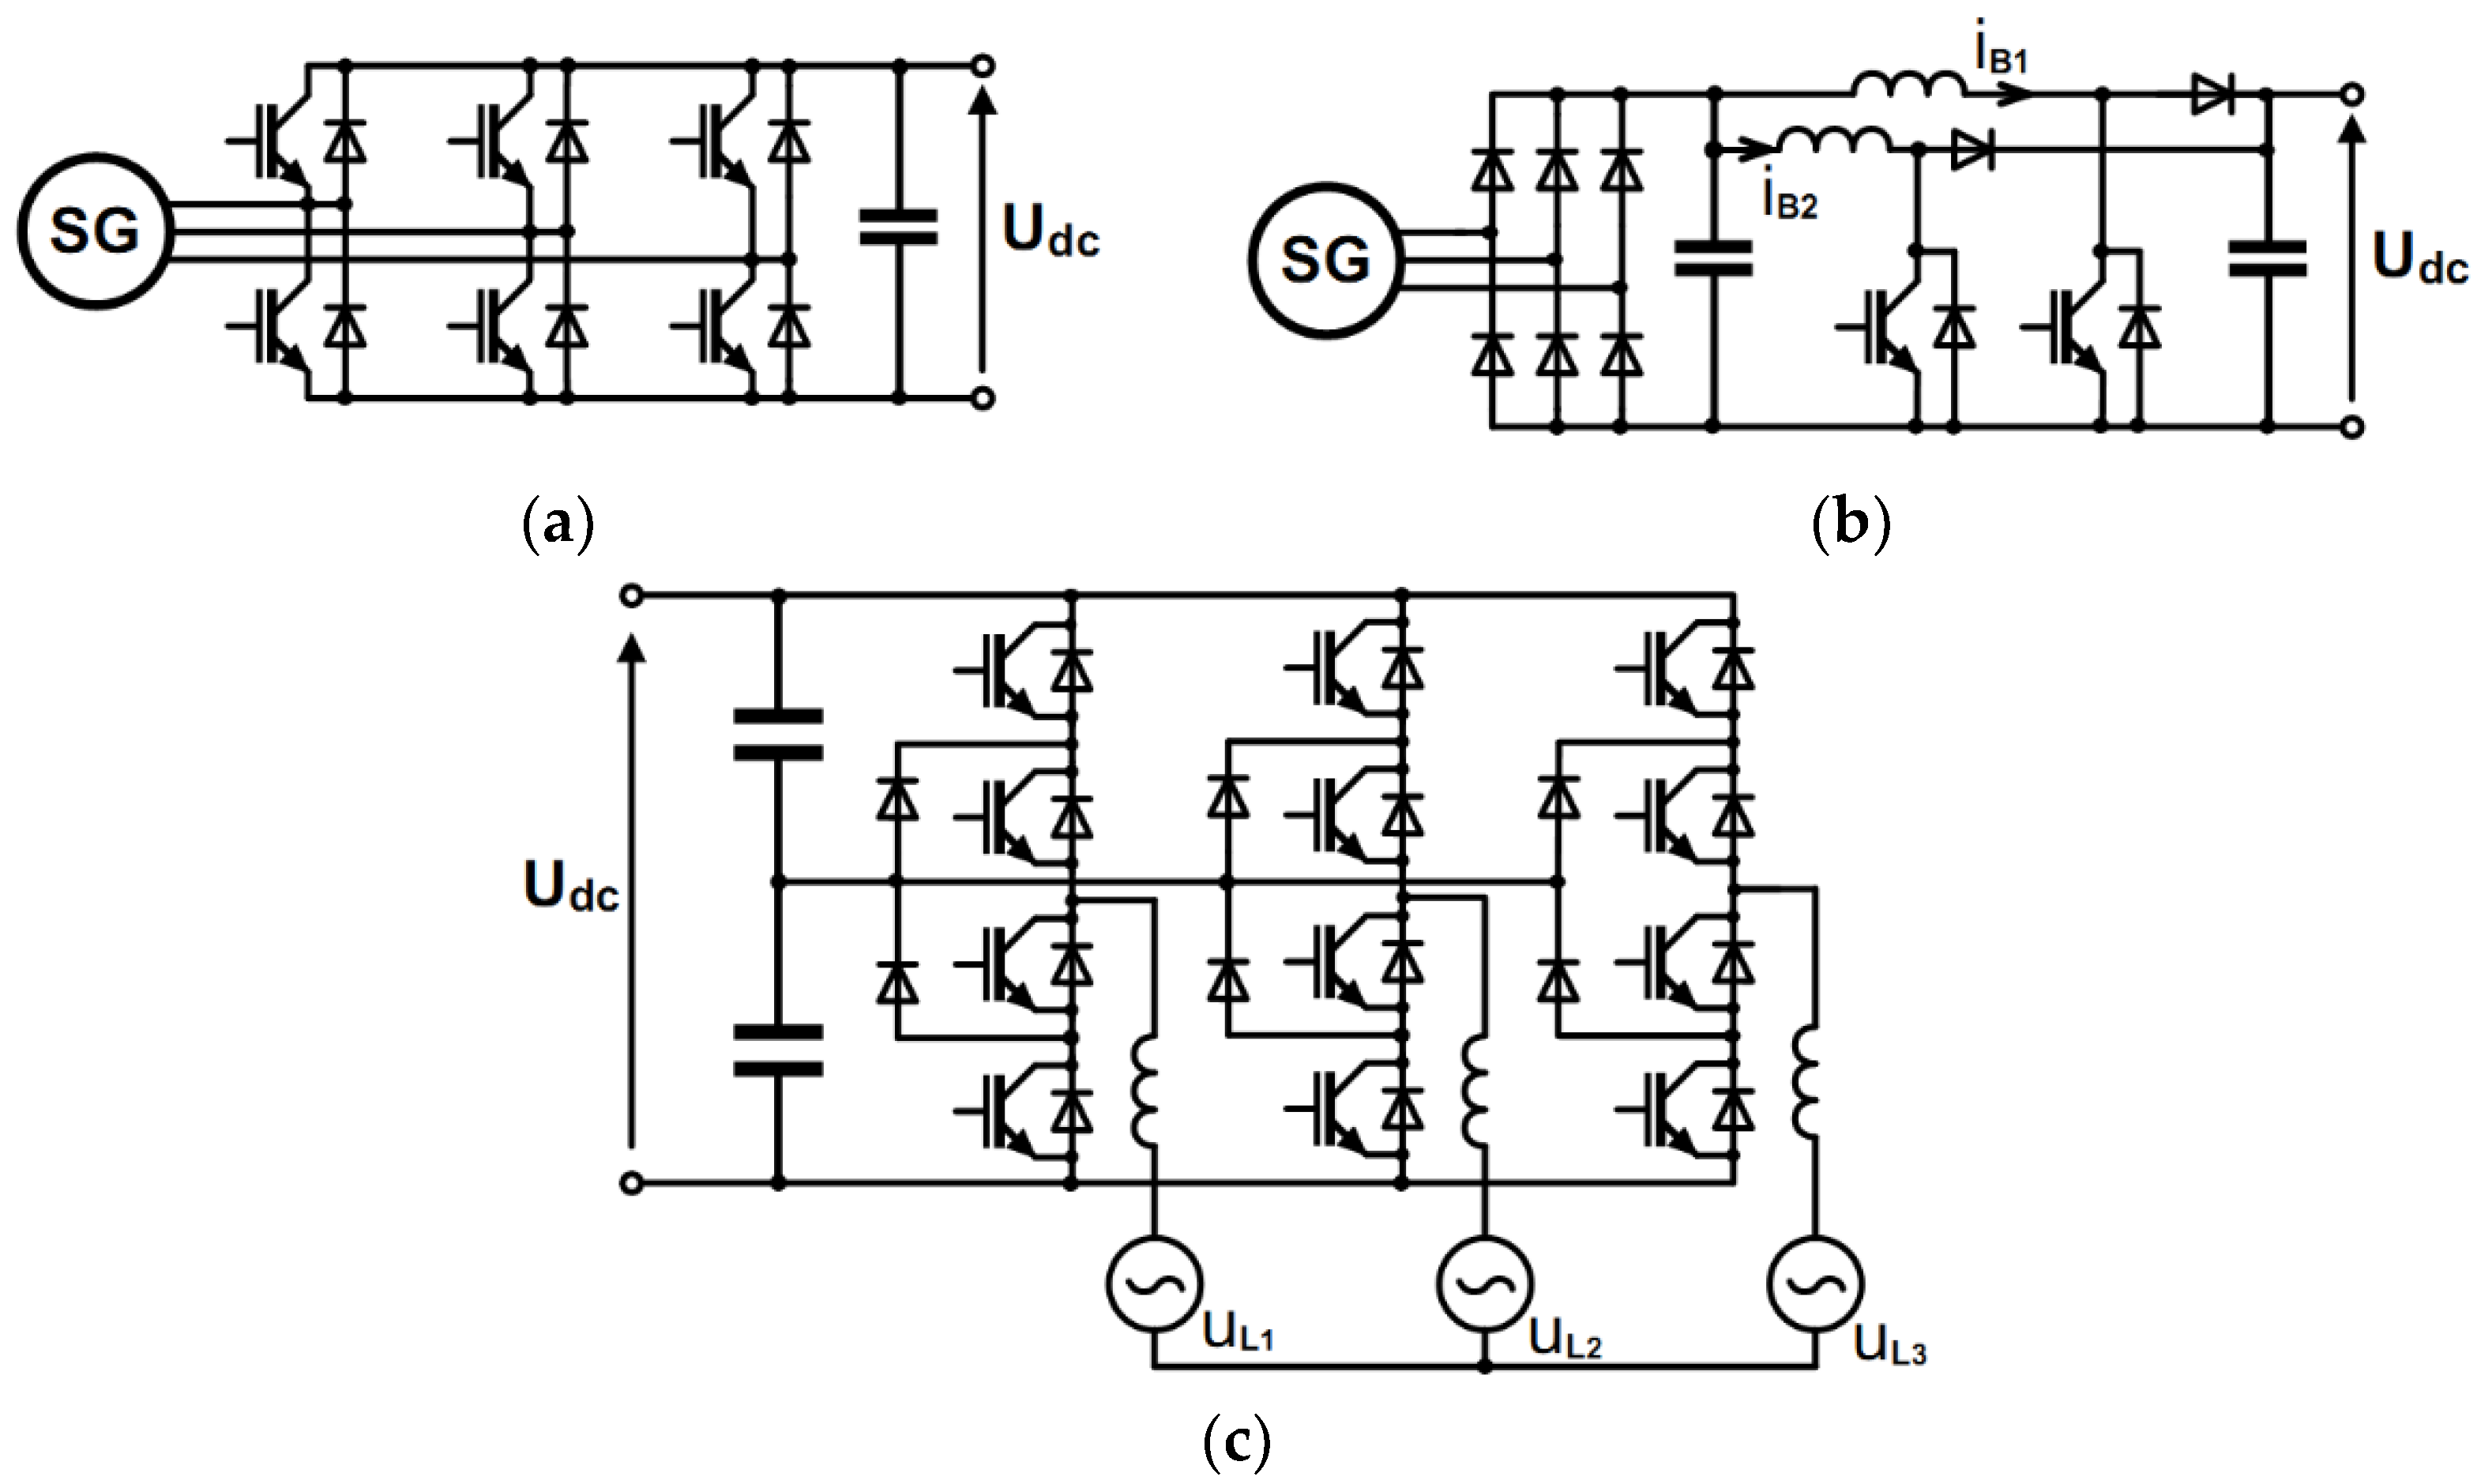
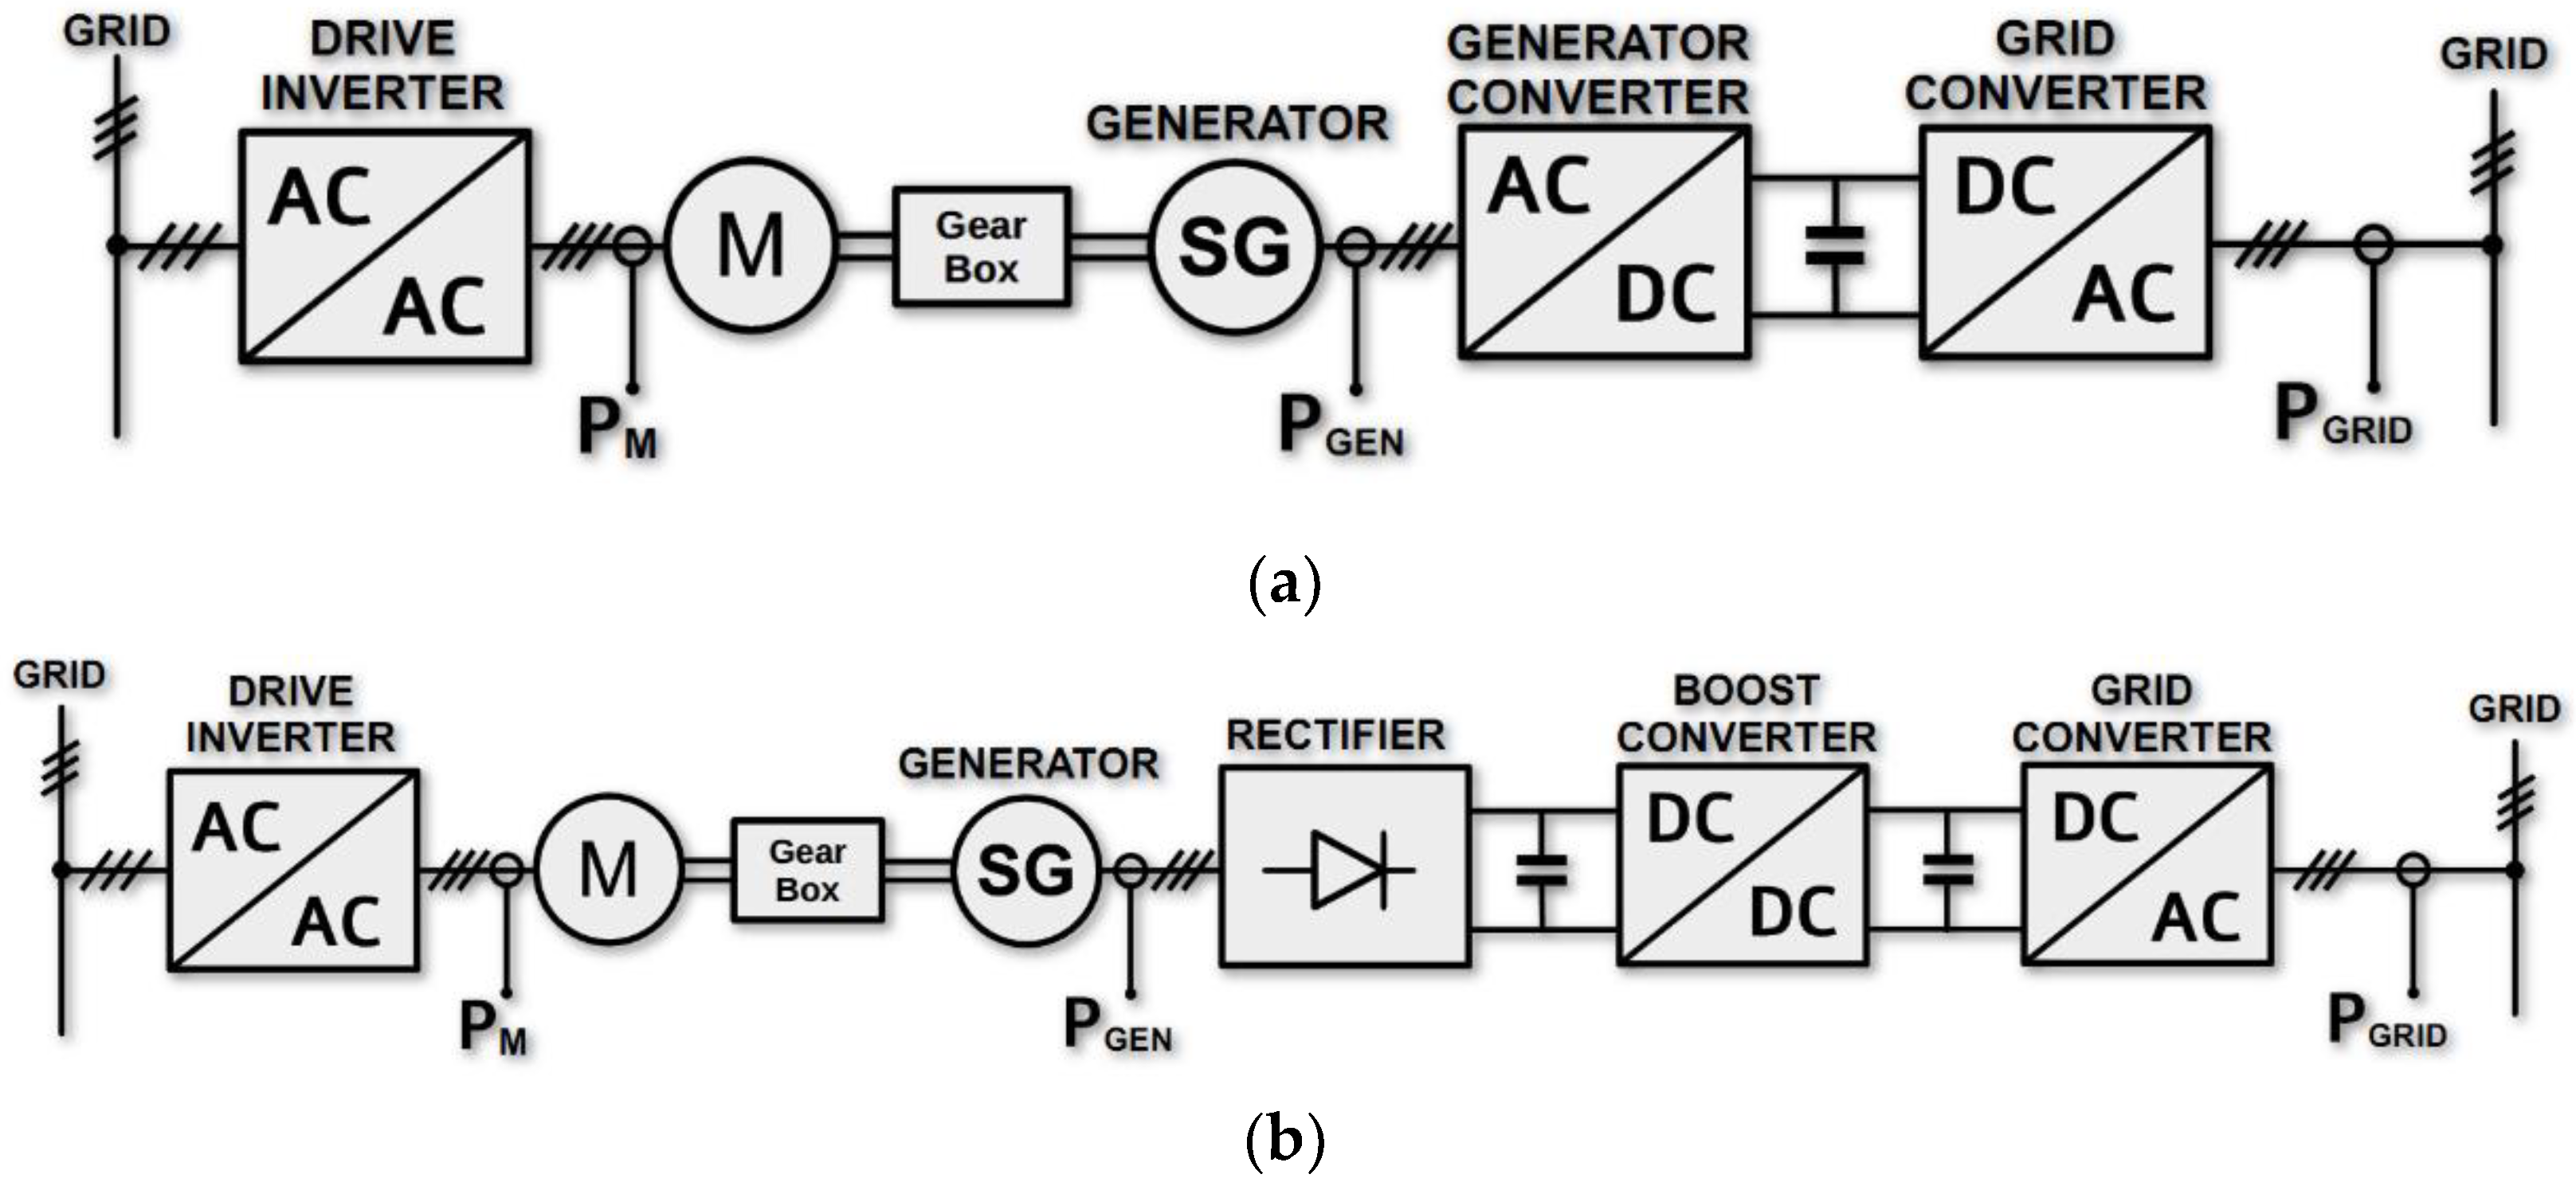
2. Generator and Grid Converter

The features of conversion of energy generated by wind turbines in power converters are:
-
efficiency of the grid converter;
-
efficiency of the generator converter;
-
efficiency of energy conversion in the generator.
The efficiency of energy conversion in the converter depends, inter alia, on the topology of the converter (two- or multi-level), the technology of semiconductors (Si, SiC, GaN), control methods. However, one common feature is the dependence on the voltage in the DC circuit.
The first topology that was considered was that of the two-level generator connected VSC with two different sampling frequencies (20 kHz and 40 kHz) shown in Figure 1a. The second topology was a generator connected DC/DC boost converter from which the DC voltage was increased in the DC/DC converter to the voltage level required in the DC link. The DC/DC converter worked in the interleaved (multiphase) boost converter (two parallel branches) (Figure 1b). In both cases the grid connected converter was realized using a three-level neutral point clamped (NPC) VSC (Figure 1c). This configuration allows one to reduce the parameters of the grid inductance and the THD of the current fed to the grid.

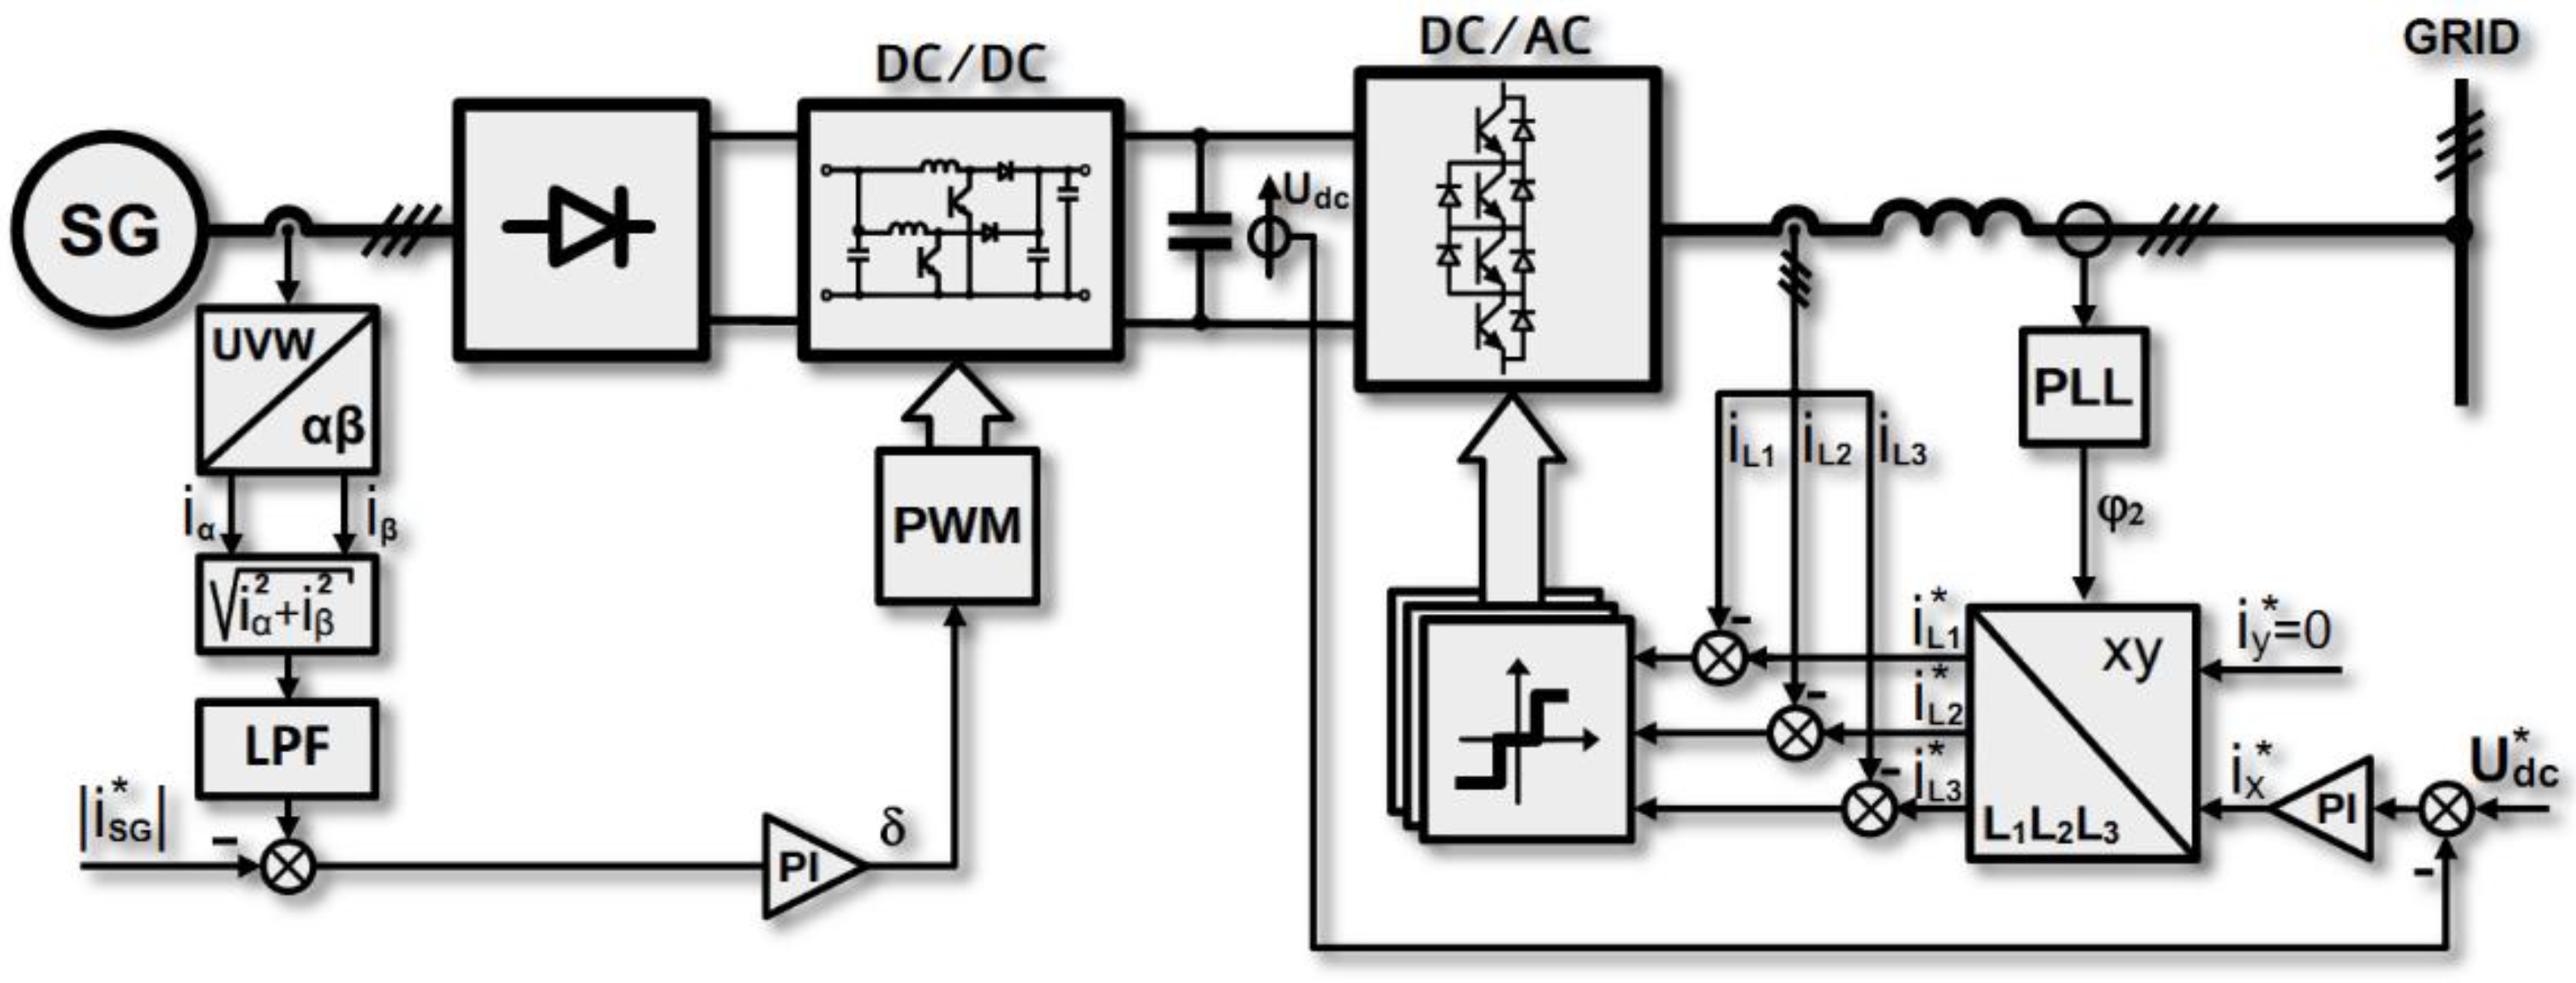
3. Control of Converters
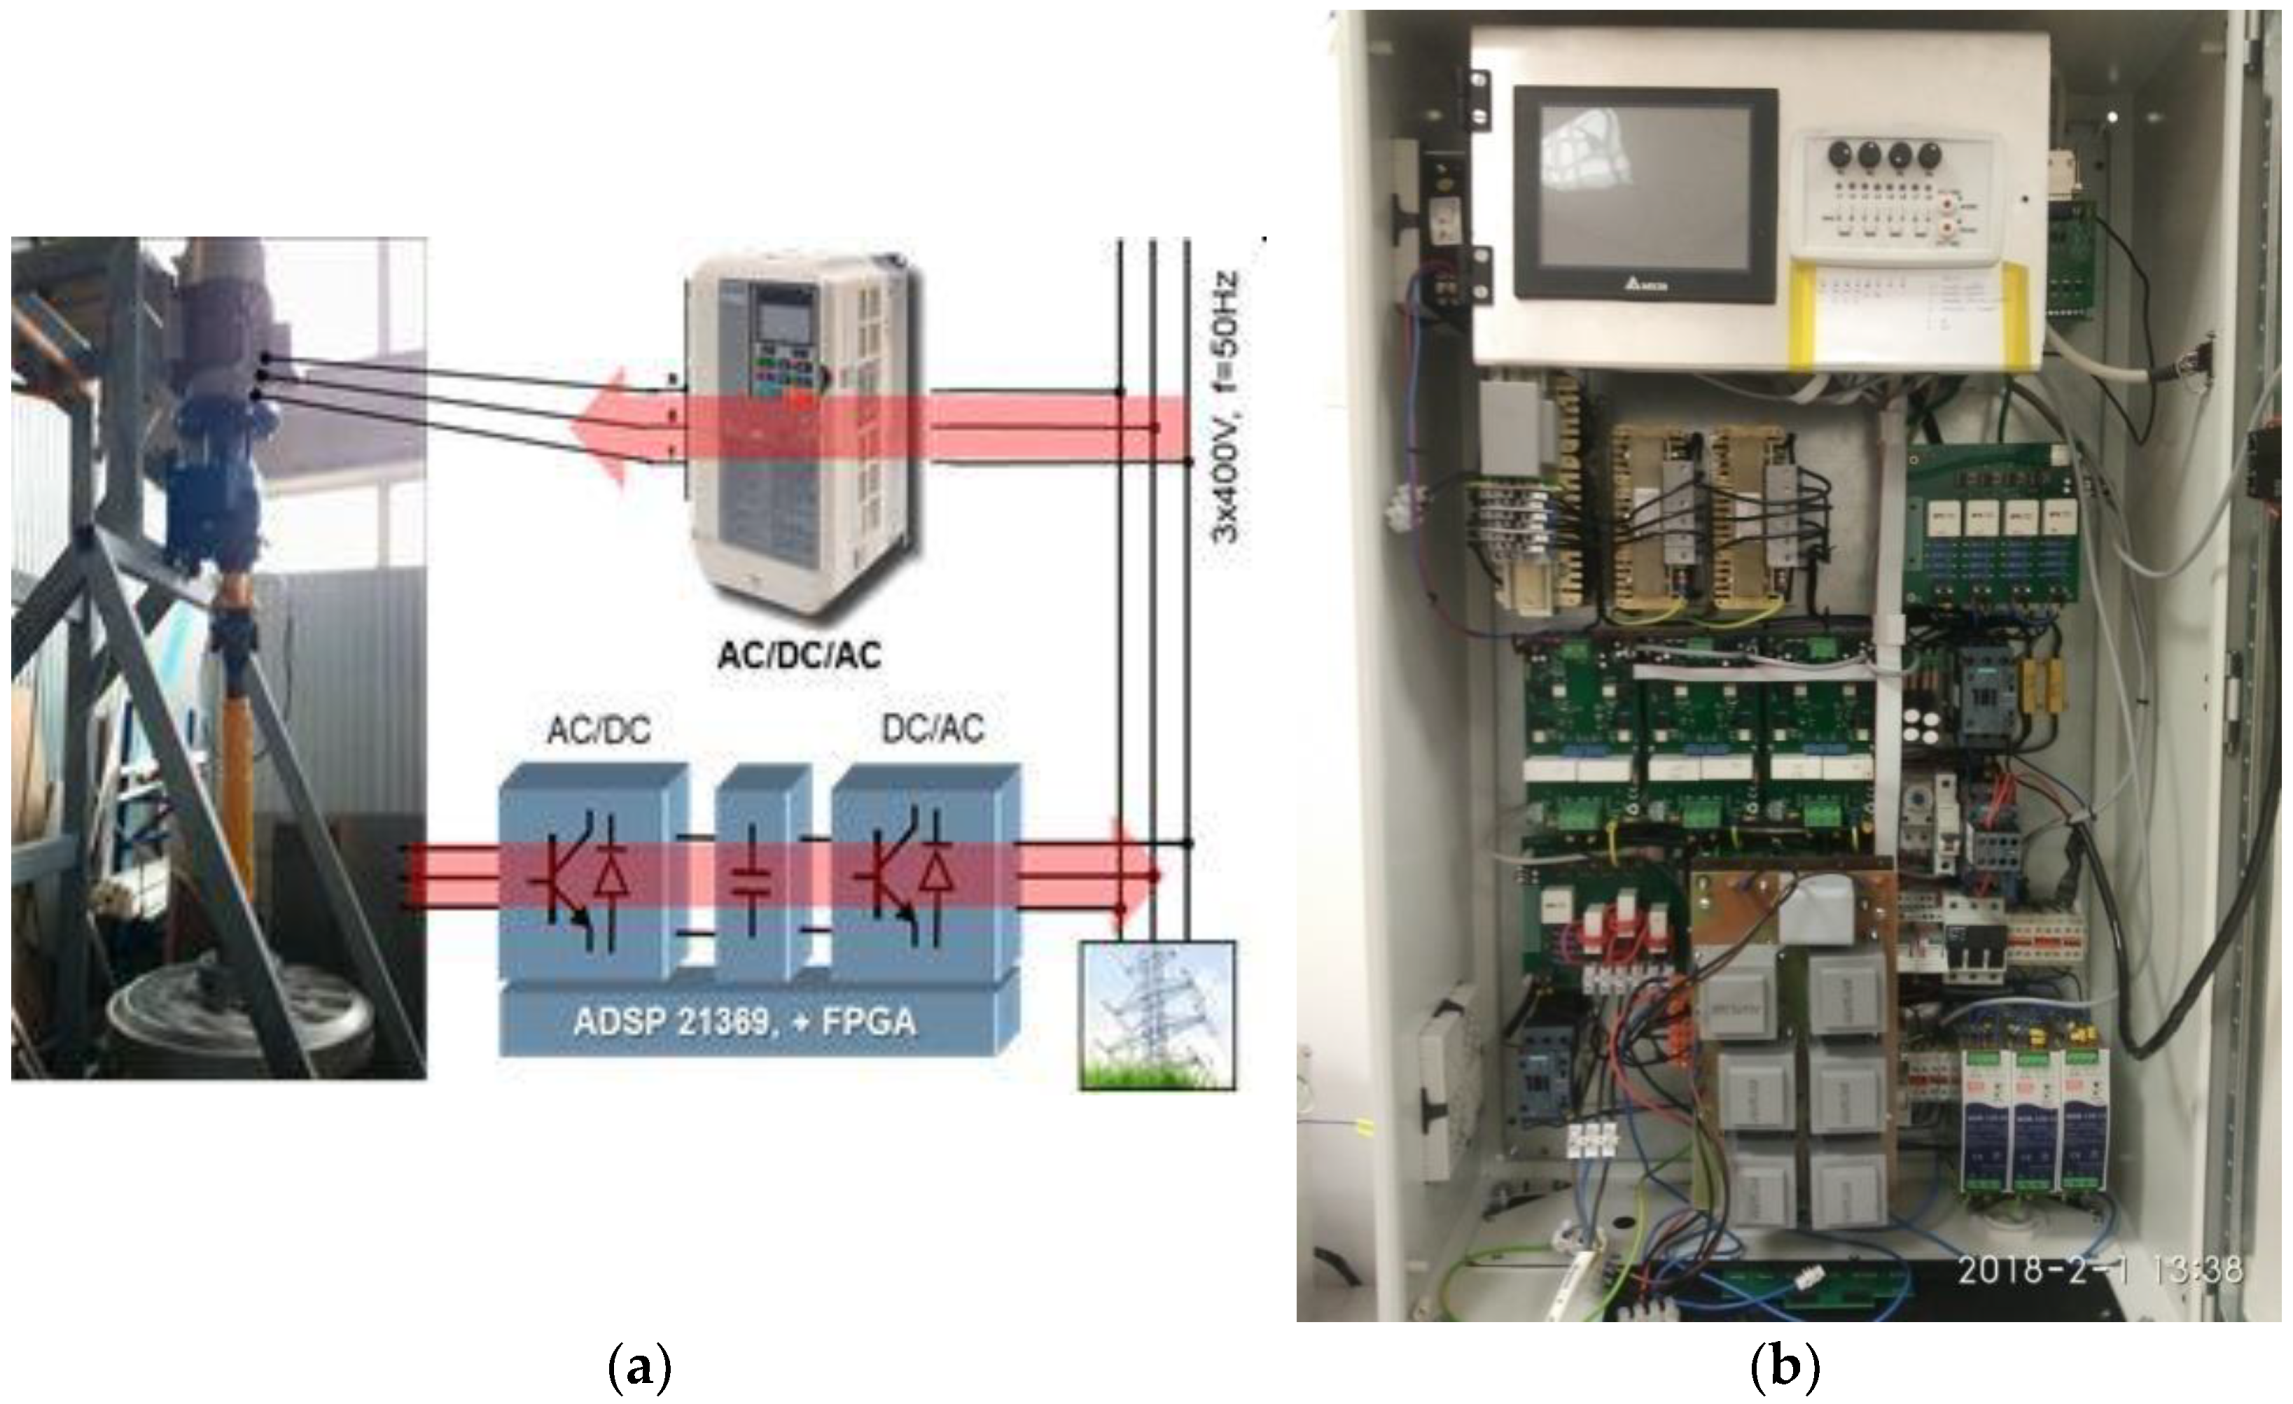
The control structure of the converter with topology T1 is shown in Figure 2. The generator connected VSC is controlled by means of field-oriented control (FOC) [29]. For testing purposes, the PMSM machine is controlled by regulation of two components in the rotating reference frame dq: i*sd—proportional to the machine rated flux (in the PMSM machine i*sd = 0) and i*sq—proportional to the machine torque. The internal loop of current regulation in a three-phase system was realized in the form of a simple non-linear current regulator of the type Δ [30,31,32]. The regulator realizes the set 3 sinusoidal currents i*uvw in a three-phase structure. Current deviation on a comparator without hysteresis, whose state is sampled every Ts and saved in the sampling and hold (S&H) system. The comparison level is shifted by the value of h, which allows the use of zero voltage vectors of the converter. Although the sampling frequency fs of the regulator is constant (20 kHz or 40 kHz), the average switching frequency of the generator converter is variable and depends on the angular velocity of the generator and the amplitude of its current and the voltage Udc. The switching frequency of the converter is defined as the average value of the sum of switching on and off of all transistors of the converter in 1 s.
The control structure of the boost converter of the topology T2 is shown in Figure 3. In the control system, the amplitude of the generator current i*SG is regulated. The actual amplitude of the current is plotted on the basis of the components iα and iβ of the generator current after filtering in the low pass filter (LFP). The deviation of the regulator determines the duty factor δ which in the PWM block determines the width of pulse controlling the transistors of the two branches of the boost converter (shifted relative to each other by half a period to reduce current ripples in the DC circuit).
In both topologies, the grid converter was implemented in the form of a three-level NPC converter. The converter should only supply active power to the grid and maintain a set constant voltage Udc in the DC link. The master control system was managed by the voltage-oriented control (VOC), where the current component ix is proportional to the active power, and the component iy corresponds to the reactive power. The tested control system adopted a reactive power equal to zero (iy = 0), which means that the current supplied to the grid is in the opposite phase to the grid voltage. After transformation to a three-phase coordinate system, the set three-phase currents (i*L1, i*L2, i*L3) are formed as in the generator converter using a nonlinear three-level Δ type regulator.
Two forms of energy conversion were considered (Figure 4). The laboratory test stand is shown in Figure 5. In the topology T1, the voltages generated in the low-speed three-phase synchronous generator (SG) were rectified in a bridge diode rectifier. DC voltage was then increased in the DC/DC converter and finally converted to AC voltage in a grid converter operating in an inverter mode, by means of which energy flows into the grid. The second way of energy conversion was to use a drive converter to take energy from the generator and transfer it to the DC link. Then, as in the first case, the energy was transferred to the grid using a grid converter. The wind turbine was simulated by an inductive drive motor powered by a regulated voltage source (drive converter) coupled to the generator by means of a mechanical gearbox. The drive system allowed the generator speed to be adjusted from 0 to 110 rpm. Power was measured at the points where it was possible in a three-phase system, i.e., in the three places shown in Figure 4: on the power supply of the motor driving the generator PM, on the output of the generator PGEN and on the input to the grid PGRID. Power measurements PGEN and PGRID allow to determine the efficiency of both converters (topology T1 and T2), while power measurements PGEN and PM indirectly allow the efficiency of the generator to be determined using a selected method of energy conversion.

4. Laboratory Tests

The laboratory test stand is shown in Figure 5. The synchronous generator with the parameters shown in Table 1 (which describes the stand) is driven through a mechanical gearbox by a squirrel-cage induction motor fed from a Yaskawa matrix converter. The motor can regulate the speed of the generator in the range of 0–1.1 nN.
The grid-connected VSC was built with three half-bridge IGBT modules—F3L50R06W1E3_B11 from Infineon. The generator connected VSC and the generator connected DC/DC boost converter was built using a power-integrated module (PIM)—MMG75W120XB6TN from Macmic based on IGBT technology. A control platform F3L50R06W1E3_B11 with a digital signal processor—ADSP-21369 from Analog Devices and an FPGA chip was used to control the tested topologies.

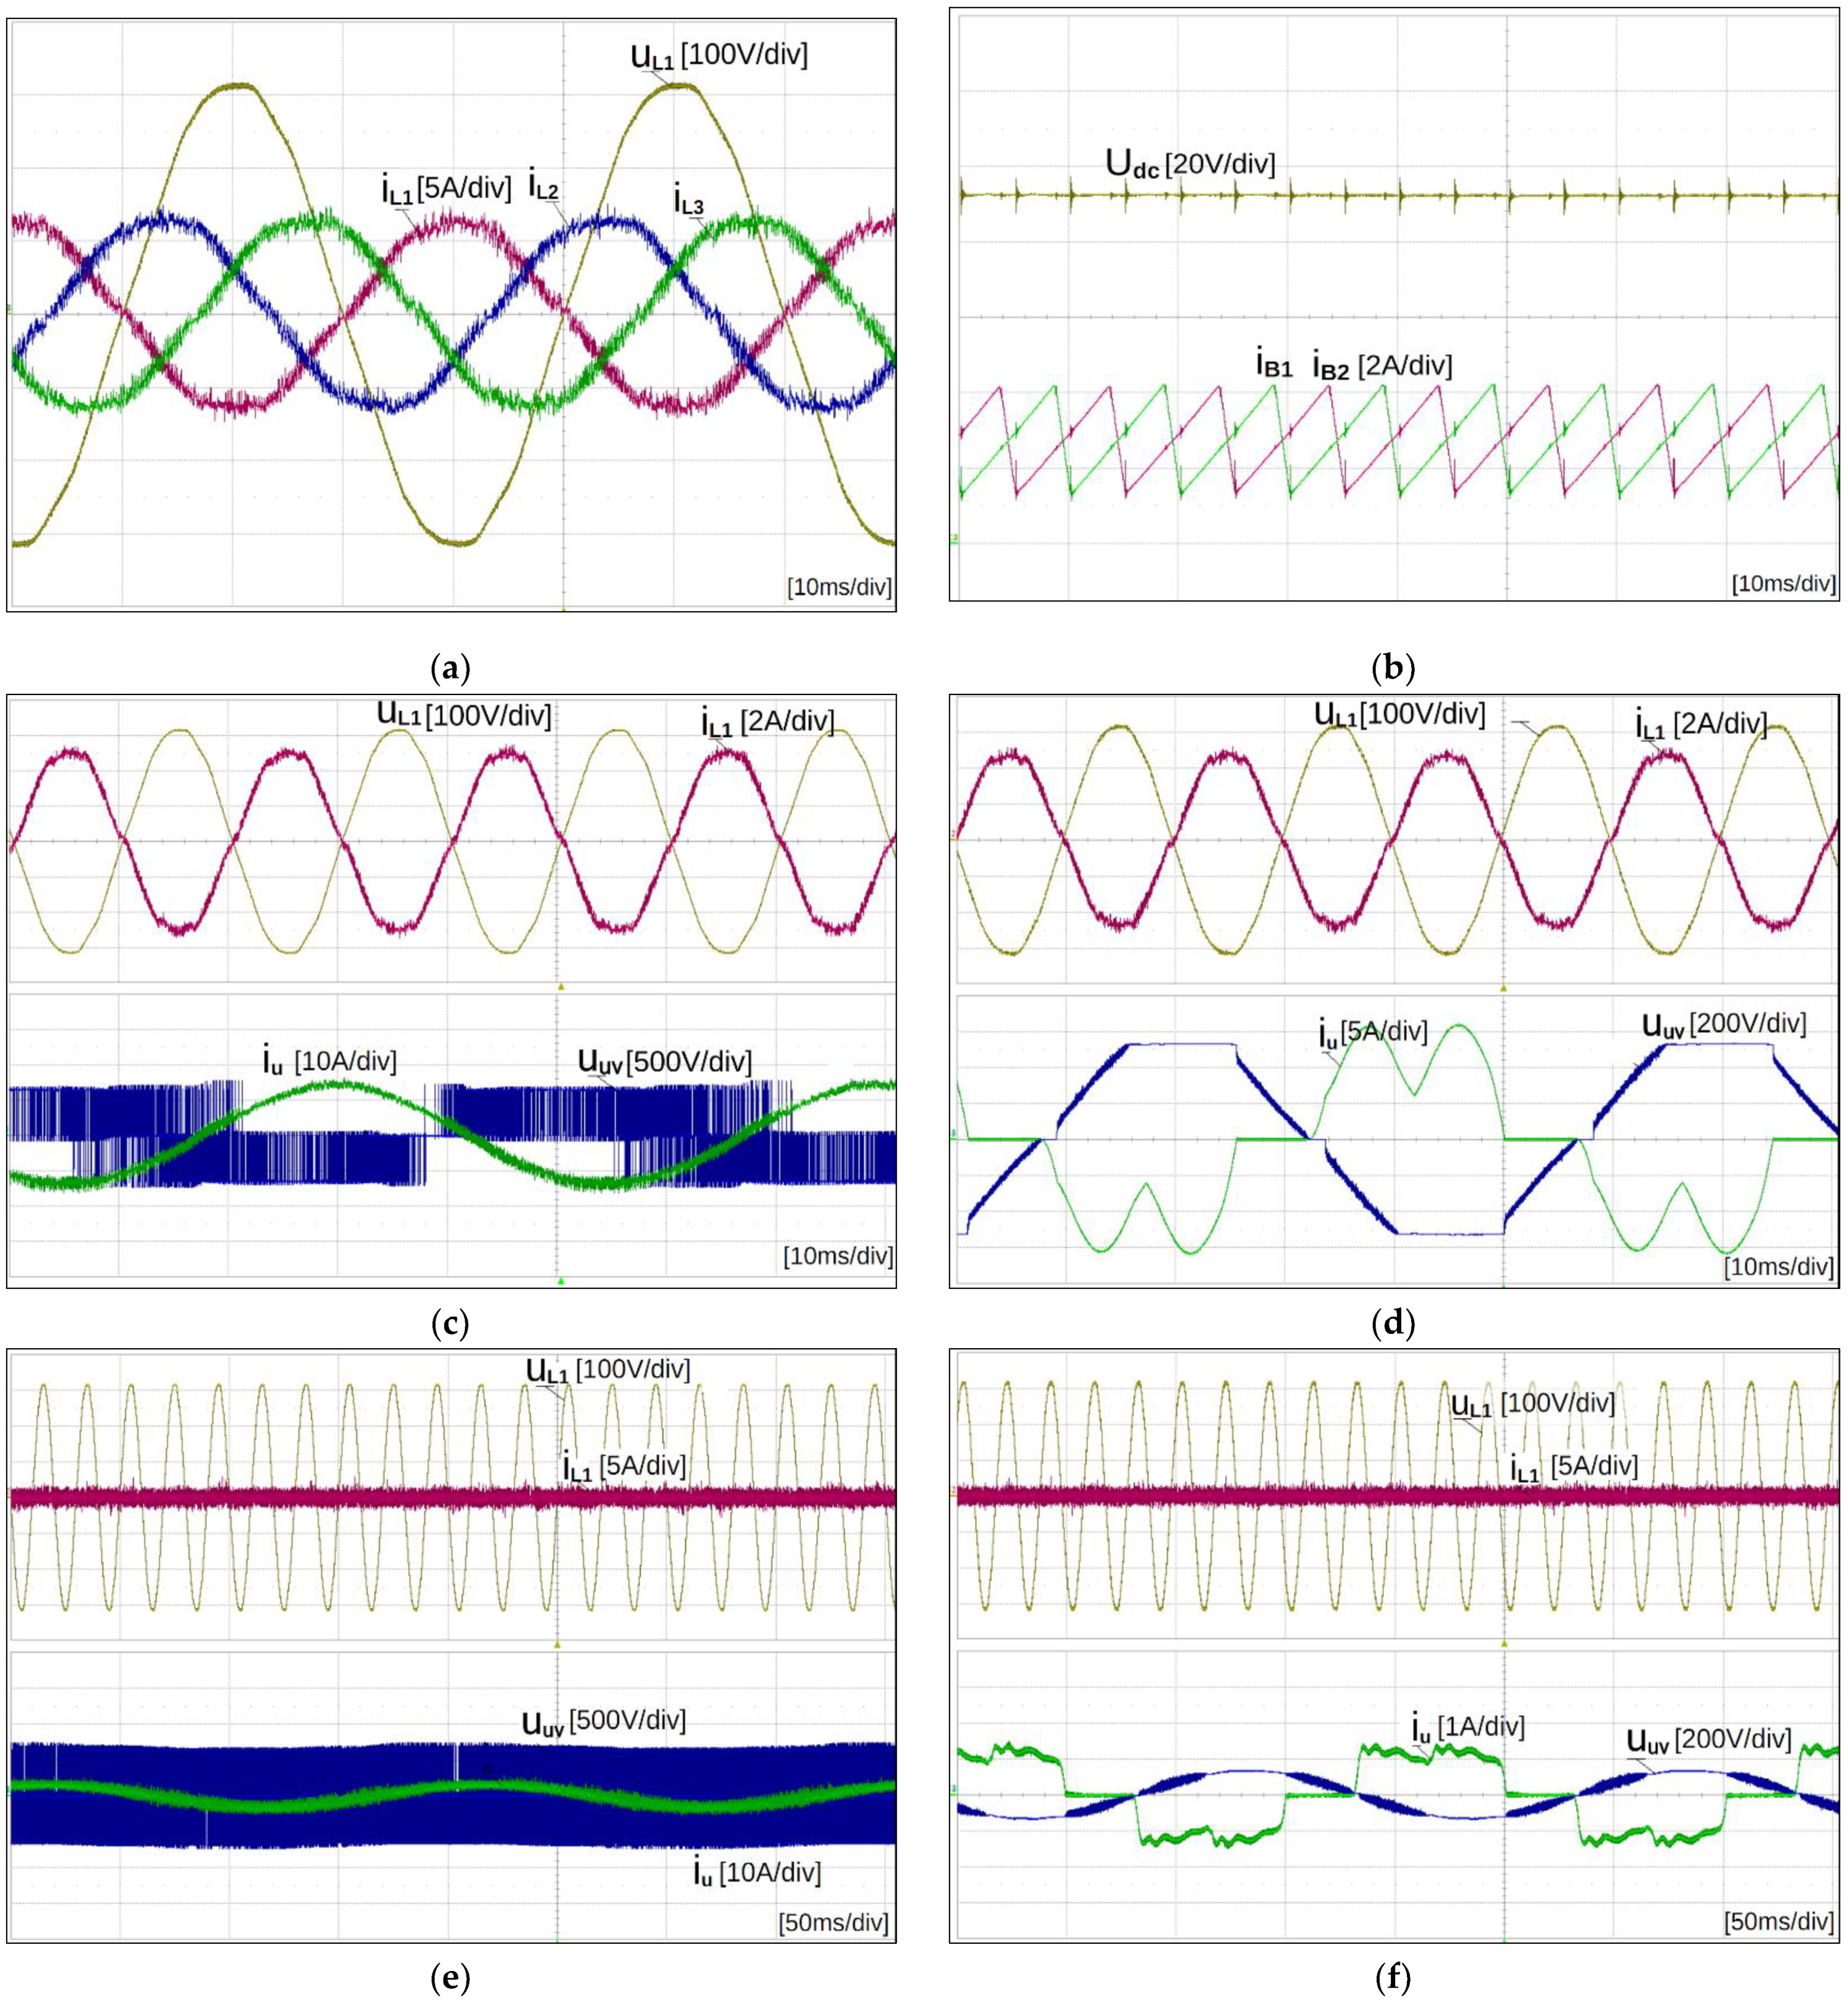
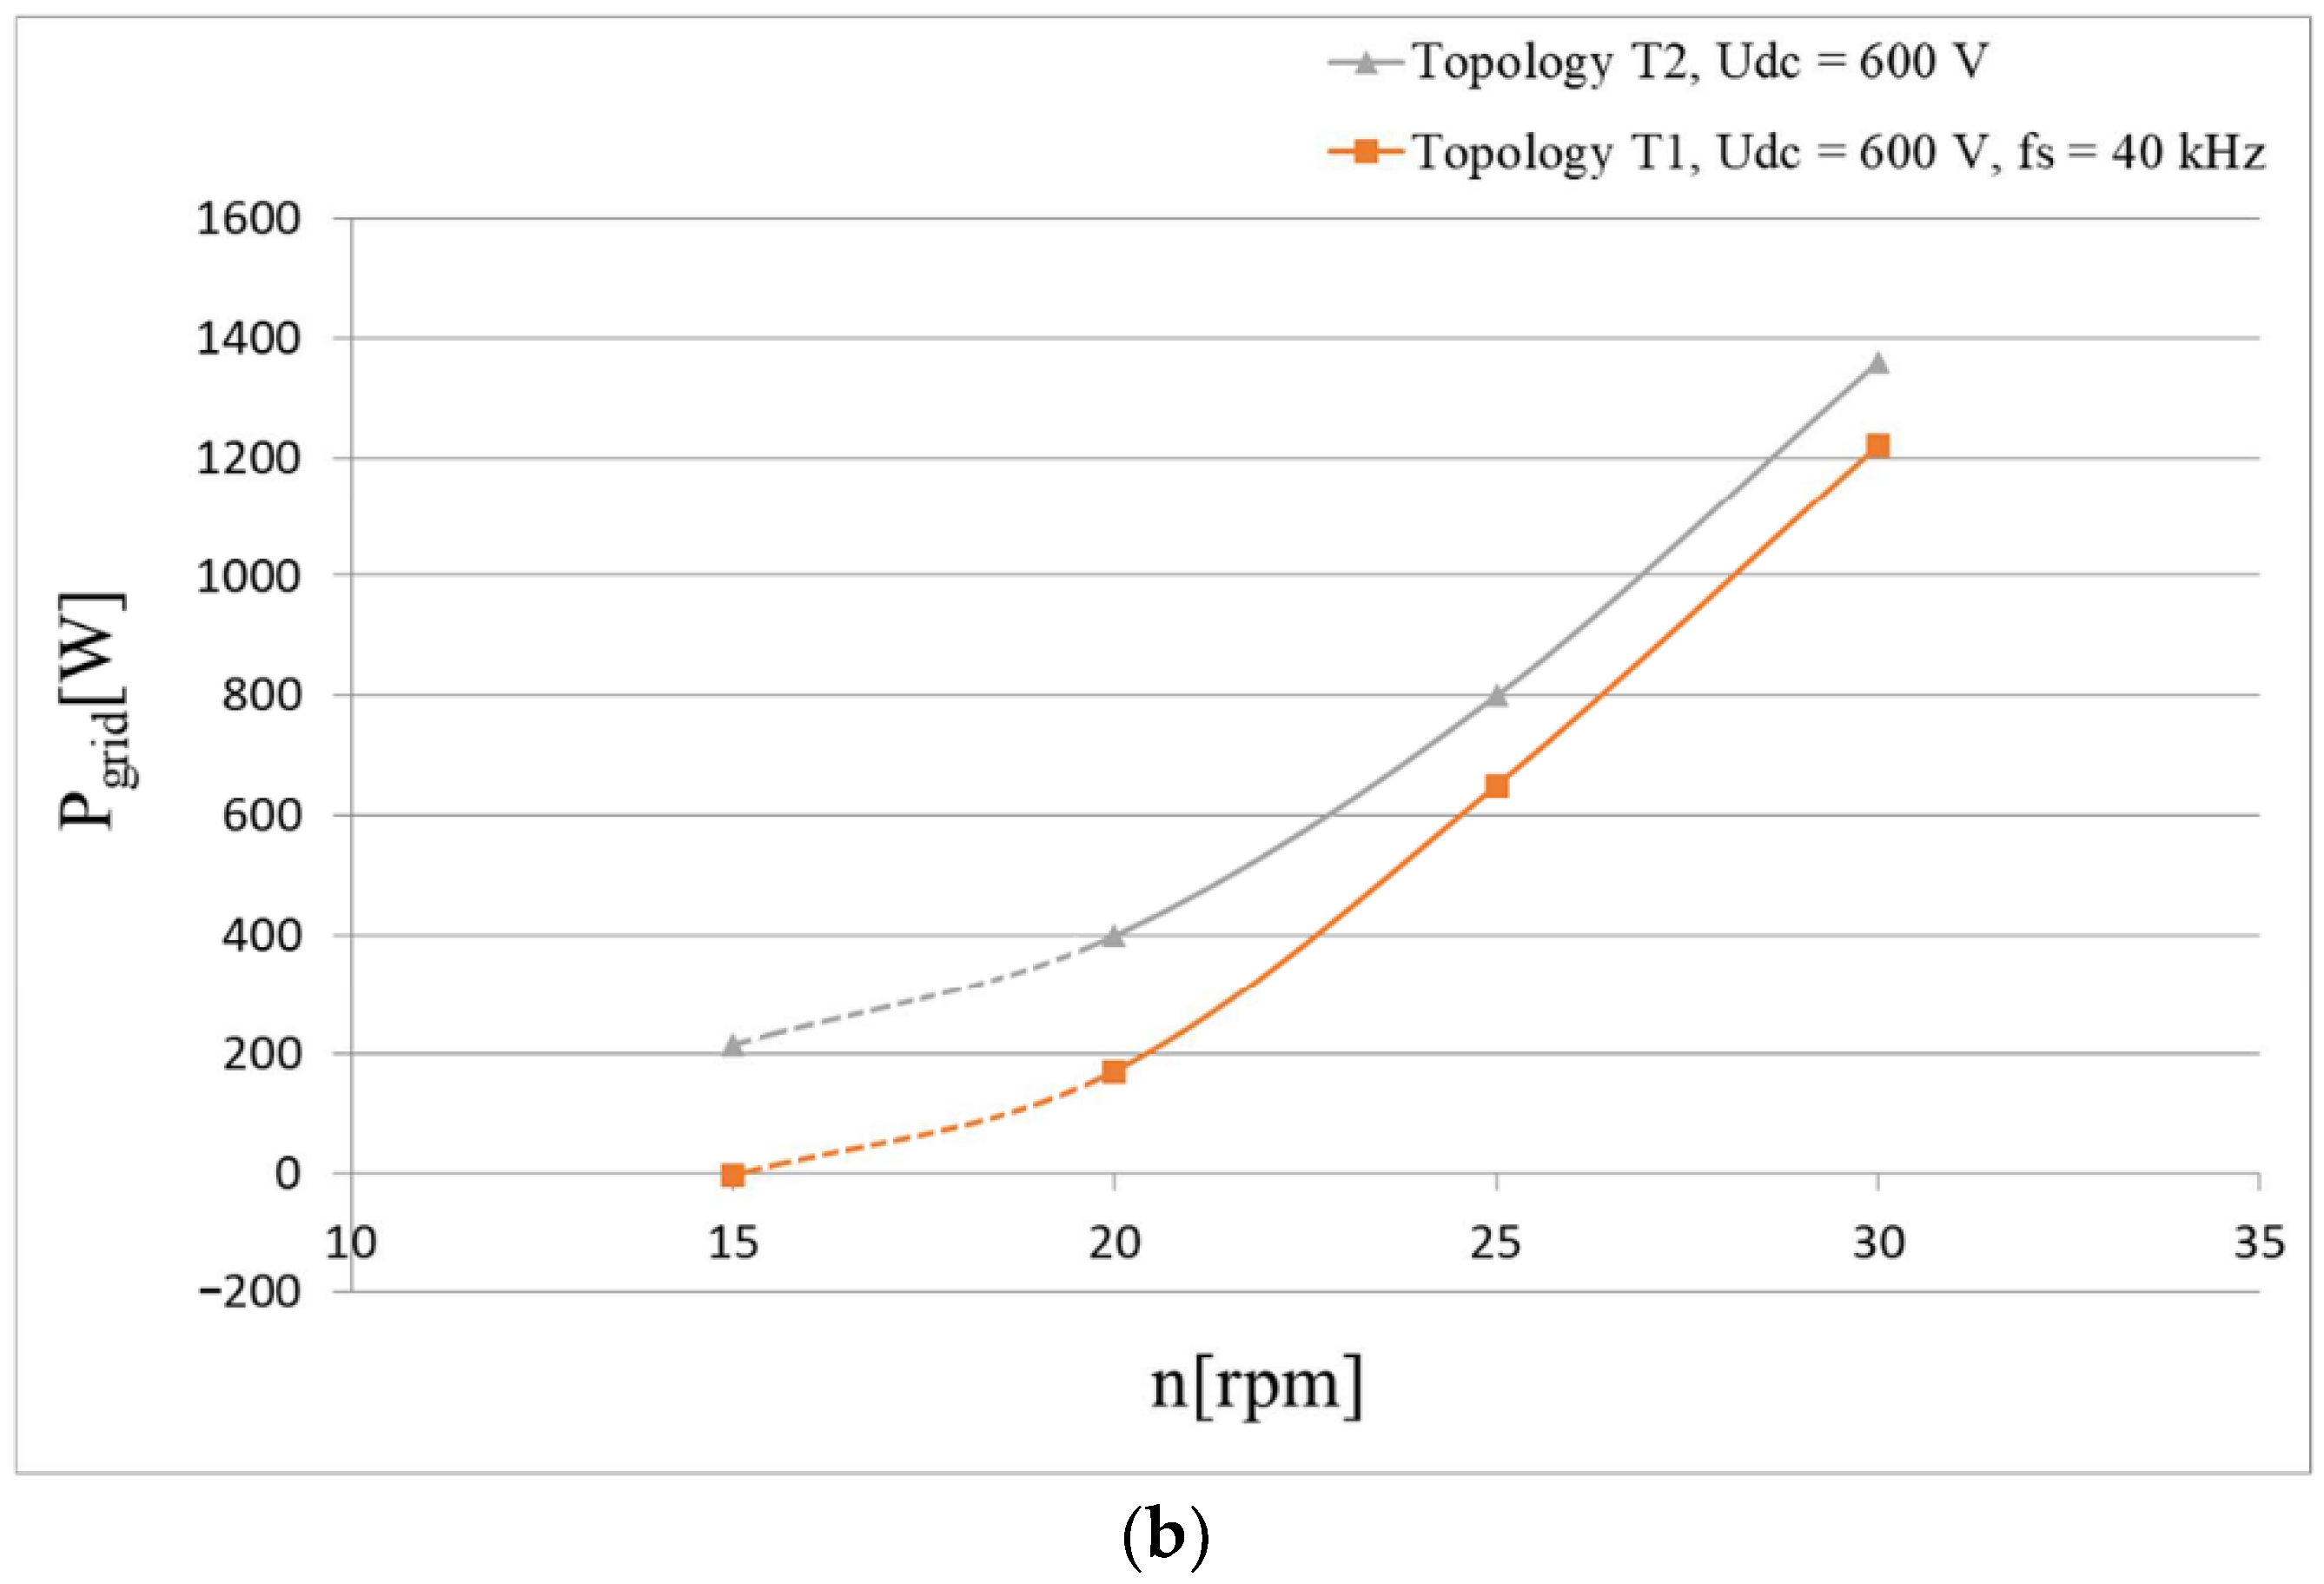
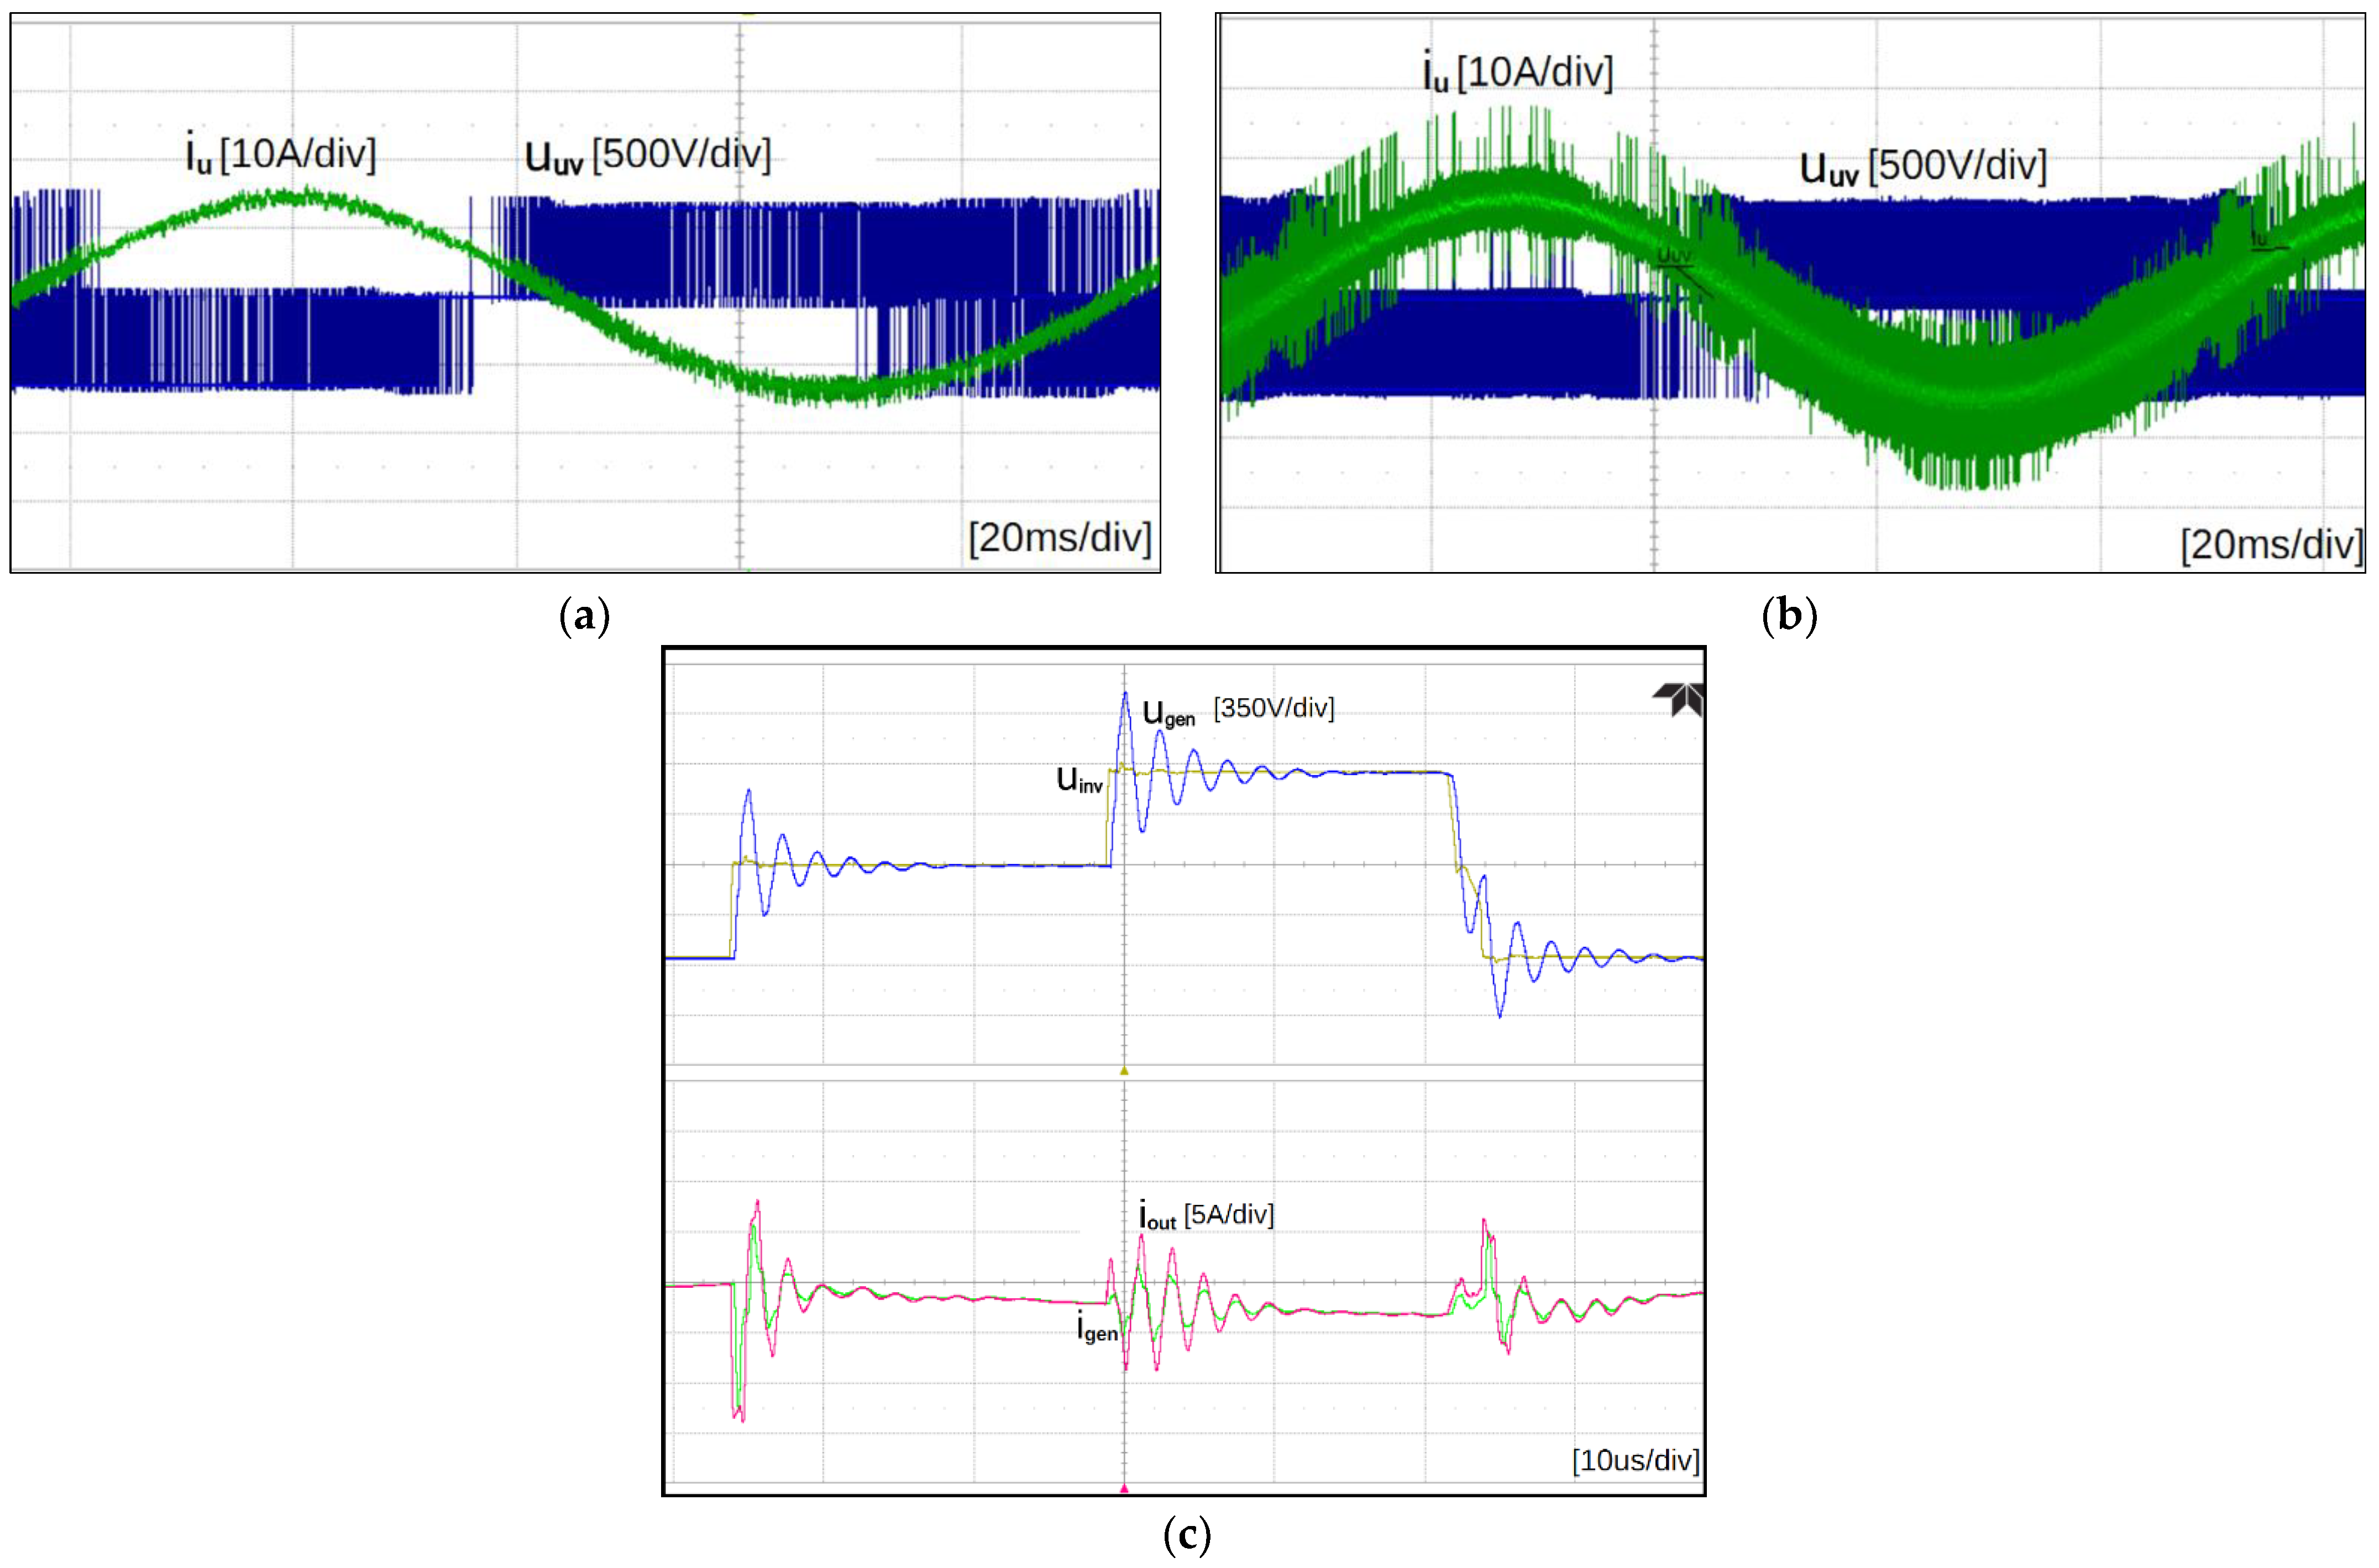
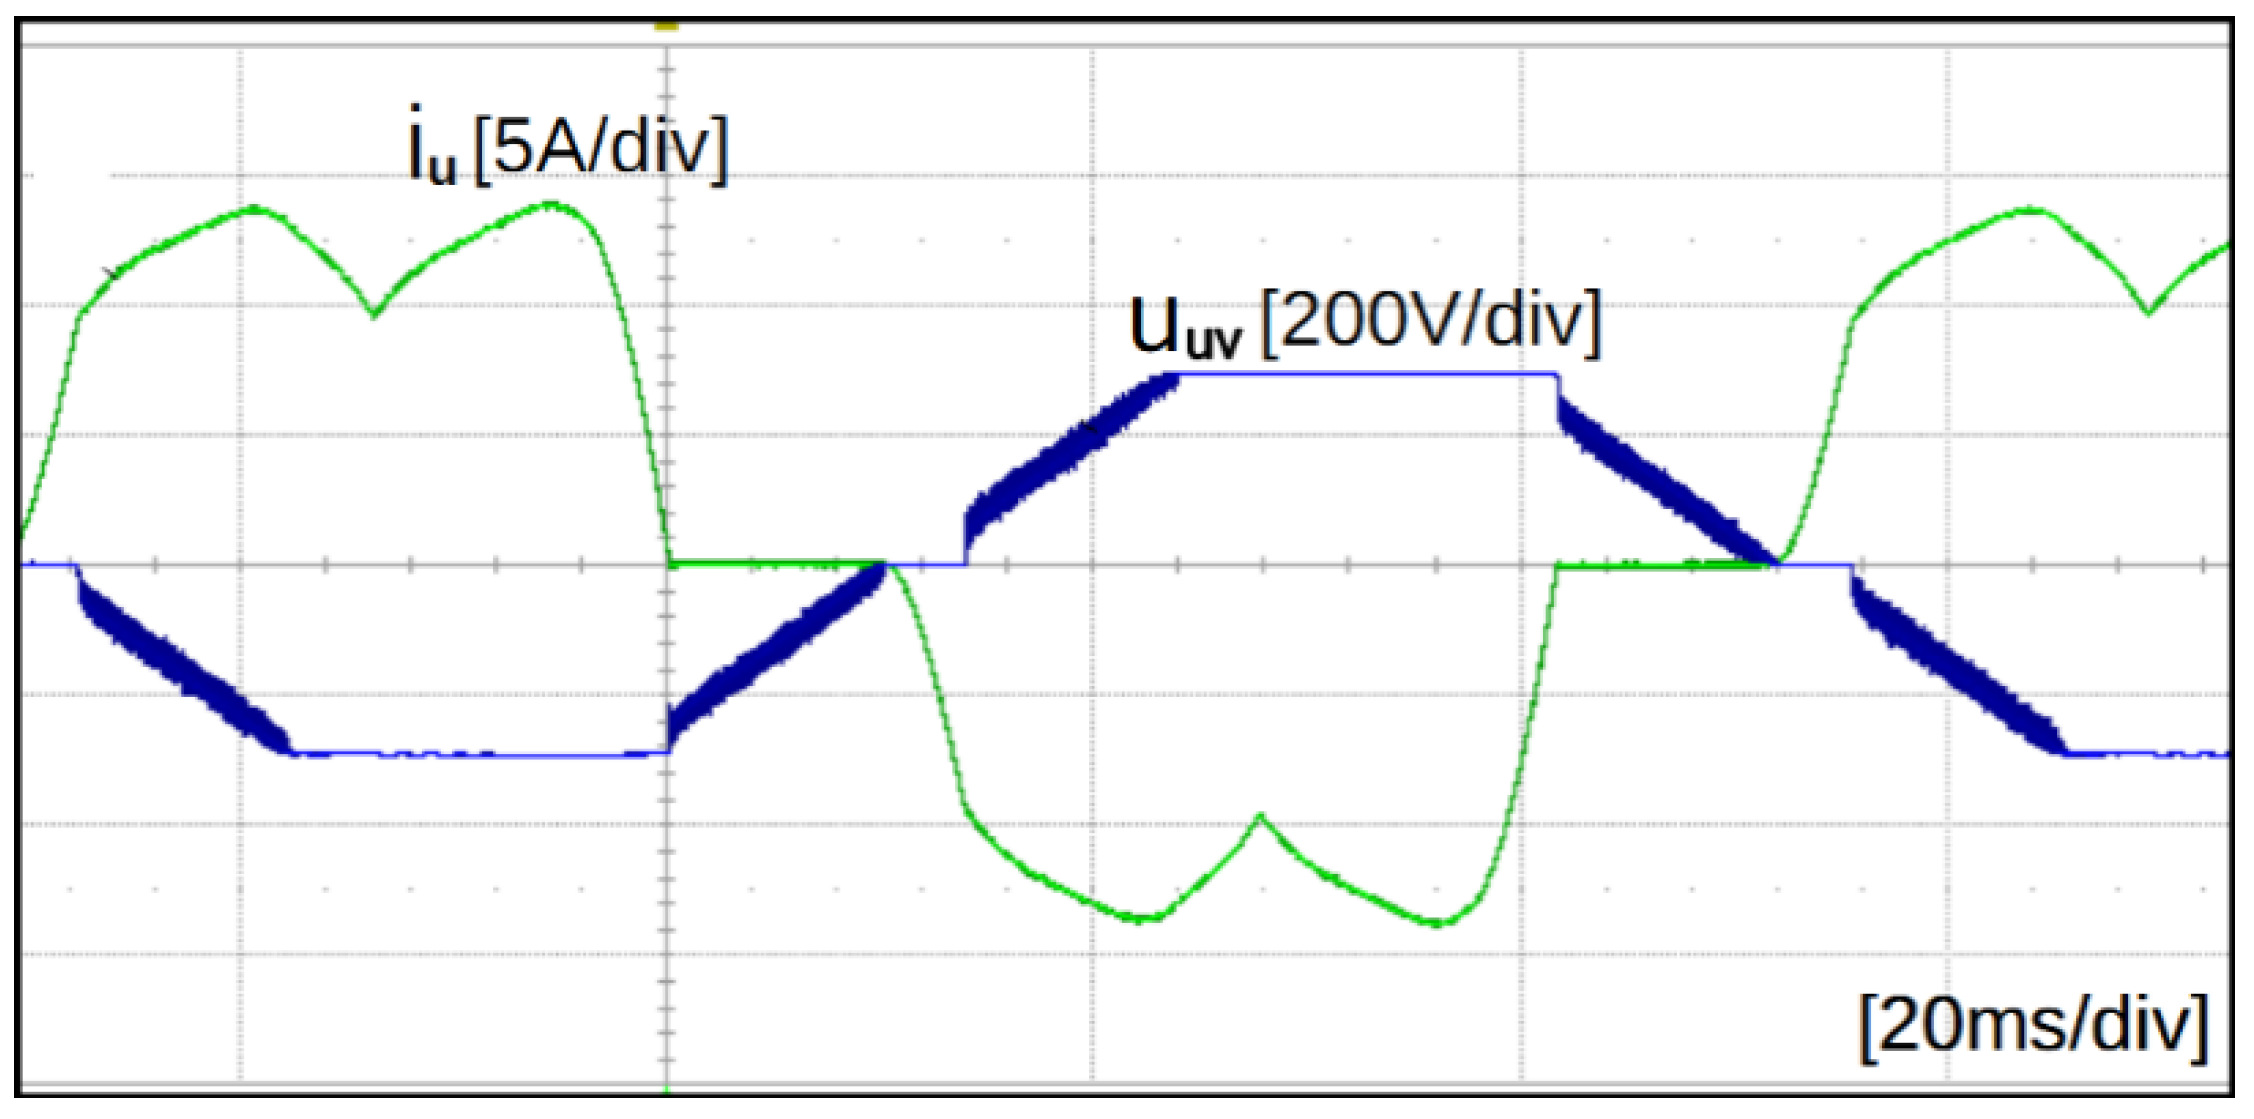
4.1. Converter Operation with T1 and T2 Topologies

Figure 5 shows the operation of the two implemented system topologies (T1, T2). Approximately sinusoidal currents (iL1, iL2, iL3) flow in the grid converter and they are in phase with the corresponding grid voltages (Figure 6a).
Implemented in the two-branch version, the boost converter allows the reduction of losses and ripples of the current supplying the DC circuit, and thus also the reduction of Udc voltage ripples of the DC link. Figure 6c, d show, respectively, the voltage and current of the grid converter for both topologies presented in the paper during the operation of the converters. Figure 6e,f show the above waveforms in a situation where the grid current is equal to zero, which means that the energy is not transmitted to the grid but completely covers the losses in the converter, as indicated by the non-zero generator current.

4.2. Efficiency of AC/DC/AC and DC/DC/AC Converters

The efficiency tests were carried out assuming the maximum power which can be obtained at a variable speed ranging from the maximum value of 1.1 nN (110 rpm) to a speed at which the energy put into the grid is equal zero (when the energy produced in the generator covers the power losses in the generator—converter conversion chain). The maximum power was limited by the rated RMS value of the generator stator current (15.3 A), which corresponds to how the MPPT mechanism works. The tests were carried out on specific solutions designed for specific converter technologies. Of course, the properties of converters, especially in terms of efficiency, can be different (even much better) when using different transistors, inductors, etc. However, certain trends remain unchanged because they result from the specific configuration of the converter and its control method. The three-level topology of the grid converter resulted from the need to reduce the THD of the grid current and was identical for both the generator converter implemented in the form of a fully controlled generator converter (topology T1) and the boost converter (topology T2). Then, it can be assumed that at a similar speed and power transmitted to the grid, the losses in the grid converter are the same independent of the topology of the converter on the generator side. Thus, the differences in the efficiency of the two energy conversion systems will only concern the converter on the generator side.
Figure 7a shows the power delivered to the grid using two energy conversion systems based on the topologies T1 and T2 with the same voltage in the DC link equal to 600 V. It is noticeable in the figure that at speeds above 0.5 nN a higher output power is obtained in the topology T1, while below this speed a higher output power is obtained in the topology T2. Figure 7b shows a zoomed-in view for speeds below 30 rpm. The dashed line indicates the parts of the waveforms where the rated generator current equal to 15.3 A could not be reached due to too low generator speed.
The aforementioned properties depend on the losses occurring in both converter systems shown in Figure 8 and in Figure 9. Assuming that with the same power supplied to the grid, the power losses in the grid converter are the same, the difference in power losses is determined by the losses in the generator converter. The power losses in the generator converter (topology T1) consist of switching losses and conduction losses in the transistors and diodes of the converter. Switching losses depend mainly on the switching frequency of transistors, understood as the total number of switches of all transistors at a sampling frequency of, e.g., 40 kHz. However, as the speed increases, the sampling frequency decreases from 56 kHz (n = 15 rpm) to 26 kHz (n = 110 rpm), while remaining practically constant in the range up to n = 40 rpm (Figure 10b). At a constant current value (15.3 A), the conduction losses in both diodes and transistors are constant. A similar trend is also observed in the grid converter, where the switching frequency of the transistors is at a similar level. Thus, the reduction of the total power losses of the converter system of the topology T1 with the increase in speed is mainly due to the reduction in the switching frequency of the transistors.
In the topology T2, the power losses (Figure 8) are of a more complex nature, as it also includes inductive components (chokes) in which the losses depend on many factors and occur in the core and in the windings. The switching frequency of the DC/DC converter transistors is constant (20 kHz) and the duty factor δ varies between 0.98 (for n = 15 rpm) and 0.19 (for n = 110 rpm) at an output voltage of Udc = 600 V (Figure 11b). At constant output voltage (600 V) and approximately linear changes in the output power (Figure 7a) depending on the speed, the average current in the choke is proportional to the power so it is linearly dependent on the speed. Therefore, the switching losses and conduction losses in transistors depend in a similar way on the speed.
Choke losses consist of copper losses and core losses, including eddy current losses and hysteresis losses. The losses in the windings of the choke (copper losses) are proportional to the square of the current, and therefore increase with increasing speed. The eddy current losses depend on the frequency and, at a constant switching frequency (20 kHz), are small (due to the core material—Sendust Super-MSS) and constant—depending on the speed. Hysteresis losses depend on the surface of the magnetization loop, and it, in turn, depends on the current ripple in the choke. The maximum ripple occurs at δ = 0.5 and so at half speed the eddy current losses are maximum. The total power loss graph is the sum of the components discussed, however, as one can notice, at low speeds (<40 rpm), the switching losses in the AC/DC grid converter are decisive and cause the waveforms to go upwards in both topologies. Figure 8 shows that power losses, especially at higher speeds (higher powers), are determined by the losses in the choke. These losses, in turn, depend significantly on the materials and technology used as well as the topology of the boost converter (the number of parallel branches of the converter) and its control.
The next figure (Figure 9) indicates a similar nature of loss changes in both topologies of the converters i.e., in the topology T1, the losses decrease as the speed increases, and in the topology T2, they increase. Figure 8 shows that above half of the generator speed, the topology T1 is a more advantageous solution when considering the level of losses, and below 0.5 n, smaller losses occur in the topology T2. However, at a higher voltage Udc = 650 V (Figure 9) in the whole range, the topology T2 is more advantageous (losses are smaller).

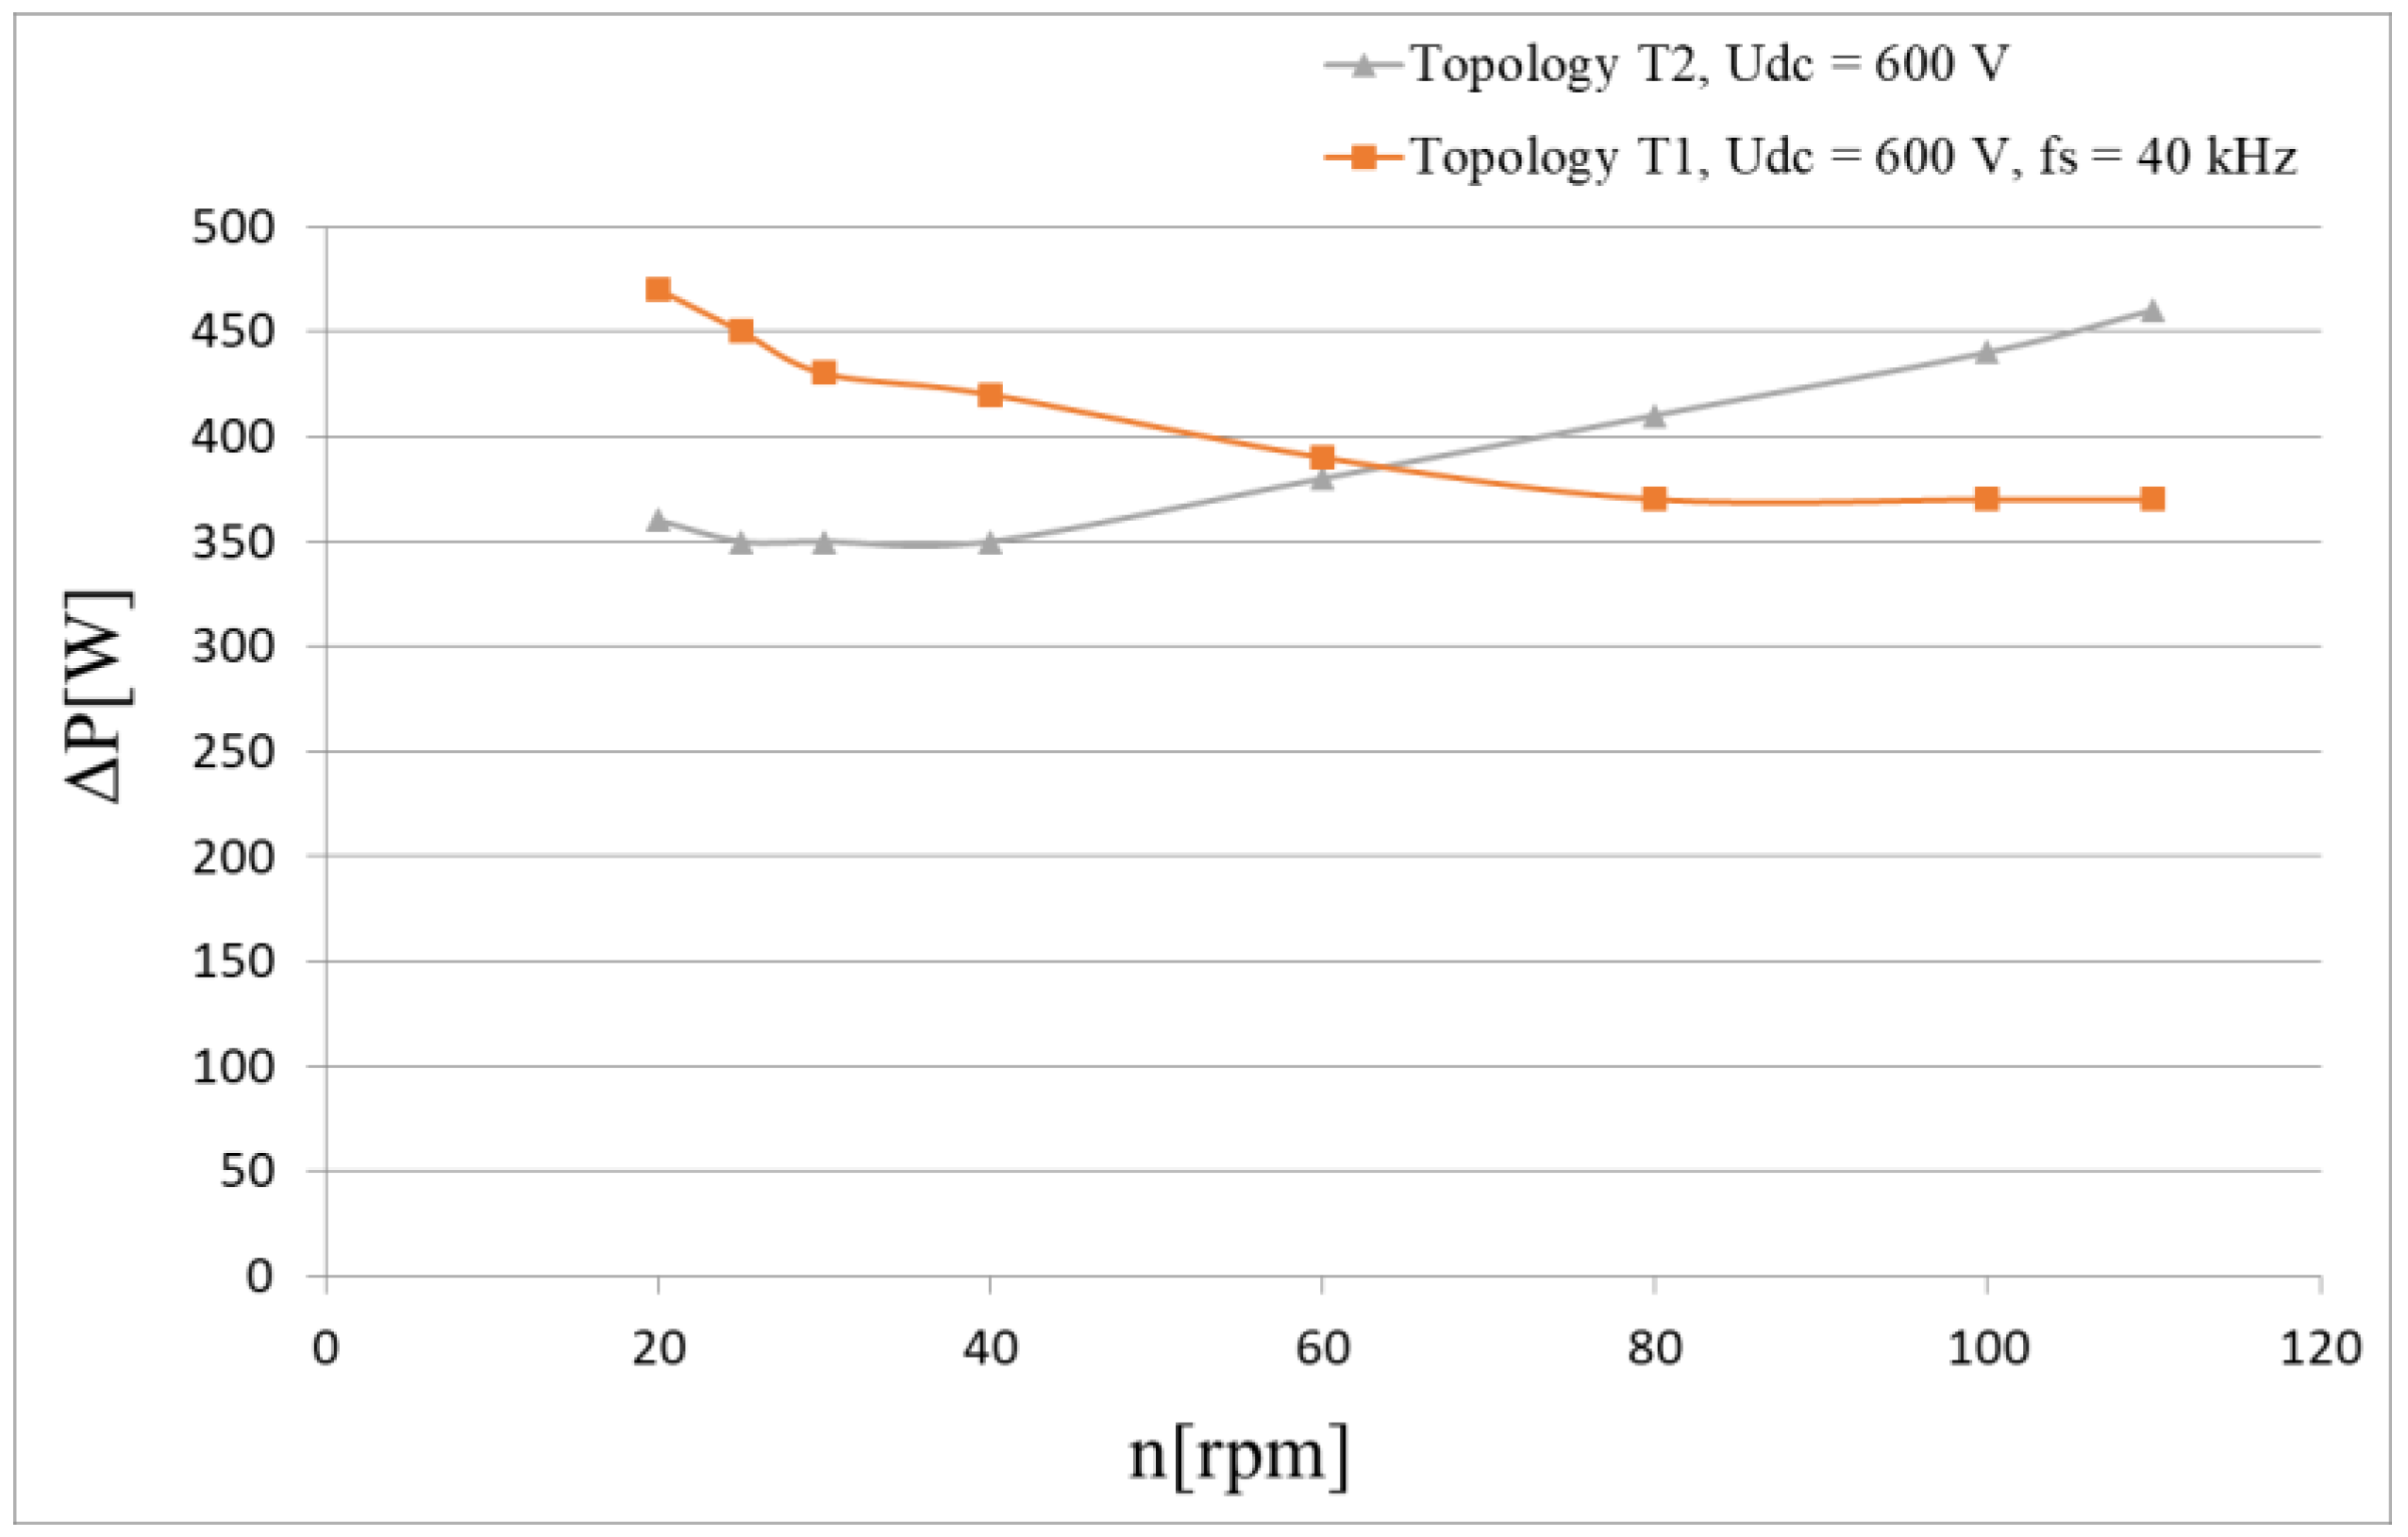
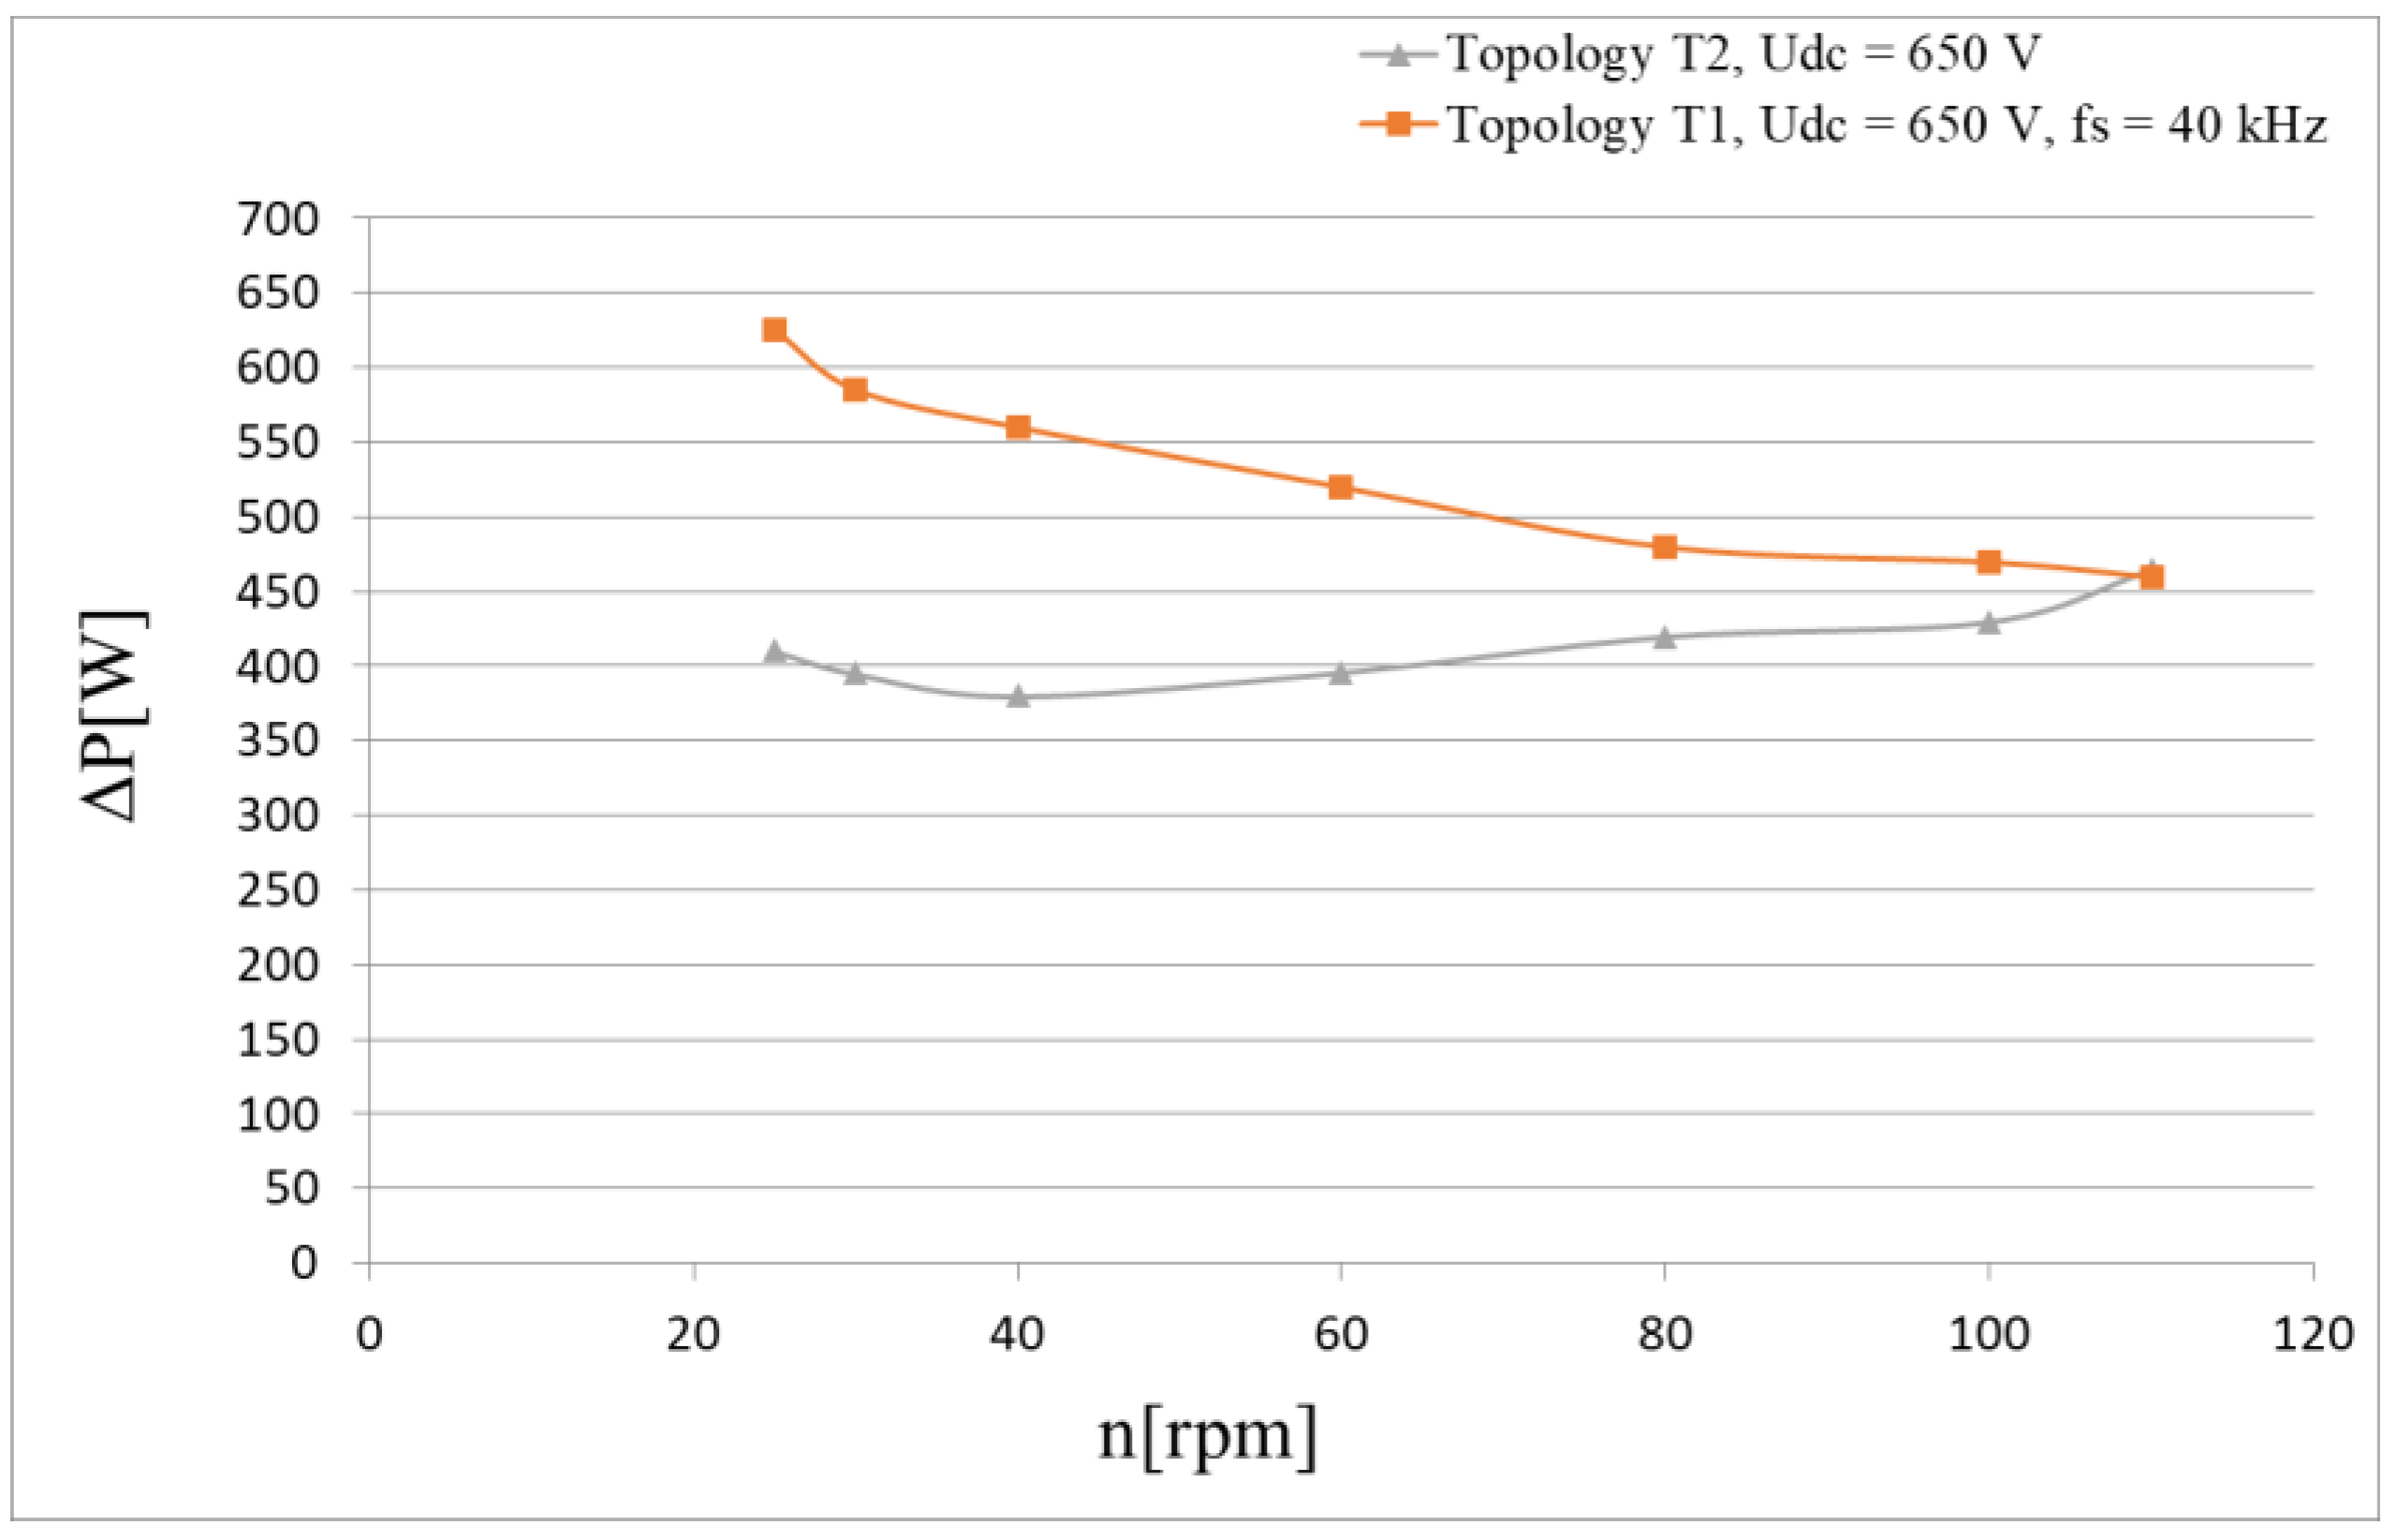
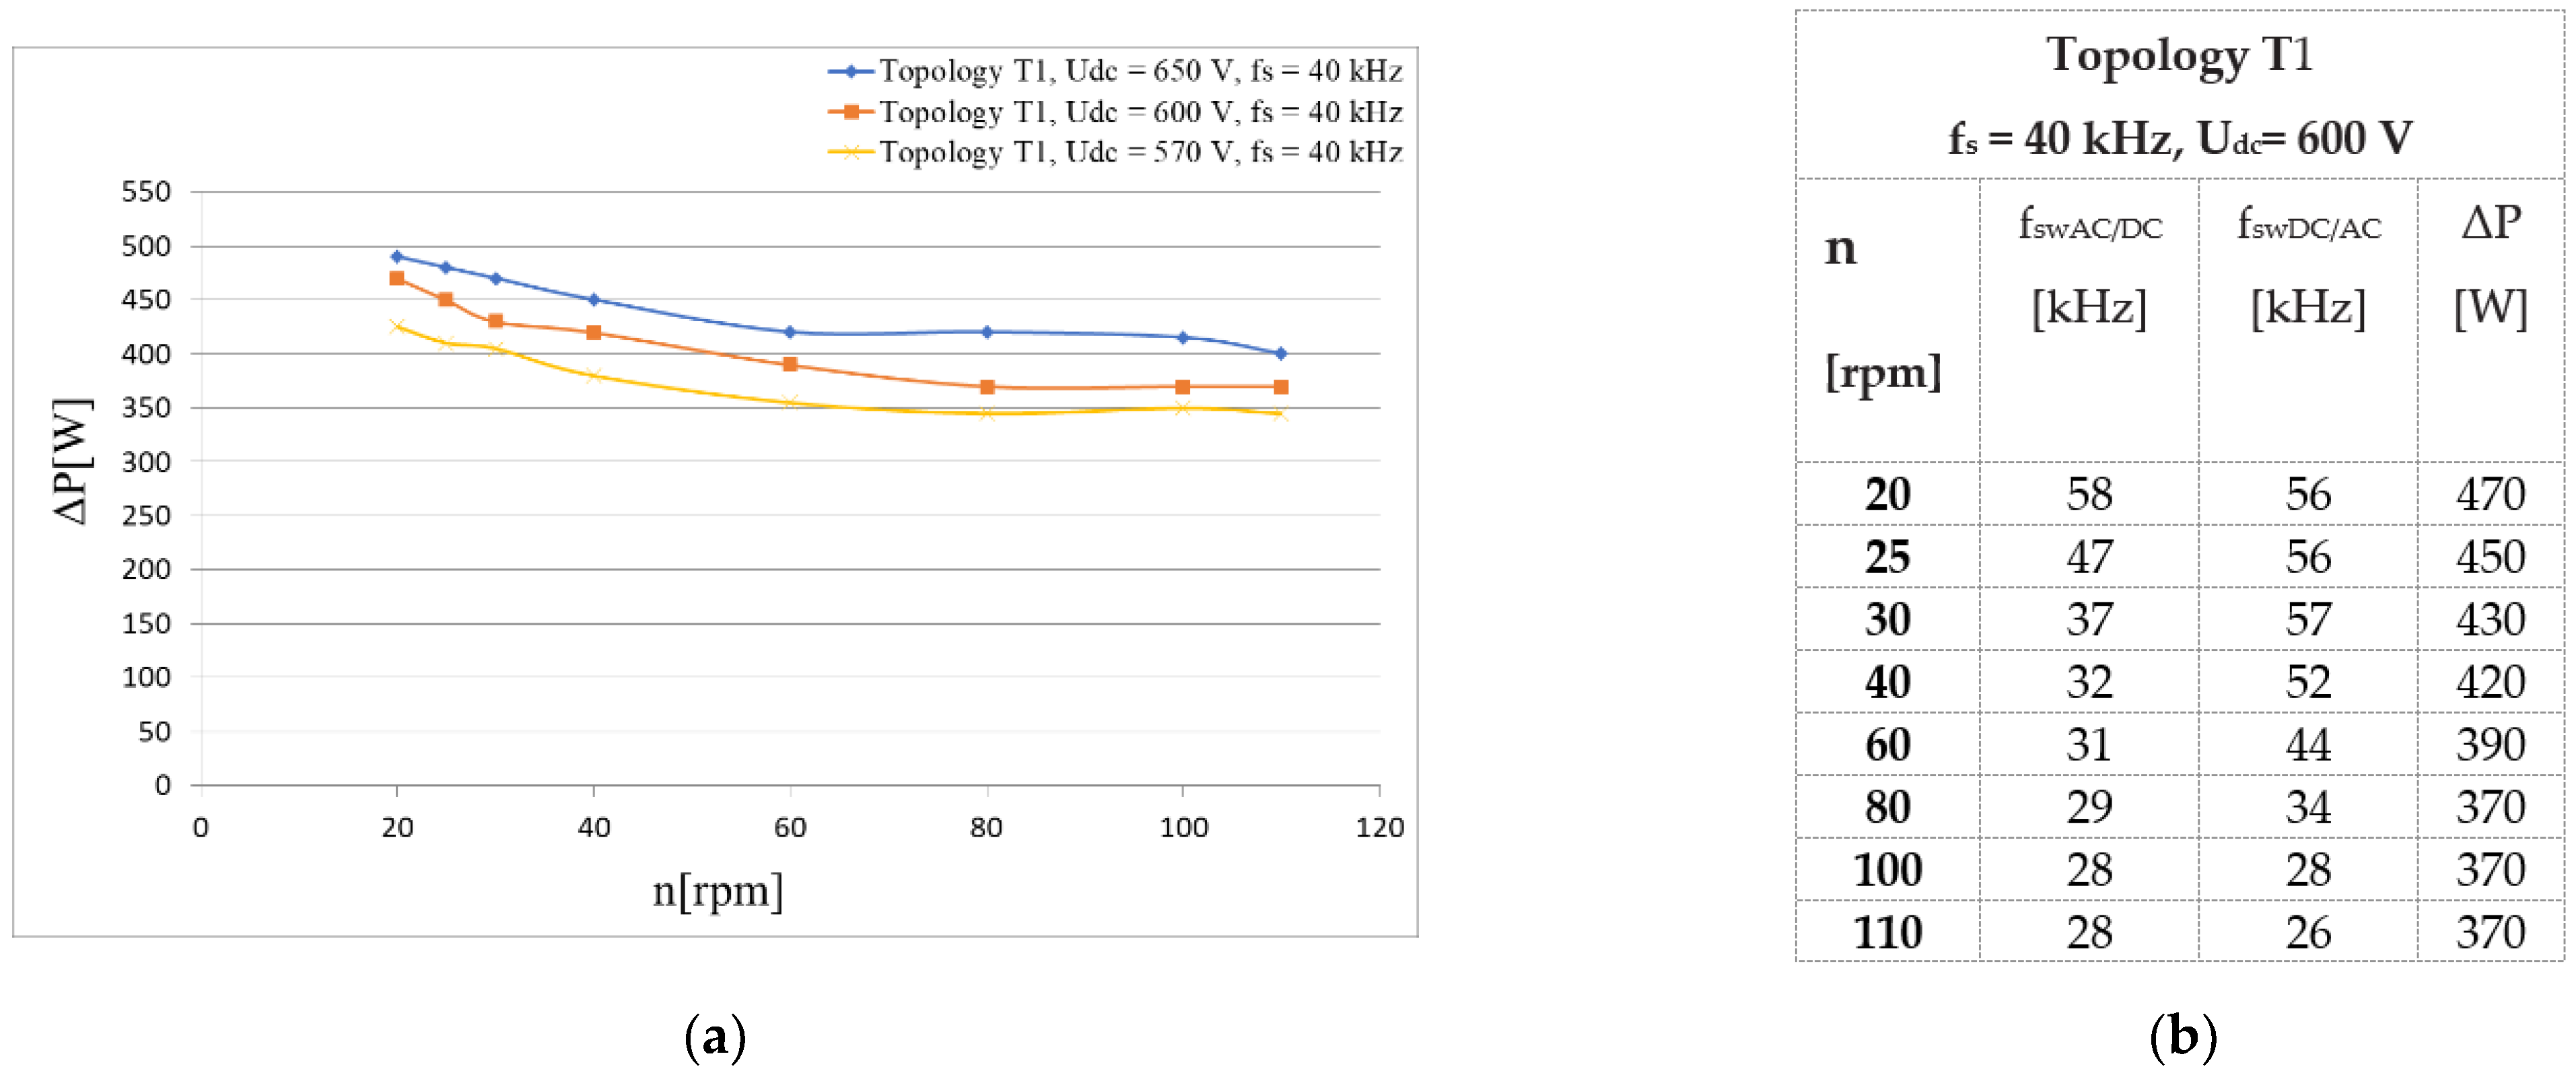
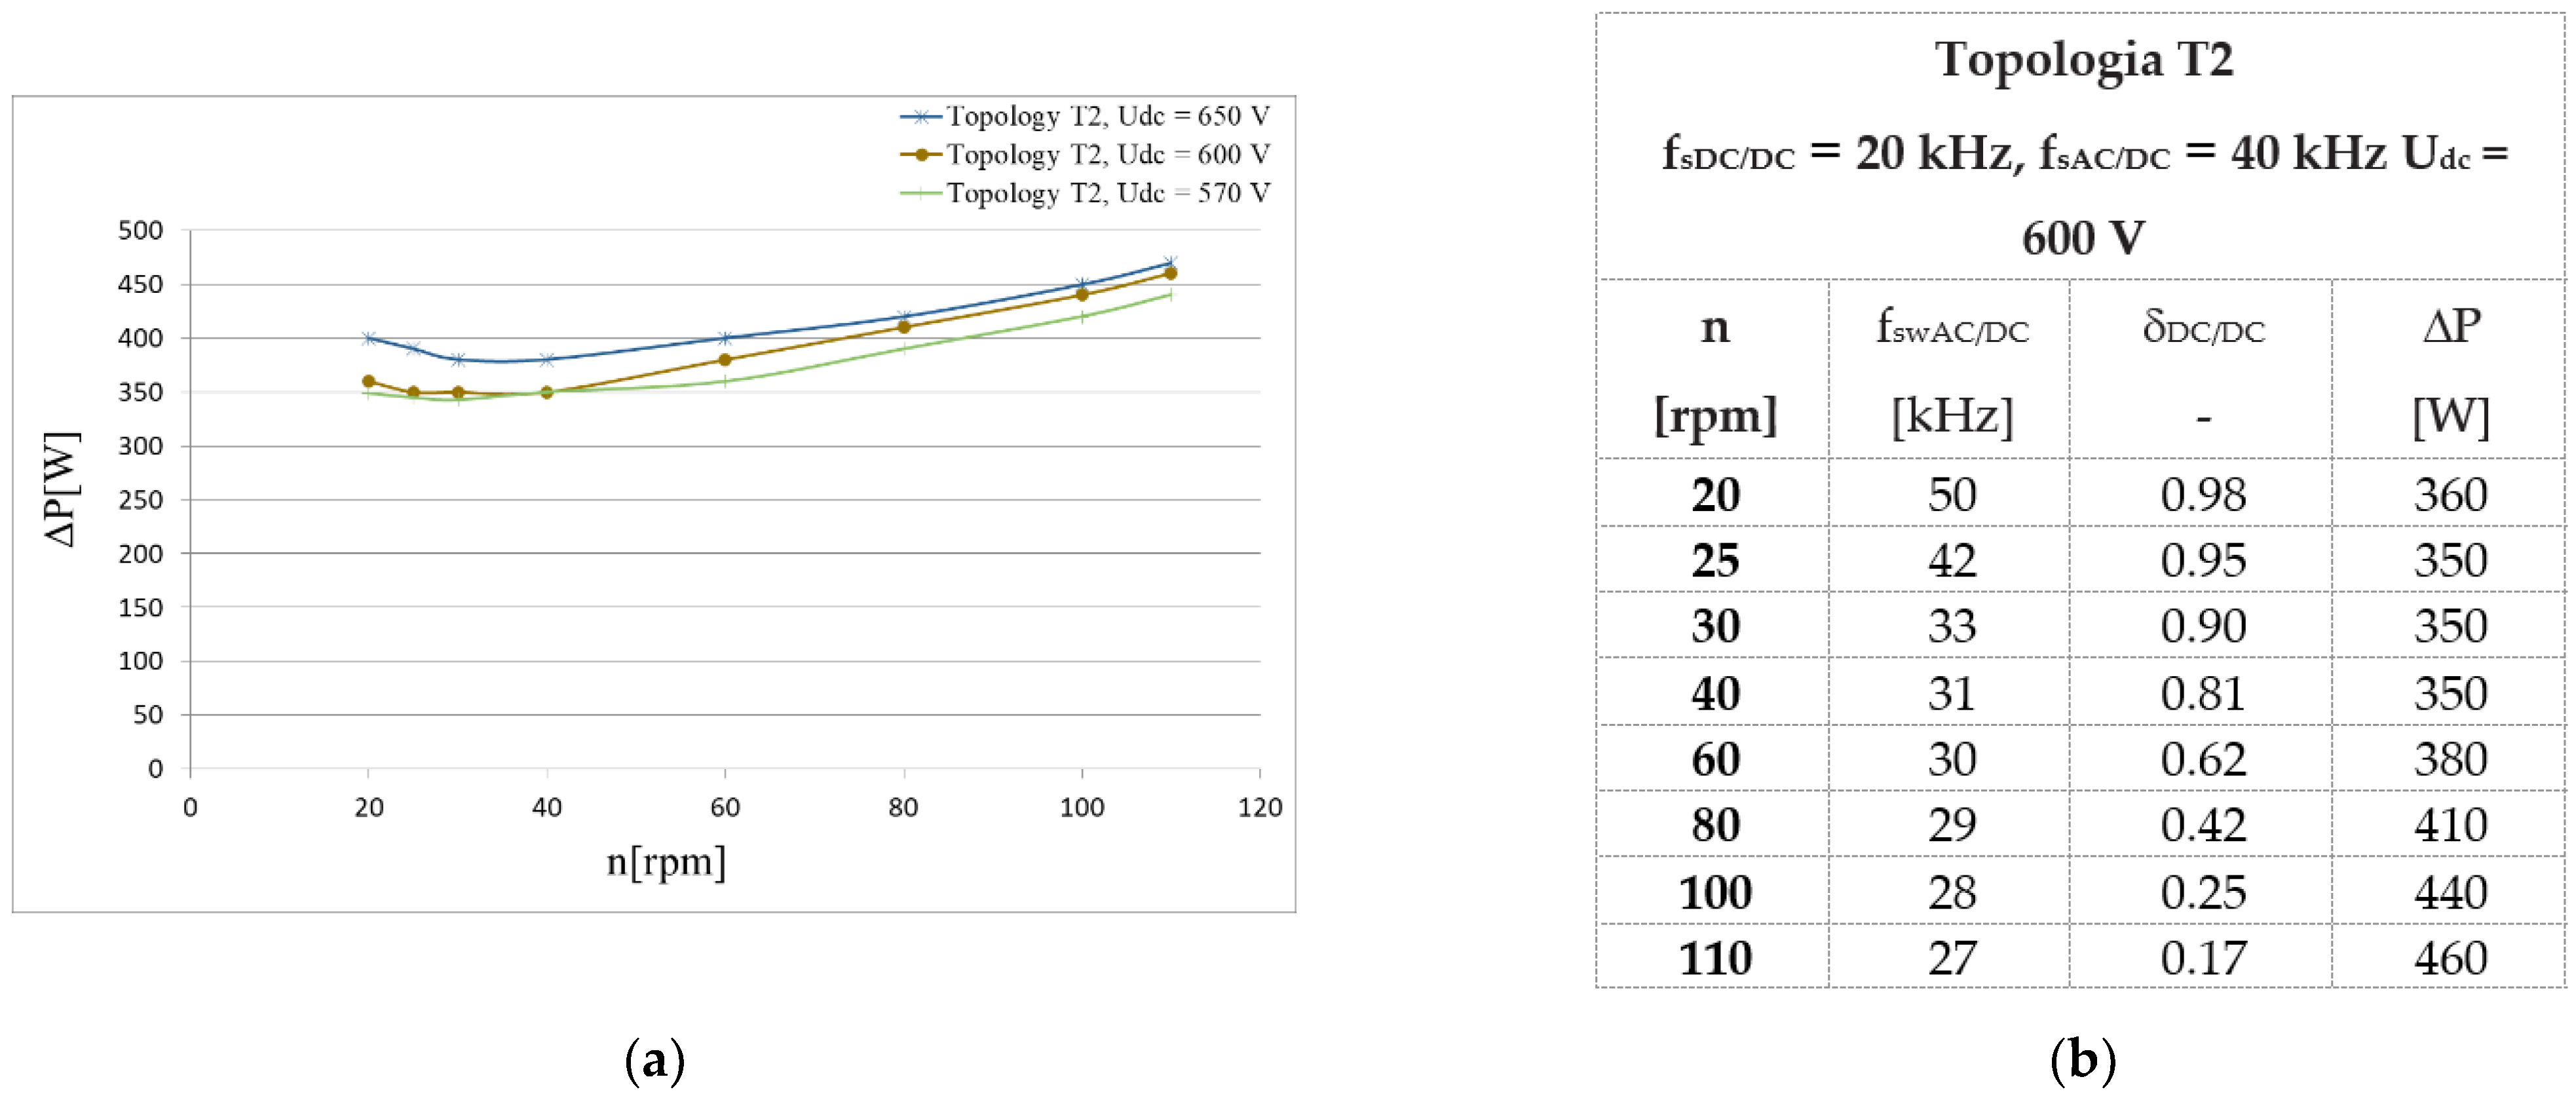
4.3. Efficiency of Converters Depending on DC Link Voltage

Power losses in the grid converter depend also on the voltage in the Udc intermediate circuit. The minimum value of this voltage depends on the grid current and the inductance of the grid chokes as well as the value of the grid voltage [32]. The Udc voltage affects the rate of change of the current (current derivative), and this in turn affects the switching frequency and current ripple in both converters. The higher the Udc voltage, the higher the switching frequency of the converter transistors and the resulting switching losses (Figure 10).
Analysing power losses in the converter in the topology T2 (Figure 11), one can notice that voltage changes in the DC link have a similar effect on power losses as in the topology T1 but to a lesser extent and that they are caused by an increase in switching losses only in the grid converter. Naturally, as with the topology T1, it is necessary to strive for a possibly lowest Udc voltage ensuring the correct operation of the grid converter.

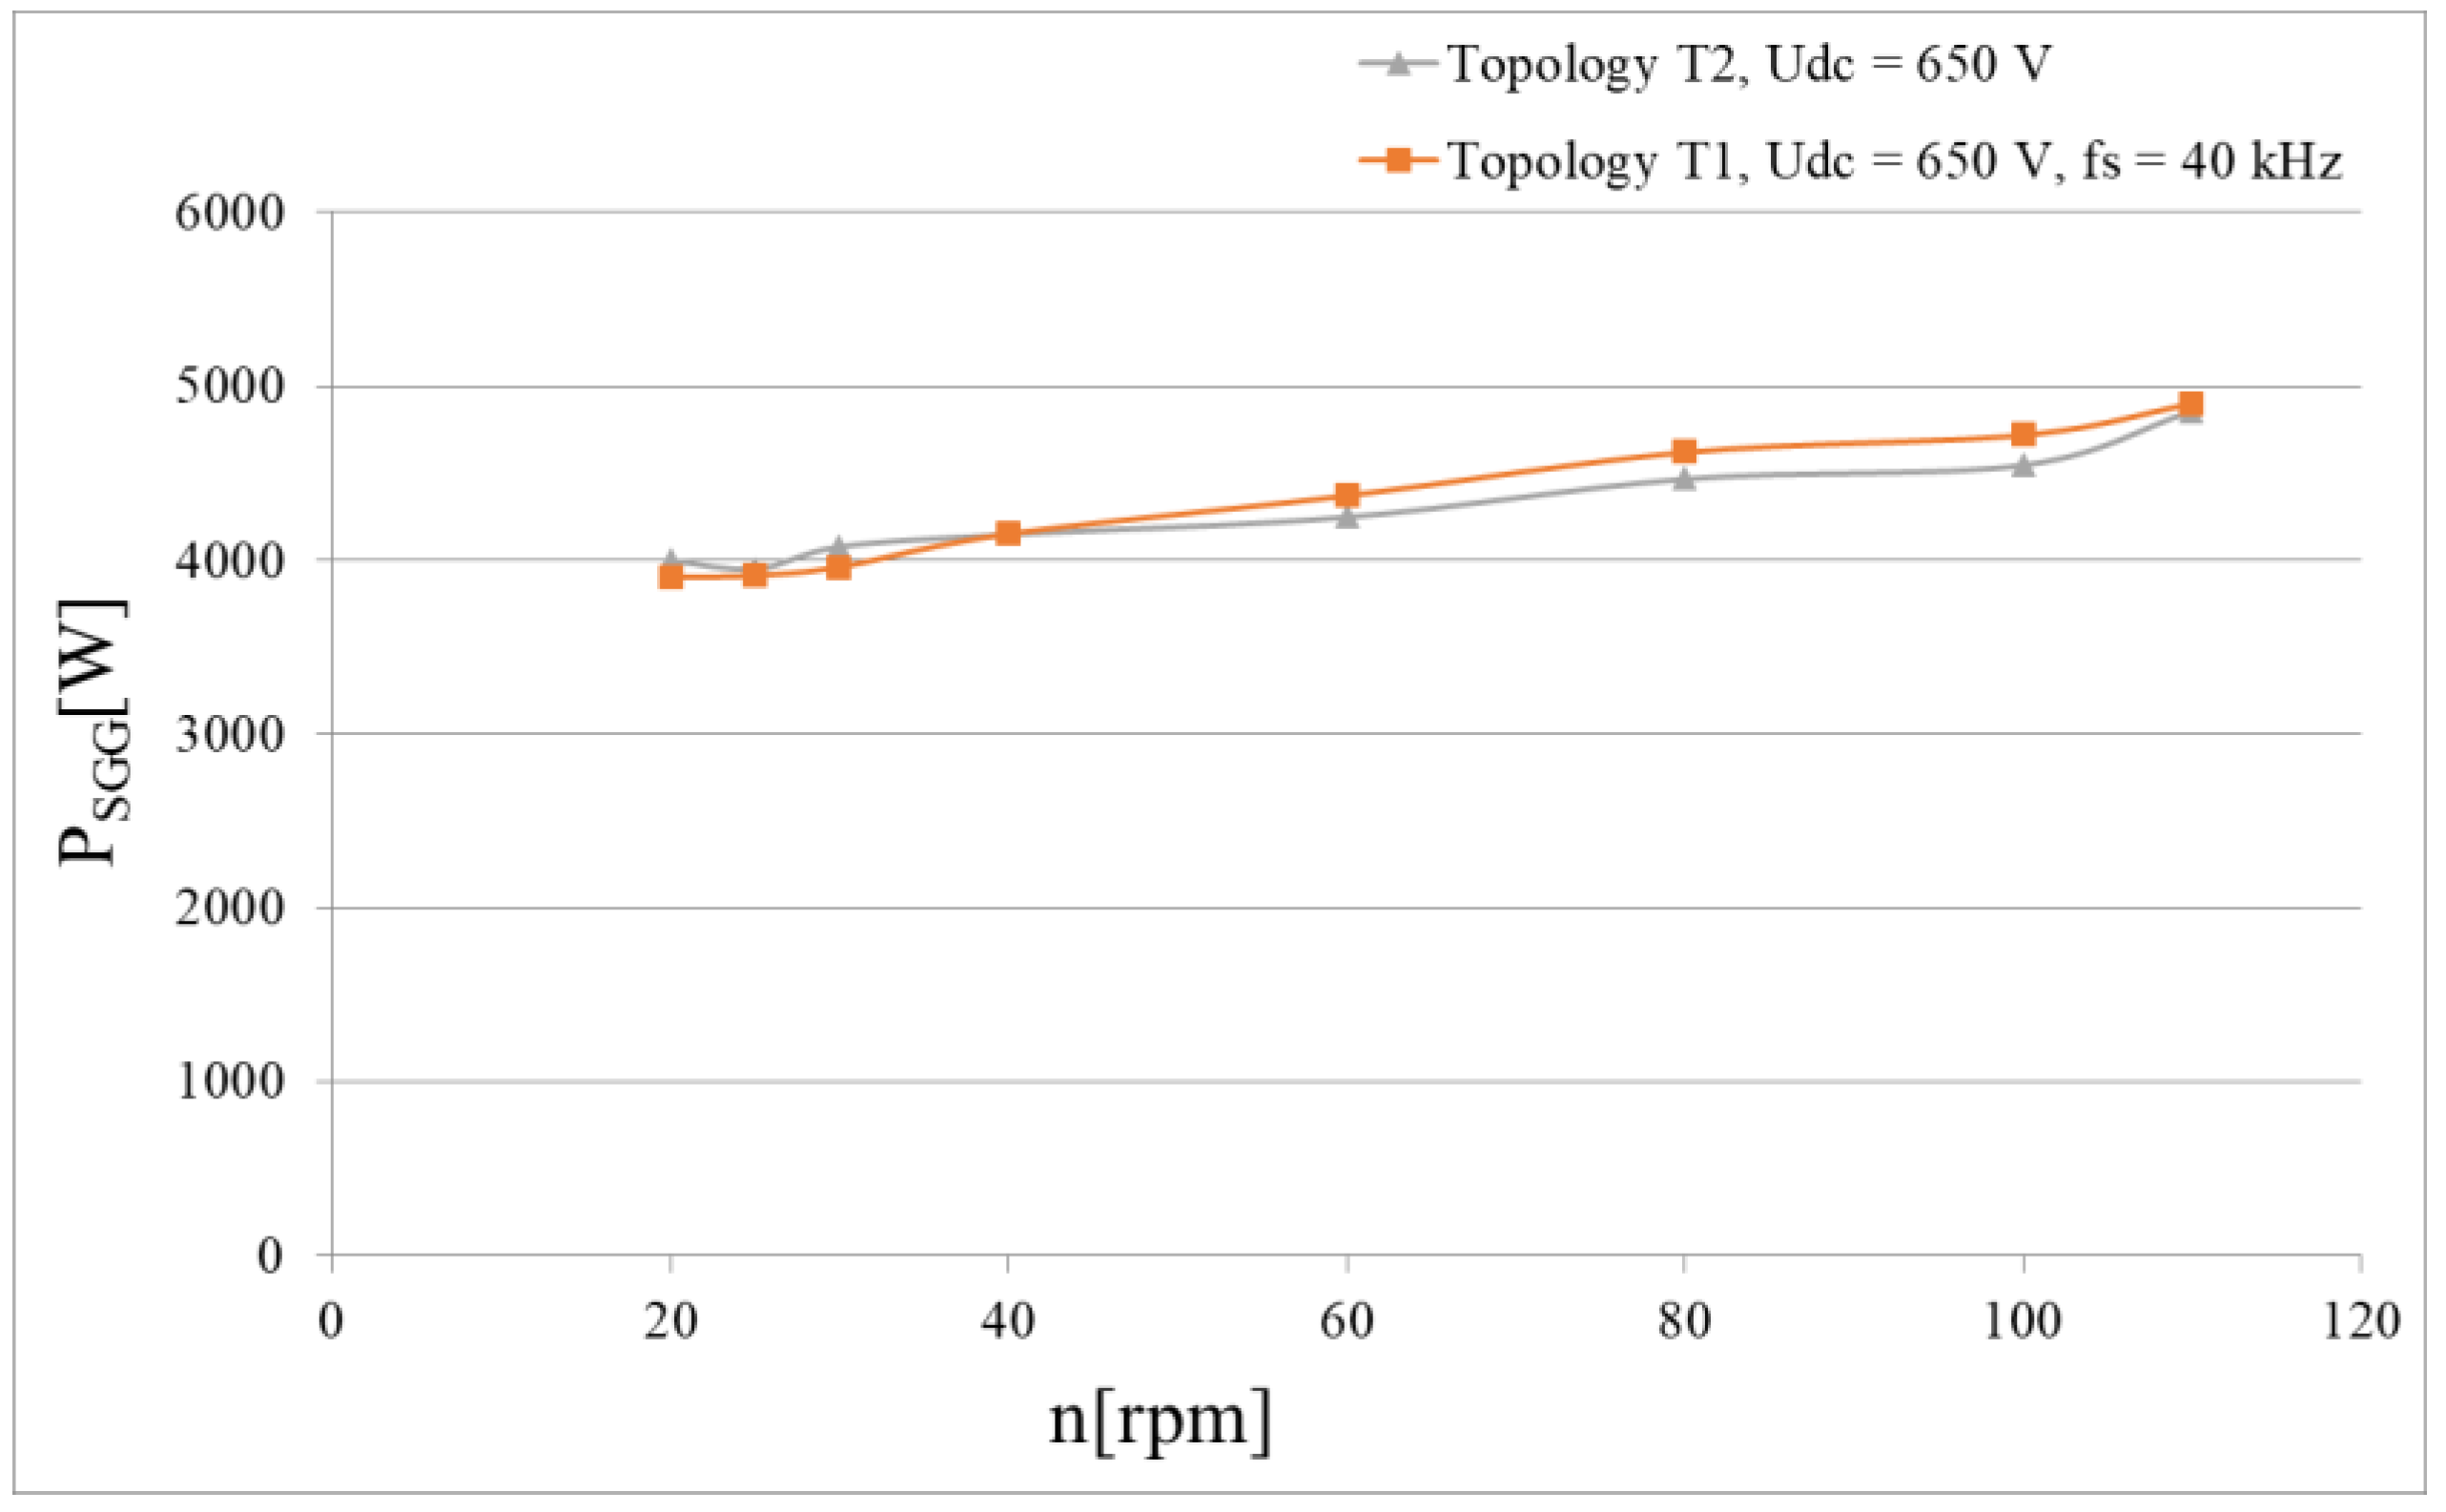
4.4. Effect of Switching Frequency on the Generator Converter Efficiency

Power losses in the topology T1 depending on the sampling frequency were recorded for two sampling frequencies of the generator converter: 20 kHz and 40 kHz (Figure 12). The applied type Δ current control method ensures that the change in the sampling frequency does not result in a proportional change in the switching frequency of the generator converter transistors. At a sampling frequency fs = 20 kHz, the switching frequency fsw varies between 18 kHz (n = 110 rpm) and 44 kHz (n = 15 rpm), while at fs = 40 kHz the switching frequency varies between 26 kHz (n = 110 rpm) and 56 kHz (n = 15 rpm). Switching losses in semiconductor devices (transistors, diodes), which are part of the total power losses of the converter, vary in proportion to the switching frequency. Of course, as the switching frequency decreases, the THD of the generator current deteriorates.

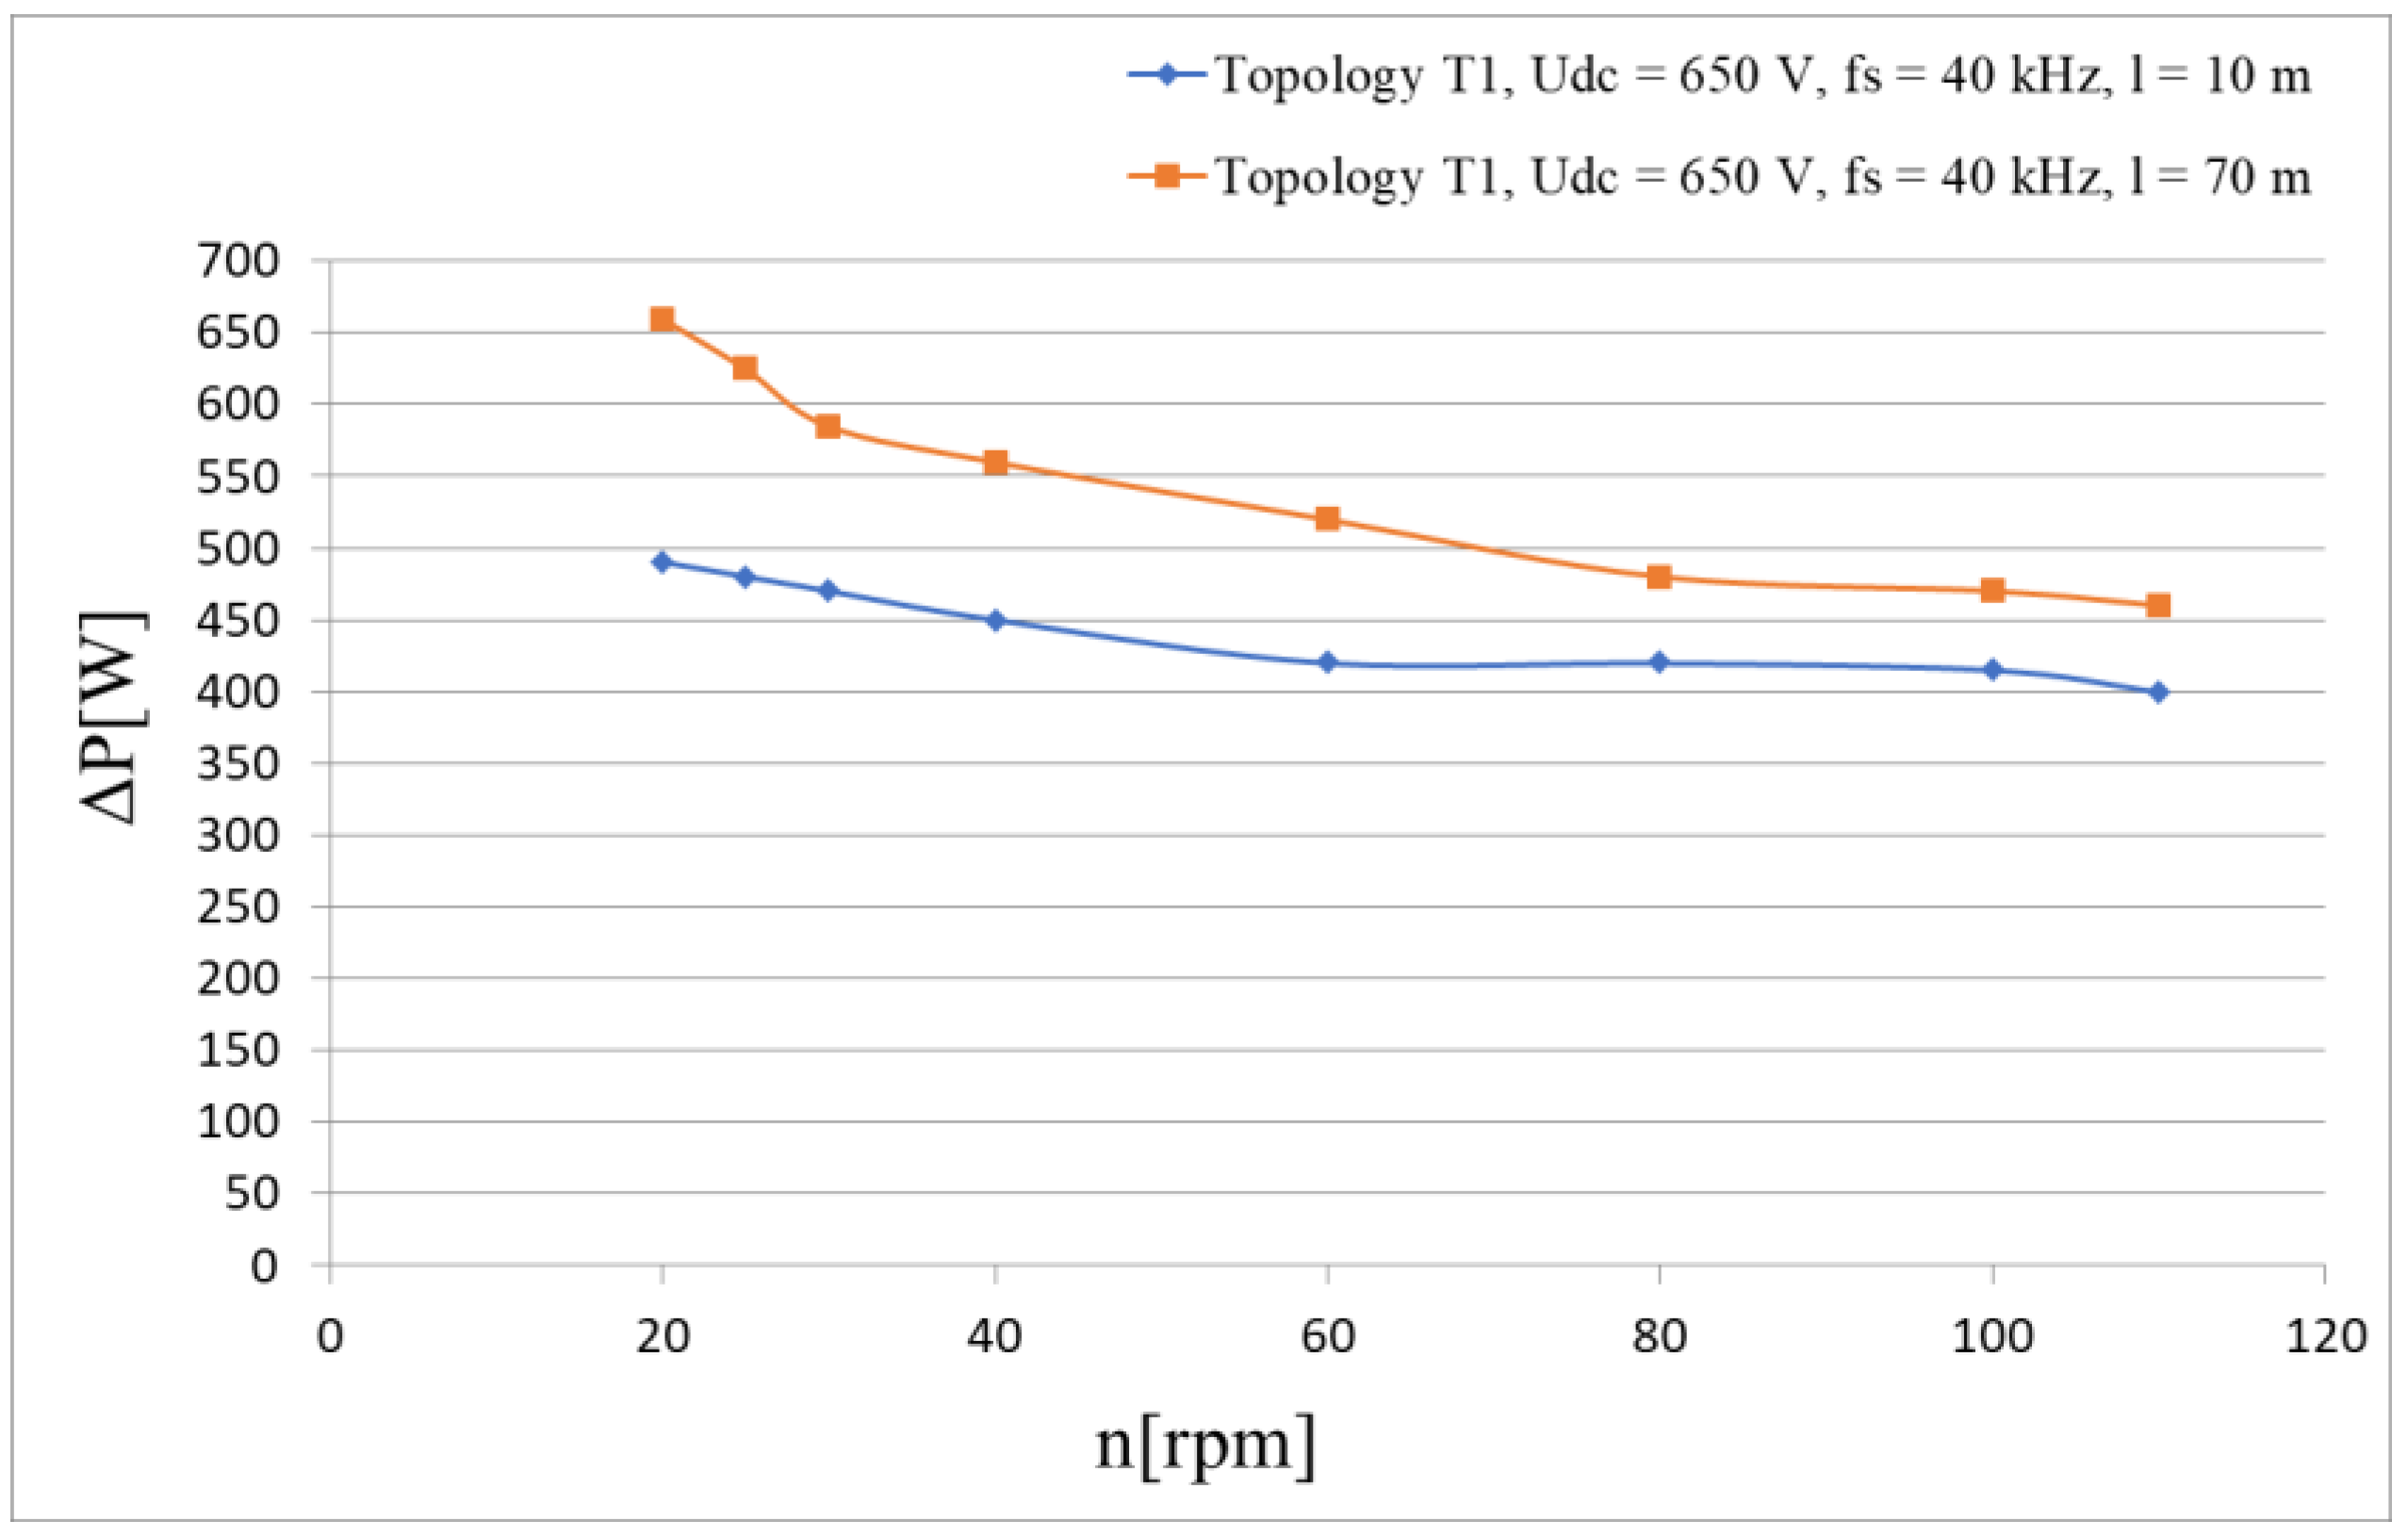
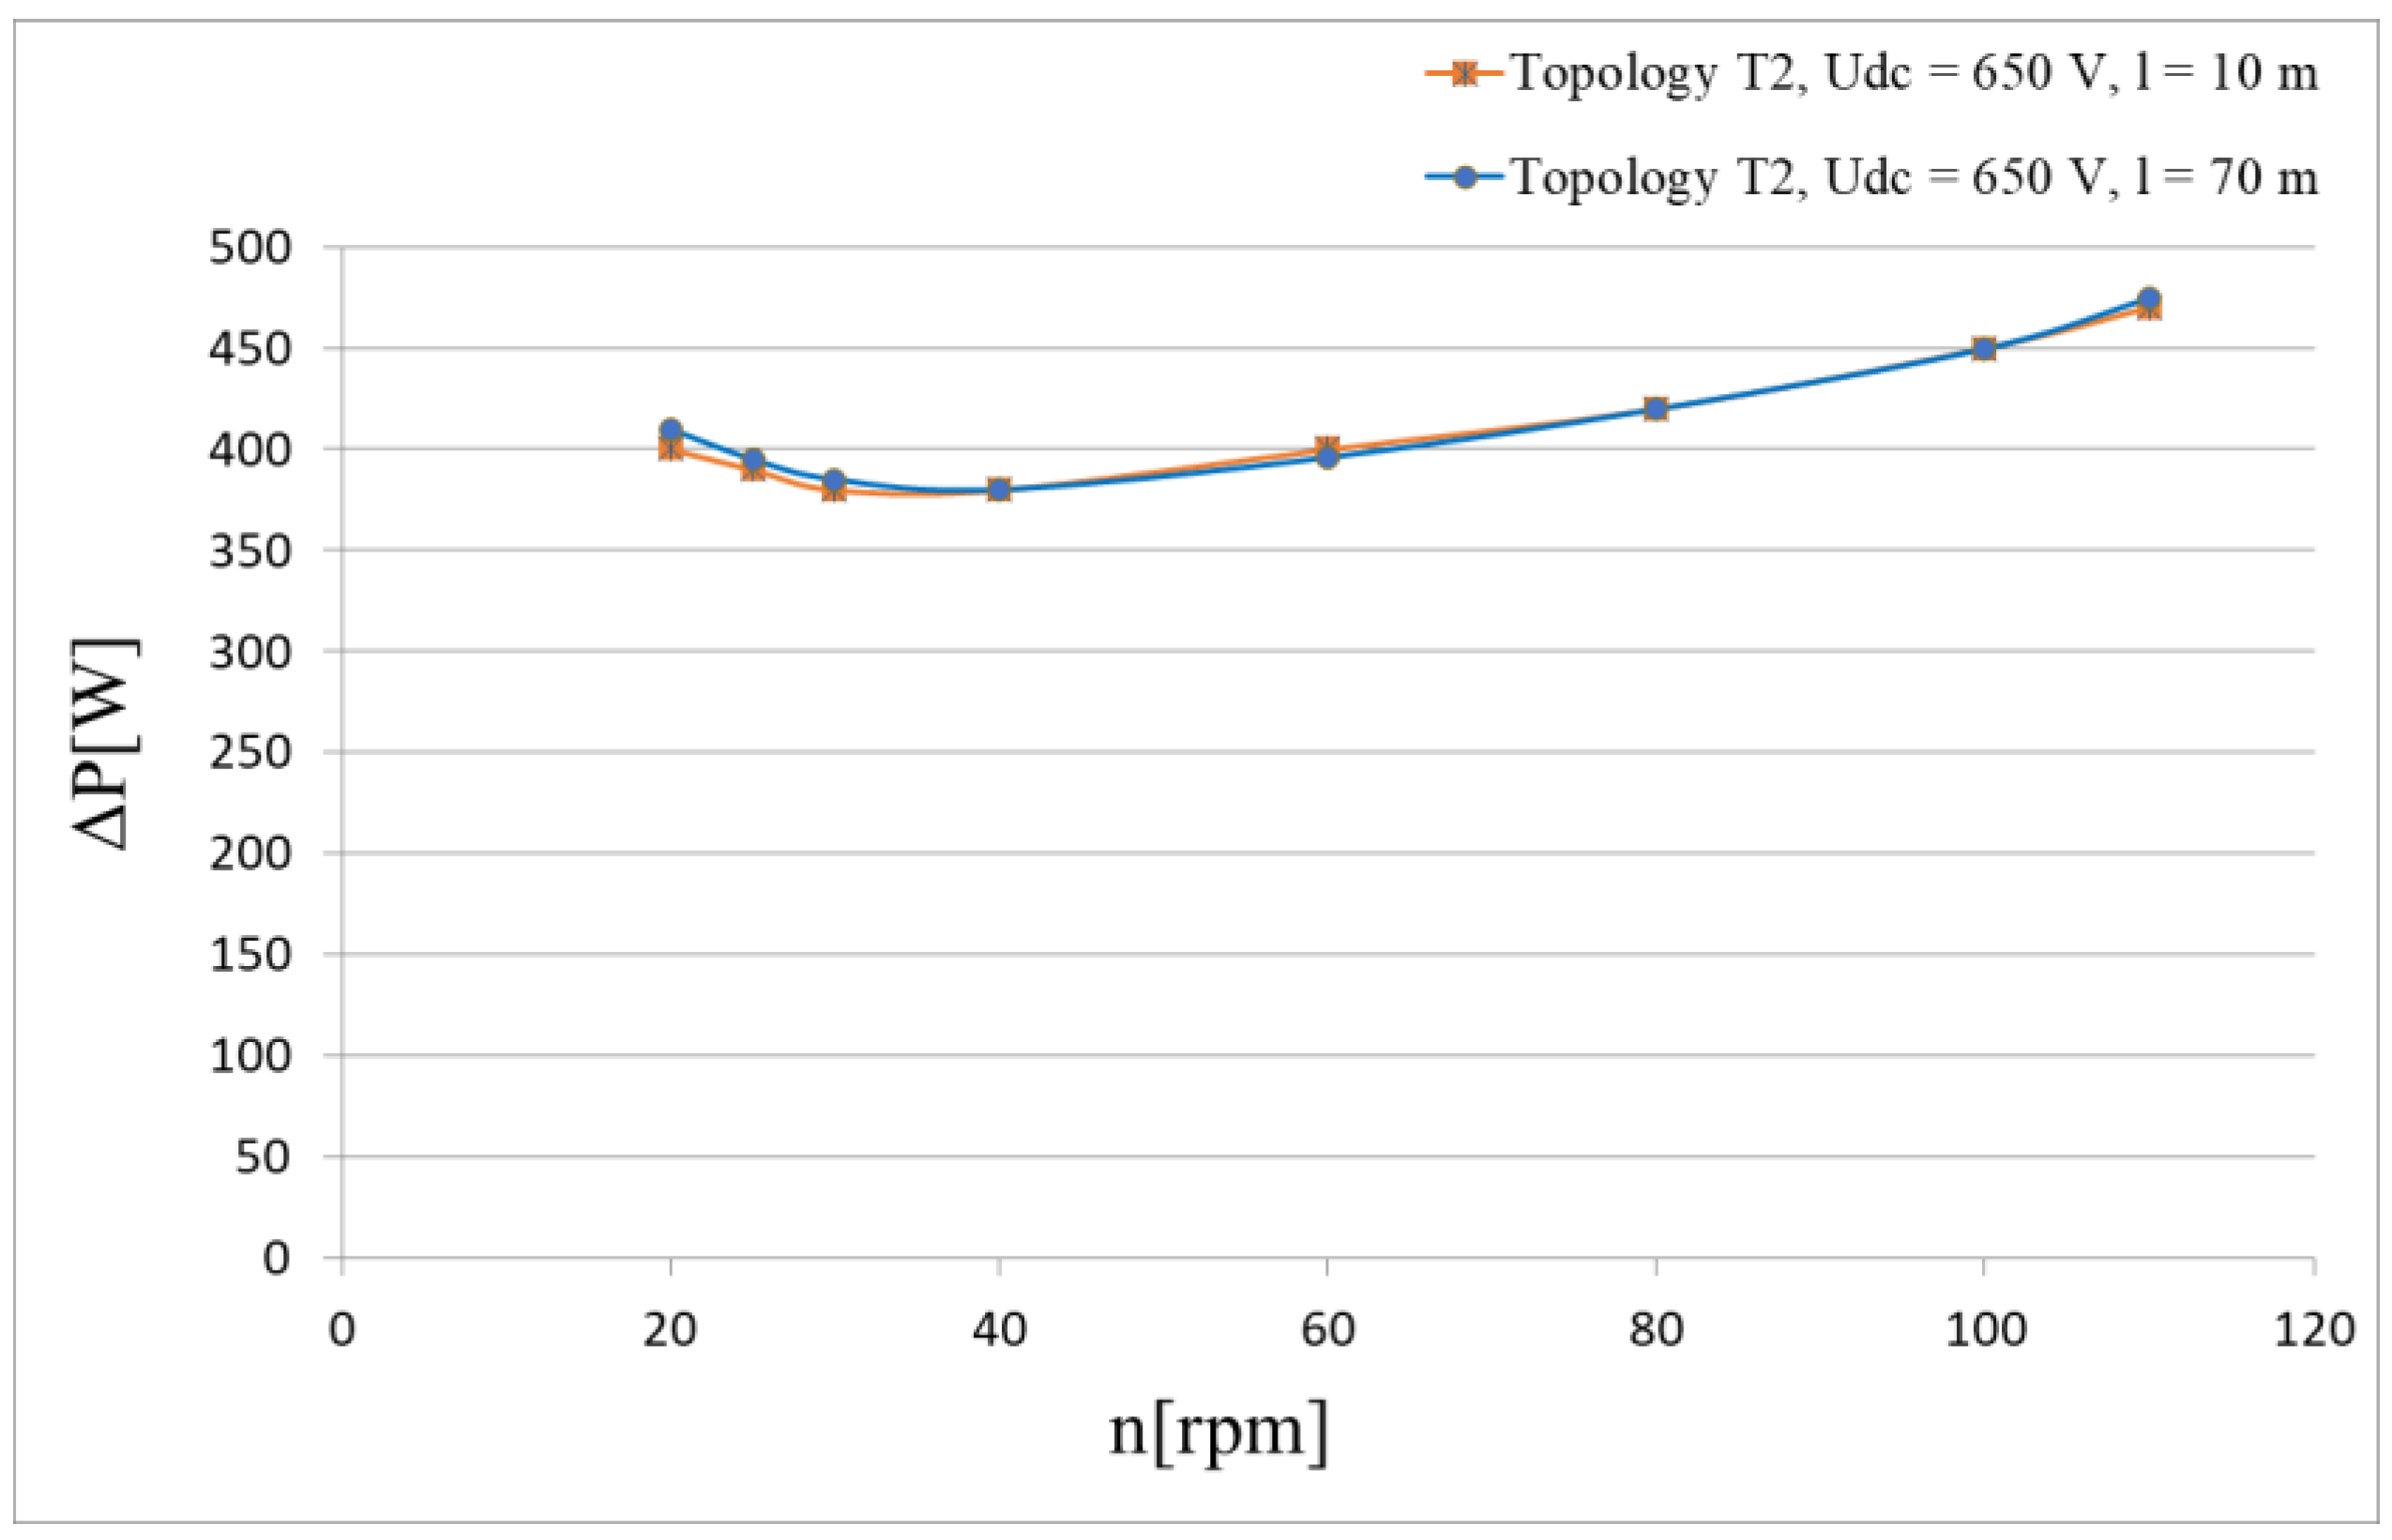
4.5. Effect of Generator-to-Converter Cable Length on Power Losses in Converters

Another problem considered in the article is the effect of the length of the cable connecting the generator to the converter whose parasitic RLC parameters affect the losses in it. The tests were carried out for two lengths of cable: 10 m and 70 m. The current and voltage waveforms at generator terminals depend on the converter voltage shape. In the case of the topology T1, the output voltage of the converter has a rectangular shape with significant values of du/dt (Figure 13a). Such step changes of the voltage generate oscillations in the resonant circuit consisting of equivalent resistance L and C of the cable connecting the generator and the converter, attenuated by the equivalent resistance of the cable R. The changes, which are shown in Figure 13b,c primarily cause overvoltages up to twice the value of the Udc on the generator and cause the flow of resonant currents that generate significant power losses in the system (Figure 14). Therefore, the length of the connecting cable also does not affect the losses in the converter of the topology T2. Comparing the power losses of both topologies with a long 70 m connecting cable (Figure 15 and Figure 16), the topology T2 is characterized by significantly lower losses, especially at low generator rotational speeds.
Figure 16 compares the losses in the T1 topology converter, which are greater in the converter using a longer cable connecting the generator to the converter. This is because the transistors and diodes switch currents with a higher value which is due primarily to the capacitance of the cables and their resonant nature.
Figure 14 shows power losses in the T1 system which increase in the topology with a 70 m cable connecting the generator to the converter (in comparison to the topology with a 10 m cable), from 50 W to 150 W together with an increase in the switching frequency of the generator converter in the range from 31 kHz to 57 kHz, and with a decrease in the speed of the generator from 110 rpm to 25 rpm.
In the case of the topology T2, the shape of the voltage is due to the interaction of a three-phase generator with a three-phase bridge rectifier with a capacitive filter. In the absence of fast step changes of the converter input voltage and large current derivatives in the system, there are also no related phenomena, and the voltage and current at the beginning and end of the connecting cable are practically the same (Figure 15).

4.6. Losses in the Generator

In accordance with Figure 4, power measurements were also made at the input of the motor driving the PM generator. The difference between PM and PGEN corresponds to the sum of the power losses in the motor driving the generator, the gearbox and the generator. The first two components are the same in both converter topologies, whereas the power losses in the generator (losses in copper and in iron) depend primarily on the shape of its voltage and current. In the topology T1 (Figure 13a), the current is practically sinusoidal, while the voltage has a number of higher harmonics. The topology T2 (Figure 15) is characterized by a very high level of low-order current harmonics, especially 5th and 7th, and similarly for voltage, however, the lower the speed, the higher the level of higher voltage harmonics and also the losses in the generator. The size of the losses is mainly determined by higher voltage harmonics (losses in iron), which is confirmed by Figure 17. In addition, the 5th and 7th current harmonics cause torque ripples which in turn cause vibrations resulting in noisy work.

5. Conclusions

Table 2 summarises the conclusions from the test results of two representative converter system topologies operating with wind turbines. Their properties are determined not only by the topology but also by the components used for their implementation (transistors, diodes, chokes and capacitors) and control methods characterized by sampling and switching frequency.
When choosing a topology, it is important to consider the expected range of changes in the turbine speed: if high generator speeds prevail, then the topology T1 is more favorable due to the efficiency of energy conversion. However, if average and low turbine speeds predominate, then the topology T2 is more advantageous due to the lower losses and the lower speeds at which energy is put into the grid. When choosing a control method, it is important to consider the lowest possible switching frequency of transistors and the minimum voltage in the DC circuit, which will reduce losses, especially in the topology T1. In the case of large distances between the generator converter and the generator, the topology T2 is characterized by much lower losses; however, at low speeds the losses in the generator will be slightly higher (Figure 17).
The data collected in Table 2 compare two topologies of a particular design, so the obtained results should not be generalized. However, most of the conclusions indicate a trend in changes which can be used when making the decision on the choice of topology, operating parameters or control methods.

Author Contributions

Concept of the research, A.S. and P.F.; methodology, A.S., P.F. and M.K.; software, P.F.; validation: P.F. and M.K.; formal analysis, A.S. and P.F; investigation, A.S., P.F. and M.K.; resources, A.S. and P.F.; data curation, P.F.; writing—original draft preparation, A.S.; writing—review and editing, A.S. and P.F.; visualization, P.F. and M.K.; supervision, A.S. and P.F.; project administration, A.S.; funding acquisition, A.S. All authors have read and agreed to the published version of the manuscript.

Funding

This work was supported by project WZ/WE-IA/5/2020 of the Bialystok University of Technology and financed from a subsidy provided by the Ministry of Science and Higher Education.

Institutional Review Board Statement

Not applicable.

Informed Consent Statement

Not applicable.

Acknowledgments

The authors gratefully acknowledge support from the Faculty of Electrical Engineering, Bialystok University of Technology, in covering the publication costs.

Conflicts of Interest

The authors declare no conflict of interest.

References

  1. Zhao, Y.; Wei, C.; Zhang, Z.; Qiao, W. Review on position/speed sensorless control for permanent-magnet synchronous machine-based wind energy conversion systems. IEEE J. Emerg. Sel. Top. Power Electron. 2013, 1, 203–216. [Google Scholar] [CrossRef]
  2. Beainy, A.; Maatouk, C.; Moubayed, N.; Kaddah, F. Comparison of different types of generator for wind energy conversion system topologies. In Proceedings of the 3rd International Conference on Renewable Energies for Developing Countries, Zouk Mosbeh, Lebanon, 13–15 July 2016. [Google Scholar]
  3. Hansen, A.D.; Iov, F.; Blaabjerg, F. Review of contemporary wind turbine concepts and their market penetration. Wind Eng. 2004, 28, 247–263. [Google Scholar] [CrossRef]
  4. Yaramasu, V.; Wu, B.; Sen, P.C.; Kouro, S.; Narimani, M. High-power wind energy conversion systems: State-of-the-art and emerging technologies. Proc. IEEE 2015, 103, 740–788. [Google Scholar] [CrossRef]
  5. Honrubia-Escribano, A.; Jiménez-Buendía, F.; Sosa-Avendaño, J.; Gartmann, P.; Frahm, S.; Fortmann, J.; Sørensen, P.; Gómez-Lázaro, E. Fault-Ride Trough validation of IEC 61400-27-1 type 3 and type 4 models of different wind turbine manufacturers. Energies 2019, 12, 3039. [Google Scholar] [CrossRef] [Green Version]
  6. Sekhar, K.R.; Barot, R.; Patel, P.; Kumar, N.V. R.; Barot, R.; Patel, P.; Kumar, N.V. A novel topology for improved DC bus utilization in PMSG based wind energy generation system. In Proceedings of the 4th International Conference on Renewable Energy Research and Applicationc, Palermo, Italy, 27–30 August 2015. [Google Scholar]
  7. Arthishri, K.; Kumaresan, N.; Gounden, N.A. Analysis and application of three-phase SEIG with power converters for supplying single-phase grid from wind energy. IEEE Syst. J. 2019, 13, 1813–1822. [Google Scholar] [CrossRef]
  8. Yaramasu, V.; Wu, B.; Rivera, M.; Rodriguez, J. A new power conversion system for megawatt PMSG wind turbines using four-level converters and a simple control scheme based on two-step model predictive strategy—part II. J. Emerg. Sel. Top. Power Electron. 2014, 2, 14–25. [Google Scholar] [CrossRef]
  9. Dawande, M.S.; Dubey, G.K. Programmable input power factor correction method for switch-mode rectifiers. Trans. Power Electron. 1996, 11, 585–590. [Google Scholar] [CrossRef]
  10. Echchaachouail, A.; El Hanil, S.; Hammouch, A.; Guedira, S.; Dahil, K. Low-cost maximum power point tracking structure of a grid connected wind conversion chain based on a PMSG. In Proceedings of the 2nd International Conference on Electrical and Information Technologies, Tangier, Morocco, 4–7 May 2016. [Google Scholar]
  11. Mouli, G.R.C.; Schijffelen, J.H.; Bauer, P.; Zeman, M. Design and comparison of a 10-kW interleaved Boost Converter for PV application using Si and SiC devices. IEEE J. Emerg. Sel. Top. Power Electron. 2017, 5, 610–623. [Google Scholar] [CrossRef] [Green Version]
  12. Chen, L.; Soong, W.L.; Pathmanathan, M.; Ertugrul, N. Comparison of AC/DC converters and the principles of a new control strategy in small-scale wind turbine systems. In Proceedings of the 22nd Australasian Universities Power Engineering Conference, Bali, Indonesia, 26–29 September 2012. [Google Scholar]
  13. Zhang, Z.; Wang, F.; Acikgoz, M.; Caiand, X.; Kennel, R. FPGA HiL simulation of back-to-back converter PMSG by wind turbine systems. In Proceedings of the 9th International Conference on Power Electronics-ECCE Asia, Seoul, Korea, 1–5 June 2015. [Google Scholar]
  14. Davari, M.Y.; Mohamed, Y.A.I. Robust DC-Link voltage control of a full-scale PMSG wind turbine for effective integration in DC grids. IEEE Trans. Power Electron. 2017, 32, 4021–4035. [Google Scholar] [CrossRef]
  15. Dey, P.; Datta, M.; Fernando, N. Comparisons of PI and PR current controllers based flux weakening to limit DC-link capacitor overvoltage in PMSG based wind energy system. In Proceedings of the IEEE Innovative Smart Grid Technologies–Asia, Melbourne, Australia, 28 November–1 December 2016. [Google Scholar]
  16. Xu, Y.; Nian, H.; Chen, L. Small-Signal Modeling and Analysis of DC-Link Dynamics in Type-IV Wind Turbine System. IEEE Trans. Ind. Electron. 2021, 68, 1423–1433. [Google Scholar] [CrossRef]
  17. Karaagac, U.; Mahseredjian, J.; Gagnon, R.; Gras, H.; Saad, H.; Cai, L.; Kocar, I.; Haddad, A.; Farantatos, E.; Bu, S.; et al. A Generic EMT-type model for wind Parks with permanent magnet synchronous generator full size converter wind turbines. IEEE Power Energy Technol. Syst. 2019, 6, 131–141. [Google Scholar] [CrossRef]
  18. Radwan, A.A.A.; Mohamed, Y.A.I. Grid-connected wind-solar cogeneration using back-to-back voltage-source converters. IEEE Trans. Sustain. Energy 2020, 11, 315–325. [Google Scholar] [CrossRef]
  19. Campos-Gaona, D.; Stock, A.; Anaya-Lara, O.; Leithead, W. Dynamic wind power plant control for system integration using the generator response following concept. Energies 2020, 13, 1804. [Google Scholar] [CrossRef] [Green Version]
  20. Ma, Y.; Yang, X.; Zhou, X.; Yang, L.; Zhou, Y. Dual closed-loop linear active disturbance rejection control of grid-side converter of permanent magnet direct-drive wind turbine. Energies 2020, 13, 1090. [Google Scholar] [CrossRef] [Green Version]
  21. Zhang, Z.; Li, Z.; Kazmierkowski, M.P.; Rodrıguez, J.; Kennel, R. Robust predictive control of three-level NPC back-to-back power converter PMSG wind turbine systems with revised predictions. IEEE Trans. Power Electron. 2018, 33, 9588–9598. [Google Scholar] [CrossRef]
  22. Kim, N.; Kim, G.-H.; Kim, K.-M.; Park, M.; Yu, I.-K.; Lee, S.; Song, E.; Kim, T.-W. Comparative analysis of 10 MW class gearedand gearless type superconducting synchronous generators for a wind power generation system. IEEE Trans. Appl. Supercond. 2012, 22, 5202004. [Google Scholar]
  23. Chu, J.; Yuan, L.; Hu, Y.; Pan, C.; Pan, L. Comparative analysis of identification methods for mechanical dynamics of large-scale wind turbine. Energies 2019, 12, 3429. [Google Scholar] [CrossRef] [Green Version]
  24. Sun, P.; Yao, J.; Liu, R.; Pei, J.; Zhang, H.; Liu, Y. Virtual capacitance control for improving dynamic stability of the DFIG-based wind turbines during a symmetrical fault in a weak AC grid. IEEE Trans. Ind. Electron. 2021, 68, 333–346. [Google Scholar] [CrossRef]
  25. Kavousi, A.; Fathi, S.H.; Milimonfared, J.; Soltani, M.N. Application of boost converter to increase the speed range of dual-stator winding induction generator in wind power systems. IEEE Trans. Power Electron. 2018, 33, 9599–9610. [Google Scholar] [CrossRef] [Green Version]
  26. Brando, G.; Dannier, A.; Spina, I. Performance analysis of a full order sensorless control adaptive observer for doubly-fed induction generator in grid connected operation. Energies 2021, 14, 1254. [Google Scholar] [CrossRef]
  27. Zhou, D.; Zhang, G.; Blaabjerg, F. Optimal selection of power converter in DFIG wind turbine with enhanced system-level reliability. IEEE Trans. Ind. Appl. 2018, 54, 3637–3644. [Google Scholar] [CrossRef] [Green Version]
  28. Vernica, I.; Ma, K.; Blaabjerg, F. Optimal derating strategy of power electronics converter for maximum wind energy production with lifetime information of power devices. IEEE J. Emerg. Sel. Top. Power Electron. 2018, 6, 267–276. [Google Scholar] [CrossRef]
  29. Blaschke, F. The principle of field orientation as applied to the new transvector closed-loop control system for rotating field machines. Siemens Rev. 1972, 34, 217–220. [Google Scholar]
  30. Kheralnwala, H.; Divan, D.M. Delta modulation strategies for resonant link inverters. IEEE Trans. Power Electron. 1990, 5, 220–228. [Google Scholar] [CrossRef]
  31. Steele, R. Delta Modulation Systems; Pentech Press &Halsted Press: London, UK, 1975. [Google Scholar]
  32. Sikorski, A.; Kuzma, A. Cooperation of induction squirrel-cage generator with grid connected AC/DC/AC converter. Bull. Pol. Acad. Sci. Tech. Sci. 2009, 57, 317–322. [Google Scholar] [CrossRef] [Green Version]
Figure 1. Structure of converters: (a) generator with topology T1; (b) generator with topology T2 and (c) grid.
Energies 14 06574 g001
Figure 2. Converter control scheme—topology T1.
Energies 14 06574 g002
Figure 3. Converter control scheme—topology T2.
Energies 14 06574 g003
Figure 4. Energy conversion system with a generator converter: (a) topology T1 and (b) topology T2 and the method of power measurement in both systems.
Energies 14 06574 g004
Figure 5. Photographs of the laboratory stand: (a) generator drive with drive motor and its power supply and (b) converters (topology T1 and T2) with the control panel.
Energies 14 06574 g005
Figure 6. Oscillograms representing the operation of converters with T1 and T2 topologies: (a) the voltage and output currents of the AC/DC converter fed to the grid; (b) the input currents and input voltage of the DC/DC converter of the topology T2; (c) the current and output voltage of one phase of the grid converter and the current and phase-to-phase voltage of the generator—topology T1; (d) T2; (e) the current and phase-to-phase output voltage of the grid converter and the current and phase-to-phase voltage of the generator at zero power fed to the grid—topology T1, (f) T2.
Energies 14 06574 g006
Figure 7. Power transmitted to the grid at maximum power generated in the generator for different generator speeds for the two converter topologies: (a) T1 and T2 (15.3 A, Udc = 600 V) and (b) a zoomed-in section of the waveform at turbine speeds below 30 rpm.
Energies 14 06574 g007aEnergies 14 06574 g007b
Figure 8. Power losses in the T1 and T2 topologies at Udc = 600 V.
Energies 14 06574 g008
Figure 9. Power losses in the T1 and T2 topologies at Udc = 650 V.
Energies 14 06574 g009
Figure 10. (a) Power losses in the converter system of the topology T1 at different voltages in the DC circuit and (b) switching frequency fsw of the transistors in both converters at Udc = 600 V.
Energies 14 06574 g010
Figure 11. (a) Power losses in the topology T2 at different voltages in the DC circuit and (b) switching frequency of the grid converter transistors fsw and the generator converter pulse duty δ at Udc = 600 V.
Energies 14 06574 g011
Figure 12. (a) Power losses in the topology T1 depending on the sampling frequency for fs = 40 kHz and 20 kHz and (b) switching frequency of the fsw transistors in both converters at Udc = 600 V.
Energies 14 06574 g012
Figure 13. Generator voltage and current waveform from the side of: (a) generator converter, (b) generator and (c) the same waveforms in the reduced timescale window.
Energies 14 06574 g013
Figure 14. Power losses in converters of the topology T1 depending on the length of the cable connecting the generator to the converter.
Energies 14 06574 g014
Figure 15. Waveform of the voltage and current of the generator with the diode rectifier (topology T2).
Energies 14 06574 g015
Figure 16. Power losses in converters of the topology T2 depending on the length of the cable connecting the generator and the converter.
Energies 14 06574 g016
Figure 17. Total power losses in the gearbox drive motor and the generator PSGG.
Energies 14 06574 g017
Table 1. Technical parameters.
DeviceParameterUnitsData
Synchronous
Generator
Rated output power PN kW10
Rated speed nrpm100
Rated output voltage (ph-ph)V380
Rated currentA15.3
Number of pole pairs-12
Efficiency at rated speed%>85
Frequency at rated speedHz23.3
Gear boxGear ratio-12
Drive MotorRated output powerkW12
Rated speedrpm1440
Rated output voltage (ph-ph)V400
Rated currentA21
Drives Inverter
Yaskawa
Rated output powerkW18.6
Rated output voltage (ph-ph)V400
Rated currentA27
Table 2. Comparison of the characteristics of the AC/DC DC/AC converter with the DC/DC DC/AC converter.
CharacteristicTopology T1Topology T2
Speed range when power is transferred to the gridSmallerLarger
Losses in the range of (1.0–0.5) nLowHigh
Losses in the range of (0.5–0.15) nHighLow
Dependence of losses on UdcHighLow
Power losses in the generatorHighLow
Mechanical vibration and noiseNoneHigh
Publisher’s Note: MDPI stays neutral with regard to jurisdictional claims in published maps and institutional affiliations.

