Review

Modeling and Estimation of Break Arc Extinction Distance in Low Voltage DC Systems

1
Energy Valley R&D Center, Korea Electric Power Research Institute, 55, Jeollyeok-ro, Naju 583-22, Jeonnam, Korea
2
Division of Electrical, Electronic and Control Engineering, Kongju National University, 275 Budae, Cheonan 310-80, Chungnam, Korea
*
Author to whom correspondence should be addressed.
Energies 2021, 14(20), 6646; https://doi.org/10.3390/en14206646
Submission received: 6 August 2021 / Revised: 21 September 2021 / Accepted: 5 October 2021 / Published: 14 October 2021
(This article belongs to the Special Issue DC Circuit Breaker Technologies State of Art)

Abstract

:
Recently, as DC power generation and DC loads such as renewable energy and EVs increase, the need for a low-voltage direct current (LVDC) distribution system has gradually emerged. The DC system has various advantages, such as system stability, transmission efficiency, and connectivity to renewable power generation compared to AC distribution systems. One of the important technical issues for commercialization of DC distribution system is safety. Since the DC system does not have a current zero point, unlike the AC system, a breaking arc accompanied by a high-temperature plasma is easily generated when the circuit is cut off. The arc can cause fire accidents that threaten people and facilities. In order to prevent customers and facilities from the accidents caused by the arc in the DC system, a study on the characteristics of the DC breaking arc is necessary. An important factor of characteristics for the DC breaking arc fault is an arc extinction distance at which the DC breaking arc is completely extinguished. There are two major behaviors in DC breaking arc; one is active behavior where the arc voltage is inversely related with the arc current for a given gap distance, the other is passive behavior where the arc voltage is negatively proportional to the arc current according to Kirchhoff’s voltage rule. This paper combines the two arc characteristics together to establish a DC breaking arc model, and proposes a method to estimate the arc extinction distance. Experiment results verify the method under various power and load conditions.

1. Introduction

With the developments of alternative energy technologies to cope with problems such as depletion of energy resources and climate change due to the use of fossil fuels, the power generation of renewable energy continues to increase [1,2]. Outputs of power generation by renewable energy such as wind power or solar power are mostly DC. In the past, the AC system led the transmission and distribution system due to transmission convenience using a transformer. Recently, with the development of power electronics technology, HVDC transmission technology solved the transmission problem of the DC system [3,4,5]. In case of power transmission for long distance, HVDC transmission is even more cost-effective than HVAC. Moreover, DC loads are rapidly increasing; commercial DC loads based on profitability and economy, household DC loads according to efficiency, and transportation DC loads such as electric vehicles [6,7,8,9]. This increase in DC power and DC load amplifies the need for DC distribution systems [10,11,12,13,14,15].
IEEE’s Power Systems Protection Committee (PSPC) introduces the five considerations for the design of low-voltage direct current (LVDC) distribution systems as: power, load, standard, economics, and safety. Among the considerations, safety is emphasized as the most important one [16]. The types of electrical accidents, that hinder the safety of electric customers are classified as electric shock and arc flash [17]. Electric shock is defined as a physiological phenomenon caused by the passage of electricity to the human body, which causes Heart abnormalities. Standard IEC-60479 indicates that marginal current to trigger an abnormal heart rhythm, ventricular fibrillation by electric shock is higher in DC than AC. It means that DC is relatively safer than AC in the event of an electric shock [18].
The other type of electrical accident, arc flash, is defined as the current flowing through the air when there is not enough insulation or isolation between the electric conductors to which the voltage is applied, which can cause fatal fire accidents. Standard NFPA 70E defines arc-flash boundary between workers and exposed live conductors to protect “skilled workers” at the work site [19]. In AC systems, the arc flash vanishes when arc current becomes zero in every half cycle. In DC systems, the arc flash is sustained until sufficient separation distance between the conductors for the arc current to be decreased to zero. It is indicated that marginal current at the same boundary is lower in DC than AC by NFPA 70E. It means that arc flash in DC conditions is more dangerous than AC conditions. Therefore, it is very important to ensure the safety against arc flash in DC systems.
Arc flash is classified into two categories, parallel arc and series arc with respect to current path [20,21]. Parallel arcs are usually caused by short circuit accidents caused by the insulation failure between live wires. If a parallel arc occurs in a condition where sufficient separation distance is not secured, the parallel arc current is equal to the short-circuit current in the installation.
A series arc (or breaking arc) occurs when electrical connections are loosed or when loads and power are cut off by circuit breakers, connectors, and socket outlets-plug. If a breaking arc occurs in an environment where sufficient separation distance is not secured, the breaking arc current is equal to the load current. breaking arcs can occur not only in the working environment performed by experts, but also in everyday life environments such as non-experts removing electrical plugs from socket outlets in their homes. Therefore, to ensure the safety of LVDC distribution systems, studies of breaking arcs occurring in everyday life environments by ordinary customers are necessary.
Arc model simulation is a good way to better understand arcing phenomena [22]. There are two types of dynamic arc models: physics-mathematical models and pure mathematical models. Physics-mathematical models describe arc properties by studying and analyzing the physical processes of arcs that are very complex and difficult to measure [23,24,25,26,27].
A pure mathematical model, or black box model, treats the arc as an electrical component. It only describes the input/output relationship between arc voltage and arc current. Mayr [28] established a black box model at low currents and Cassie [29] at high currents, which have been extended or improved by many researchers [30,31,32,33]. Another example of a dynamic model that takes into account arc shape in experimental observations is a study that modeled arc behavior at zero-crossing of AC current, focusing primarily on high current arcs commonly used in circuit breaker applications [34].
For DC arcs, another type of black box model that considers arc voltage as a function of arc current and arc length is more suitable. Steinmetz [35] first proposed an active arc model of generalized arc voltage as a function of arc current and distance between two electrodes. Later, Nottingham [36] was the first to consider arc voltage as a non-linear function of arc length. Based on these early studies, various DC arc models have been developed. Stokes and Oppenlander observed that instantaneous arc power tends to be more constant than instantaneous arc current or arc voltage [37]. Ammerman developed a method for determining DC arc current similar to the iterative technique developed by Fisher for AC arcs. The nonlinear dc arc resistance was derived from the arc power-current relationship [38,39]. However, the arc depends on the test conditions (e.g., contactor structure, material and gaseous medium), and these conditions differ significantly in the proposed model, which limits their application [40,41].
Paukert presented unique parameters for each arc length using data from seven researchers [42]. Andrea also investigated the static arc characteristics for a constant gap distance [43].
Zhang presented a voltage model for high voltage switching, assuming a constant voltage gradient in the arc and the voltage immediately after contact separation for the copper electrode at currents between 0.5 A and 10 A, but failed to consider the parameters for the arc trigger voltage [44]. Ammar et al. [45] presented the behavior of the average electric field as a function of the current in a rotating contact switch assuming a constant arc field at low constant currents (<5 A). Hyperbolic arc model was proposed as a dynamic series arc model using relative per-unit separation distance and hyperbolic function [46]. The hyperbolic arc model approximates the continuity of dynamic series arc, but design methods for various practical parameters were not suggested. In addition, hyperbolic arc mode is impossible to estimate the dynamic series arc according to the change of actual distance.
The authors discovered through an experiment that the voltage that triggers the arc in the air is about 10 V [47], and presented an arc model that considers the active characteristics of the arc according to the relative distance between the two electrodes and the passive characteristics of the arc according to the circuit conditions [48].
There are two major characteristics associated with the safety of DC breaking arcs. One is the dynamic characteristics of arc voltage and current according to a separation distance between two electrodes. The other is the final real distance when the breaking arcs are completely extinguished. This paper analyzes characteristics of breaking arcs occurring in a pure contact type mechanical DC switch, under various power conditions and load conditions. Estimation methods for real arc-extinction distance, in which breaking arcs end completely and DC series arc (breaking arc) model, is proposed and proved by experiments.

2. DC Breaking Arc-Extinction Distance

2.1. Estimation of Arc Extinction Distance

Figure 1 shows a schematic circuit of mechanical DC switch using a pure contact. The DC breaking arc is caused by opening the two contact electrodes connecting the power source and the load. In Figure 1, VDC is the DC source voltage, RLoad is the load resistance, Iarc is the arc current, Varc is the arc voltage, and la is the separation distance between the two contacts.
To estimate the arc-extinction distance of DC breaking arc, two characteristics should be considered. One is the active characteristics of the arc according to the distance between the two electrodes. The other is the passive characteristics of the arc by circuit conditions. Stainmetz, for the first time, suggested an active arc model of generalized arc voltage according to arc current and the distance between two electrodes [35].
V arc = V min + k a l a i arc 0.5
here, la represents the distance between two contacts and ka stands for empirical constant. Vmin is defined as the minimum arc voltage, which physically refers to the voltage for a first ionization by a collision between a free electron and a gas atom immediately after the opening action of the contacts.
In [47,48], it is experimentally confirmed that the minimum voltage (Vmin) to trigger the DC breaking arc of copper electrodes in the air is approximately 10 V.
In Figure 1, the passive characteristic voltage equation according to the circuit conditions by the Kirchhoff voltage law is as (2) [47].
V arc = V DC i arc R Load
Stainmetz’s arc equation is useful to establish arc model by combining the passive characteristic voltage equation. By substituting the Steinmetz arc voltage in (1) to (2), the arc current equation by the separation distance of the two electrodes can be expressed as follows [48];
i arc 1.5 I Load ( 1 V min V DC ) i arc 0.5 + k a l a R Load = 0
Replacing iarc0.5 with ix, the arc current equation in (3) can be expressed as a 3rd order equation, as shown in Equation (4).
i x 3 I Load ( 1 V min V DC ) i x + k a l a R Load = 0
In (4), la is the only independent variable. It means three roots of ix is determined by la.
D = 4 ( I Load ( 1 V min V DC ) ) 3 27 ( k a l a R Load ) 2
Equation (5) indicates a discriminant equation for the 3rd order Equation of (4). By (5), it is confirmed that the root condition of ix is determined by la.
Figure 2 shows a graph of the root trajectory of the cubic ix equation according to la defined by (4). In Figure 2, the independent variable on the horizontal axis is ix. The vertical axis, f(ix) is defined as (6).
f i x = i x 3 I Load ( 1 V min V DC ) i x = k a l a R Load
When the breaking arc is triggered, the la is nearly zero. In this case, (6) can be expressed as (7).
f i x = { i x 2 I Load ( 1 V min V DC ) } i x = 0
Here, ix has one negative root and two positive roots. If ix has a negative root, the arc current iarc would have no physical meaning because it becomes an imaginary number. The left intersection point of the two real roots of ix is 0, which is physically contradictory because the arc current must be zero (iarc = 0). The value of the intersection point on the right has a physical meaning as described in (8).
i arc = i x 2 = I Load ( 1 V min V DC ) = I Load V min R Load
The value of (8) describes the arc current initiated between the two contacts when the circuit is broken. Since la ≈ 0, the value of the discriminant in (5) is positive (D > 0).
In Figure 2, the value of the discriminant continues to be positive (D > 0), when la increases below lext. It means that the arc sustains just before the separation distance reaches the arc extinction critical distance lext (la < lext). In this case, ix has one negative root and two positive real root, where the value of the larger real root has a physical meaning. It is matched with a physical phenomenon, that the arc current continuously decreases as the separation distance between the two contacts increases.
In Figure 2, when the discriminant value reaches to 0 (D = 0), the separation distance between two contacts is located at the boundary point where the arc is extinguished (la = lext), where ix has one negative root and a double zero root.
In Figure 2, if the discriminant value becomes negative (D < 0), arc does not occur because the separation distance between the two contacts becomes larger than arc extinction distance (la > lext), where ix has one negative root and two imaginary roots. It means that there are no roots of ix that have a physical meaning. Thus, there is no arc current (arc terminated).
If the discriminant of (5) is 0, separation distance between both contacts la is the same with arc extinction distance lext, at which the breaking arc is extinguished. lext can be derived as in (9) through (5).
l ext = 2 R Load k a I Load 3 ( 1 V min / V DC ) 3 27

2.2. Estimation of the Empirical Constant ka

By (9), it is indicated that the arc extinction distance lext of the DC breaking arc can be estimated by the load resistance, load current, and power supply voltage. However, in order to estimate the arc extinction distance lext of the DC breaking arc from (9), the arc empirical constant ka of the Steinmetz arc voltage equation must be known in (1).
By (9), The derivation equation of ka according to the experimental arc extinction distance lext_exp is as follows.
k a = 2 R Load l ext _ exp I Load 3 ( 1 V min / V DC ) 3 27

3. Experiment

3.1. Experiment Condition

This paper conducts DC breaking arc experiments under various source voltage and load power conditions to analyze the characteristics of arc extinction distance in pure contact type mechanical DC switches. Figure 3 shows an experimental device, as a prototype mechanical DC switch to demonstrate DC breaking arc. The experimental device consists of a stepping motor to control the distance and speed of the moving contact in the DC switch. The separation distance between the two electrodes can be adjusted to 20 um per unit pulse by a stepping motor. The material of each contact is copper and has a diameter of 5 mm. The DC source voltage is configured by series connections of lead acid batteries.
Table 1 shows the experimental conditions. In this study, DC source voltage conditions were selected in 10 cases, ranging from 12 V to 400 V. Power conditions is selected in 9 cases, considering that ordinary households is less than or equal to 4 kW. The two contact electrodes have separation speeds of 80 mm/s and 10 mm/s. The gas medium around the prototype mechanical DC switch is air, and the maximum separation distance between the two contacts is 30 mm. The arc behavior is sensitive on the temperature and humidity. The experiment was done in an air conditioned room where the temperature was controlled between 24~26 degrees C, and the humidity was controlled between 60~70%.

3.2. Experiment Results

In the experiments, arc extinction distance is defined as the separation distance, where the DC breaking arc between the two contacts ends completely. The distance can be computed by multiplying the mean arc extinction time and the contact separation speed. In every experimental condition, five repeated experiments were conducted to ensure statistical reliability of results.
Figure 4 shows the average arc extinction distance under various source voltage and load power levels. In Figure 4, the solid line represents the arc extinction distance with a separation speed of 10 mm/s, and the dashed line represents the arc extinction distance with a separation speed of 80 mm/s. Here, the marks on the line graph represent load power level; the mark (○) is for 500 W, the mark (◇) is for 800 W, the mark (▲) is for 1 kW, the mark (■) is for 2 kW, the mark (●) is for 3 kW, and the mark (◆) is for 4 kW.
From Figure 4, it can be shown that the characteristics for the average arc extinction distance are greatly different before and after DC supply voltage of 200 V. From Figure 3, it can be seen that the characteristics of the average extinguishing distance of the blocking arc vary based on the power supply voltage of 200 V.
When the supply voltage is less than 200 V, the average arc extinction distance is dependent on the three factors; separation speed, supply voltage, and load power. However, when the supply voltage is more than 200 V, the average arc extinction distance is mostly independent of the separation speed and supply voltage.
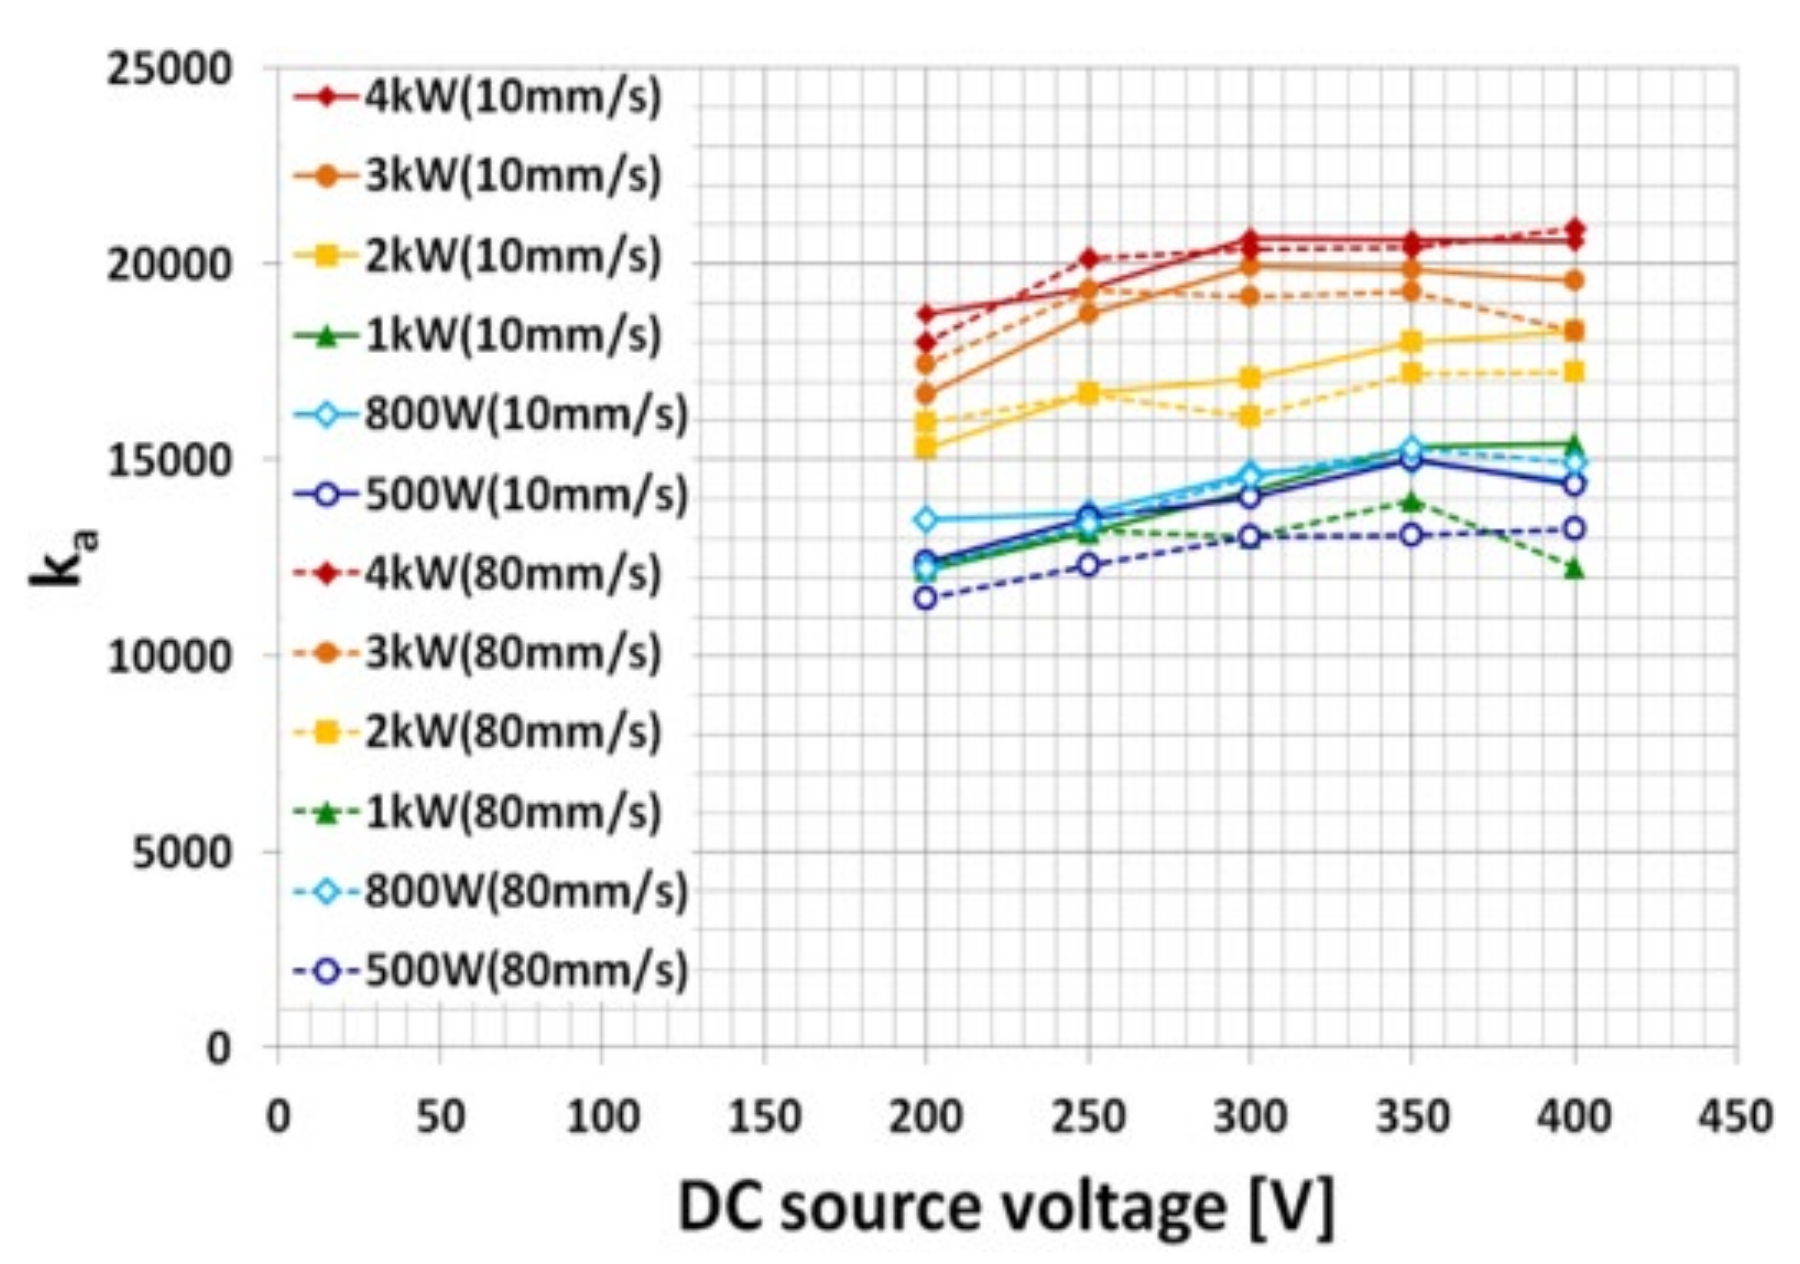
It can be shown that it is dependent almost only on the load power. Based on the experimental results in Figure 4, the empirical constant ka of the Steinmetz arc voltage equation obtained in (10) is analyzed in the next two sub sections.

3.2.1. Source Voltage < 200 V

Figure 5 is the empirical constant ka of the Steinmetz arc voltage equation calculated by (10) based on the experimental results in Figure 4, when the source voltage is under 200 V. In Figure 5, the solid line is the experimental value of the empirical constant ka with a separation speed of 10 mm/s, the dashed line is the empirical constant ka with a separation speed of 80 mm/s. Here, the marks on the line graph represent load power level as; the mark (■) is for 1 kW, the mark (◆) is for 800 W, and the mark (●) is for 500 W.
Figure 6 shows average experimental value and estimation curve of arc constant ka according to source voltage. The mark (■) in Figure 6 is for the average experimental value of the arc empirical constant ka for the separation speed 10 mm/s, the mark (▲) is for the average experimental value of the arc empirical constant ka for the separation speed 80 mm/s.
The dashed line represents the estimated curve of the arc constant ka for the separation speed of 10 mm/s, and the dash-dot line represents the estimated curve of the arc constant ka for the separation speed of 80 mm/s.
From the experimental data in Figure 6, the estimation model of the arc constant ka_est according to the supply voltage below 200 V can be derived in the form of a polynomial function as Equation (11).
k a _ est = 2.37 · 10 14 v sep + 4.9 · 10 14 ( V DC + 1.157 v sep + 11.57 ) 5 + 10000
Here, vsep means the separation speed.

3.2.2. Source Voltage > 200 V

Figure 7 is the empirical constant ka calculated by (10) based on the experimental results in Figure 4 when the source voltage is over 200 V. In Figure 7, the solid line in is the experimental value of the empirical constant ka for the separation speed of 10 mm/s, the dashed line is the experimental value of the empirical constant ka for the separation speed of 80 mm/s. Here, the marks on the line graph represent load power level; the mark (○) is for 500 W, the mark (◇) is for 800 W, the mark (▲) is for 1 kW, the mark (■) is for 2 kW, the mark (●) is for 3 kW, and the mark (◆) is for 4 kW. Figure 7 shows that, when the supply voltage is more than 200 V, the experimental value of the empirical constant ka is mostly independent of the separation speed and supply voltage. It is almost dependent only on the load power level.
Figure 8 shows the average experimental value and estimation curve of the arc constant ka according to the load power level under the condition that the power supply voltage is higher than 200 V. In Figure 8, the mark (■) is for the average experimental value of the arc constant ka for the separation speed 10 mm/s, the mark (▲) is for the average experimental value of the arc constant ka for the separation speed 80 mm/s, and the dashed line is the estimated curve of the arc constant ka according to the load power level.
In Figure 8, the arc constant ka can be assumed to be a linear equation according to the load power. Thus, the estimation model of the arc constant ka according to the load power under the supply voltage of 200 V or higher can be expressed as follows.
k a _ est = 2.03 · P Load + 12147
It means that by applying the arc constant ka estimation models (11) and (12) to (9), the extinction distance of the breaking arc can be accurately estimated under various power supply voltage conditions and load conditions.

3.3. Verification of Estimated Arc Constant ka_est

3.3.1. Source Voltage < 200 V

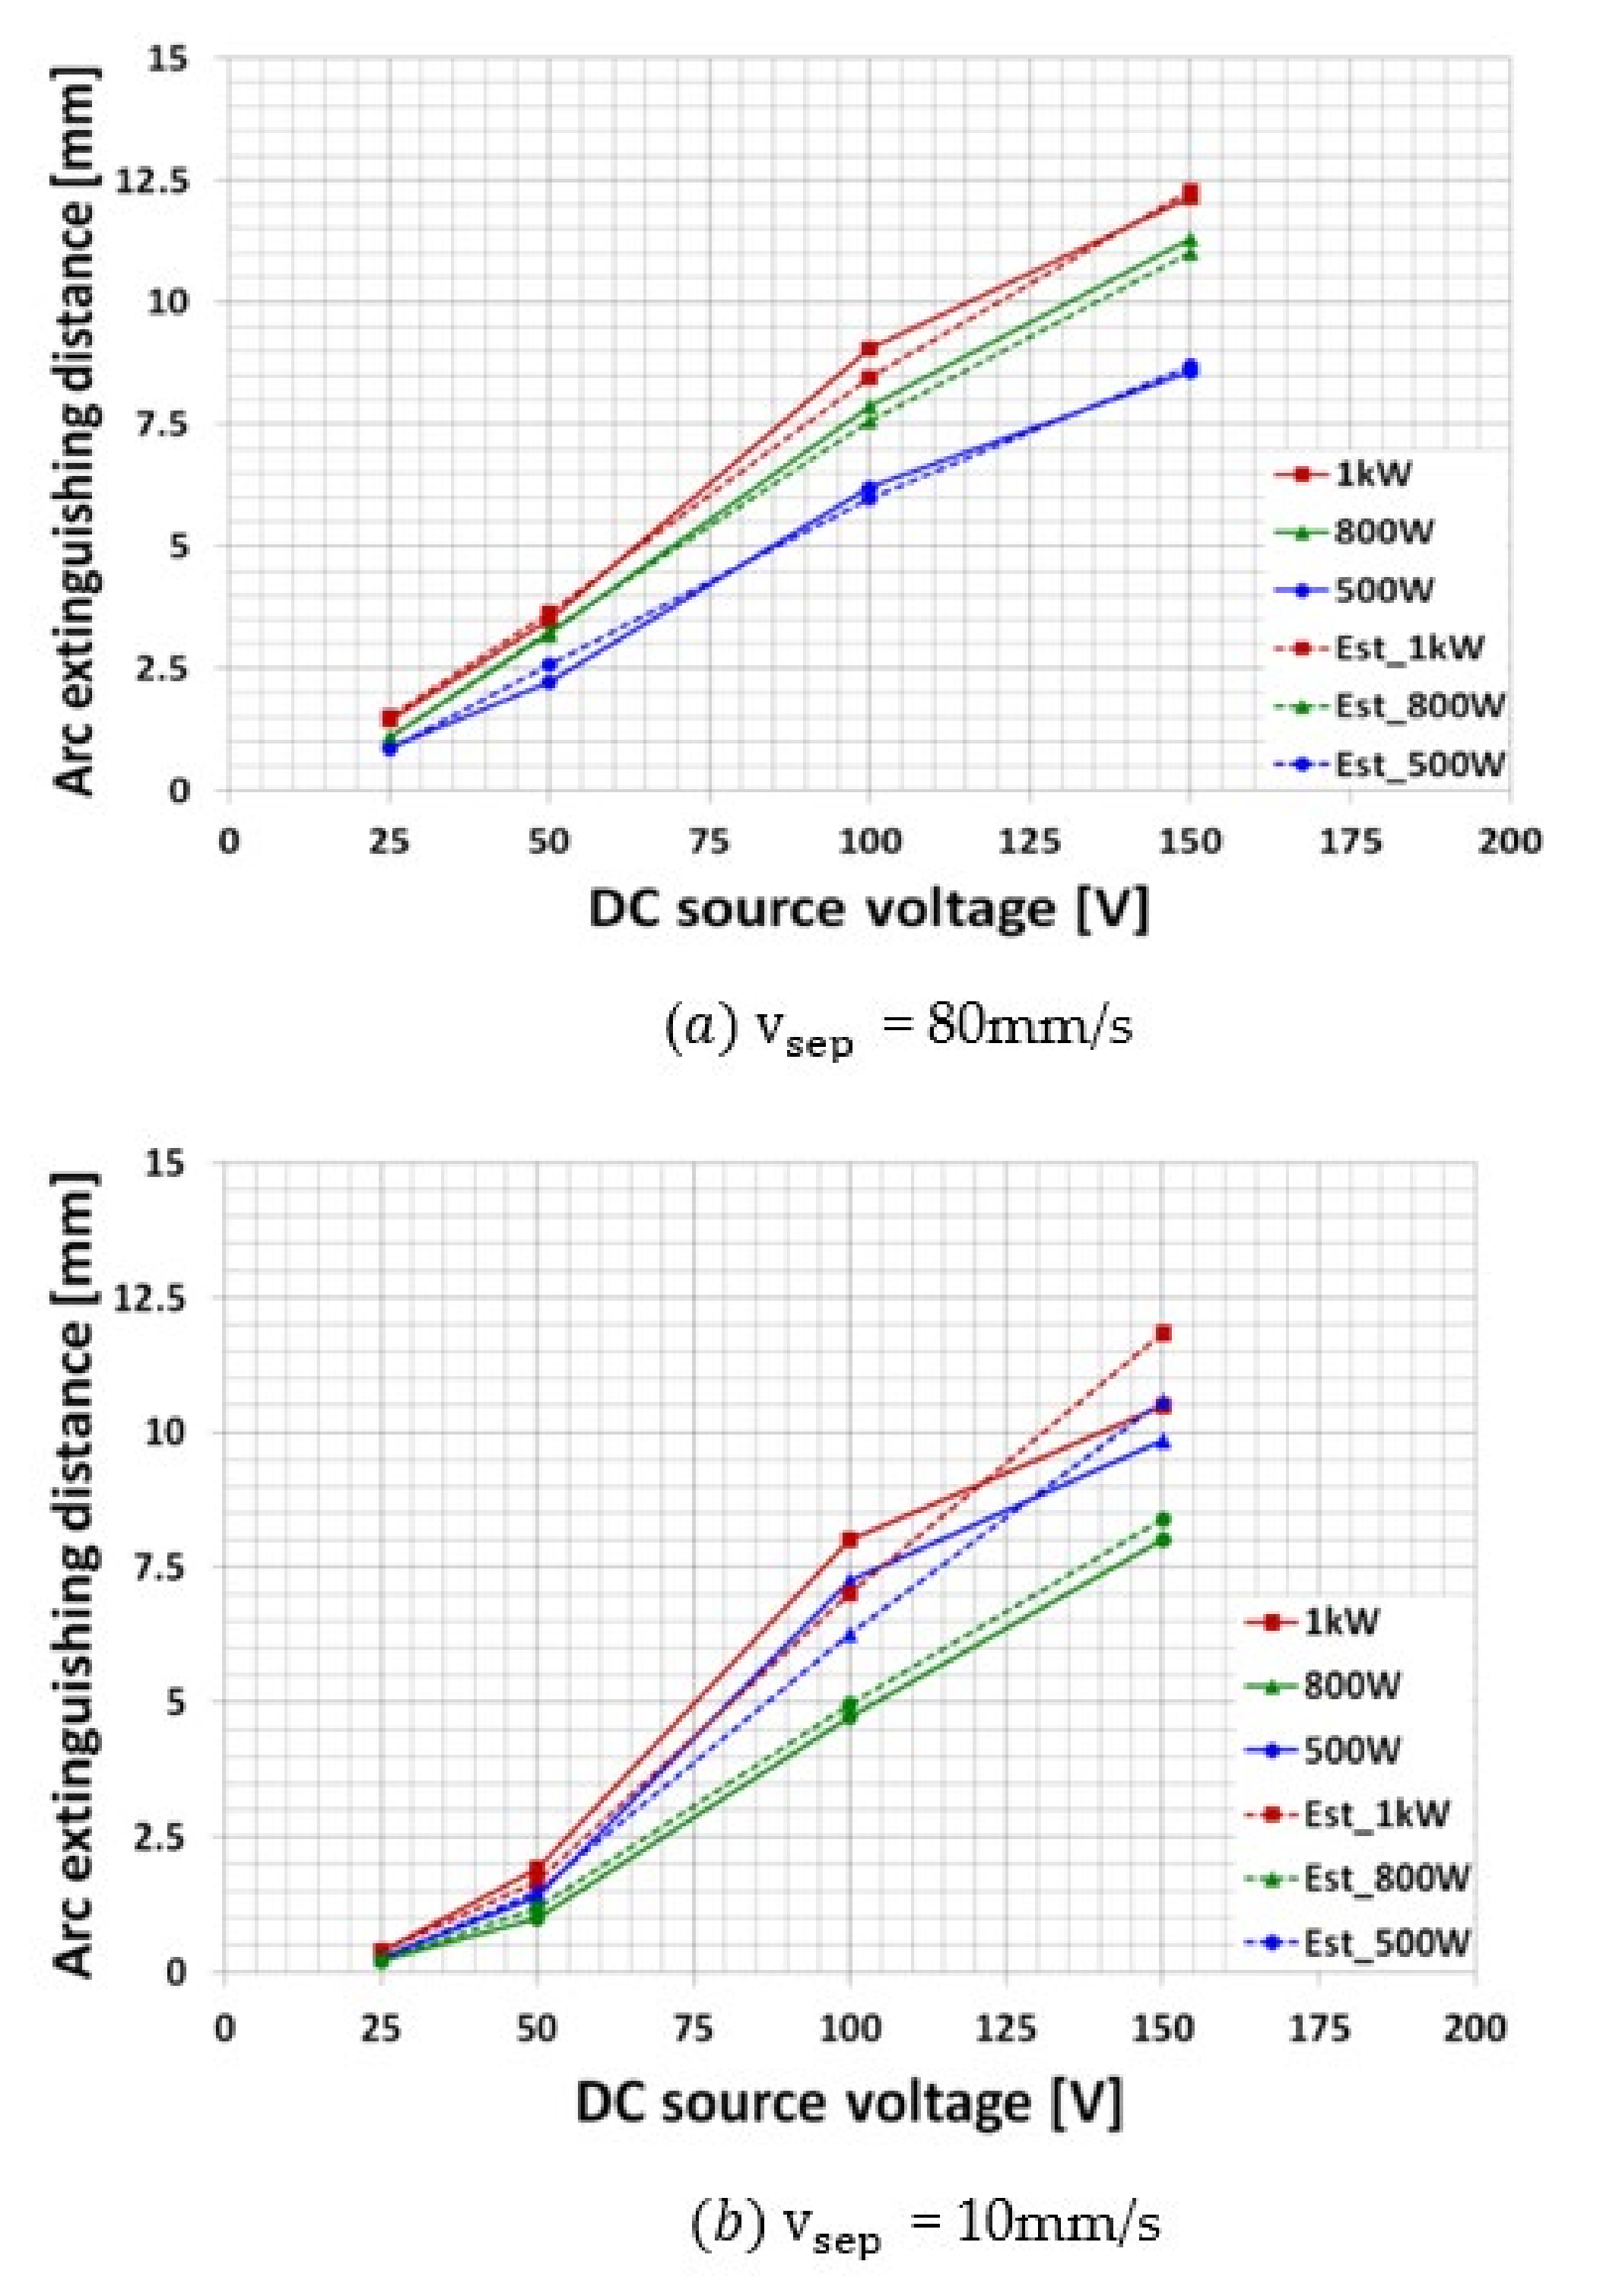
Figure 9 shows the experimental arc extinction distance curve and estimation curve that occur under the condition that the supply voltage is less than 200 V. In Figure 9, the marks on the line graph represent load power level; the mark (■) is for 1 kW, the mark (▲) is for 800 W, the mark (●) is for 500 W, the solid line shows the experimental arc extinction distance curve, and the dashed line shows the estimated arc extinction distance curve. Figure 9a shows the experimental values and estimation curves of arc extinction distance under conditions of separation speed of 80 mm/s. The average error rate for the proposed estimation method by (11) is 4.17% under the condition of power supply voltage of less than 200 V and separation speed of 80 mm/s.
Figure 9b shows the experimental values and estimation curves of arc extinction distance under conditions of separation speed of 10 mm/s. The average error rate of the proposed estimation method by (11) is 8% under the conditions of power supply voltage of less than 200 V and separation speed of 10 mm/s. As the results, it can be confirmed that the proposed method accurately estimates the extinction distance of the breaking arc with an error rate within 10% on average under the condition of power voltage less than 200 V and load power of 500 W~1 kW.

3.3.2. Source Voltage > 200 V

Figure 10 shows the experimental arc extinction distance curve and estimation curve occurring under the condition that DC supply voltage is higher than 200 V. In Figure 10, the marks on the line graph represent load power level; the mark (○) is for 500 W, the mark (◇) is for 800 W, the mark (▲) is for 1 kW, the mark (■) is for 2 kW, the mark (●) is for 3 kW, the mark (◆) is for 4 kW, the solid line shows the experimental extinction distance curve, and the dashed line shows the estimated extinction distance curve. Figure 10a shows the experimental arc extinction distance curve and estimation curve occurring under the condition of separation speed of 80 mm/s. The average error rate of the proposed estimation method by (12) is 5.34% under the conditions of power supply voltage of 200 V or higher and separation speed of 80 mm/s.
Figure 10b shows the experimental arc extinction distance curve and estimation curve that occur under the condition of separation speed of 80 mm/s. The average error rate of the proposed estimation method by (12) is 5.8% under the conditions of power supply voltage of 200 V or higher and separation speed of 10 mm/s. It is verified that the proposed method can accurately estimate the extinction distance of breaking arc under various power voltage and load power conditions.

4. LVDC Series Arc Model

4.1. Arc Current Model

The current model of the series arc generated in LVDC systems when the power and load are cut off was proposed by the author as follows [47,48].
l a t = v sep · t
i arc t = I Load V init / R Load K sustain L 0 . 5 i · l a t I 0 e α L 0 . 5 i l a t
Equation (13) means the separation distance when an electrode moves at a constant speed for t seconds. Equation (14) shows the proposed series arc current model according to the separation distance of two electrodes that change with time. In (14), V init denotes the triggering voltage of the series arc due to ionization of a single electron immediately after the separation operation of the electrode, and its magnitude is about 10 V at the copper contact points in the air. K sustain is the proportionality constant of the linear equation according to the separation distance l a t of the two electrodes. I 0 is the saturation current. α is the arc extinction coefficient of the exponential equation for the separation distance l a t of the two electrodes. L 0 . 5 i is the separation distance of the two electrodes where the arc current is 50% of the rated load current. The formula for calculating each coefficient is derived as follows.
K sustain = ( I Load / 2 V init R Load ) 1 2 V init / V DC 4 2 ( 1 V init / V DC ) 3 27
α = [ lnI Load ln 2 K sustain { 4 2 ( 1 V init / V DC ) 3 27 1 2 V init / V DC 1 } ] 4 2 ( 1 V init / V DC ) 3 27 1 2 V init / V DC 1
I 0 = I Load 2 e α 4 2 ( 1 V init / V DC ) 3 27 1 2 V init / V DC
L 0 . 5 i = R Load I Load 1 2 V init / V DC I Load / 2 2 k a
In (18), k a is the empirical constant of the Steinmetz arc voltage Equation in (1). It means that the arc constant estimation model of this paper can be applied to the proposed breaking arc model.

4.2. Arc Voltage Model

The series arc voltage equation for resistive load conditions according to the breaking arc current model proposed in this paper is as follows.
v arc _ model t = V DC R Load i arc _ model t = V DC R Load ( I Load V init / R Load K sustain L 0 . 5 i · l a t I 0 e α L 0 . 5 i l a t )
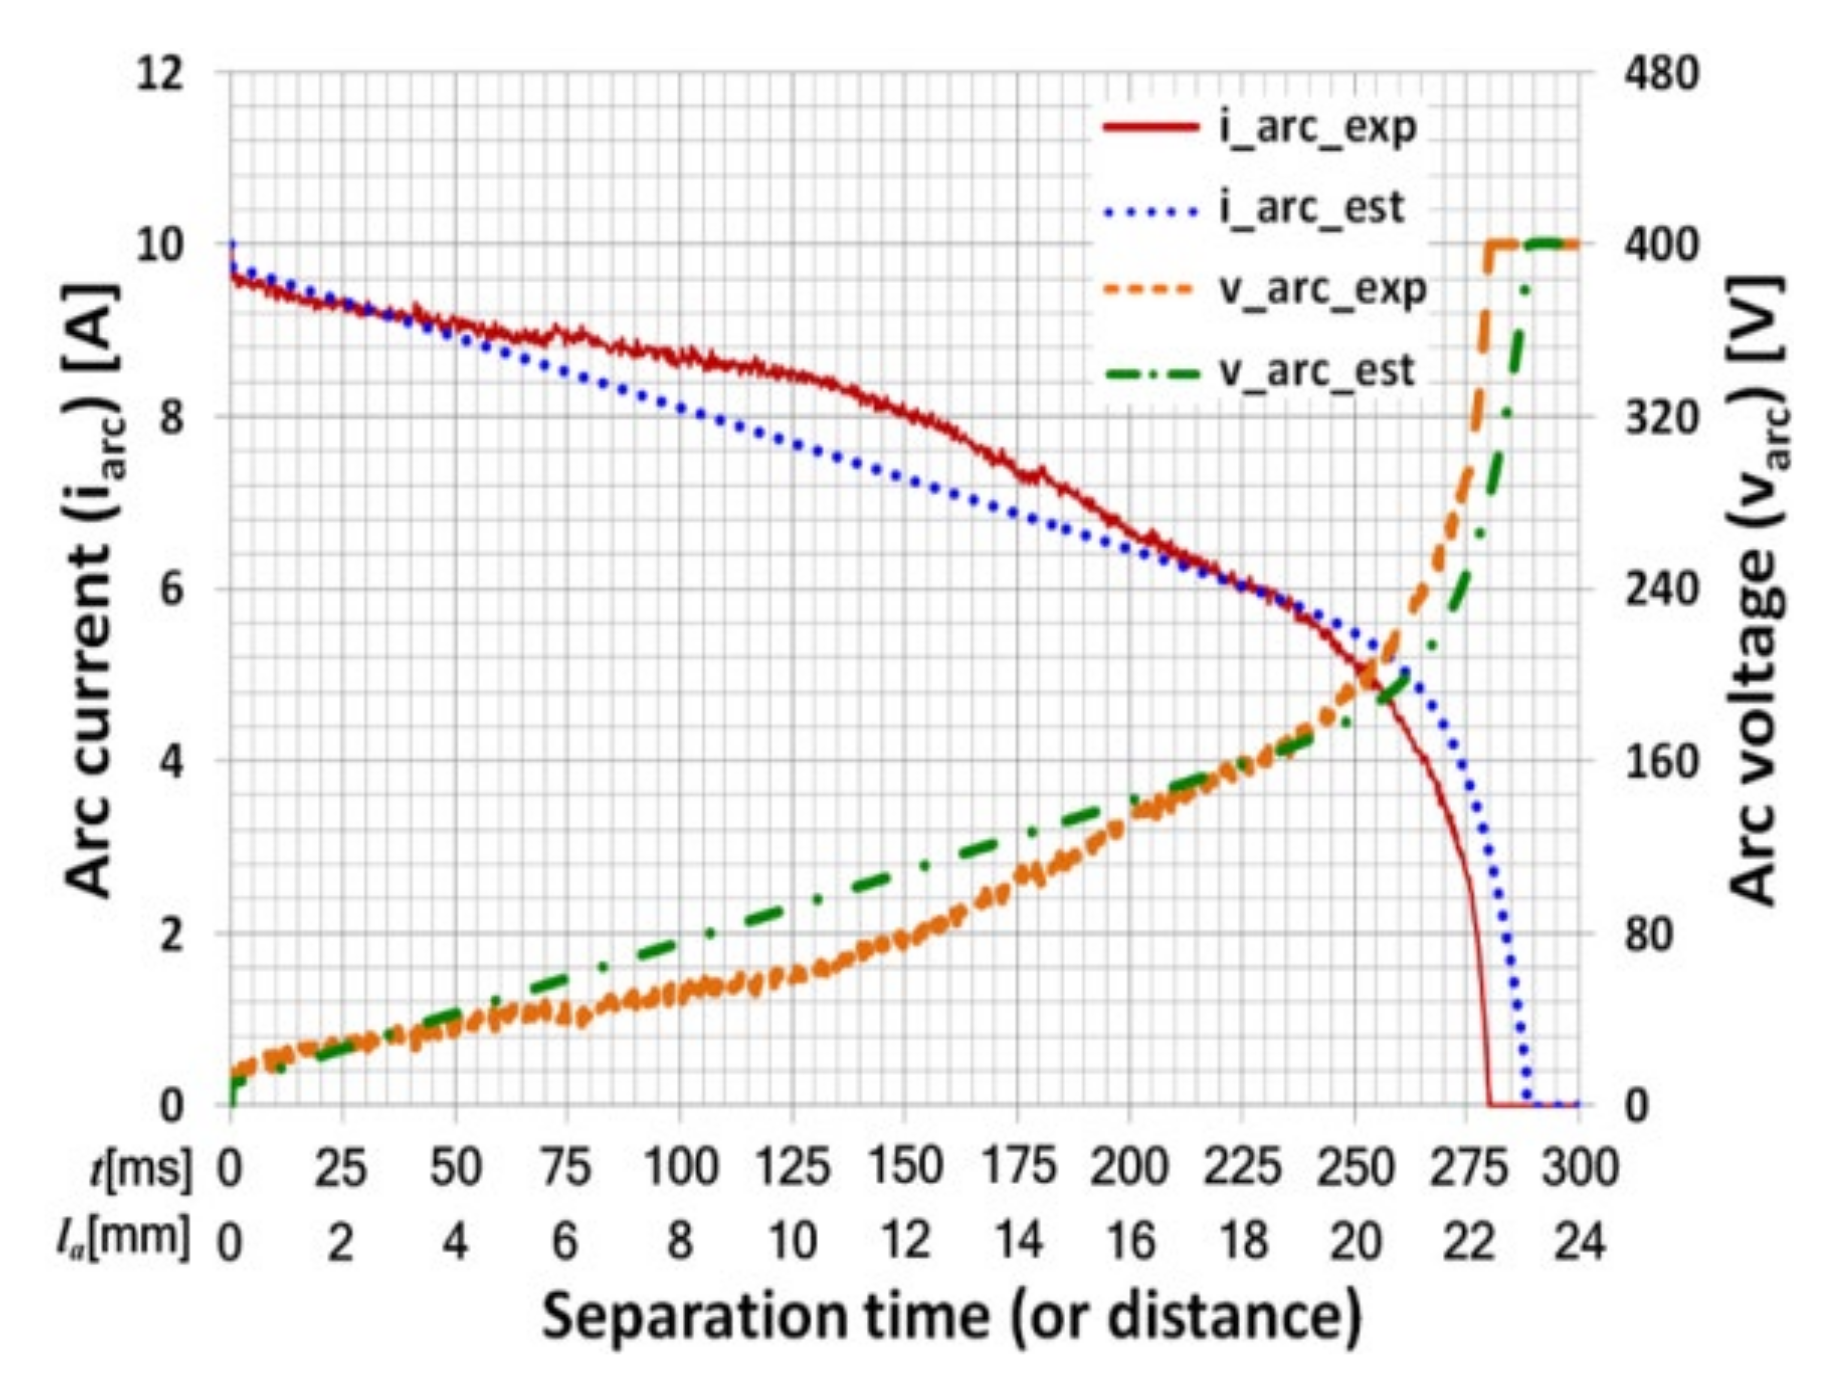
Figure 11 shows the series arc current and voltage waveforms in experiment and estimation by the proposed series arc model under equal power and load conditions. In Figure 11, the left y-axis is the arc current, the right y-axis is the arc voltage, the solid line is the experimental breaking arc current, the dotted line is the estimated breaking arc current, the dashed line is the experimental breaking arc voltage, and the dash-dot line is estimated breaking arc voltage.
In Figure 11, the average estimation error rate of the breaking arc model is 6.72%. It proves that it is possible to reasonably estimate the series arc dynamics of the resistive load condition in LVDC systems according to the change of the separation time (or the separation distance) by the proposed series arc model.

5. Conclusions

In this paper, by analyzing the intersection characteristics of the active characteristic curve by Steinmetz and the passive characteristic curve by the circuit condition, a discriminant equation was established to analyze the state of the series (or breaking) arc. By estimating the empirical constant in the Steinmetz arc voltage equation from arc state analyses and experiments, a method to estimate the arc extinction distance of the DC series arc was proposed. As a result, it was verified that the proposed estimation method estimates accurately the arc extinction distance of the DC series arc within an error range of about 10% under various power voltage and load power conditions. Moreover, it was proved that DC series-arc dynamic model in time-variant separation distance of two electrodes can be analyzed accurately by applying the series-arc current model proposed by the author, and a method to estimate the empirical constant of the Steinmetz arc voltage equation in this paper.
Protective devices like circuit breakers and fuses are always exposed to the breaking arc due to the continuous repetition of the electrical connect and disconnect. The protective device itself may be exposed to the arc failure if it fails to properly remove the arc and break the current. Even worse, this failure causes fire due to high heat and imposes massive damage to people and properties. Therefore, it is important to know the minimum gap distance where circuit breakers or fuses are not exposed to arc faults.
Electrical connectors and accessories, particularly socket outlets and plugs, may generate breaking arc flash during the disengagement operation even under normal manipulation and cause severe damage to the user due to the high temperature from the arc fault. Poor contact or a loosened joint can cause electrical fires due to the high temperature from the arc. Therefore, the technical development and guideline are required to analyze the arc generation-extinction mechanism for the devices, to prevent the sustained arc and provide arc-safe operation condition.
The houses or buildings are exposed to the risk of fire if the arc is generated by the broken wire damaged from aged premises wiring or improper installation work. In particular, the arc accident is a serious risk factor in the invisible place. Research indicates that the DC arc have longer duration, stronger and are more difficult to detect than the AC arc. Basic research on the DC series arc phenomenon is important to cope with arc fault accident.

Author Contributions

Conceptualization, H.-S.K.; methodology, H.-S.K. and Y.-J.K.; software, Y.-J.K.; validation, H.-S.K.; formal analysis, H.-S.K. and Y.-J.K.; investigation, Y.-J.K.; resources, Y.-J.K.; data curation, H.-S.K.; writing—original draft preparation, H.-S.K. and Y.-J.K.; writing—review and editing, H.-S.K. and Y.-J.K.; visualization, Y.-J.K.; supervision, H.-S.K.; project administration, H.-S.K.; funding acquisition, H.-S.K. All authors have read and agreed to the published version of the manuscript.

Funding

This work was supported in part by Basic Science Research Program through the National Research Foundation of Korea (NRF) funded by the Ministry of Education. (Grants No. 2016R1D1A3B01008279). This work was also supported in part by Kongju National University.

Conflicts of Interest

The authors declare no conflict of interest.

References

  1. Xiao, D.; AlAshery, M.K.; Qiao, W. Optimal price-maker trading strategy of a wind power producer using virtual bidding. J. Mod. Power Syst. Clean Energy 2021, 1–13. [Google Scholar] [CrossRef]
  2. Xiao, D.; Qiao, W.; Qu, L. Risk-averse offer strategy of a photovoltaic solar power plant with virtual bidding in electricity markets. In Proceedings of the 10th IEEE Conference on Innovative Smart Grid Technology (ISGT 2019), Washington, DC, USA, 17–20 February 2019; pp. 1–5. [Google Scholar] [CrossRef]
  3. Liang, J.; Jing, T.; Gomis-Bellmunt, O.; Ekanayake, J.; Jenkins, N. Operation and control of multiterminal HVDC transmission for offshore wind farms. IEEE Trans. Power Deliv. 2011, 26, 2596–2604. [Google Scholar] [CrossRef]
  4. Raza, X.; Dianguo, S.; Xunwen, L.; Weixing, B.W.; Williams, A. Novel Multiterminal VSC-HVdc Transmission Topology for Offshore Wind Farms. IEEE Trans. Ind. Appl. 2017, 53, 1316–1325. [Google Scholar] [CrossRef]
  5. Rodriguez-Diaz, E.; Vasquez, J.C.; Guerrero, J.M. Intelligent DC homes in future sustainable energy systems: When efficiency and intelligence work together. IEEE Consum. Electron. Mag. 2016, 5, 74–80. [Google Scholar] [CrossRef] [Green Version]
  6. Dragicevic, T.; Vasquez, J.C.; Guerrero, J.M.; Skrlec, D. Advanced LVDC electrical power architectures and microgrids: A step toward a new generation of power distribution networks. IEEE Electrif. Mag. 2014, 2, 54–65. [Google Scholar] [CrossRef] [Green Version]
  7. Ghaffarpour, M.; Jahromi, G.; Mirzaeva, S.D.; Mitchell, D.G. Powering mobile mining machines: DC versus AC power. IEEE Ind. Appl. Mag. 2016, 22, 63–72. [Google Scholar] [CrossRef] [Green Version]
  8. Pecharroman, R.R.; Lopez-Lopez, A.; Cucala, A.P.; Fernandez-Cardador, A. Riding the rails to DC power efficiency: Energy efficiency in dc-electrified metropolitan railways. IEEE Electrif. Mag. 2014, 2, 32–38. [Google Scholar] [CrossRef]
  9. Bhatia, M.; Angelou, N. Beyond Connections: Energy Access Redefined; Energy Sector Management Assistance Program: Washington, DC, USA, 2015. [Google Scholar]
  10. Jhunjhunwala, P.K. Solar energy, dc distribution, and microgrids: Ensuring quality power in rural India. IEEE Electrif. Mag. 2018, 6, 32–39. [Google Scholar] [CrossRef]
  11. Shenai, K.; Jhunjhunwala, A.; Kaur, P. Electrifying India: Using solar dc microgrids. IEEE Power Electron. Mag. 2016, 3, 42–48. [Google Scholar] [CrossRef]
  12. Jhunjhunwala, A.; Lolla, A.; Kaur, P. Solar-DC microgrid for Indian homes: A transforming power scenario. IEEE Electrif. Mag. 2016, 4, 10–19. [Google Scholar] [CrossRef]
  13. LVDC: Electricity for the 21st Century; IEC Technical Report; IEC: London, UK, 2015.
  14. Kumar, D.; Zare, F.; Ghosh, A. DC microgrid technology: System architectures AC grid interfaces grounding schemes power quality communication networks applications and standardizations aspects. IEEE Access 2017, 5, 12230–12256. [Google Scholar] [CrossRef]
  15. Hesla, E. DC task team report. IEEE Trans. Ind. Appl. 2014, 50, 2996–3003. [Google Scholar] [CrossRef]
  16. Gordon, L.B.; Cartelli, L.; Graham, N. A complete electrical shock hazard classification system and its application. IEEE Trans. Ind. Appl. 2018, 54, 6554–6565. [Google Scholar] [CrossRef]
  17. IEC 60479-1. Effects of Current on Human Beings and Livestock–Part 1: General Aspects; IEC: London, UK, 2015. [Google Scholar]
  18. NFPA 70E. Updates, Affect Your Most Valuable Assets; NFPA: Quincy, MA, USA, 2015. [Google Scholar]
  19. Koziy, K.; Gou, B.; Aslakson, J. A low-cost power-quality meter with series arc-fault detection capability for smart grid. IEEE Trans. Power Deliv. 2013, 28, 1584–1591. [Google Scholar] [CrossRef]
  20. Naidu, M.; Schoepf, T.J.; Gopalakrishnan, S. Arc fault detection scheme for 42-V automotive DC networks using current shunt. IEEE Trans. Power Electron. 2006, 21, 633–639. [Google Scholar] [CrossRef]
  21. Gammon, T.; Lee, W.; Zhang, Z.; Johnson, B.C. A Review of Commonly Used DC Arc Models. IEEE Trans. Ind. Appl. 2015, 51, 1398. [Google Scholar] [CrossRef]
  22. Khakpour, A.; Franke, S.; Uhrlandt, D.; Gorchakov, S.; Methling, R. Electrical Arc Model Based on Physical Parameters and Power Calculation. IEEE Trans. Plasma Sci. 2015, 43, 2721. [Google Scholar] [CrossRef]
  23. Rau, S.-H.; Lee, W.-J. DC Arc Model Based on 3-D DC Arc Simulation. IEEE Trans. Ind. Appl. 2016, 52, 5255–5261. [Google Scholar] [CrossRef]
  24. Siewert, E.; Baeva, M.; Uhrlandt, D. The electric field and voltage of dc tungsten-inert gas arcs and their role in the bidirectional plasma-electrode interaction. J. Phys. D Appl. Phys. 2019, 52, 324006. [Google Scholar] [CrossRef]
  25. Misato, S.; Yoshiaki, E.; Masayoshi, S. Relationship between Arc Behavior and Parameters of the Arc Root Model in the Arc Gas Flow Analysis. In Proceedings of the 5th IEEE International Conference on Electric Power Equipment-Switching Technology (ICEPE-ST), Kitakyushu, Japan, 13–16 October 2019. [Google Scholar] [CrossRef]
  26. Xiaowen, X.; Shiyou, Y.; Qiang, Z.; Yanhong, M. A 2-D Axisymmetric Magneto-Hydrodynamic Model of a DC Arc Plasma Torch and Its Solution Methodology. IEEE Trans. Magn. 2020, 56, 1–4. [Google Scholar] [CrossRef]
  27. Mayr, O. Beitrage zur Theorie des Statischen und des Dynamischen Lichtbogens. Arch. Elektr. 1943, 37, 588–608. [Google Scholar] [CrossRef]
  28. Cassie, A.M. Arc Rupture and Circuit Severity: A New Theory. In Proceedings of the Conférence Internationale des Grands Réseaux Électriques à Haute Tension (CIGRE Report), Paris, France, 29 June–8 July 1939; Volume 102, pp. 1–14. [Google Scholar]
  29. Schavemaker, P.H.; Slui, L. An improved Mayr-type arc model based on current-zero measurements [circuit breakers]. IEEE Trans. Power Deliv. 2000, 15, 580–584. [Google Scholar] [CrossRef]
  30. Guardado, J.L.; Maximov, S.G.; Melgoza, E.; Naredo, J.L.; Moreno, P. An improved arc model before current zero based on the combined Mayr and Cassie arc models. IEEE Trans. Power Deliv. 2005, 20, 138. [Google Scholar] [CrossRef]
  31. Gao, Y.; Wang, L.; Zhang, Y.; Zeng, K. Research on the Calculation Method for the Parameters of the Simplified Schavemaker AC Arc Model. In Proceedings of the 2018 Prognostics and System Health Management Conference (PHM-Chongqing), Chongqing, China, 26–28 October 2018; pp. 150–156. [Google Scholar] [CrossRef]
  32. Xiaorui, Z.; Liang, W.; Sheng, L.; Zhentao, D.; Yabin, Y. Research on modeling and characteristic analysis of arc in DC Circuit Breaker. In Proceedings of the IEEE 8th International Conference on Advanced Power System Automation and Protection (APAP), Xi’an, China, 21–24 October 2019. [Google Scholar] [CrossRef]
  33. He, J.; Wang, K.; Jiangang, L. Application of an Improved Mayr-Type Arc Model in Pyro-Breakers Utilized in Superconducting Fusion Facilities. Energies 2021, 14, 4383. [Google Scholar] [CrossRef]
  34. Khakpour, A.; Franke, S.; Gortschakow, S.; Uhrlandt, D.; Methling, R.; Weltmann, K.-D. An Improved Arc Model Based on the Arc Diameter. IEEE Trans. Power Deliv. 2016, 31, 1335–1341. [Google Scholar] [CrossRef]
  35. Steinmetz, C.P. Electric power into light, Section VI. The arc. Trans. Am. Inst. Electr. Eng. 1906, 25, 802. [Google Scholar]
  36. Nottingham, W.B. A new equation for the static characteristic of the normal electric arc. Trans. Am. Inst. Electr. Eng. 1923, 42, 12–19. [Google Scholar] [CrossRef]
  37. Stokes, A.D.; Oppenlander, W.T. Electric arcs in open air. J. Phys. D Appl. Phys. 1991, 24, 26–35. [Google Scholar] [CrossRef]
  38. Ammerman, R.F.; Gammon, T.; Sen, P.K.; Nelson, J.P. DC-arc models and incident-energy calculations. IEEE Trans. Ind. Appl. 2010, 46, 1810–1819. [Google Scholar] [CrossRef]
  39. Fisher, L.E. Resistance of low-voltage ac arcs. IEEE Trans. Ind. Gen. Appl. 1970, 6, 607–616. [Google Scholar] [CrossRef]
  40. Kyu-Hoon, P.; Ho-Yun, L.; Bang-Wook, L. The Analysis of Low-Voltage DC Arc behavior on Three Interrupting Phases Based on AC Black-box Arc model. In Proceedings of the IEEE 2019 5th International Conference on Electric Power Equipment-Switching Technology (ICEPE-ST), Kitakyushu, Japan, 13–16 October 2019. [Google Scholar] [CrossRef]
  41. Ruiyang, G.; Zhidong, J.; Songhai, F.; Xinghai, Z.; Tao, W.; Yuanshi, D. DC Arc Self-Extinction and Dynamic Arc Model in Open-Space Condition Using a Yacob Ladder. IEEE Trans. Plasma Sci. 2019, 47, 4721–4728. [Google Scholar] [CrossRef]
  42. Paukert, J. The arc voltage and the resistance of LV fault arcs. In Proceedings of the 7th International Symposium on Switching Arc Phenomena, Łódź, Poland, 27 September–11 October 1993; pp. 49–51. [Google Scholar]
  43. Andrea, J.; Schweitzer, P.; Carvou, E. Comparison of equations of the VI characteristics of an electric arc in open air. In Proceedings of the IEEE Holm Conference on Electrical Contacts, Milwaukee, WI, USA, 15–18 September 2019; pp. 76–81. [Google Scholar] [CrossRef]
  44. Zhang, Z.; Nie, Y.; Lee, W.-J. Approach of Voltage Characteristics Modeling for Medium-Low-Voltage Arc Fault in Short Gaps. IEEE Trans. Ind. Appl. 2019, 55, 2281–2289. [Google Scholar] [CrossRef]
  45. Ammar, N.; Petrus, P.; Dirk, U. Electrical Modelling of Switching Arcs in a Low Voltage Relay at Low Currents. Energies 2020, 13, 6377. [Google Scholar] [CrossRef]
  46. Uriarte, F.M.; Gattozzi, A.; Herbst, J.; Estes, H.; Hotz, T.; Kwasinski, A.; Hebner, R. A DC Arc Model for Series Faults in Low Voltage Microgrids. IEEE Trans. Smart Grid 2012, 3, 2063–2070. [Google Scholar] [CrossRef] [Green Version]
  47. Kim, W.; Kim, Y.-J.; Kim, H. Arc Voltage and Current Characteristics in Low-Voltage Direct Current. Energies 2018, 11, 2511. [Google Scholar] [CrossRef] [Green Version]
  48. Kim, Y.-J. Modeling for Series Arc of DC Circuit Breaker. IEEE Trans. Ind. Appl. 2019, 55, 6. [Google Scholar] [CrossRef]
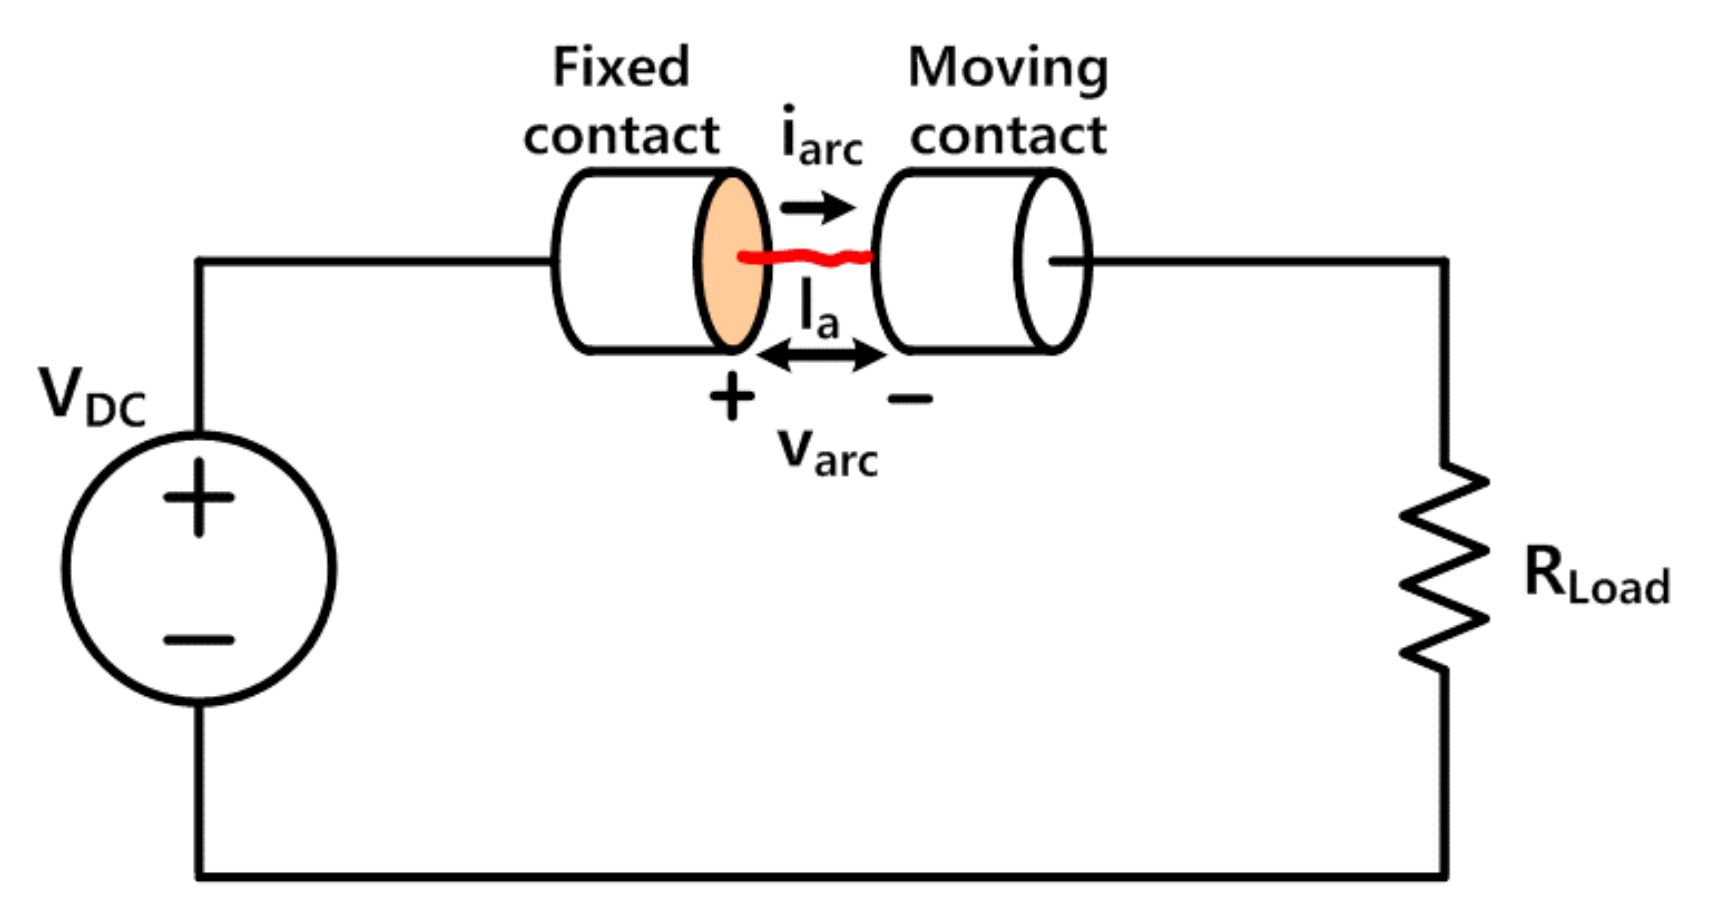
Figure 1. Schematic power circuit with pure contact type DC switch.
Energies 14 06646 g001
Figure 2. Root condition of ix according to separation distance between both electrodes.
Energies 14 06646 g002
Figure 3. Experimental device for DC breaking arc.
Energies 14 06646 g003
Figure 4. Arc extinction distance under breaking arc according to separation speed, source voltage, and load power conditions.
Energies 14 06646 g004
Figure 5. Arc empirical constant ka under separation speed, source voltage, and load power levels (Source voltage < 200 V).
Energies 14 06646 g005
Figure 6. Average experimental value and estimation curve of arc empirical constant ka according to source voltage (Source voltage < 200 V).
Energies 14 06646 g006
Figure 7. Arc empirical constant ka under separation speed, source voltage, and load power levels (Source voltage ≥ 200 V).
Energies 14 06646 g007
Figure 8. Average experimental value and estimation curve of arc empirical constant ka according to load power level (Source voltage ≥ 200 V).
Energies 14 06646 g008
Figure 9. Arc extinction distance experimental value curve and estimated curve: Power supply voltage less than 200 V.
Energies 14 06646 g009
Figure 10. Arc extinction distance experimental value curve and estimated curve: Power supply voltage equal or larger than 200 V.
Energies 14 06646 g010
Figure 11. Series arc current/voltage waveform: separation speed 80 mm/s, power supply voltage 400 V, load power 4 kW.
Energies 14 06646 g011
Table 1. Experimental conditions.
Source voltage [V]12, 25, 50, 100, 150, 200,
250, 300, 350, 400
Load Power [W]500, 800, 1k, 2k, 3k, 4k
Separation speed [mm/s]10, 80
Maximum Separation distance [mm]30
Gas mediumAir
Temperature [C]24~26
Humidity [%]60~70
Publisher’s Note: MDPI stays neutral with regard to jurisdictional claims in published maps and institutional affiliations.