
Experimental Analysis on the Influence of Operating Profiles on High Temperature Polymer Electrolyte Membrane Fuel Cells

 , and
, and
Abstract
:1. Introduction
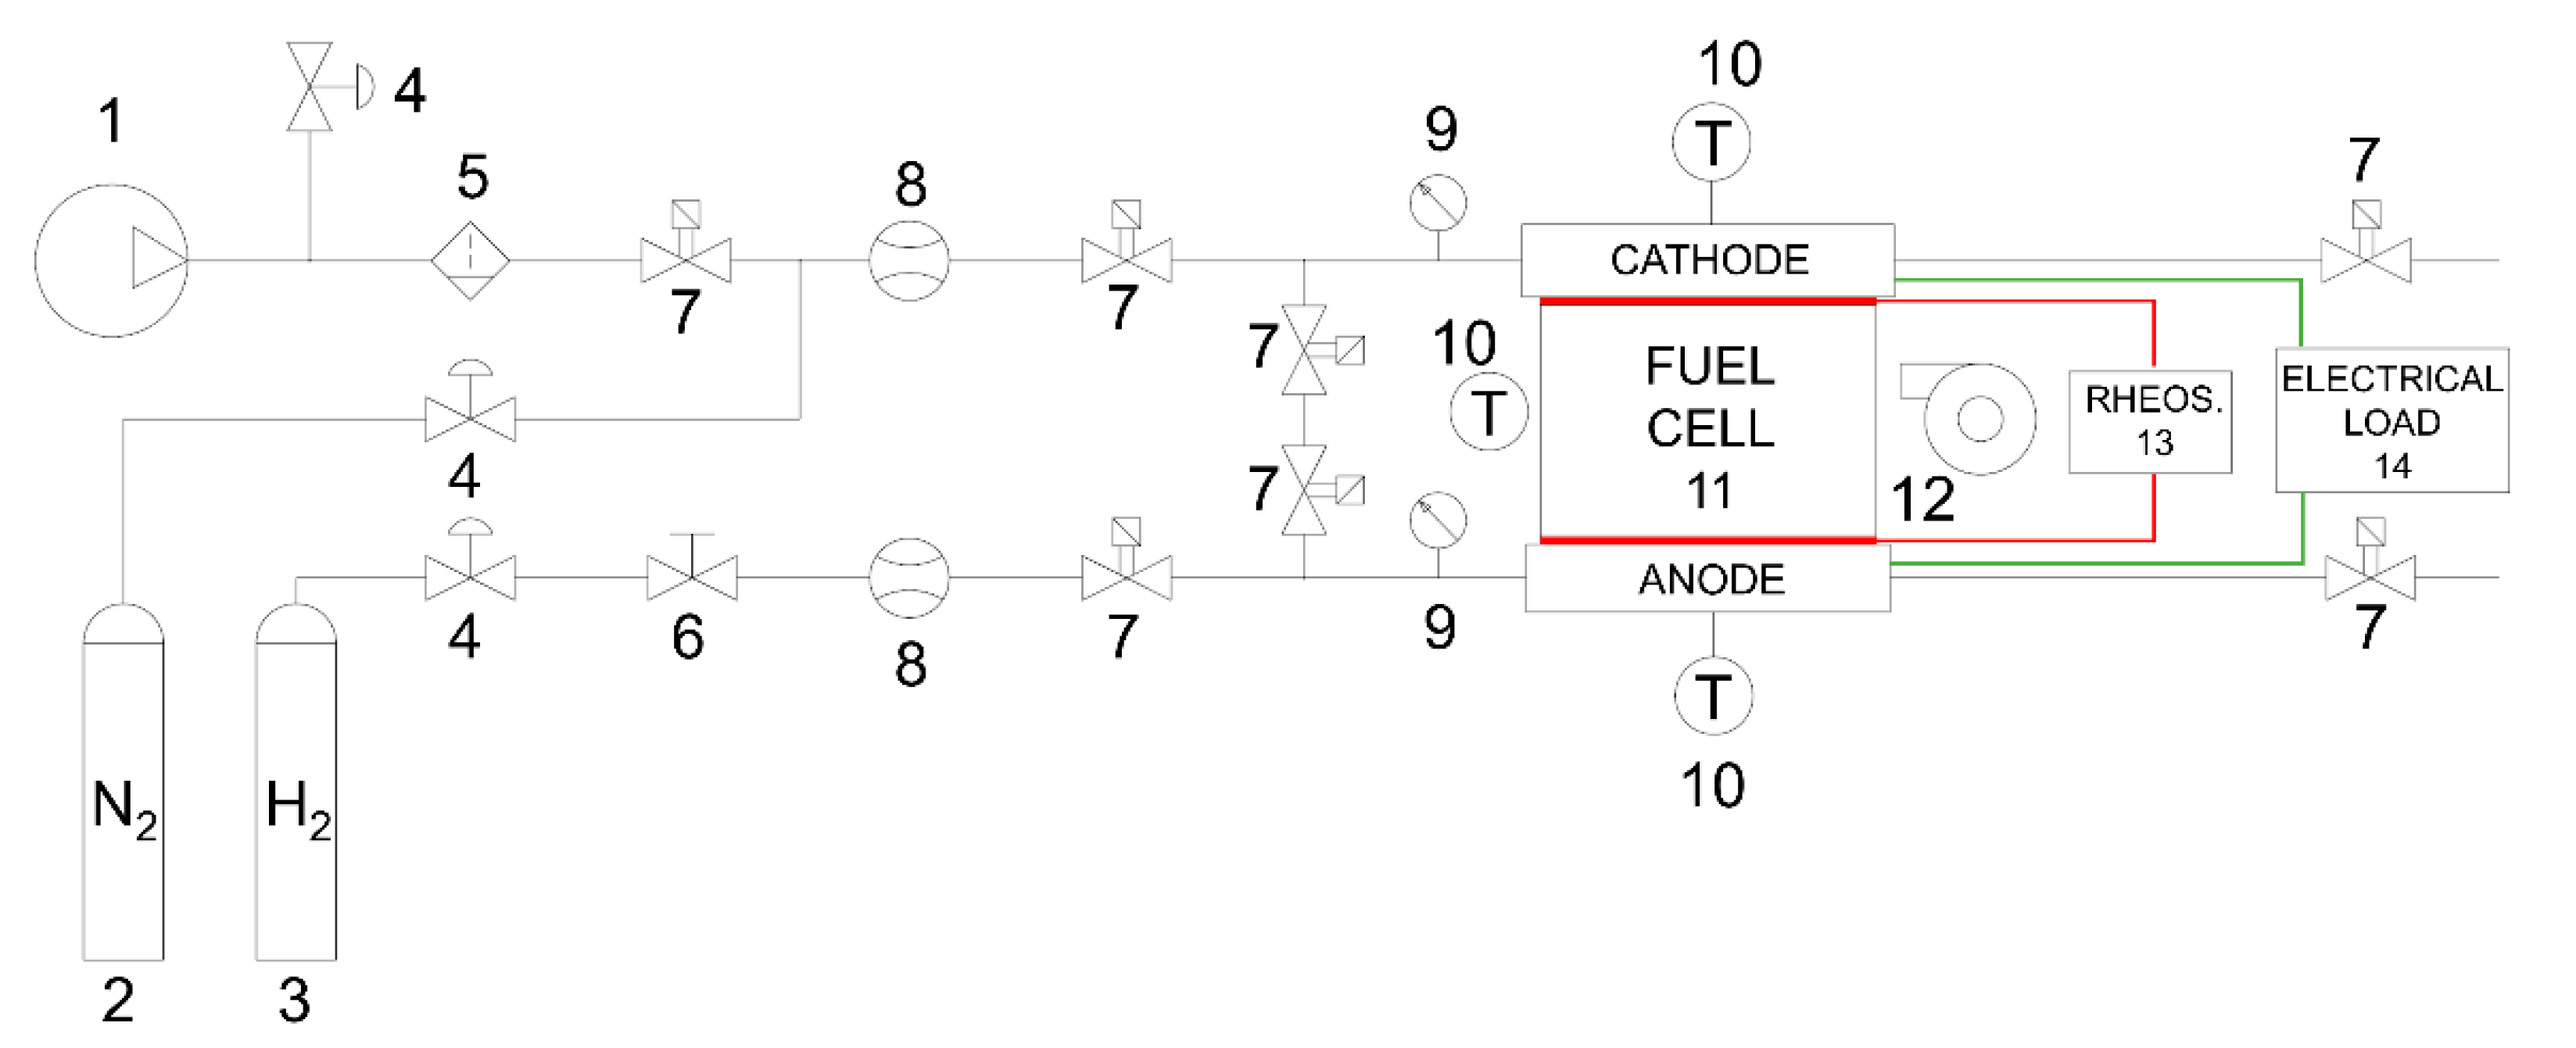
2. Materials and Methods
2.1. Small Angle X-ray Scattering (SAXS) Analysis
2.1.1. Beamline Setup
2.1.2. Fitting of the Intensity Curves
3. Results
3.1. Polarization Curves
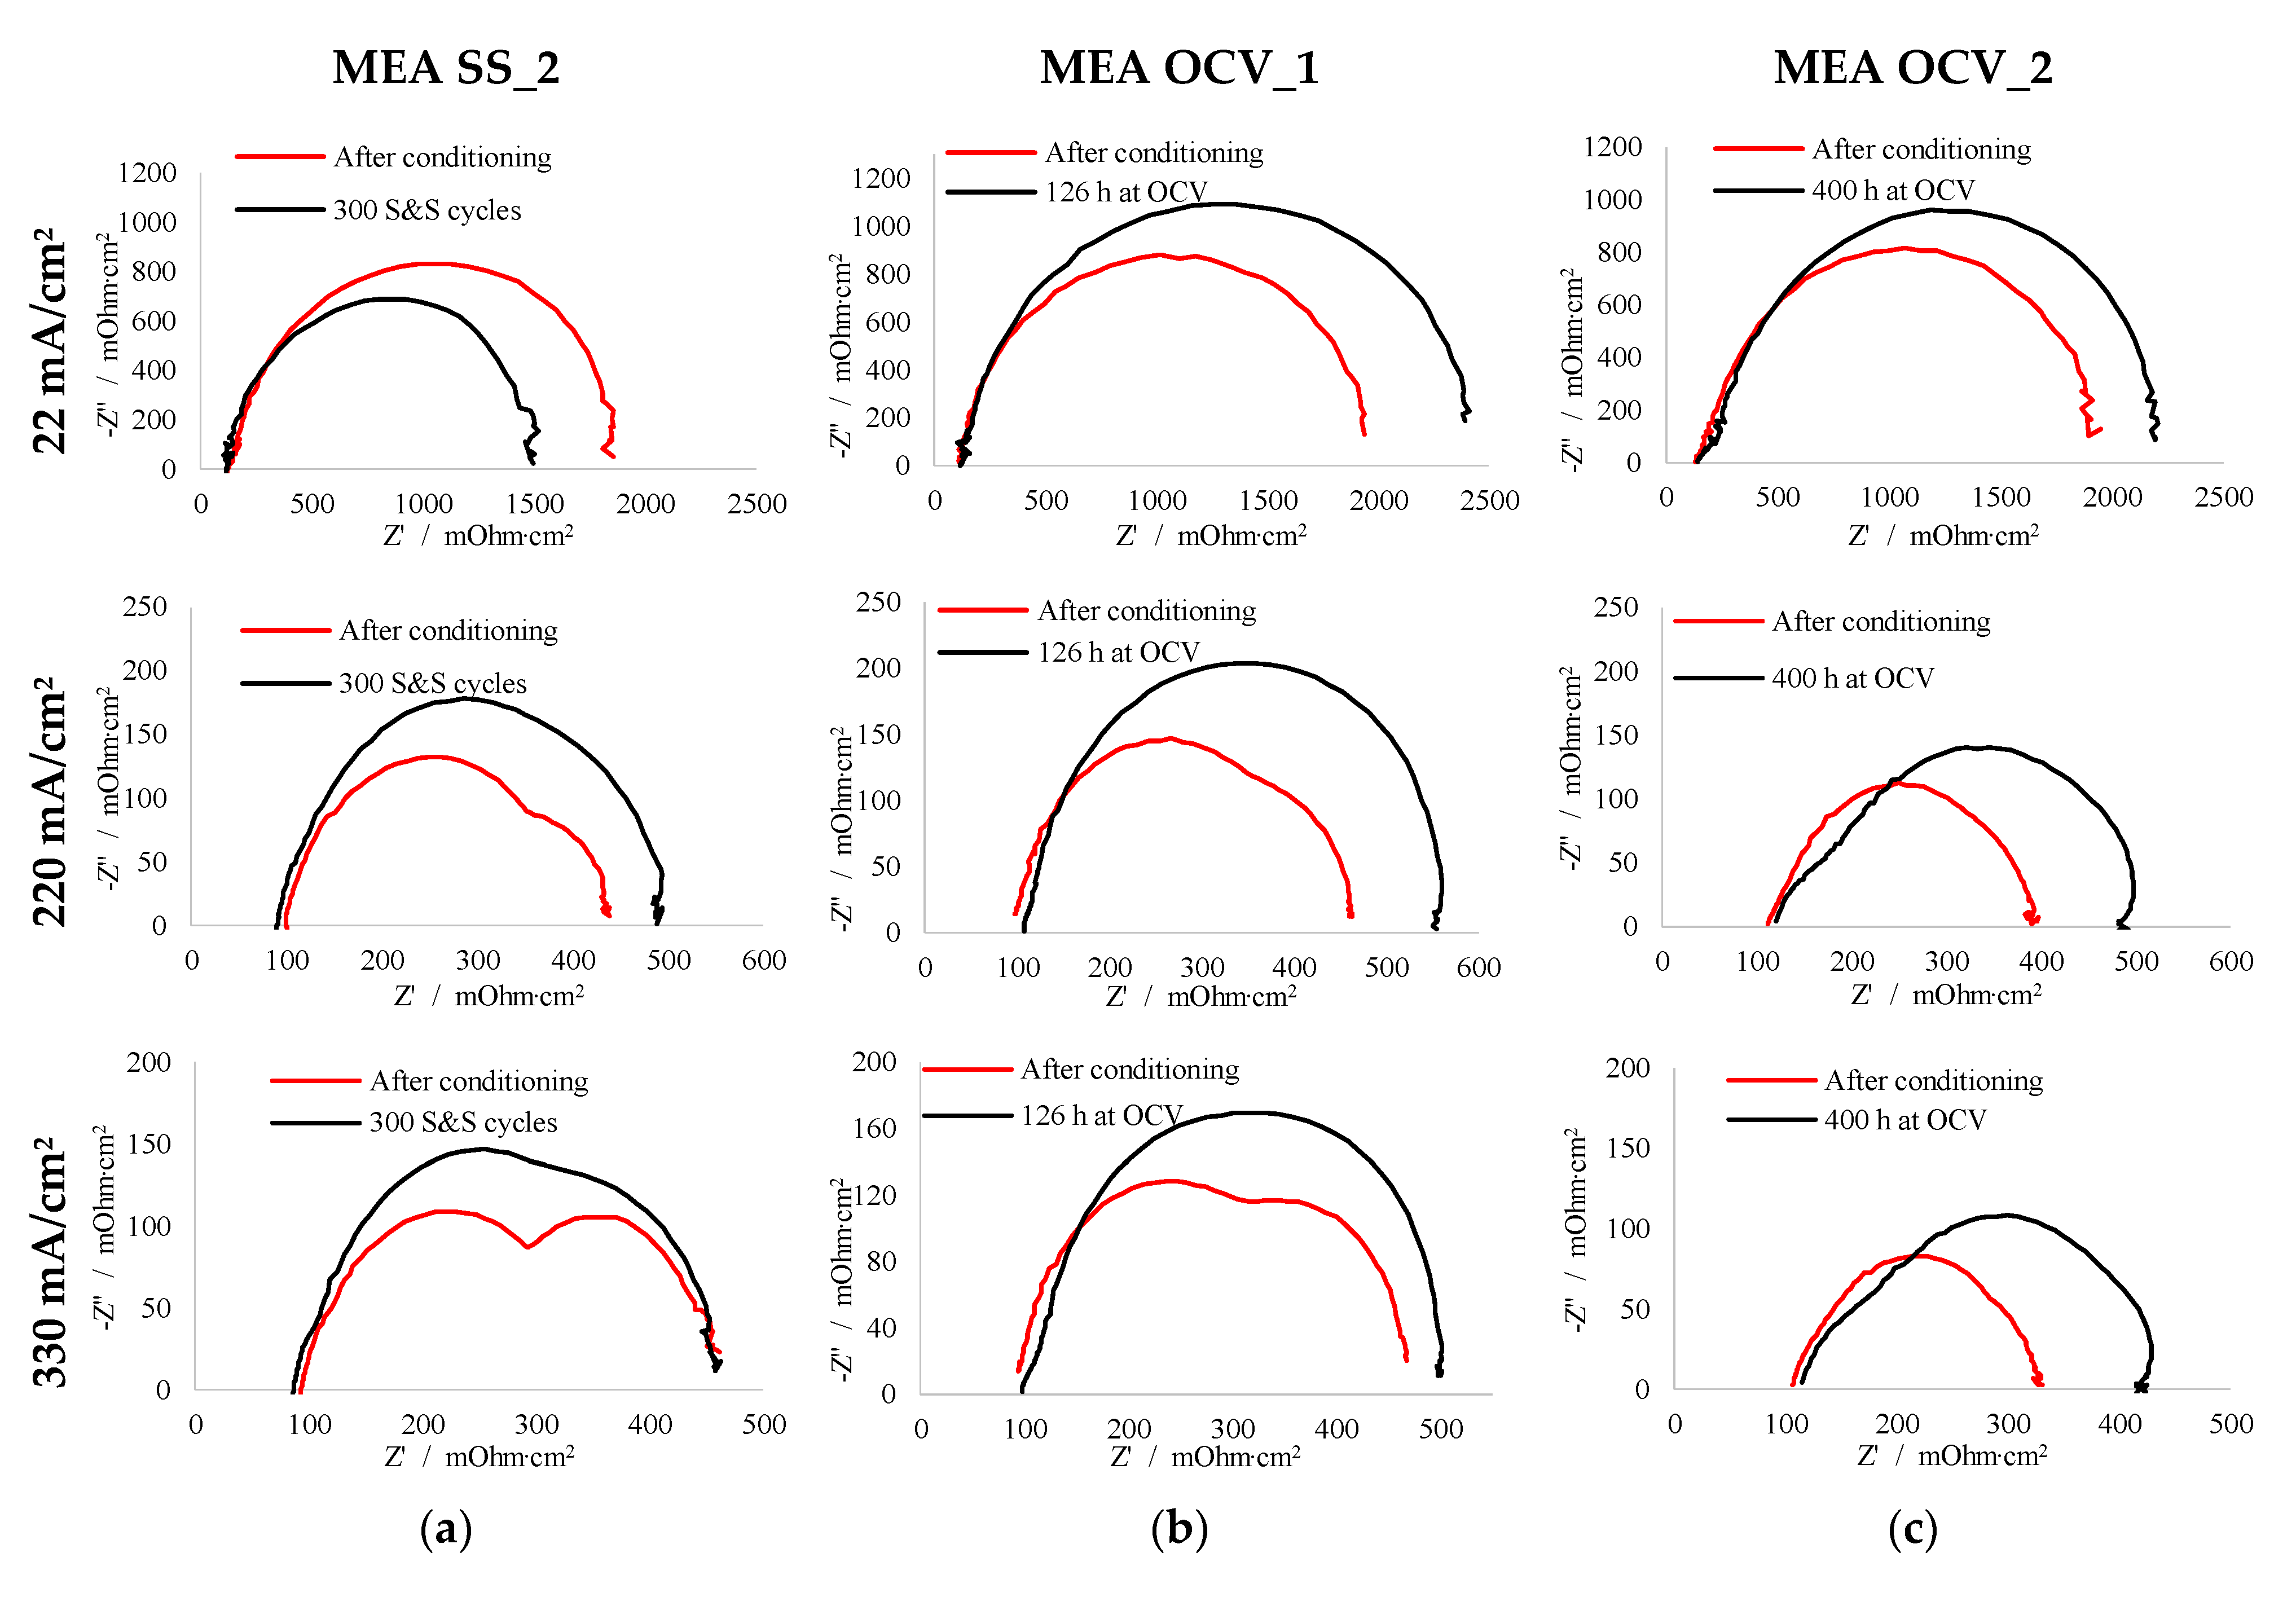
3.2. Electrochemical Impedance Spectroscopy (EIS)
3.3. Cyclic Voltammetry (CV)
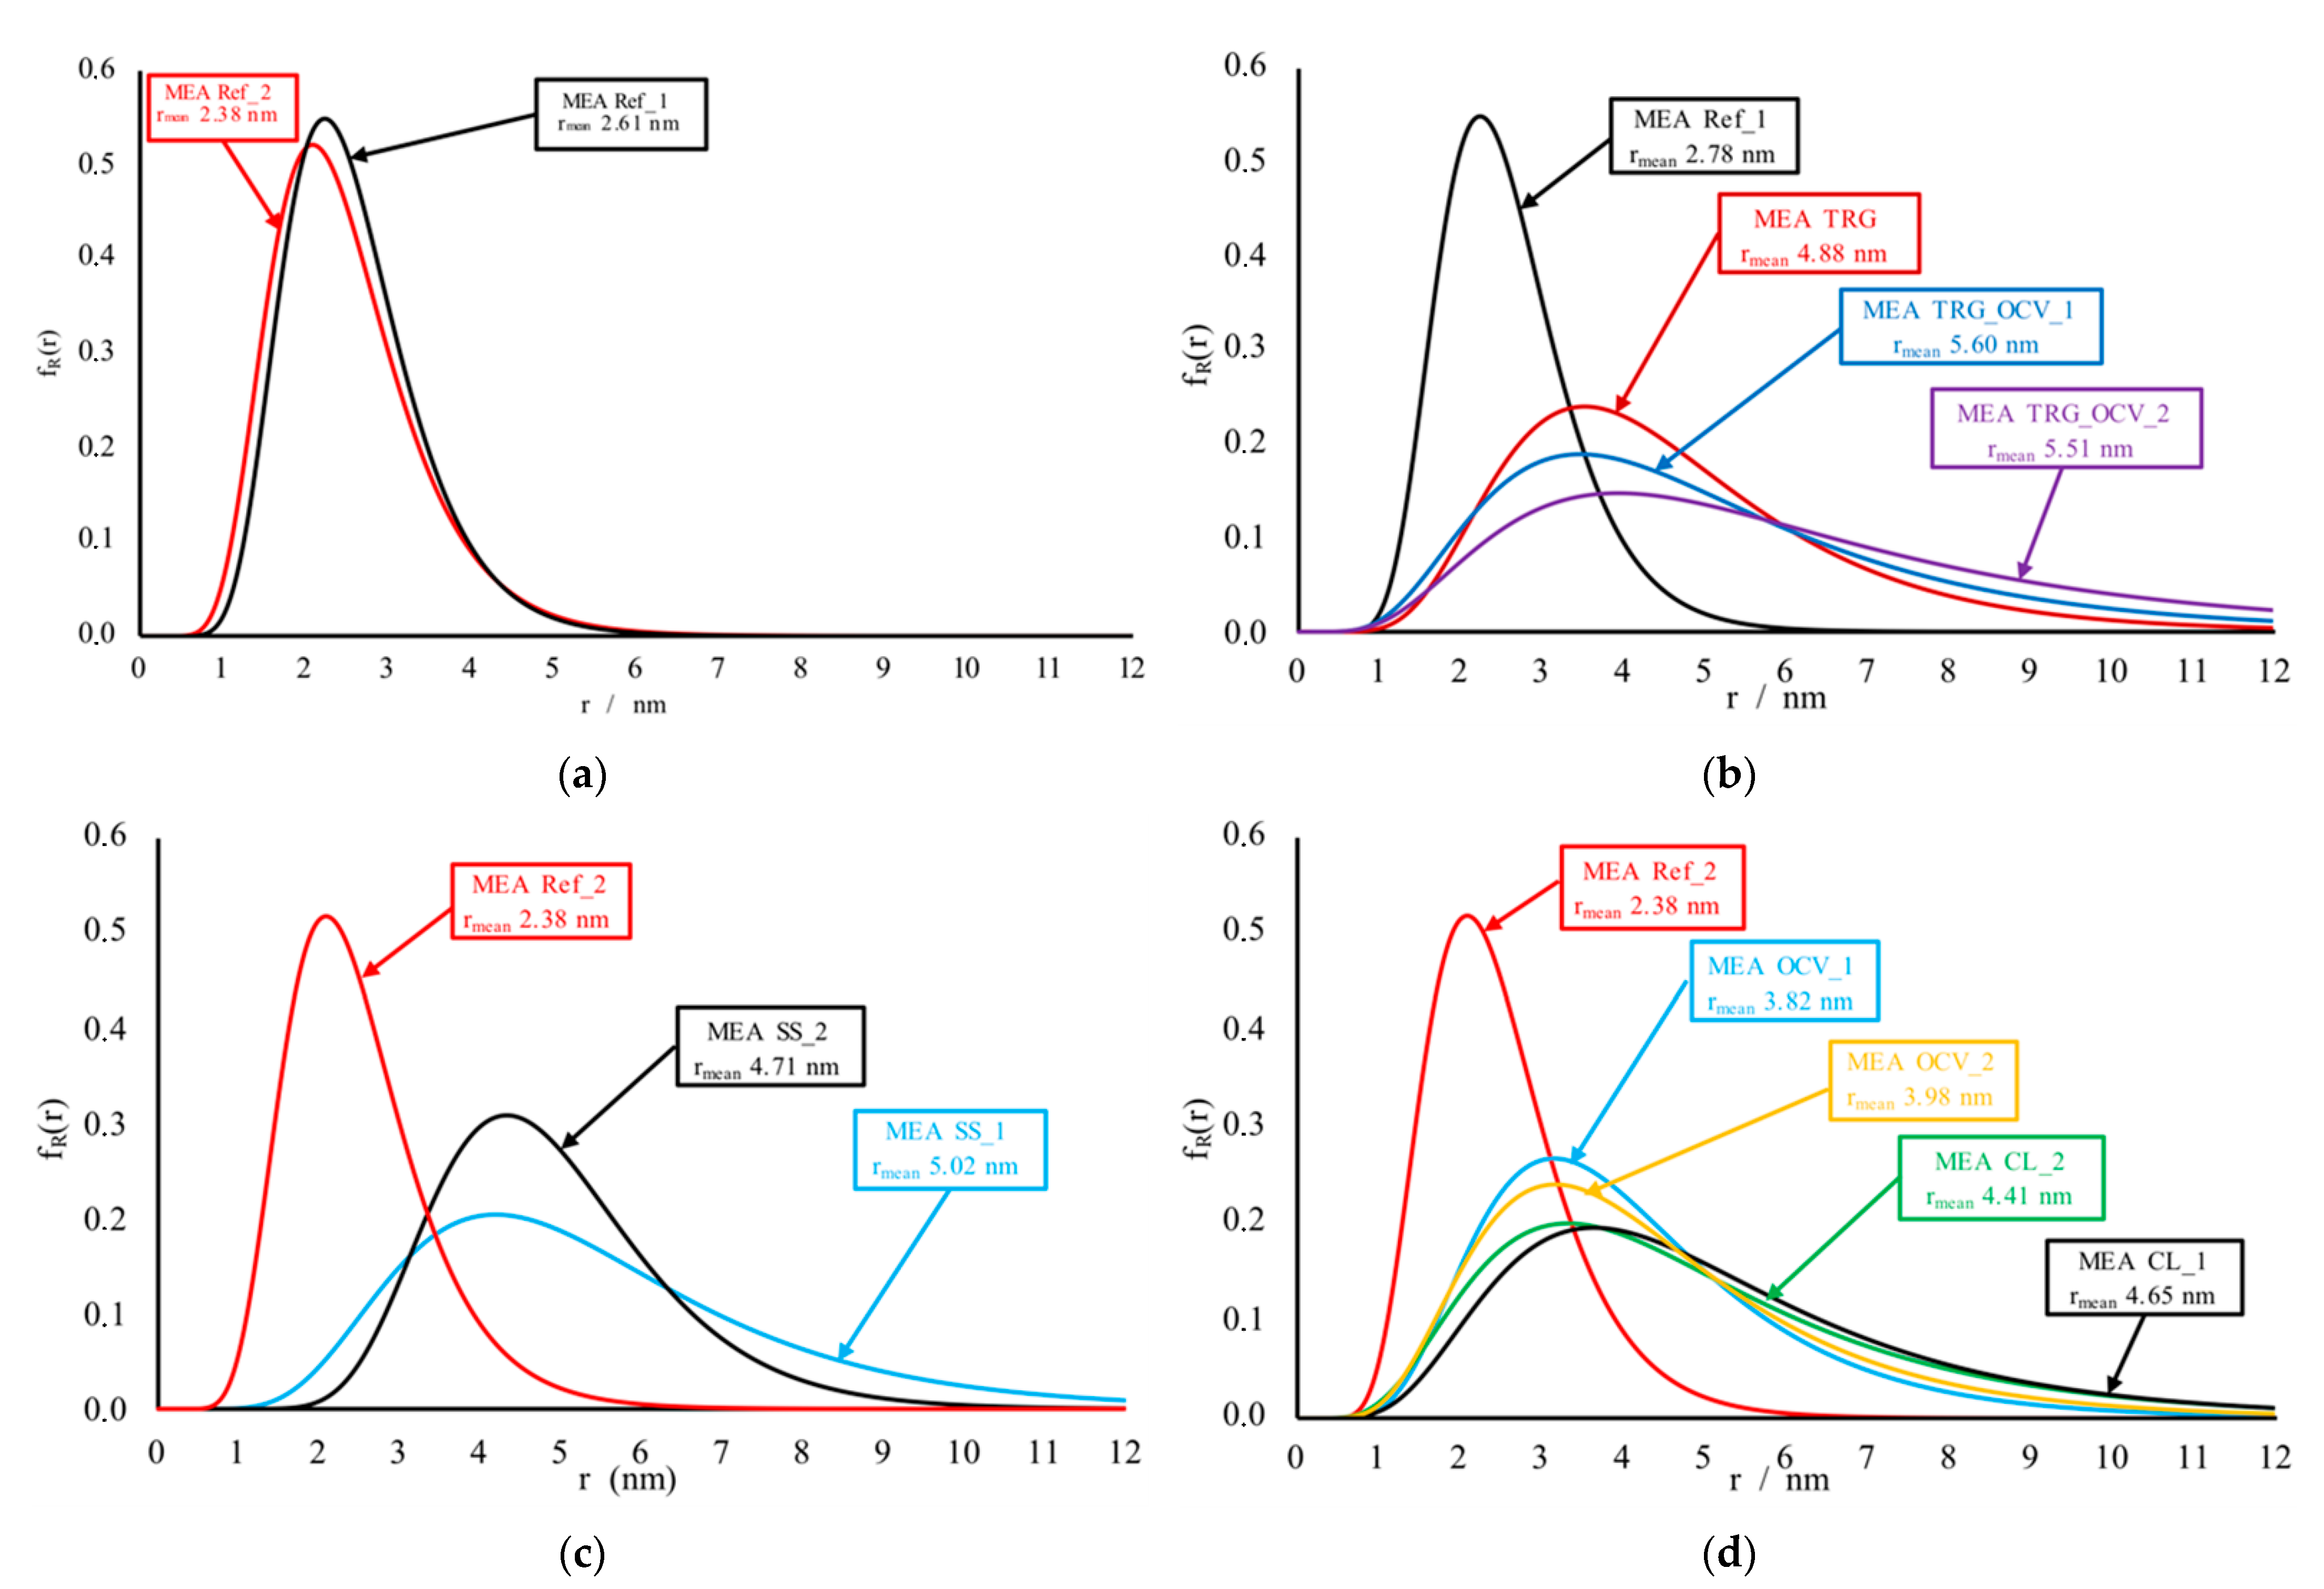
3.4. Small Angle X-ray Scattering (SAXS) Measurements
4. Discussion
5. Conclusions
Author Contributions
Funding
Conflicts of Interest
References
- Taccani, R.; Ustolin, F.; Zuliani, N.; Pinamonti, P.; Pietra, A. Fuel Cells and Shipping Emissions Mitigation. In Technology and Science for the Ships of the Future: Proceedings of NAV 2018: 19th International Conference on Ship and Maritime Research; IOS Press: Amsterdam, The Netherlands, 2018; pp. 885–892. [Google Scholar]
- Ustolin, F.; Taccani, R. Fuel Cells for Airborne Usage: Energy Storage Comparison. Int. J. Hydrogen Energy 2018, 43, 11853–11861. [Google Scholar] [CrossRef]
- Valle, F.; Zuliani, N.; Marmiroli, B.; Amenitsch, H.; Taccani, R. SAXS Analysis of Catalyst Degradation in High Temperature PEM Fuel Cells Subjected to Accelerated Ageing Tests. Fuel Cells 2014, 14, 938–944. [Google Scholar] [CrossRef]
- Moçotéguy, P.; Ludwig, B.; Scholta, J.; Barrera, R.; Ginocchio, S. Long Term Testing in Continuous Mode of HT-PEMFC Based H3PO 4/PBI Celtec-PMEAs for μ-CHP Applications. Fuel Cells 2009, 9, 325–348. [Google Scholar] [CrossRef]
- Oono, Y.; Sounai, A.; Hori, M. Long-Term Cell Degradation Mechanism in High-Temperature Proton Exchange Membrane Fuel Cells. J. Power Sources 2012, 210, 366–373. [Google Scholar] [CrossRef]
- Oono, Y.; Sounai, A.; Hori, M. Prolongation of Lifetime of High Temperature Proton Exchange Membrane Fuel Cells. J. Power Sources 2013, 241, 87–93. [Google Scholar] [CrossRef]
- Voorhees, P.W. Ostwald Ripening of Two-Phase Mixtures. Annu. Rev. Mater. Sci. 1992, 22, 197–215. [Google Scholar] [CrossRef]
- Takajo, S. Analysis of Particle Growth by Coalescence during Liquid Phase Sintering. Acta Met. 1984, 32, 107. [Google Scholar] [CrossRef]
- Kerr, R.; García, H.R.; Rastedt, M.; Wagner, P.; Alfaro, S.M.; Romero, M.T.; Terkelsen, C.; Steenberg, T.; Hjuler, H.A. Lifetime and Degradation of High Temperature PEM Membrane Electrode Assemblies. Int. J. Hydrogen Energy 2015, 40, 16860–16866. [Google Scholar] [CrossRef]
- Smith, M.C.; Gilbert, J.A.; Mawdsley, J.R.; Seifert, S.; Myers, D.J. In Situ Small-Angle X-Ray Scattering Observation of Pt Catalyst Particle Growth during Potential Cycling. J. Am. Chem. Soc. 2008, 130, 8112–8113. [Google Scholar] [CrossRef]
- Taccani, R.; Chinese, T.; Boaro, M. Effect of Accelerated Ageing Tests on PBI HTPEM Fuel Cells Performance Degradation. Int. J. Hydrogen Energy 2017, 42, 1875–1883. [Google Scholar] [CrossRef]
- Büchi, N.; Inaba, M.; Schmidt , J. Polymer Electrolyte Fuel Cell Durability; Springer: New York, NY, USA, 2009. [Google Scholar]
- Liu, S.; Rasinski, M.; Lin, Y.; Wippermann, K.; Everwand, A.; Lehnert, W. Effects of Constant Load Operations on Platinum Bands Formation and Cathode Degradation in High-Temperature Polymer Electrolyte Fuel Cells. Electrochim. Acta 2018, 289, 354–362. [Google Scholar] [CrossRef]
- Zhang, J. PEM Fuel Cell Electrocatalysts and Catalyst Layers; Springer: London, UK, 2008. [Google Scholar]
- Qi, Z.; Buelte, S. Effect of Open Circuit Voltage on Performance and Degradation of High Temperature PBI-H3PO4fuel Cells. J. Power Sources 2006, 161, 1126–1132. [Google Scholar] [CrossRef]
- Wu, J.; Yuan, X.Z.; Martin, J.J.; Wang, H.; Zhang, J.; Shen, J.; Wu, S.; Merida, W. A Review of PEM Fuel Cell Durability: Degradation Mechanisms and Mitigation Strategies. J. Power Sources 2008, 184, 104–119. [Google Scholar] [CrossRef]
- Zhang, S.; Yuan, X.Z.; Hin, J.N.C.; Wang, H.; Wu, J.; Friedrich, K.A.; Schulze, M. Effects of Open-Circuit Operation on Membrane and Catalyst Layer Degradation in Proton Exchange Membrane Fuel Cells. J. Power Sources 2010, 195, 1142–1148. [Google Scholar] [CrossRef] [Green Version]
- Haubold, H.G.; Wang, X.H.; Jungbluth, H.; Goerigk, G.; Schilling, W. In situ anomalous small-angle X-ray scattering and X-ray absorption near-edge structure investigation of catalyst structures and reaction. J. Mol. Struct. 1996, 383, 283–289. [Google Scholar] [CrossRef]
- Stevens, D.A.; Zhang, S.; Chen, Z.; Dahn, J.R. On the determination of platinum particle size in carbon-supported platinum electrocatalysts for fuel cell applications. Carbon 2003, 41, 2769–2777. [Google Scholar] [CrossRef]
- Yu, C.; Holby, E.F.; Yang, R.; Toney, M.F.; Morgan, D.; Strasser, P. Growth Trajectories and Coarsening Mechanisms of Metal Nanoparticle Electrocatalysts. ChemCatChem 2012, 4, 766–770. [Google Scholar] [CrossRef]
- Gilbert, J.A.; Kropf, A.J.; Kariuki, N.N.; DeCrane, S.; Wang, X.; Rasouli, S.; Yu, K.; Ferreira, P.J.; Morgan, D.; Myers, D.J. In-Operando Anomalous Small-Angle X-Ray Scattering Investigation of Pt 3 Co Catalyst Degradation in Aqueous and Fuel Cell Environments. J. Electrochem. Soc. 2015, 162, F1487–F1497. [Google Scholar] [CrossRef] [Green Version]
- Kabza, A.; Malkow, T.; Antoni, L.; Muñoz, M.; Tsotridis, G.; Pilenga, A.; Schätzle, M.; Rosini, S.; Van Bogaert, G.; Thalau, O.; et al. PEFC Power Stack Performance Testing Procedure. Measuring Voltage and Power as Function of Current Density. Polarisation Curve Test Method; Test module PEFC ST 5-3; JRC European Commission: Petten, The Netherlands, 2009. [Google Scholar]
- De Marco, G.; Pilenga, A.; Honselaar, M.; Malkow, T.; Tsotridis, G.; Janssen, A.; Rietveld, B.; Vinke, I.; Kiviaho, J. Testing the Voltage and Power as Function of Current Density: Polarisation Curve for a SOFC Single Cell; JRC: Petten, The Netherlands, 2010. [Google Scholar]
- Galbiati, S.; Baricci, A.; Casalegno, A.; Marchesi, R. Degradation in Phosphoric Acid Doped Polymer Fuel Cells: A 6000 h Parametric Investigation. Int. J. Hydrogen Energy 2013, 38, 6469–6480. [Google Scholar] [CrossRef]
- Cooper, K.R. In Situ Pem Fuel Cell Electrochemical Surface Area and Catalyst Utilization Measurement. Available online: https://www.scribner.com/wp-content/uploads/2017/06/Scribner-on-ECSA-Fuel-Cell-Magazine-2009.pdf (accessed on 14 October 2021).
- Amenitsch, H.; Bernstorff, S.; Kriechbaum, M.; Lombardo, D.; Mio, H.; Rappolt, M.; Laggner, P. Performance and First Results of the ELETTRA High-Flux Beamline for Small-Angle X-ray Scattering. J. Appl. Crystallogr. 1997, 30, 872–876. [Google Scholar] [CrossRef]
- Huang, T.C.; Toraya, H.; Blanton, T.N.; Wu, Y. X-Ray Powder Diffraction Analysis of Silver Behenate, a Possible Low-Angle Diffraction Standard. J. Appl. Crystallogr. 1993, 26 Pt 2, 180–184. [Google Scholar] [CrossRef] [Green Version]
- Hammersley, A. P ESRF Internal Report, ESRF98HA01T, FIT2D V9.129 Reference Manual V3.1; European Synchrotron Radiation Facility: Grenoble, France, 1998. [Google Scholar]
- Pontoni, D.; Finet, S.; Narayanan, T.; Rennie, A.R. Interactions and Kinetic Arrest in an Adhesive Hard-Sphere Colloidal System. J. Chem. Phys. 2003, 119, 6157–6165. [Google Scholar] [CrossRef]
- Modestov, A.D.; Tarasevich, M.R.; Filimonov, V.Y.; Zagudaeva, N.M. Degradation of High Temperature MEA with PBI-H 3 PO 4 Membrane in a Life Test. Electrochim. Acta 2009, 54, 7121–7127. [Google Scholar] [CrossRef]
- Hu, J.; Zhang, H.; Zhai, Y.; Liu, G.; Yi, B. 500 h Continuous Aging Life Test on PBI/H3PO4 High-Temperature PEMFC. Int. J. Hydrogen Energy 2006, 31, 1855–1862. [Google Scholar] [CrossRef]
- Bandlamudi, G. Systematic Characterization of HT PEMFCs Containing Pbi/H3PO4 Systems. Thermodynamic Analysis and Experimental Investigations; Logos Verlag Berlin GmbH: Berlin, Germany, 2011. [Google Scholar]
- Schmidt, T.J.; Baurmeister, J. Properties of high-temperature PEFC Celtec®-P 1000 MEAs in start/stop operation mode. J. Power Sources 2008, 176, 428–434. [Google Scholar]
- Kim, J.; Kim, M.; Lee, B.G.; Sohn, Y.J. Durability of High Temperature Polymer Electrolyte Membrane Fuel Cells in Daily Based Start/Stop Operation Mode Using Reformed Gas. Int. J. Hydrogen Energy 2015, 40, 7769–7776. [Google Scholar] [CrossRef]
- O’Hayre, R.; Cha, S.-W.; Colella, W.; Prinz, F.B. Fuel Cell Fundamentals; John Wiley & Sons: Hoboken, NJ, USA, 2006. [Google Scholar]
- Arif, A.; Devianto, H.; Isdiriayani, N. EAP13-4571 PEMFC Carbon Corrosion Due to Start-Stop Cycling. In Proceedings of the NACE East Asia Pacific Rim Conference, Kyoto, Japan, 19–21 November 2013. [Google Scholar]
- Seo, D.; Lee, J.; Park, S.; Rhee, J.; Won, S.; Shul, Y. Investigation of MEA Degradation in PEM Fuel Cell by on / off Cyclic Operation under Different Humid Conditions. Int. J. Hydrogen Energy 2011, 36, 1828–1836. [Google Scholar] [CrossRef]
- Fairweather, J.D.; Spernjak, D.; Weber, A.Z.; Harvey, D.; Wessel, S.; Hussey, D.S.; Jacobson, D.L.; Artyushkova, K.; Mukundan, R.; Borup, R.L. Effects of Cathode Corrosion on Through-Plane Water Transport in Proton Exchange Membrane Fuel Cells; J. Electrochem. Soc.: Pennington, NJ, USA, 2013; Volume 160, pp. F980–F993. [Google Scholar] [CrossRef]
- Bandlamudi, V.; Bujlo, P.; Sita, C.; Pasupathi, S. Study on Electrode Carbon Corrosion of High Temperature Proton Exchange Membrane Fuel Cell. Mater. Today Proc. 2018, 5, 10602–10610. [Google Scholar] [CrossRef]
- Kim, J.; Yi, J.S.; Song, T. Investigation of Degradation Mechanisms of a High-Temperature Polymer-Electrolyte-Membrane Fuel Cell Stack by Electrochemical Impedance Spectroscopy. J. Power Sources 2012, 220, 54–64. [Google Scholar] [CrossRef]
- Rastedt, M.; Pinar, F.J.; Pilinski, N.; Wagner, P. Effects of Reactant Gases on HT-PEM Fuel Cells. ECS Trans. 2015, 69, 535–549. [Google Scholar] [CrossRef] [Green Version]
- Jeon, Y.; Na, H.; Hwang, H.; Park, J.; Hwang, H.; Shul, Y. Accelerated Life-Time Test Protocols for Polymer Electrolyte Membrane Fuel Cells Operated at High Temperature. Int. J. Hydrogen Energy 2015, 40, 3057–3067. [Google Scholar] [CrossRef]
- Kannan, A.; Kabza, A.; Scholta, J. Long Term Testing of Start e Stop Cycles on High Temperature PEM Fuel Cell Stack. J. Power Sources 2015, 277, 312–316. [Google Scholar] [CrossRef]


| MEA Label | Load Profiles |
|---|---|
| MEA Ref_1, MEA Ref_2 | Unloaded MEA used as reference |
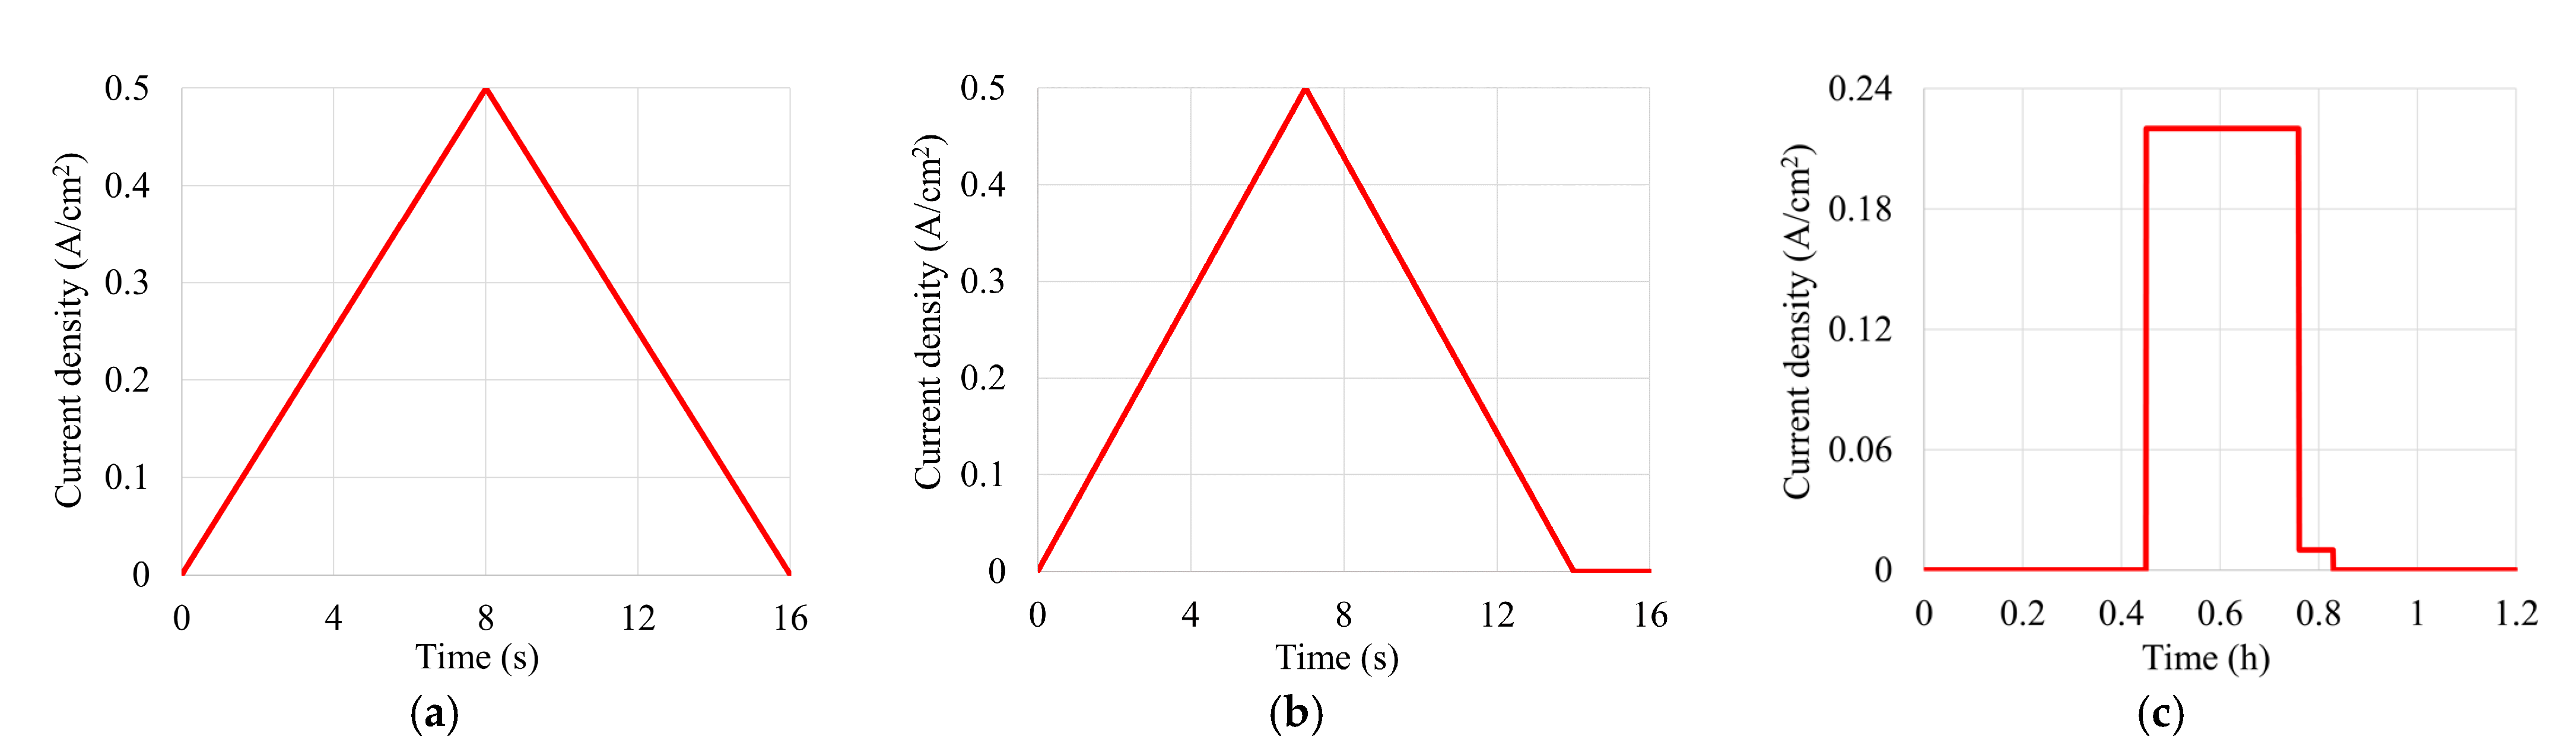
| MEA TRG | 100,000 triangular sweep cycles between open circuit voltage (OCV) and 0.5 A/cm2 corresponding to 440 h of operation |
| MEA TRG_OCV_1, MEA TRG_OCV_2 | 125,000 triangular sweep cycles between OCV and 0.5 A/cm2 with 2 s of permanence at OCV corresponding to 550 h of operation |
| MEA CL_1, MEA CL_2 | 550 h of constant load operation at 0.22 A/cm2 |
| MEA SS_1 MEA SS_2 | 1000 start and stop cycles300 start and stop cycles |
| MEA OCV_1 MEA OCV_2 | 126 h of constant OCV400 h of constant OCV |
| MEA Label | ECSA Reduction |
|---|---|
| MEA TRG | - |
| MEA TRG_OCV_1 | - |
| MEA TRG_OCV_2 | 50% |
| MEA CL_1 | 30% |
| MEA CL_2 | 30% |
| MEA SS_1 | - |
| MEA SS_2 | - |
| MEA OCV_1 | 10% |
| MEA OCV_2 | 10% |
| MEA Label | Pt Particles Size (nm) | Degradation Rate | |
|---|---|---|---|
| rmean | St. dev. | (µV/h) | |
| MEA Ref_1—previous work [3] | 2.78 | 0.64 | - |
| MEA Ref_2 | 2.38 | 0.59 | - |
| MEA TRG—previous work [3] | 4.88 | 0.66 | 34 |
| MEA TRG_OCV_1—previous work [3] | 5.60 | 0.66 | 45 |
| MEA TRG_OCV_2 | 5.51 | 0.76 | 44 |
| MEA CL_1 | 4.65 | 0.70 | 30 |
| MEA CL_2 | 4.41 | 0.72 | 29 |
| MEA SS_1 | 5.02 | 0.65 | 55 |
| MEA SS_2 | 4.71 | 0.53 | 81 |
| MEA OCV_1 | 3.82 | 0.66 | 444 |
| MEA OCV_2 | 3.98 | 0.69 | 124 |
Publisher’s Note: MDPI stays neutral with regard to jurisdictional claims in published maps and institutional affiliations. |
© 2021 by the authors. Licensee MDPI, Basel, Switzerland. This article is an open access article distributed under the terms and conditions of the Creative Commons Attribution (CC BY) license (https://creativecommons.org/licenses/by/4.0/).
Share and Cite
Chinese, T.; Ustolin, F.; Marmiroli, B.; Amenitsch, H.; Taccani, R. Experimental Analysis on the Influence of Operating Profiles on High Temperature Polymer Electrolyte Membrane Fuel Cells. Energies 2021, 14, 6737. https://doi.org/10.3390/en14206737
Chinese T, Ustolin F, Marmiroli B, Amenitsch H, Taccani R. Experimental Analysis on the Influence of Operating Profiles on High Temperature Polymer Electrolyte Membrane Fuel Cells. Energies. 2021; 14(20):6737. https://doi.org/10.3390/en14206737
Chicago/Turabian StyleChinese, Tancredi, Federico Ustolin, Benedetta Marmiroli, Heinz Amenitsch, and Rodolfo Taccani. 2021. "Experimental Analysis on the Influence of Operating Profiles on High Temperature Polymer Electrolyte Membrane Fuel Cells" Energies 14, no. 20: 6737. https://doi.org/10.3390/en14206737
APA StyleChinese, T., Ustolin, F., Marmiroli, B., Amenitsch, H., & Taccani, R. (2021). Experimental Analysis on the Influence of Operating Profiles on High Temperature Polymer Electrolyte Membrane Fuel Cells. Energies, 14(20), 6737. https://doi.org/10.3390/en14206737