Article

Probabilistic Short-Term Load Forecasting Incorporating Behind-the-Meter (BTM) Photovoltaic (PV) Generation and Battery Energy Storage Systems (BESSs)

The School of Electrical Engineering, Korea University, Seoul 02841, Korea
*
Author to whom correspondence should be addressed.
Energies 2021, 14(21), 7067; https://doi.org/10.3390/en14217067
Submission received: 27 September 2021 / Revised: 19 October 2021 / Accepted: 25 October 2021 / Published: 28 October 2021
(This article belongs to the Special Issue Future of Smart Grid and Renewable Energy)

Abstract

:
Increased behind-the-meter (BTM) solar generation causes additional errors in short-term load forecasting. To ensure power grid reliability, it is necessary to consider the influence of the behind-the-meter distributed resources. This study proposes a method to estimate the size of behind-the-meter assets by region to enhance load forecasting accuracy. This paper proposes a semi-supervised approach to BTM capacity estimation, including PV and battery energy storage systems (BESSs), to improve net load forecast using a probabilistic approach. A co-optimization is proposed to simultaneously optimize the hidden BTM capacity estimation and the expected improvement to the net load forecast. Finally, this paper presents a net load forecasting method that incorporates the results of BTM capacity estimation. To describe the efficiency of the proposed method, a study was conducted using actual utility data. The numerical results show that the proposed method improves the load forecasting accuracy by revealing the gross load pattern and reducing the influence of the BTM patterns.

1. Introduction

Renewable generation has rapidly increased based on governmental support to reduce carbon emissions and improve energy sustainability. Many countries have provided financial incentives and deregulated the installation of renewable energy systems to achieve penetration goals. The incentive schemes were designed to favor small-scale distributed energy resources (DERs), especially solar plus batteries, and most are developed as small-scale photovoltaic (PV) power systems that are more profitable than other generation types. Most small-scale PV companies have signed power purchase agreements (PPAs) with utilities to avoid financial risk and there are also privately owned small PVs such as rooftop solar systems. Unlike utility-scale PV systems, facility deregulation allows small-scale PV systems to use inexpensive metering systems that cannot monitor power in real-time or distinguish between solar and battery output.
Short-term load forecasting is essential for efficient power grid operations [1]. Electric demand forecasting was carried out in consideration of weather conditions, time variables, and holiday information [2]. In recent years, however, it has been more difficult to accurately forecast the net load because the capacity of BTM DERs has increased while it cannot be properly monitored [3]. In the past few years, many studies have been presented to address the impact of BTM on net load. There are mainly four contents of related work: (i) BTM estimation using alternative verification methods without true data points, (ii) BTM estimation with verification using true data points, (iii) various BTM estimation algorithms to disaggregate the BTM pattern from net load, and (iv) load forecasting methods to address the underlying uncertainties and BTM patterns.

2. Literature Review

BTM capacity estimation methods pose inherent challenges in deploying ground-truth data points. From a practical perspective, there are limited methods to verify the accuracy of the estimated BTM capacities. Thus, prior research has validated BTM capacity estimation results, excluding true data points. Wang et al. represented all BTM PV outputs by adopting virtual equivalent PV, was derived from weather and location data [4]. Shaker applied multiple BTM penetration scenarios to demonstrate the overall estimation accuracy [5]. the BTM capacity in low-voltage networks was analyzed using the weather condition changes and net load difference. Sun et al. focused on extreme weather condition and compared them to close days when electric demand patterns were less affected [6]. System operators need to continuously track the quantity of behind-the-meter DERs, which is a prerequisite for improving the transparency of the grid and reducing the uncertainties in net load patterns. Pennsylvania-New Jersey-Maryland Interconnection (PJM), which is a system operator in the United States, reconstitutes the net load using BTM capacity/pattern estimation and improves the results of net load forecasting integrated with PV forecast [2,3]. Load forecasting accuracy improvement was generally used in previous studies to validate the BTM capacity estimation results and the California Independent System Operator (CAISO) used the p-value and Pearson correlation coefficient to measure the load forecast improvement [7].
However, some research was able to validate its efficiency using actual data. Li et al. presented a two-stage decoupled estimation for disaggregate net load into load and BTM PV. The results were validated through actual utility data [8]. Shaffery et al. proposed a framework based on a Bayesian process to decompose the net load into the gross load and BTM PV patterns [9]. Representative solar sites were selected from the available historical data and used to estimate the entire BTM PV pattern [6,10,11,12]. Several previous studies have considered BTM resource behavior from a bottom-up approach using low-voltage network data. The BTM BESS was estimated by matching the assumed charging/discharging schedule patterns using California power system data [13].
BTM capacity estimation are derived from the various methodology. Kabir et al. presented an unsupervised framework used to disaggregate the residential load patterns and applied a mixed hidden Markov model (MHMM) to model the human behavior [14]. Li et al. proposed two-stage approach to disaggregate the effect of BTM PV from residential load pattern and adopted support vector machine (SVR) and an ensemble technique to address the analysis for 300 customers [15]. To consider regional differences, Mason et al. used a deep neural network to determine the representative BTM PV characteristics, such as tilt and azimuth [16]. Pan et al. showed the approach to disaggregate the impact of BTM PV through variability analysis [17]. Bu demonstrated a data-driven approach on netload disaggregation using game theory [18]. Peng et al. presented the method to determine the investment configuration including BTM PV plus BESS operations [19].
Recently, artificial neural networks have been widely used in short-term load prediction studies and show advanced results when combined with quantitative regression [20,21]. The net load forecasting accuracy was improved through a probabilistic approach that consider the uncertainties of input variables [22]. Saeedi et al. proposed an adaptive method to consider changes on load trend, human behavior, and the impact of additional BTM PV [23]. PJM and CAISO also used neural network framework to improve net load forecasting accuracy considering BTM patterns [3,7]. Kwon et al. showed that an online learning method improves the accuracy by quickly adapting underlying changes on net load [24]. In addition, autoencoder and recurrent neural network models are also used to forecast PV patterns using weather conditions, capacity data, and locational data [25,26].
From the previous studies, as shown in Table 1, it can be observed that the accuracy of net load forecasting is improved through the process of disaggregating the net load into gross load and BTM patterns. It is obvious that BTM capacity estimation accuracy and net load forecasting accuracy are complementary to each other. Furthermore, the net load forecasting accuracy was improved by considering hidden BTM patterns [27]. This study also aimed to improve short-term load forecasting by considering the presence of behind-the-meter PVs and BESS. This study proposes a method for considering the uncertainties inherent in the BTM capacity estimation results for short-term load forecasting. Even incompletely, the provided true values had a positive effect on verifying the research results. From a practical perspective, this study referred to statistical data points from authorities, which are not precise but are sufficiently referenced. Front-the-meter (FTM) patterns by region were applied to address regional PV pattern differences. Referring to previous studies on regional differences in BTM PV patterns, this study also aimed to estimate and disaggregate the BTM capacity into eight major regions incorporating regional weather differences. The impact of BTM BESS is estimated based on metering system configuration and operation scheduling considering incentive policy structure.
The remainder of this paper is organized as follows: Section 3 presents the problem description. Section 4 formulates the proposed approach to estimate the BTM resources and applies the probabilistic load forecast method using previous results. The numerical studies and results are described in Section 5. Section 6 concludes the paper.

3. Problem Description

This section introduces the approach for formulating the behind-the-meter estimation problem and the proposed method for integrated short-term load forecasting. In general, load forecasting is a practical/alternative approach to modeling human behavior regarding electricity consumption; for this reason, weather information is commonly used for load forecasting to consider heating/cooling device loads. Based on this approach, traditional load forecasting methods can be formulated as in Equation (1):
Y t = f X , Y t 1 + e 1
Y t = f X , Y t 1 + g X , Y t 1 + e 2
where the error term e 1 can be minimized if the load forecasting model f performs well; it can be defined as white noise.
However, model f is fitted to follow the major human behavior and without additional information, it is difficult to find another behavior g presented in Equation (2). This study proposes a hierarchical structure to clarify the relationship between power resources, as shown in Figure 1. From a bottom-up perspective, the pattern of each power resource group can be explained simply [5,10]. Conversely, the net load and BTM pattern can be expressed by Equations (3) and (4)., respectively. Furthermore, e 1 can be minimized by extracting the BTM pattern from e 1 :
L t = y t + b t + e 3
b t = B p v , t + B i n , t + B o u t , t
where y t and L t are the net and gross loads, respectively. b t is an integrated BTM pattern, including solar and battery charging/discharging.
In previous studies, BTM patterns were derived from solar radiation and locational information using physical PV modeling [4,13]. However, the variation in installation status is quite different in the real world. The integrated outputs of PVs are highly correlated with solar radiation but also distributed owing to other weather parameters, as shown in Figure 2a. To consider regional weather differences and the physical properties of PVs, it is reasonable to incorporate front-the-meter PV data. This study assumed that the equivalent properties of the BTM are the same as those of the FTM for the same period.
In addition, Figure 2b shows that the slope between power generation and solar radiation, or power generation efficiency, decreased. This can be explained through the operation of behind-the-meter batteries. Behind-the-meter batteries are encouraged to charge during the day and discharge at night to receive the maximum renewable incentives in South Korea. It can also be observed in the upper tail of Figure 2b. BTM batteries are charged and discharged according to the scheduling of the operator, regardless of external environmental changes. To estimate the output of BTM BESS, this study assumed that all BTM BESS are operated to maximize the incentive revenue. In addition, this study assumed that the BTM capacity does not decrease because PVs and batteries last for at least 15 years.
Figure 3 shows the overall process of the proposed approach, which is combined with three components: probabilistic net load forecasting, BTM capacity estimation, and beam search. For probabilistic net load forecasting, this study applied a weak forecasting model to generate the forecasting error, which is considered a system-biased error, such as BTM solar pattern. The proposed BTM capacity estimation extracts the BTM pattern from the forecasting error using the regulated gradient descent. For the beam search stage, the final BTM estimation results are derived by selecting an advantageous option among the various probabilistic cases.
Finally, the gross load was reconstituted using the estimation results and short-term load forecasting method is proposed that combines the forecasted gross load and the forecasted BTM pattern into net load.

4. Proposed Load Forecasting Method

The proposed behind-the-meter estimation method has four components, as shown in Figure 3. Each component is based on a data-driven approach. The detailed process details and data descriptions are provided in this section.

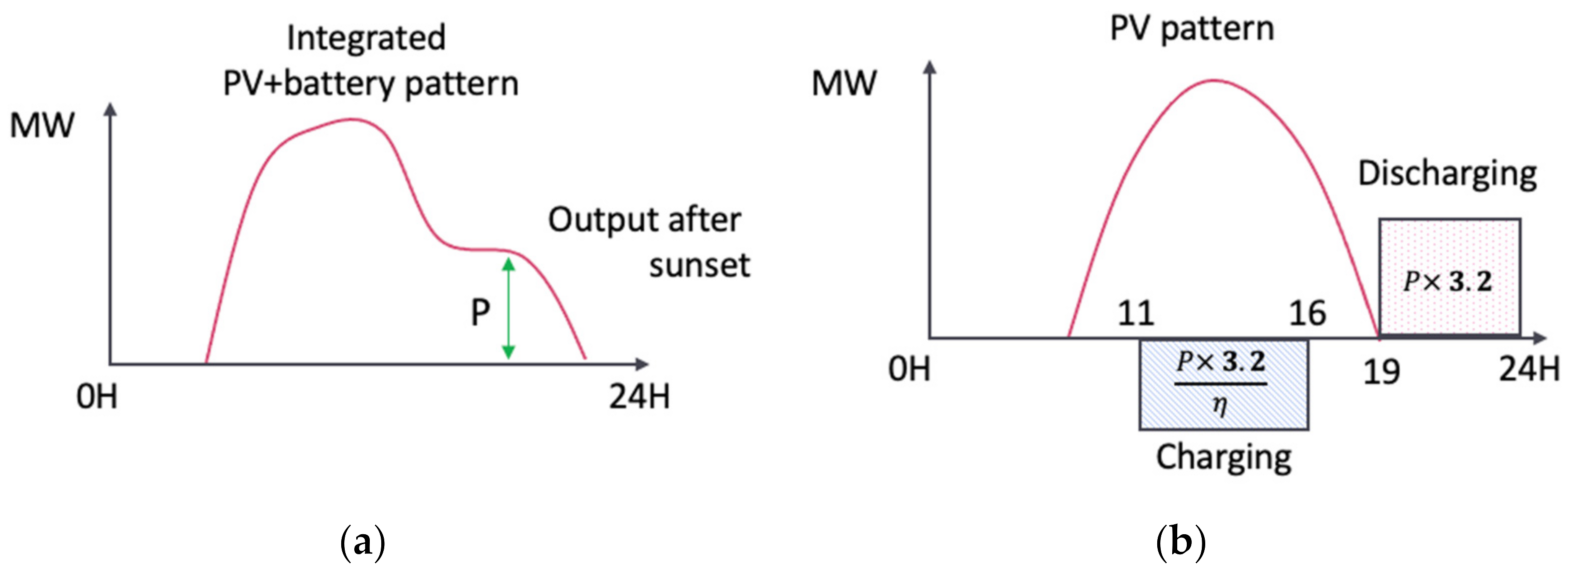
4.1. Preprocess to Decompose PV and BESS

The FTM output data require preprocessing to decompose the solar and BESS outputs because the solar plus BESS resources were measured in an integrated form. Some solar plants can distinguish between solar power and BESS output by extracting data from inverters whereas some simply install more metering systems. For economic reasons, non-mandatory facilities have been minimized; hence, most solar power plants only use one meter, as shown in Figure 4.
Owing to the phase difference, the integrated output is slightly less than the numerical sum of the solar and battery AC powers but can be neglected in the utility-scale problem. The BTM BESS charging/discharging schedule can be estimated by considering the incentive policy of the utility. BTM BESSs are motivated to be charged between 11 a.m. and 4 p.m. and discharged after 7 p.m. until 9 a.m. the following day. Figure 5 shows the daily operation of a PV plus BESS plant.
The BESS facility capacities, such as the inverter output and battery size, can be reasonably estimated through empirical facts. Many studies have proposed optimization investment methods to determine the capacities of inverters and batteries for solar plus battery systems [28]. However, the BTM pattern is combined with only PV and PV plus BESS plants. Moreover, the bottom-up method of estimating individual BESS operations in various places risks leading to the spread of errors [11].
For this reason, this study applied the simplified ratio in Table 2 and estimated the size of the BTM inverter and battery.
Table 2 can be justified because, for operational safety, the battery management system (BMS) approves charging when the solar output is larger than a certain threshold lb; usually lb is set to 10% of the solar capacity, indicated by the green dotted line in Figure 5, so the inverter capacity is less than PV. According to official statistics, the expected PV generation time is 3.7 h. Considering only the amount of power generated during the incentive period, this is approximately 320% of the PV capacity.
As shown in Figure 6, it is possible to approximate the size of the combined PV and battery based on the estimated inverter size, as presented in Table 2.
This study focused on BTM patterns after sunset, i.e., after 8 p.m., and is considered the maximum inverter output. To approach conservatively, the inverter capacity was derived on average, excluding the maximal and minimal 5 days from the monthly output at 8 p.m.; this method is proposed herein and is referred to as Mid (20/30). Individual differences by site were neglected, and the average BESS round-trip efficiency η was considered as 95%. The BTM inverter capacity was estimated as follows:
C i n v e r t e r = M i d 20 30 P d , 20 H   d   i n   a   m o n t h
The BTM battery capacity was estimated as follows:
C b a t t e r y , d = 3.2 η × C i n v e r t e r

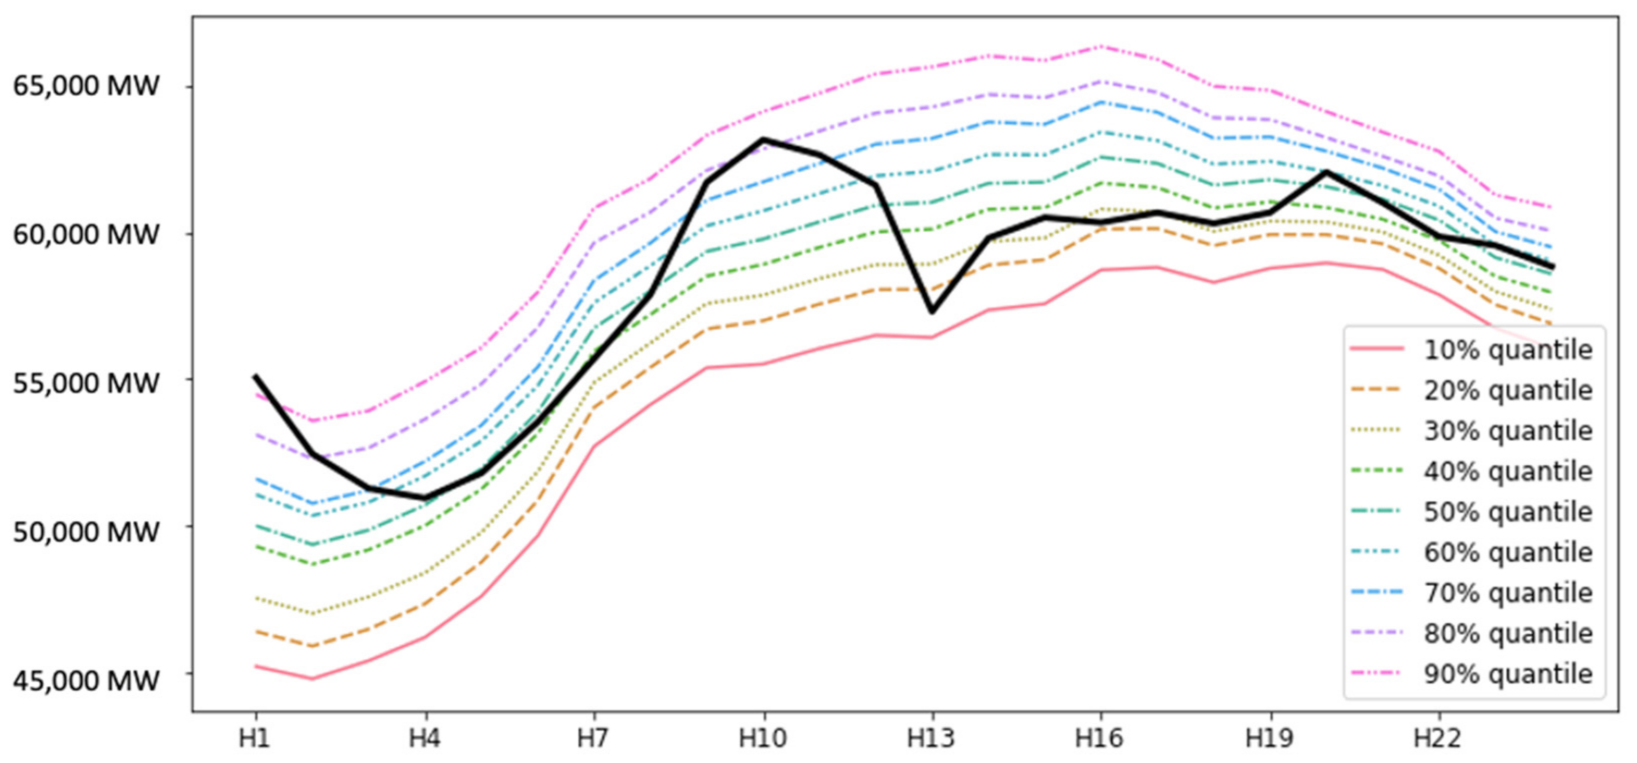
4.2. Regulated Probabilistic Net Load Forecast

The behind-the-meter patterns are hidden in the load forecast error patterns, but they cannot be simply identified owing to other factors, such as weather conditions, holidays, and long-term load growth. To minimize the impact of external factors, the load forecast error was derived using weekdays and reconstituted gross loads. Each month, the forecasting models were fitted using data from the preceding 12 months to consider the monthly changes on load pattern [29]. In general, short-term load forecasting models can be formulated as in Equation (7). The models use recent loads, observed weather, weather forecasts, and calendar features:
y ^ t = m o d e l y t w : t 1 ,   o t w : t 1 , f t w : t + h , c t w : t + h
where y ^ t is the forecasted net load at time t . o t w : t 1 and f t : t + h are observed weather in the past window w and weather forecasts in the forecasting horizon h, respectively. c t w : t + h denotes calendar features, such as year, month, and day of the week, which are known for all times.
However, in this study, the model was designed as an ex-post analysis, and there is a limit to the input data to avoid effects other than the BTM effect. Observed weather is used to avoid weather forecast errors, and previous loads are not used as input data to avoid pre-reflected BTM effects and autoregressive properties. The proposed regulated load forecasting model for detecting the BTM pattern is given in Equation (8):
y ^ t w : t 1 = m o d e l o t w : t 1 ,   c t w : t 1
The net load forecasting errors, which are used for BTM capacity estimation, are derived from the quantile forecasting method. Quantile regression is widely used to measure forecast points in consideration of underlying uncertainties and to estimate the reliability of forecasted results [20,22]. This study used quantile forecasting to generate quantile forecast values that provide a probabilistic range for each forecasted value.
This study adopted a quantile forecasting method to address the reliability of the BTM capacity estimation. The pinball loss is used as a loss function, as described in Equation (9):
P i n b a l l y t , τ = y t z τ i f   y z z y t 1 τ i f   z > y
where τ is generally a quantile value that lies between 0.1 and 0.9. y t is the target value and z is the forecasted value at quantile τ . Pinball loss is the sum of losses in all quantiles.
Applying pinball loss can treat weak net load forecasting models as probabilistic detectors to reveal hidden patterns, regardless of specific forecasting date issues. The quantile forecasting results are shown in Figure 7. It can be observed that the range of forecasted results varies over time. The gap is narrow at night, when net loads are less volatile, and widens during dawn or daytime.

4.3. BTM Estimation Using Probabilistic Forecasting Error

This study proposes a method for extracting reasonable BTM capacities from probabilistic net load errors. Using this method, the BTM solar, inverter, and battery sizes can be estimated. Previous studies have proposed BTM pattern estimation using insolation data and an equivalent solar panel model by region [4,13]. However, it should assume an ideal environment in which all solar panels have the same characteristics, such as generation efficiency, location, installed angle, and shading. This study used front-the-meter data, including solar and battery, that could represent average physical specifications by diversity. From a practical perspective, FTM data enables realistic analysis because it reflects the smoothing effect that must be considered when analyzing aggregated BTM resources.
The proposed BTM estimation method comprises three components, as shown in Figure 8. BTM PV estimation, BTM BESS estimation, and net load accuracy gain calculation. These processes are combined as an optimization problem to maximize the expected net load forecasting accuracy improvement using the gradient descent method.
Figure 9 depicts the estimation method used to find additional BTM PV capacity. As introduced in Section 4.1, the FTM data are decomposed into PV and BESS patterns. Regional FTM PV patterns were used to estimate the BTM patterns.
In Figure 9, P is a constant matrix, which is a given FTM pattern. W is a learnable weight matrix, which indicates additional BTM PV capacities by region. The ReLU function was applied based on the assumption that the BTM capacity did not decrease. C is a constant matrix, which is a BTM capacity estimation result from the former iteration and its details are formulated as in Equation (10). The weight value of W is initially randomly selected from the standard distribution. Weight values are updated through optimization iterations and fit to maximize accuracy gain. Matrix C is updated after iteration completes as in Equation (11).
From the proposed hierarchical relationship:
B P V , t =   P P A t + S E L F t =   R e L U W C t · max B P V , t 1
C t = B T M t 1 / max B P V , t 1
where P P A t is a matrix of known BTM solar capacities at time t , which are given data from the utility. S E L F t is a matrix of self-use BTM capacities and can be derived using the estimated BTM results and PPA data. Scaling is necessary to improve the convergence of the optimization process.
The BTM BESS capacity was estimated using the B matrix in Figure 9. B is a learnable weight matrix that represents regional inverter capacity, at the same time regional battery capacity can be estimated using Equation (6). The BTM BESS operation was modeled based on the greedy algorithm using previous size estimation. The daily BTM BESS operation can be classified by three time periods. The BTM BESS operation was generated as follows:
For t in 11~16 h:
B i n , t = η · max ( 0 , min ( C b a t t e r y t = 0 t 1 B i n , t , B P V , t l b · C P V ,   C i n v e r t e r ) ) B o u t , t = 0
For t in 18~24 h:
B o u t , t = η · max ( 0 ,   min ( C b a t t e r y t = 0 t B o u t , t   ,   C i n v e r t e r B P V , t ) ) B i n , t = 0
otherwise:
B i n , t = 0   a n d   B o u t , t = 0
where E is the energy charged in a day. B i n , t and B o u t , t are the charging and discharging powers, respectively. η is the BESS round-trip efficiency. The BESS operating lower bound lb is set to 10%.
After estimating the BTM pattern, depicted as Step I in Figure 8, estimating the expected gain improves the net load forecasting accuracy. The expected accuracy gain is the convolution area between the net load error and estimated BTM pattern, as shown in Figure 10. In this step, the proposed accuracy gain is calculated for all quantiles and all hours in the target period. The proposed accuracy gain can be formulated as follows:
G t = t , τ g r t , τ , b t
g r t , τ , b t = b t if   r t , τ b t   and   r t , τ b t 0 b t i f   r t , τ b t 0 2 r t , τ b t otherwise
where g is the proposed accuracy gain function. r t , τ is an error by quantile and time t. b t is a BTM pattern at time t.
The gain matrix consists of the accuracy gains per quantile. The quantile results can indicate the confidence level of the weak net load forecasting. BTM capacity is estimated conservatively because the sum of the gain matrix increases with narrower confidence level. This design also improves the convergence of the optimization process.
By maximizing the proposed gain, the proposed weights, such as W and B, are fitted to minimize the net load forecasting errors. This study used the gradient descent method to optimize this problem and provided sufficient iterations for convergence. Through this process, W and B are determined by quantiles. The proposed method can be applied to any length; however, in this study, it was applied monthly.

4.4. Navigation Method Using Beam Search

The beam search method is an expanded form of the greedy search algorithm. By tracking and updating the top-K paths in sequential programming, the beam search method can provide a more effective path than the greedy algorithm. Recently, beam search has been widely used in neural machine translation.
The previous results are only optimal BTM capacity estimates for the target period; thus, the best results are not guaranteed when used for the next estimation. In this study, a beam search algorithm was used to choose more profitable results for overall periods. The proposed navigation method is illustrated in Figure 4. The proposed method keeps the top-K paths and drops the rest. After estimating the next period using the remaining K paths, the method keeps the next top-K paths based on the connected gain and moves on. Finally, this method determines the result path with the highest gain among the remaining top-K paths.

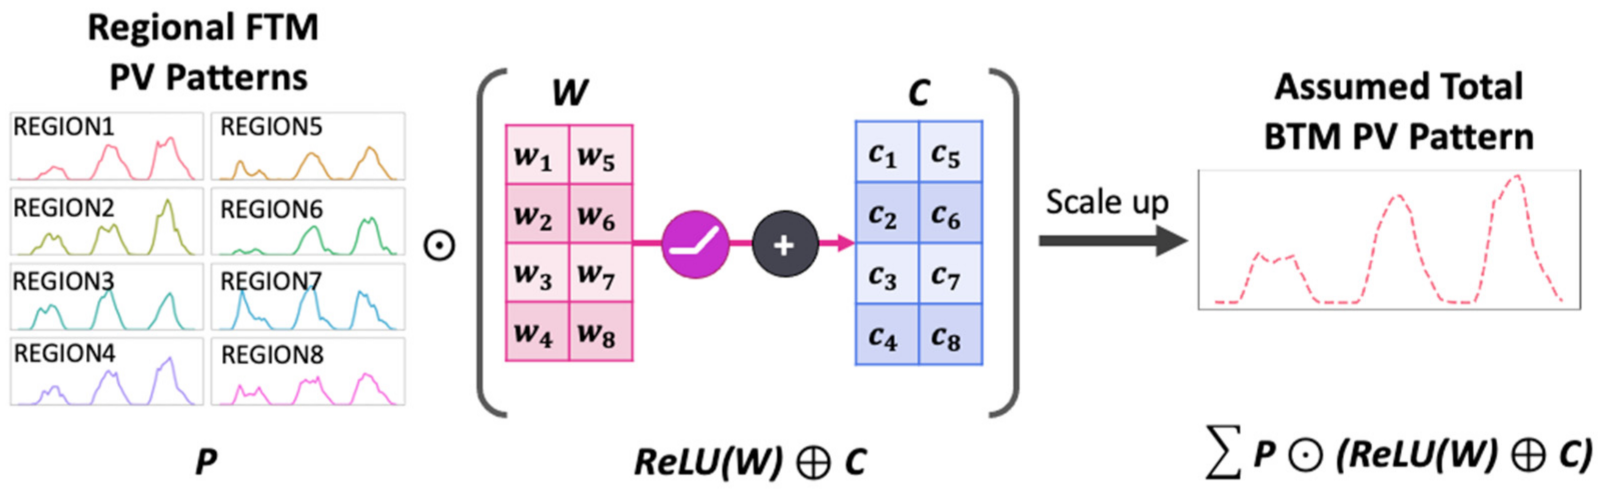
4.5. BTM Pattern Forecasting

In the prediction stage, a model for forecasting the BTM pattern is required. Because the operation of the BTM BESS is determined by the BTM PV pattern, the BTM PV pattern is forecasted first. Then, the pattern of the BTM BESS can be derived using Equations (12)–(14). and the forecasted BTM solar pattern. The proposed BTM PV forecasting model applies a neural network and uses the weather features [25,30]. The details are formulated in Equation (17):
B p v , t : t + h = B T M P V , t · M o d e l w t : t + h
where B p v , t : t + h is the target BTM solar pattern. The model output was scaled up using the estimated BTM solar capacity. In addition, w t : t + h means a set of observed weather features including solar irradiation, temperature, rainfall, and cloud amount. f t : t + h is for weather forecasts and replace w t : t + h during the training. In this study, the solar forecasting models were fitted for each region and, on the 1st of every month, they were trained for the last 12 months.

4.6. Net Load Forecasting Incorporating with BTM Forecast

From the BTM capacity estimation results, it is possible to restore the gross load from the actual net load and BTM estimation results. The BTM capacity was estimated using a probabilistic method but derived deterministically. Therefore, the gross load may be restored through a linear combination of the net load and BTM pattern. However, simply combining the two forecasting results may increase the error of the individual forecasting models. In addition, it can be estimated that solar power generation will affect the power usage behavior of users who have self-used solar systems. Therefore, the net load forecasting model uses gross load L and BTM pattern b as input data and can be formulated by modifying Equation (7) as follows:
y ^ t = m o d e l L t w : t 1 ,   b t w : t + h ,   o t w : t 1 , f t w : t + h , c t w : t + h
Unlike the previous weak net load forecasting model, this model has an input/output structure using autocorrelation and was implemented by applying a deep neural network technique.

5. Results

In this section, a short-term load forecasting simulation is provided to verify the efficacy of the proposed method. The data set used in this study consisted of observed weather and forecast data, calendar data, and power market data, as detailed in Table 3 and Table 4. The net load forecasting model performance is evaluated using the mean absolute percentage error (MAPE) and the standard deviation of MAPE. MAPE is defined as follows:
M A P E % = 100 × 1 n t = 1 n y ^ t y t y t

5.1. Data Description and Applying Demand Response

Historical net load and front-the-meter solar power data were used for the BTM capacity estimation. To increase the contribution of this study, the dataset used actual data from South Korea, as provided by official organizations. Solar data, including capacity, address, and hourly output, are managed by the Korea Power Exchange (KPX) and Korea Electric Power Corporation (KEPCO), according to the contract type. KPX is an isolated system operator and KEPCO is a monopoly utility in South Korea. The details are listed in Table 3.
Hourly load data were provided by KPX and weather data were collected by API service from the Korea Meteorological Administration (KMA). Weather forecast data were also prepared for a realistic numerical simulation. Because of the divided management described in Table 3, the FTM and BTM solar data followed different standards; however, the same regional division was applied to both. The details are listed in Table 4.
This study aims to uniformly model human behavior by using the gross load in a load forecasting model. Demand-side flexible resources such as time-of-use (ToU) and real-time pricing (RTP) can change the shape of the system load, but can be considered part of natural human behavior. On the other hand, direct load control (DLC), which is one of the incentive-based demand-side programs, is operated by the system operator. The participation amount of DLC, which is demand response output in Table 4, is estimated by the system operator. The effect of DLC can be incorporated by adjusting the observed net load. Therefore, the net load used in this study was derived by adding the estimated demand response output to the observed net load.
This simulation is performed in the following steps, as introduced in Section 4. Based on the FTM data, the FTM pattern was decomposed into PV and BESS pattern. As shown in Figure 11, the PPA solar capacity data provided by KEPCO show regional differences, which can be observed to worsen.

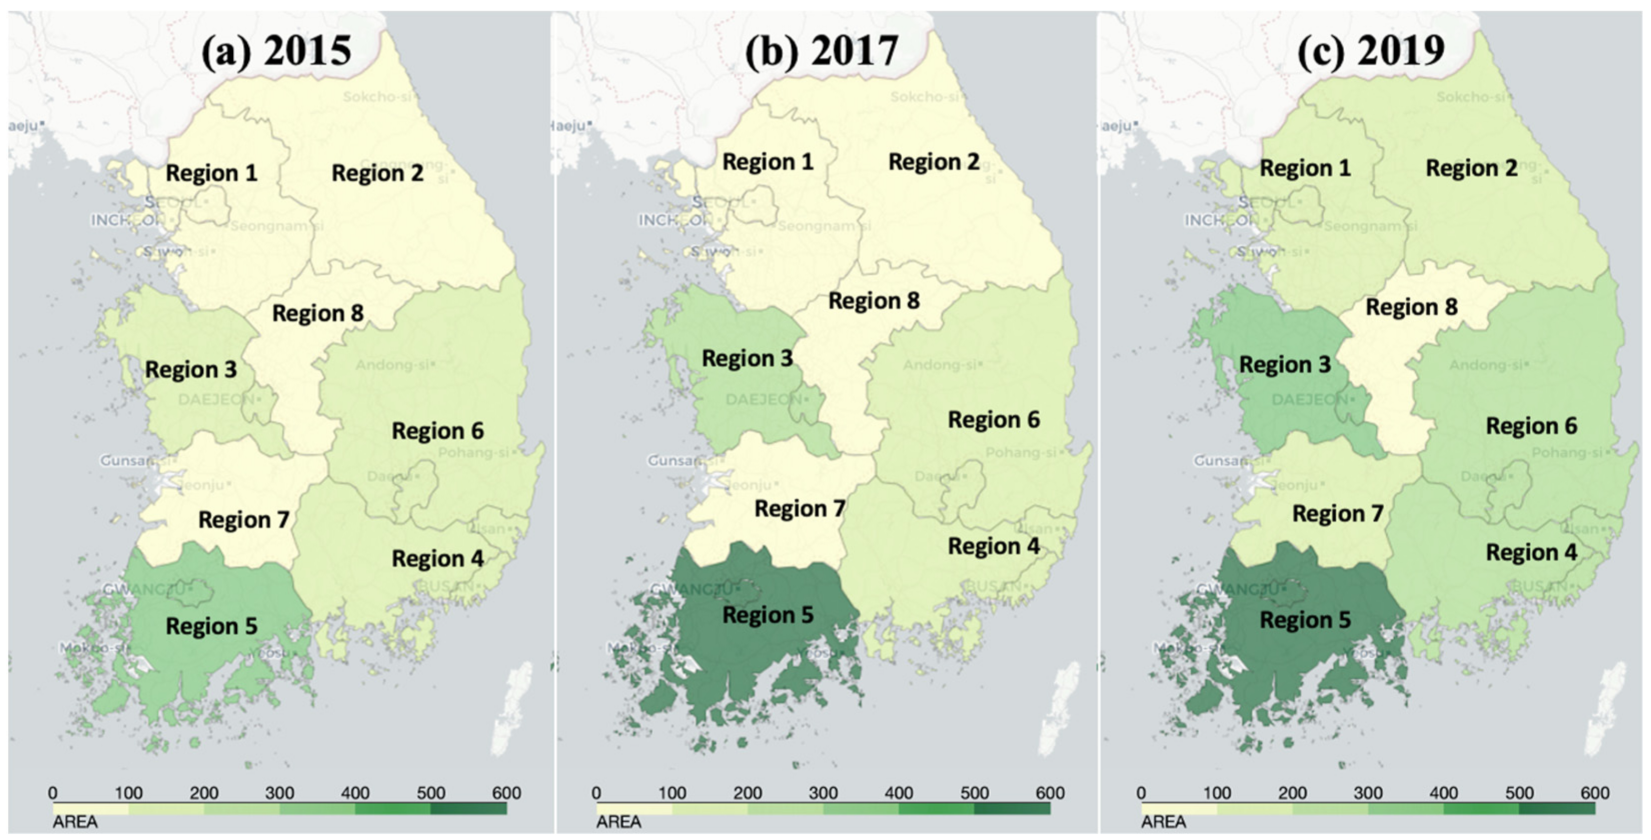
5.2. BTM Capacity Estimation

In this subsection, the generated net load forecast error and FTM data between January 2015 and August 2020 were used. To generate the net load forecasting error, a weak forecasting model M1(weak) was used, which comprises four fully connected layers with hidden size = 32. The quantile of the pinball loss was applied with nine values, from 0.1–0.9. Techniques for improving the performance of neural network, such as batch normalization, and hyperparameter optimization, were excluded to show the generality of this study. The Adam optimizer was used for training, with β1 = 0.9, β2 = 0.98, and learning rate = 0.06. The maximum epoch was set to 200 and early stopping was not applied. The BTM capacity was estimated monthly, and its suitability was quantified using the proposed gain. A beam search was performed using k = 3.
The optimal monthly proposed accuracy gain derived from the results of the beam search is shown in Figure 12. In some cases, it can be observed that the proposed gain decreased, and it is interpreted that reflecting the BTM local optimal result in that month does not help to improve overall load forecasting errors. In Figure 13, it can be seen that the distribution of prediction errors was narrowed, and in particular, the errors of positive numbers decreased.
In Figure 13, it can be seen that the error distribution is reduced after considering BTM. The normality of the error distribution can be measured using the Shapiro-Wilk test. According to the Shapiro-Wilk test, if the distribution follows a normal distribution with the null hypothesis, the test statistic decreases, and the p-value is less than the criterion 0.05. Table 5 shows that the p-values of 13–16H are changed to satisfy normality after considering BTM. Furthermore, average test statistics and p-value are also reduced after considering BTM, so it can be seen that the proposed method is effective in extracting the BTM pattern from the forecasting error. The regional BTM solar capacities were determined from the above results and are described in Figure 14. Comparing Regions 4 and 7, a noticeable result can be observed. Region 7 is the region with the largest PPA penetration rate but the BTM estimate is lower than that of Region 4.
To demonstrate the contributions of this study to the net load forecasting method, the BTM utilization method is applied to each model in five cases: without BTM, estimate BTM pattern using physical PV model as introduced in [4], estimate BTM using a fixed ratio as is currently used by KPX, adding BTM after forecast, and the proposed method, which uses BTM as the input variable. Two additional neural network models were simulated to confirm that the proposed method is generally effective: M2 (linear) comprises four fully connected layers. M3 (LSTM) comprises two long short-term memory layers as the input layer and one fully connected layer as the output layer. Each case was simulated using M1 (weak), M2 (linear), and M3 (LSTM). The test results are presented in Table 6.
Five case studies were applied to each model to compare how BTM patterns were incorporated into net load forecasting. In Case I, the model did not use BTM as an input variable or post-correction. In Case II, the BTM pattern was predicted using the estimated BTM capacity and the physical PV model, which is introduced in [4]. The forecasted net load result is obtained through the post-correction of subtracting the BTM pattern from the model output. Case III shows the result of existing method currently used by KPX. In Case III, the hidden BTM PV capacity was estimated by 50% of PPA capacity, and the impact of BTM BESS was ignored. Case IV is similar to Case II, but the proposed BTM pattern prediction model was used instead of the physical PV model. For Case V, the model used the proposed BTM pattern as an input variable and forecasted the net load directly.
In Scenario A, which is base scenario, case studies were applied using PPA data and each BTM PV estimation results were corrected to be equal to or larger than PPA. In addition, under the proposed assumption, BTM capacities were estimated that the BTM capacities are not decreased and thus the ReLU function was used for the proposed process. However, Scenario B assumed that PPA data was not provided, and Scenario C does not used ReLU assuming that BTM capacity could be decreased. Comparing scenarios A and B, it can be observed that using PPA data enables effective BTM estimation, improving the accuracy of day-ahead load forecast. Through comparison between scenarios A and C, it can be shown that proposed assumptions are needed to improve the day-ahead net load forecasting accuracy.
In all scenarios, it can be observed that each model performed best when the BTM pattern was used as the input variable. Adding the BTM pattern also improves the forecasting performance; thus, this result indicates that the proposed approach is reasonable, and it is possible to increase the model accuracy by applying BTM patterns. The results of Case II show that the physical PV model can improve the MAPE of M1, M2 and M3. However, it can be seen from the results that the proposed method is more effective and that the FTM pattern data makes this difference possible. Case III showed the best result in Scenario C, but in Scenario A to which all assumptions were applied, the proposed method was 0.21%p more accurate, showing a distinct difference. Furthermore, Case III has a disadvantage in that it cannot be applied to Scenario B because it depends on PPA data. Through comparison between Case IV and V, the accuracy was more improved when BTM pattern is used as an input variable. From the results in Table 6, it can be concluded that the proposed short-term load forecasting method is improved by applying the BTM patterns.

6. Conclusions

This paper proposes a short-term load forecasting method that incorporates the estimation of behind-the-meter resources, including solar plants, batteries and demand resources. A preprocessing method to reflect the demand response and preprocessing method to decompose front-the-meter data into solar and battery patterns has been proposed.
To reveal the BTM patterns hidden in the net load, a regulated probabilistic net load forecasting model was presented using pinball loss. This paper also proposes a BTM battery size estimation method based on an incentive policy and a data-driven approach. The proposed accuracy gain quantified the effect of the BTM pattern on improving the load forecasting accuracy, allowing the BTM capacity to be estimated through optimization. Each optimization result was connected using a beam-search algorithm to increase the overall efficiency.
The simulation shows that the proposed method is applicable for estimating BTM resources and improves short-term net load model accuracy. The test results are presented using actual utility data in South Korea from January 2015 to August 2020. The regional BTM capacity estimation results obtained by the proposed method had the effect of reducing the uncertainty of the historical net load pattern. As a result of the Shapiro test analysis, the normality of the net load forecast error between 13:00 and 16:00 was significantly improved, reducing the p-value from 0.2725 to 0.0010, and the p-value between 7:00 and 19:00 from 0.3174 to 0.1623. It can be seen from the test results that the proposed BTM capacity estimation effectively detected the BTM pattern hidden in the net load. Using BTM capacity estimation, it can be observed through both the existing and proposed methods that net load forecast accuracy is improved. Comparing the existing methods with the proposed method in various scenarios, the best result of the existing methods was 2.56%, while the proposed method showed clearly improved to 2.35%. Furthermore, the BTM pattern is more suitable when used as an input variable than when used for post-correction. The proposed method was used based on the degree of improvement in net load forecasting accuracy by referring to existing studies to validate the BTM estimation results without actual data points for the BTM capacity. However, the proposed method is different from other studies in that it complementarily improves net load prediction accuracy while estimating the BTM PV and BESSs and corrects the estimation process using auxiliary data. In addition, the results are improved compared to the existing BTM estimation methods.
This study has a limitation that the scheduling of BTM BESS is fitted for the dominant objective function. Considering the various purposes of BTM BESS operation, future research is needed to directly estimate the BTM capacity. The future study will help to increase the visibility of the system considering distributed energy resource operation and improve the load forecasting performance.

Author Contributions

J.-W.C. performed the research and wrote the paper. S.-K.J. provided guidance for the research and revised the paper. All authors have read and agreed to the published version of the manuscript.

Funding

This work was supported by the Korea Institute of Energy Technology Evaluation and Planning (KETEP) and the Ministry of Trade, Industry & Energy (MOTIE) of the Republic of Korea (No. 20181210301430). This research was supported by the Basic Research Program through the National Research Foundation of Korea (NRF) funded by the MSIT (No. 2020R1F1A1075872).

Conflicts of Interest

The authors declare no conflict of interest.

Nomenclature

Acronyms
ANNArtificial Neural Network
BESSBattery Energy Storage System
BMSBattery Management System
BTMBehind-the-Meter
CAISOCalifornia Independent System Operator
CPPCritical Peak Pricing
DERDistributed Energy Resources
DLCDirect Load Control
DNNDeep Neural Network
FTMFront-the-Meter
GBMGradient Boosting Machine
HMMHidden Markov Model
KEPCOKorea Electric Power Corporation
KPXKorea Power Exchange
KMAKorea Meteorological Administration
MHMMMixed Hidden Markov Model
MICMaximum Information Coefficient
PJMPennsylvania-New Jersey-Maryland Interconnection
PPAPower Purchase Agreement
PVPhotovoltaics
QRNNQuantile Regression Neural Network
RTPReal-time Pricing
ToUTime of Use

References

  1. Lee, K.Y.; Cha, Y.T.; Park, J.H. Short-Term load forecasting using an artificial neural network. IEEE Trans. Power Syst. 1992, 7, 124–132. [Google Scholar] [CrossRef] [Green Version]
  2. Sahay, K.B.; Tripathi, M.M. Day ahead hourly load forecast of PJM electricity market and iso New England market by using artificial neural network. In Proceedings of the 2014 IEEE Power & Energy Society Innovative Smart Grid Technologies, Washington, DC, USA, 19–22 February 2014. [Google Scholar]
  3. Anastasio, E.; Mulhern, J. Improving Load Forecasting with Behind-the-Meter Solar Forecasting. Available online: https://www.pjm.com/-/media/committees-groups/committees/oc/20190514/20190514-item-20-improving-load-forecast-with-btm-solar-forecast.ashx (accessed on 24 October 2021).
  4. Wang, Y.; Zhang, N.; Chen, Q.; Kirschen, D.S.; Li, P.; Xia, Q. Data-Driven Probabilistic Net Load Forecasting with High Penetration of Behind-the-Meter PV. IEEE Trans. Power Syst. 2018, 33, 3255–3264. [Google Scholar] [CrossRef]
  5. Shaker, H.; Zareipour, H.; Wood, D. Estimating Power Generation of Invisible Solar Sites Using Publicly Available Data. IEEE Trans. Smart Grid 2016, 7, 2456–2465. [Google Scholar] [CrossRef]
  6. Sun, M.; Feng, C.; Zhang, J. Factoring behind-the-meter solar into load forecasting: Case studies under extreme weather. In Proceedings of the 2020 IEEE Power and Energy Society Innovative Smart Grid Technologies Conference, Washington, DC, USA, 17–20 February 2020. [Google Scholar]
  7. Liu, B.; Nowotarski, J.; Hong, T.; Weron, R. Probabilistic Load Forecasting via Quantile Regression Averaging on Sister Forecasts. IEEE Trans. Smart Grid 2017, 8, 730–737. [Google Scholar] [CrossRef]
  8. Padullaparthi, V.R.; Sarangan, V.; Sivasubramaniam, A. sUncover: Estimating the Hidden Behind-the-meter Solar Rooftop and Battery Capacities in Grids. In Proceedings of the 2019 IEEE Power & Energy Society Innovative Smart Grid Technologies Conference (ISGT), Washington, DC, USA, 18–21 February 2020; pp. 1–5. [Google Scholar]
  9. Shaker, H.; Manfre, D.; Zareipour, H. Forecasting the aggregated output of a large fleet of small behind-the-meter solar photovoltaic sites. Renew. Energy 2020, 147, 1861–1869. [Google Scholar] [CrossRef]
  10. Vejdan, S.; Kline, A.; Totri, M.; Grijalva, S.; Simmons, R. Behind-the-meter energy storage: Economic assessment and system impacts in Georgia. In Proceedings of the 2019 North American Power Symposium (NAPS), Wichita, KS, USA, 13–15 October 2019; pp. 1–6. [Google Scholar]
  11. Chaturvedi, D.K.; Isha, I. Solar power forecasting: A review. Int. J. Comput. Appl. 2016, 145, 28–50. [Google Scholar]
  12. Pan, K.; Xie, C.; Lai, C.S.; Wang, D.; Lai, L.L. Photovoltaic output power estimation and baseline prediction approach for a residential distribution network with behind-the-meter systems. Forecasting 2020, 2, 470–487. [Google Scholar] [CrossRef]
  13. Saeedi, R.; Sadanandan, S.K.; Srivastava, A.; Davies, K.; Gebremedhin, A. An Adaptive Machine Learning Framework for Behind-the-Meter Load/PV Disaggregation. IEEE Trans. Ind. Inform. 2021, 17, 7060–7069. [Google Scholar] [CrossRef]
  14. Li, K.; Yan, J.; Hu, L.; Wang, F.; Zhang, N. Two-Stage Decoupled Estimation Approach of Aggregated Baseline Load under High Penetration of Behind-the-Meter PV System. IEEE Trans. Smart Grid 2021, 12, 4876–4885. [Google Scholar] [CrossRef]
  15. Gensler, A.; Henze, J.; Sick, B.; Raabe, N. Deep Learning for solar power forecasting—An approach using AutoEncoder and LSTM Neural Networks. In Proceedings of the 2016 IEEE International Conference on Systems, Man, and Cybernetics (SMC), Budapest, Hungary, 9–12 October 2016; pp. 002858–002865. [Google Scholar]
  16. Zhang, W.; Quan, H.; Srinivasan, D. An Improved Quantile Regression Neural Network for Probabilistic Load Forecasting. IEEE Trans. Smart Grid 2019, 10, 4425–4434. [Google Scholar] [CrossRef]
  17. Razavi, S.E.; Arefi, A.; Ledwich, G.; Nourbakhsh, G.; Smith, D.B.; Minakshi, M. From Load to Net Energy Forecasting: Short-Term Residential Forecasting for the Blend of Load and PV Behind the Meter. IEEE Access 2020, 8, 224343–224353. [Google Scholar] [CrossRef]
  18. Zhang, W.; Quan, H.; Gandhi, O.; Rajagopal, R.; Tan, C.W.; Srinivasan, D. Improving Probabilistic Load Forecasting Using Quantile Regression NN with Skip Connections. IEEE Trans. Smart Grid 2020, 11, 5442–5450. [Google Scholar] [CrossRef]
  19. Kabir, F.; Yu, N.; Yao, W.; Yang, R.; Zhang, Y. Joint Estimation of Behind-the-Meter Solar Generation in a Community. IEEE Trans. Sustain. Energy 2021, 12, 682–694. [Google Scholar] [CrossRef]
  20. Li, K.; Wang, F.; Mi, Z.; Fotuhi-Firuzabad, M.; Duić, N.; Wang, T. Capacity and output power estimation approach of individual behind-the-meter distributed photovoltaic system for demand response baseline estimation. Appl. Energy 2019, 253, 113595. [Google Scholar] [CrossRef]
  21. Kankiewicz, A.; Wu, E. Final Report-Integration of Behind-the-Meter PV Fleet Forecasts into Utility Grid System Operations; U.S. Department of Energy: Washington, DC, USA, 2015. [Google Scholar]
  22. Shaffery, P.; Yang, R.; Zhang, Y. Bayesian Structural Time Series for Behind-the-Meter Photovoltaic Disaggregation. In Proceedings of the 2020 IEEE Power & Energy Society Innovative Smart Grid Technologies Conference (ISGT), Washington, DC, USA, 17–20 February 2020. [Google Scholar]
  23. Shaker, H.; Zareipour, H.; Wood, D. A data-driven approach for estimating the power generation of invisible solar sites. IEEE Trans. Smart Grid 2016, 7, 2466–2476. [Google Scholar] [CrossRef]
  24. Kabir, F.; Yu, N.; Yao, W.; Yang, R.; Zhang, Y. Estimation of behind-the-meter solar generation by integrating physical with statistical models. In Proceedings of the 2019 IEEE International Conference on Communications, Control, and Computing Technologies for Smart Grids (SmartGridComm), Beijing, China, 21–23 October 2019; pp. 1–6. [Google Scholar]
  25. Mason, K.; Reno, M.J.; Blakely, L.; Vejdan, S.; Grijalva, S. A deep neural network approach for behind-the-meter residential PV size, tilt and azimuth estimation. Sol. Energy 2020, 196, 260–269. [Google Scholar] [CrossRef]
  26. Kwon, B.S.; Park, R.J.; Song, K.B. Short-Term load forecasting based on deep neural networks using LSTM layer. J. Electr. Eng. Technol. 2020, 15, 1501–1509. [Google Scholar] [CrossRef]
  27. Bu, F.; Dehghanpour, K.; Yuan, Y.; Wang, Z.; Zhang, Y. A data-driven game-theoretic approach for behind-the-meter PV generation disaggregation. IEEE Trans. Power Syst. 2020, 35, 3133–3144. [Google Scholar] [CrossRef] [Green Version]
  28. Li, G.; Wang, H.; Zhang, S.; Xin, J.; Liu, H. Recurrent neural networks based photovoltaic power forecasting approach. Energies 2019, 12, 2538. [Google Scholar] [CrossRef] [Green Version]
  29. Peng, C.Y.; Kuo, C.C.; Tsai, C.T. Optimal Configuration with Capacity Analysis of PV-Plus-BESS for Behind-the-Meter Application. Appl. Sci. 2021, 11, 7851. [Google Scholar] [CrossRef]
  30. Liu, Y.; Li, Z.; Bai, K.; Zhang, Z.; Lu, X.; Zhang, X. Short-Term power-forecasting method of distributed PV power system for consideration of its effects on load forecasting. J. Eng. 2017, 2017, 865–869. [Google Scholar] [CrossRef]
Figure 1. Hierarchical relationships between distributed energy resources including net loads and hidden components.
Energies 14 07067 g001
Figure 2. Annual changes in solar power generation efficiency in South Korea. (a) shows that solar power generation efficiency per hour. The fitted 2nd order line of (a) is described in (b), which denotes the power generation efficiency. From 2015 to 2017, the fitted lines were almost unchanged, but the upper-right tails have bent significantly since 2018.
Energies 14 07067 g002
Figure 3. The overall procedure of the proposed BTM capacity estimation method using autoencoder based anomaly detection technique. As an example, one process is organized in order from step 1 to 7. Autoencoder is used to extract the likelihood distribution of gross load and its regenerated gross load is used to find additional BTM capacities.
Energies 14 07067 g003
Figure 4. Solar plus battery installation types. (a) shows the AC-Coupled System, and (b) shows DC-Coupled System. In both cases, a mandatory metering system is located just before the grid and measures integrated outputs.
Energies 14 07067 g004
Figure 5. Integrated PV plus BESS system outputs (red line). BESS is set to be charged during the daytime (downside bars), when the PV output (orange line) exceeds the threshold (green dotted line). The discharging (upside bars) starts after 19:00 to maximize incentives for reducing the duck curve. X axis means hour, and Y axis means power output in MW.
Energies 14 07067 g005
Figure 6. Capacity estimation for inverter (MW) and battery (MWh). (a) shows the observed FTM pattern and the amplitude used to find inverter, and (b) shows the following estimation approach.
Energies 14 07067 g006
Figure 7. The proposed weak net load forecasting results with quantile values between 10~90%. The black line is actual net load.
Energies 14 07067 g007
Figure 8. Illustrated BTM estimation method using joint optimization.
Energies 14 07067 g008
Figure 9. Illustrated BTM PV estimation procedure in Figure 8.
Energies 14 07067 g009
Figure 10. The simplified concept of accuracy gain. The blue line is the error between the actual net load and forecasted load. The red dash line is the estimated BTM pattern. The yellow striped area is an expected change on forecasting result. (a,d) show that adding a BTM pattern to net load forecasting can improve performance. (b,e) show the situation in which reflecting the BTM pattern increases the forecasting error, so it is marked as negative. (c,f) show that a BTM pattern exceeds the error.
Energies 14 07067 g010
Figure 11. Differences in regional PPA capacity and changes by year.
Energies 14 07067 g011
Figure 12. Monthly evaluated proposed accuracy gain determined through beam search algorithm. Before means net load forecasting without BTM pattern. After means the maximal improvement at target month. X axis means month between Jan 2015 to Aug 2020. Y axis means the expected accuracy.
Energies 14 07067 g012
Figure 13. Detailed difference in the distribution of net load forecasting errors before and after reflecting BTM from May to July 2020. (a) shows the error distributions between 7 to 10H, (b) shows between 10 to 13H, (c) shows between 13 to 16H, and (d) shows between 16H to 19H.
Energies 14 07067 g013
Figure 14. Estimated regional BTM solar capacity using the proposed BTM estimation method.
Energies 14 07067 g014
Table 1. Summary of previous studies for BTM estimation and net load forecasting.
CategoryResult ValidationForecasting TargetCharacteristicsTechniques and Publications
(i)
BTM estimation using alternative methods
Virtual ScenariosNet loadRegional BTM PVs were modeled by adopting equivalent PV models.MIC, GBM, QRNN [4]
Actual limited onsite PVs dataBTM PVUsed randomly chosen scenarios to overcome limited PV data. Fuzzy [5]
Net loadBTM patterns were used for post-correction of forecasted net load.ANN [27]
Load forecast improvementNet loadBTM PV estimation results validated by alternative methodGBM [6], ANN [2,3,7]
(ii)
BTM
validation with true data points
Actual utility dataResidential loadBTM PV and BESS patterns were estimated simultaneously to improve housing load prediction.Heuristic [13], Sensitivity Model [17], DNN [9]
BTM PVBTM PV were estimated without considering net load forecasting accuracy or BTM BESS.PCA [10], Fuzzy [11], HMM [12]
CBLBTM PV estimation was used for improving the demand response analysisSVR [15], K-means [8]
(iii)
Various
BTM
Estimation
methods
Actual utility dataBTM PVBTM patterns were disaggregated from net load using the probabilistic modeling method.MHMM [14], Random Forest, DNN, etc [23].
BTM PVTest dataset was generated using the simulator.DNN [16]
Net load and BTM PVA data-driven approach was used to estimate the behavior of BTM PVs.Game Theory [18]
Economic evaluation-Estimating the configuration of BTM system using economic evaluationMixed-integer optimization [28], ROI, IRR [19]
(iv)
Load forecasting
methods
Load forecast improvementNet loadVarious machine learning techniques were used for the net load forecastingQRNN [20,21,22], LSTM [24]
Actual PV dataPVUsing weather conditions and locational data to forecast the PV outputsAuto Encoder, LSTM [25], RNN [26]
Table 2. Average Ratio of PV Plus BESS Size on Front-the-Meter Data.
CategoryPV Capacity
(MW)
Inverter Capacity
(MW)
Battery Capacity
(MWh)
Only PV1.0--
PV Plus BESS1.00.83.2
Table 3. Classification of Distribution Energy Resources Based on Contract Type and Visibility.
CategoryContract TypeMeter ResolutionCapacity Monitoring
Front-the-MeterWholesale Market 1Hourly/RegionalDaily
Behind-the-MeterPPAMonthly/RegionalIrregularly
PrivateMonthly/RegionalNo
1 PPA: Power Purchase Agreement.
Table 4. Data Resources for BTM Capacity Estimation and Day-Ahead Load Forecasts.
NamePeriodFeature ResolutionProvided Features
Load2013.01–2020.07HourlyObserved Net Load (MW)
Demand Response Outputs2015.01–2020.07HourlyEstimated Demand Response (MW)
FTM Outputs2015.01–2020.07HourlyIntegrated solar and BESS outputs by region
FTM Solar Capacity2015.01–2020.07Daily
PPA Solar Capacity2015.01–2020.07Irregularly
Observed Weather2013.01–2020.07HourlyTemperature, Humidity, Cloud Amount, etc. by region
Forecasted Weather2013.01–2020.073 Hourly
Table 5. Shapiro-Wilk Test results on net load forecasting errors after BTM capacity estimation from May to July 2020.
Case without BTMCase Considering BTM
Time PeriodTest Statisticsp-ValueTest Statisticsp-Value
7:00–10:000.96960.00100.97670.0062
10:00–13:000.99770.99700.99340.6418
13:00–16:000.98980.27250.96960.0010
16:00–19:000.96240.00020.96150.0001
Average0.97990.31740.97530.1623
Table 6. Comparison of Day-Ahead Load Forecast Error for Cases by Applying BTM Methods based on Three Different Scenarios.
ScenariosCasesM1 (Weak)M2 (Linear)M3 (LSTM)
MAPE
(%)
StDevMAPE
(%)
StDevMAPE
(%)
StDev
Scenario A
(Base)
Case I3.783.553.313.222.981.92
Case II3.613.372.952.682.862.54
Case III3.553.303.042.972.562.47
Case IV3.563.342.962.702.432.25
Case V (Proposed)--2.852.612.352.10
Scenario B
(Without PPA)
Case I3.783.553.313.222.981.92
Case II3.693.463.273.102.902.61
Case III------
Case IV3.603.483.152.652.852.44
Case V (Proposed)--3.132.672.842.44
Scenario C
(Without ReLU)
Case I3.783.553.313.222.981.92
Case II3.733.463.052.942.942.63
Case III3.553.303.042.972.562.47
Case IV3.623.492.922.832.792.50
Case V(Proposed)--2.882.802.582.26
Publisher’s Note: MDPI stays neutral with regard to jurisdictional claims in published maps and institutional affiliations.

