Abstract
A cantilever beam, manufactured from a steel-carrying substrate and two patches of Macro Fiber Composite of P2 type, was a subject of laboratory research. MFC patches were glued on both sides of the carrying substrate and were parallelly connected. An experimental determination of an optimal resistance for both energy harvesting and vibration passive damping of the cantilever beam was the purpose of the conducted laboratory research. The research contained 10 experiments in which courses of the energy-harvesting process and resistive passive damping of vibration were estimated. Energy harvesting was estimated by measurements of the generated current for the given load-resistance values. Resistive passive damping of vibration was assessed by using a vision method that enabled the displacements’ measurements of 10 selected points in the beam structure for the given shunt-resistance values. Values of both load resistance and shunt resistance were chosen on the basis of analytically calculated optimal load resistance and optimal shunt resistance. On the basis of the conducted experiments, the resistance range for which both the energy-harvesting process and the vibration-damping process are most effective was determined.
1. Introduction
The direct piezoelectric effect, which occurs in piezoelectric materials, allows a conversion of mechanical energy into electric energy. This phenomenon is used in scientific research in the area of mechanical vibration for the realization of two aims: energy harvesting and passive damping.
Energy harvesting from mechanical vibration is most often realized by the use of a prismatic cantilever beam with a rectangular cross-section [1]. Such a beam is composed from two parts: a piezoelectric material, e.g., ceramics [2], composites [3], and polymers [4], and a carrying substrate, e.g., steel, brass, and aluminum. The beam structure is made by gluing the piezoelectric material to one side or both sides of the carrying substrate. One end of the cantilever beam is mounted to a source of the vibration: bridge [5], machine [6], truss [7], or other vibrating mechanical structures. The second end of the cantilever beam is not connected to the source of vibration. Vibrations, which are generated by mechanical structure, cause a cyclic beam bending, during which the piezoelectric material is squeezed and stretched alternately. The cantilever beam is connected to an interface circuit. A standard energy harvesting (SEH) interface circuit contains a bridge rectifier for AC rectification, a capacitor for filtering, and a resistive load [8]. SEH is developed by the adding of a parallel- or series-connected subsystem, consisting of an inductor and an electronic switch. Such an interface is called a synchronized switching harvesting with inductor (SSHI) [9]. The electronic switch is briefly turned on when the mechanical displacement reaches a maximum or a minimum. Each time the electronic switch turns on, the electric charge passing through the inductor transmits a part of the energy stored in the piezoelectric capacity to the storage circuit [10]. Two piezoelectric layers, which were glued onto both sides of the substrate, may be electrically parallel or series connected [11]. For a resistive load, Liao et al. [12] observed that the maximum of the harvested electric power is the same for parallel and series connection, but optimal resistive load, current, and voltage across the optimal value of a resistive load are considerably different. Regardless of the connection, the optimal resistive load depends on two factors: a natural frequency of the cantilever beam and a piezoelectric capacity.
Passive damping of the vibration of the cantilever beam is also the subject of intense scientific research. Piezoelectric materials associated with passive shunts are capable of transforming mechanical energy into electrical energy that is then dissipated in an electrical circuit [13]. Gripp and Rade [14] enumerated six kinds of passive shunts: resistive, resonant (RL) single-mode, resonant multi-mode, negative capacitance, adaptive circuit, and switching circuit. The resistive shunt damping (RSD), proposed by Hagood and Von Flotow [15], contains a resistor alone. When coupling a resistive shunt to a mechanical structure, the damping performance can be optimized by choosing a suitable resistance. The maximum damping effect is achieved for an optimal shunt resistance, which, according to Shevtsov et al. [16], is closed to the internal reactance of the piezoelectric material. Thomas et al. [17] described factors that impact the optimal shunt resistance: a natural frequency of the cantilever beam, a capacity of piezoelectric material, and a modal coupling factor coefficient that depends on resonance frequencies of structures in the open and short circuits of a piezoelectric patch. The resonant shunt consists of a resistor and an inductor. The inductor increases the dissipation of energy by moving the charge of the anode of the piezoelectric material to the resistance [18]. The same three factors impact on the optimal shunt resistance for a resonant circuit: a natural frequency of beam, a piezoelectric capacity, and a coefficient created by resonance frequencies of structures in the open and short circuits [18,19].
The passive damping results from the energy harvesting regardless of whether the harvested energy is dissipated in a resistor, stored in a battery, or used to run an energy-harvesting circuit [20]. Liang et al. [21] described that the ratio between loss factors for SHE and for RSD is equal to 63.66%. Shen et al. [22] presented a damping effect as a result of extracted energy as a function of the optimal value of the intermediate capacitance. Liao et al. [23] described the optimal placement and the dimensions of piezoelectric material for energy harvesting and shunt damping. However, the determination of resistance values, which would be optimal for both the harvesting process and damping process, is not described in literature.
The paper presents an experimental method of a determination of resistances, which are optimal simultaneously for an energy-harvesting process and a vibration passive damping process of a cantilever beam. A vision analysis was used for the determination of optimal shunt damping. The determination of resistance, which is optimal for both energy harvesting and vibration passive damping, is not reported in literature. The application of the vision analysis for the determination of optimal shunt damping is also not reported in the available literature.
2. Research Method
The studies were based on measurements of two groups of quantities:
- The current generated by a cantilever beam containing piezoelectric material and
- displacements of several points in the cantilever beam.
These measurements were conducted for value changes of a resistance, which fulfilled two functions: load resistance (Rl) in an energy-harvesting system and shunt resistance (Rs) in a resistive shunt-damping system. The structure of the laboratory stand and the measurement methods are presented below.
2.1. Structure of Laboratory Stand
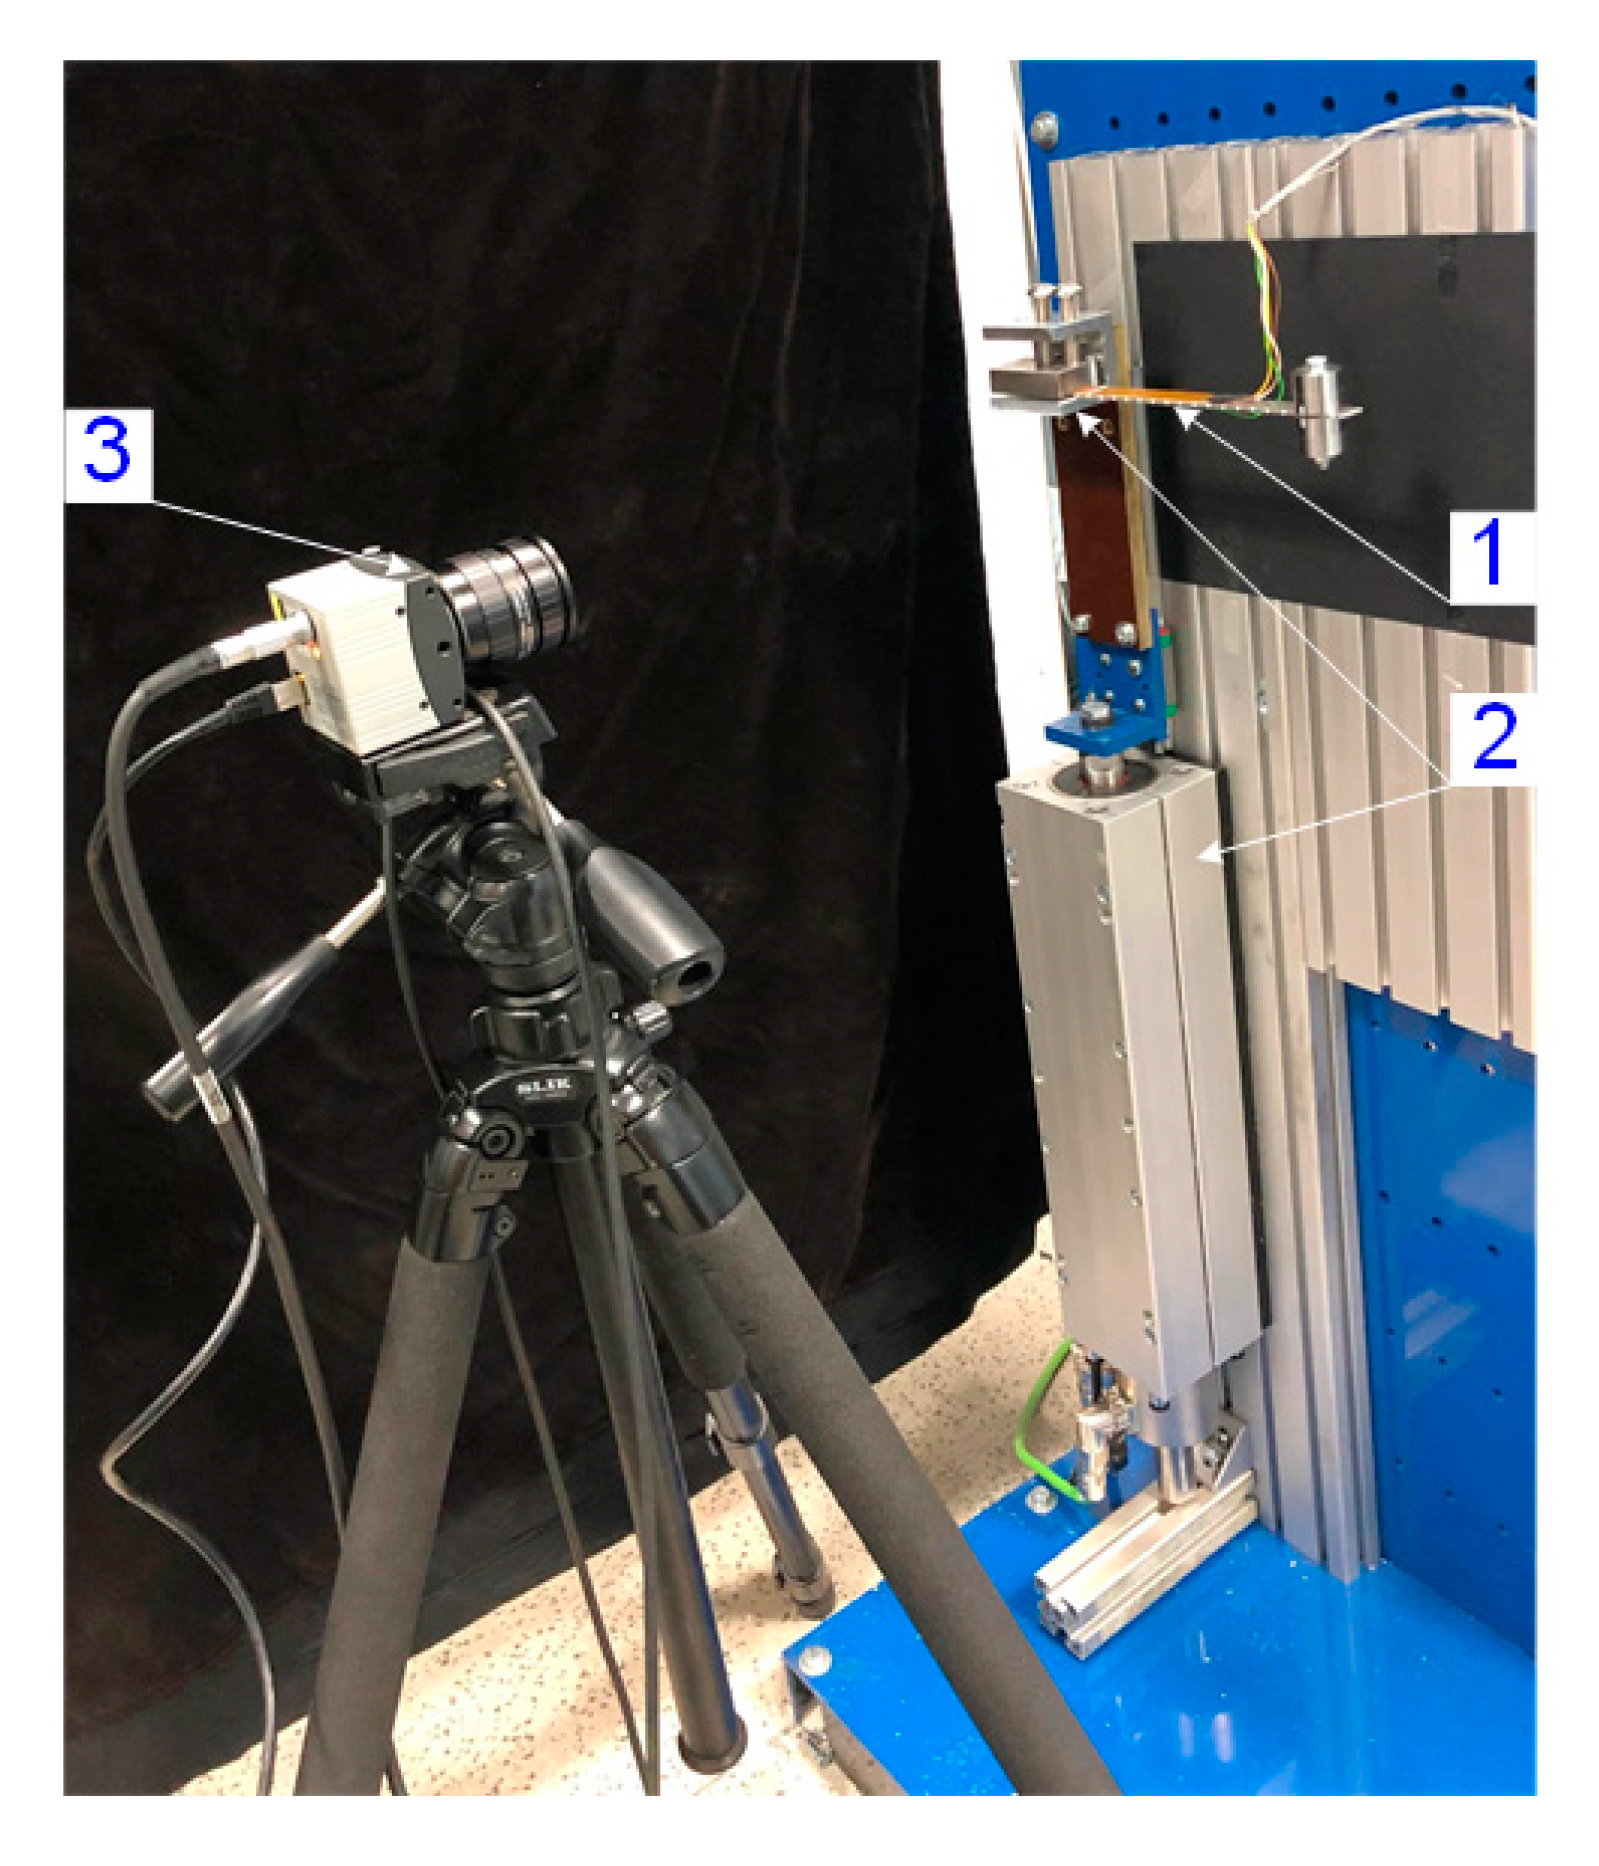
A laboratory stand consisted of four basic parts: a system of vibration generation, a cantilever beam containing a piezoelectric material, a system of current measurement in the energy-harvesting process, and a vision system for motion measurement in the vibration-damping process. A view of the laboratory stand is presented in Figure 1.
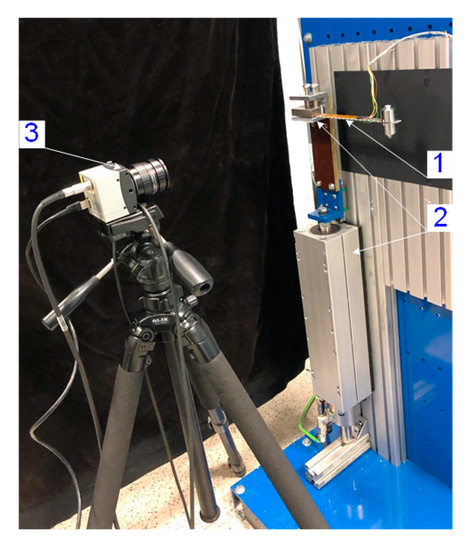
Figure 1.
View of the laboratory stand: 1—cantilever piezoelectric beam, 2—vibration-generation system, 3—camera.
The system of vibration generation consisted of a linear motor P04, manufactured by LinMot Company, and a dedicated moving holder, which connected the cantilever beam and a piston of the linear motor. The linear motor, mounted in a motionless stand body, generated a sinusoidal motion of the end of the cantilever beam with the required displacement and frequency. The vision system was based on a HiSpec 1 camera from Fastec Imaging (San Diego, CA, USA), which was equipped with a CMOS sensor with a resolution of 1280 × 1024 pixels and 10-bit coding. The camera works in the range of 400–900 nm.
2.2. Piezoelectric Cantilever Beam
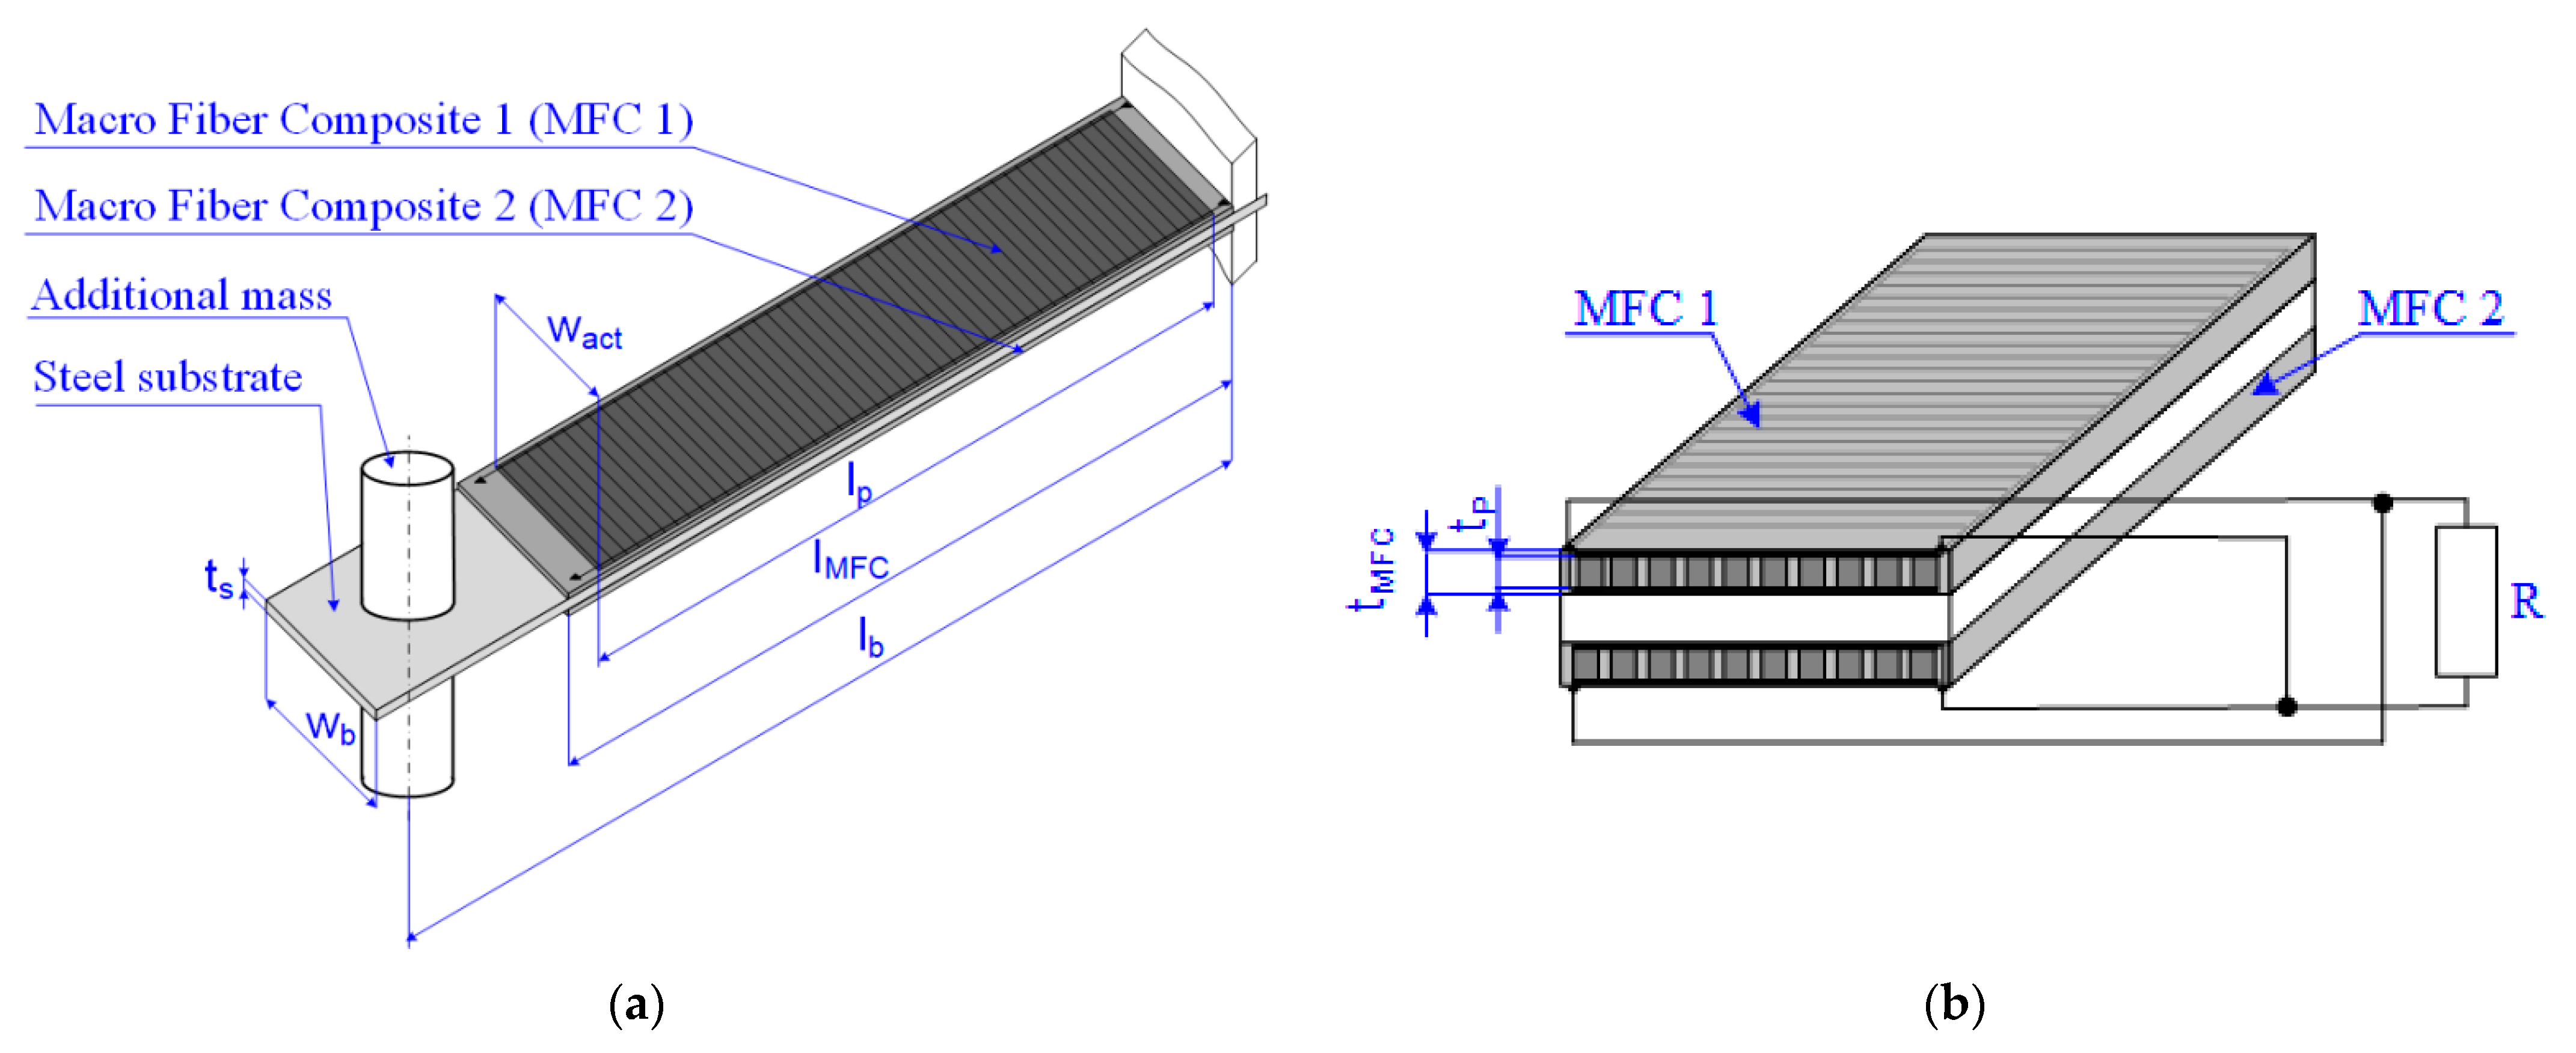
The cantilever beam had a prismatic shape with a rectangular cross-section. The beam structure consisted of a steel-carrying substrate and two patches of Macro Fiber Composite of P2 type, which were glued onto both sides of the carrying substrate. A structure of the composite cantilever beam is presented in Figure 2a and the electric connection of the two MFC patches is in Figure 2b. The cantilever beam was equipped with an additional mass, which was symmetrically mounted onto both sides of the beam. The Dimensions of the manufactured beam are presented in Table 1.

Figure 2.
Piezoelectric cantilever beam: (a) structure; (b) electric connection of MFC patches.

Table 1.
Geometric parameters of the manufactured cantilever beam [24,25].
2.3. Measurement of Current Generated in Energy-Harvesting Process
The current, generated by MFC patches, was measured in one part of the experiments. The measurement system consisted of three main components: a device that generated different values of resistance, an A/D board, and a data-canvassing system. A Seven Decade Programmable Resistor Board, offered by Chunzehui Electronic Technology Co. (Shenzhen, China), was used for resistance generation. A DaQBoard 2000 with a resolution of about 16 bits, offered by Measurement Computing Corporation (Norton, Bristol County, MA, USA), was used as an A/D board. A Data Acquisition System Laboratory, offered by Measurement Computing Corporation, was used for data canvassing.
2.4. Measurement of Beam Motion in Vibration-Damping Process
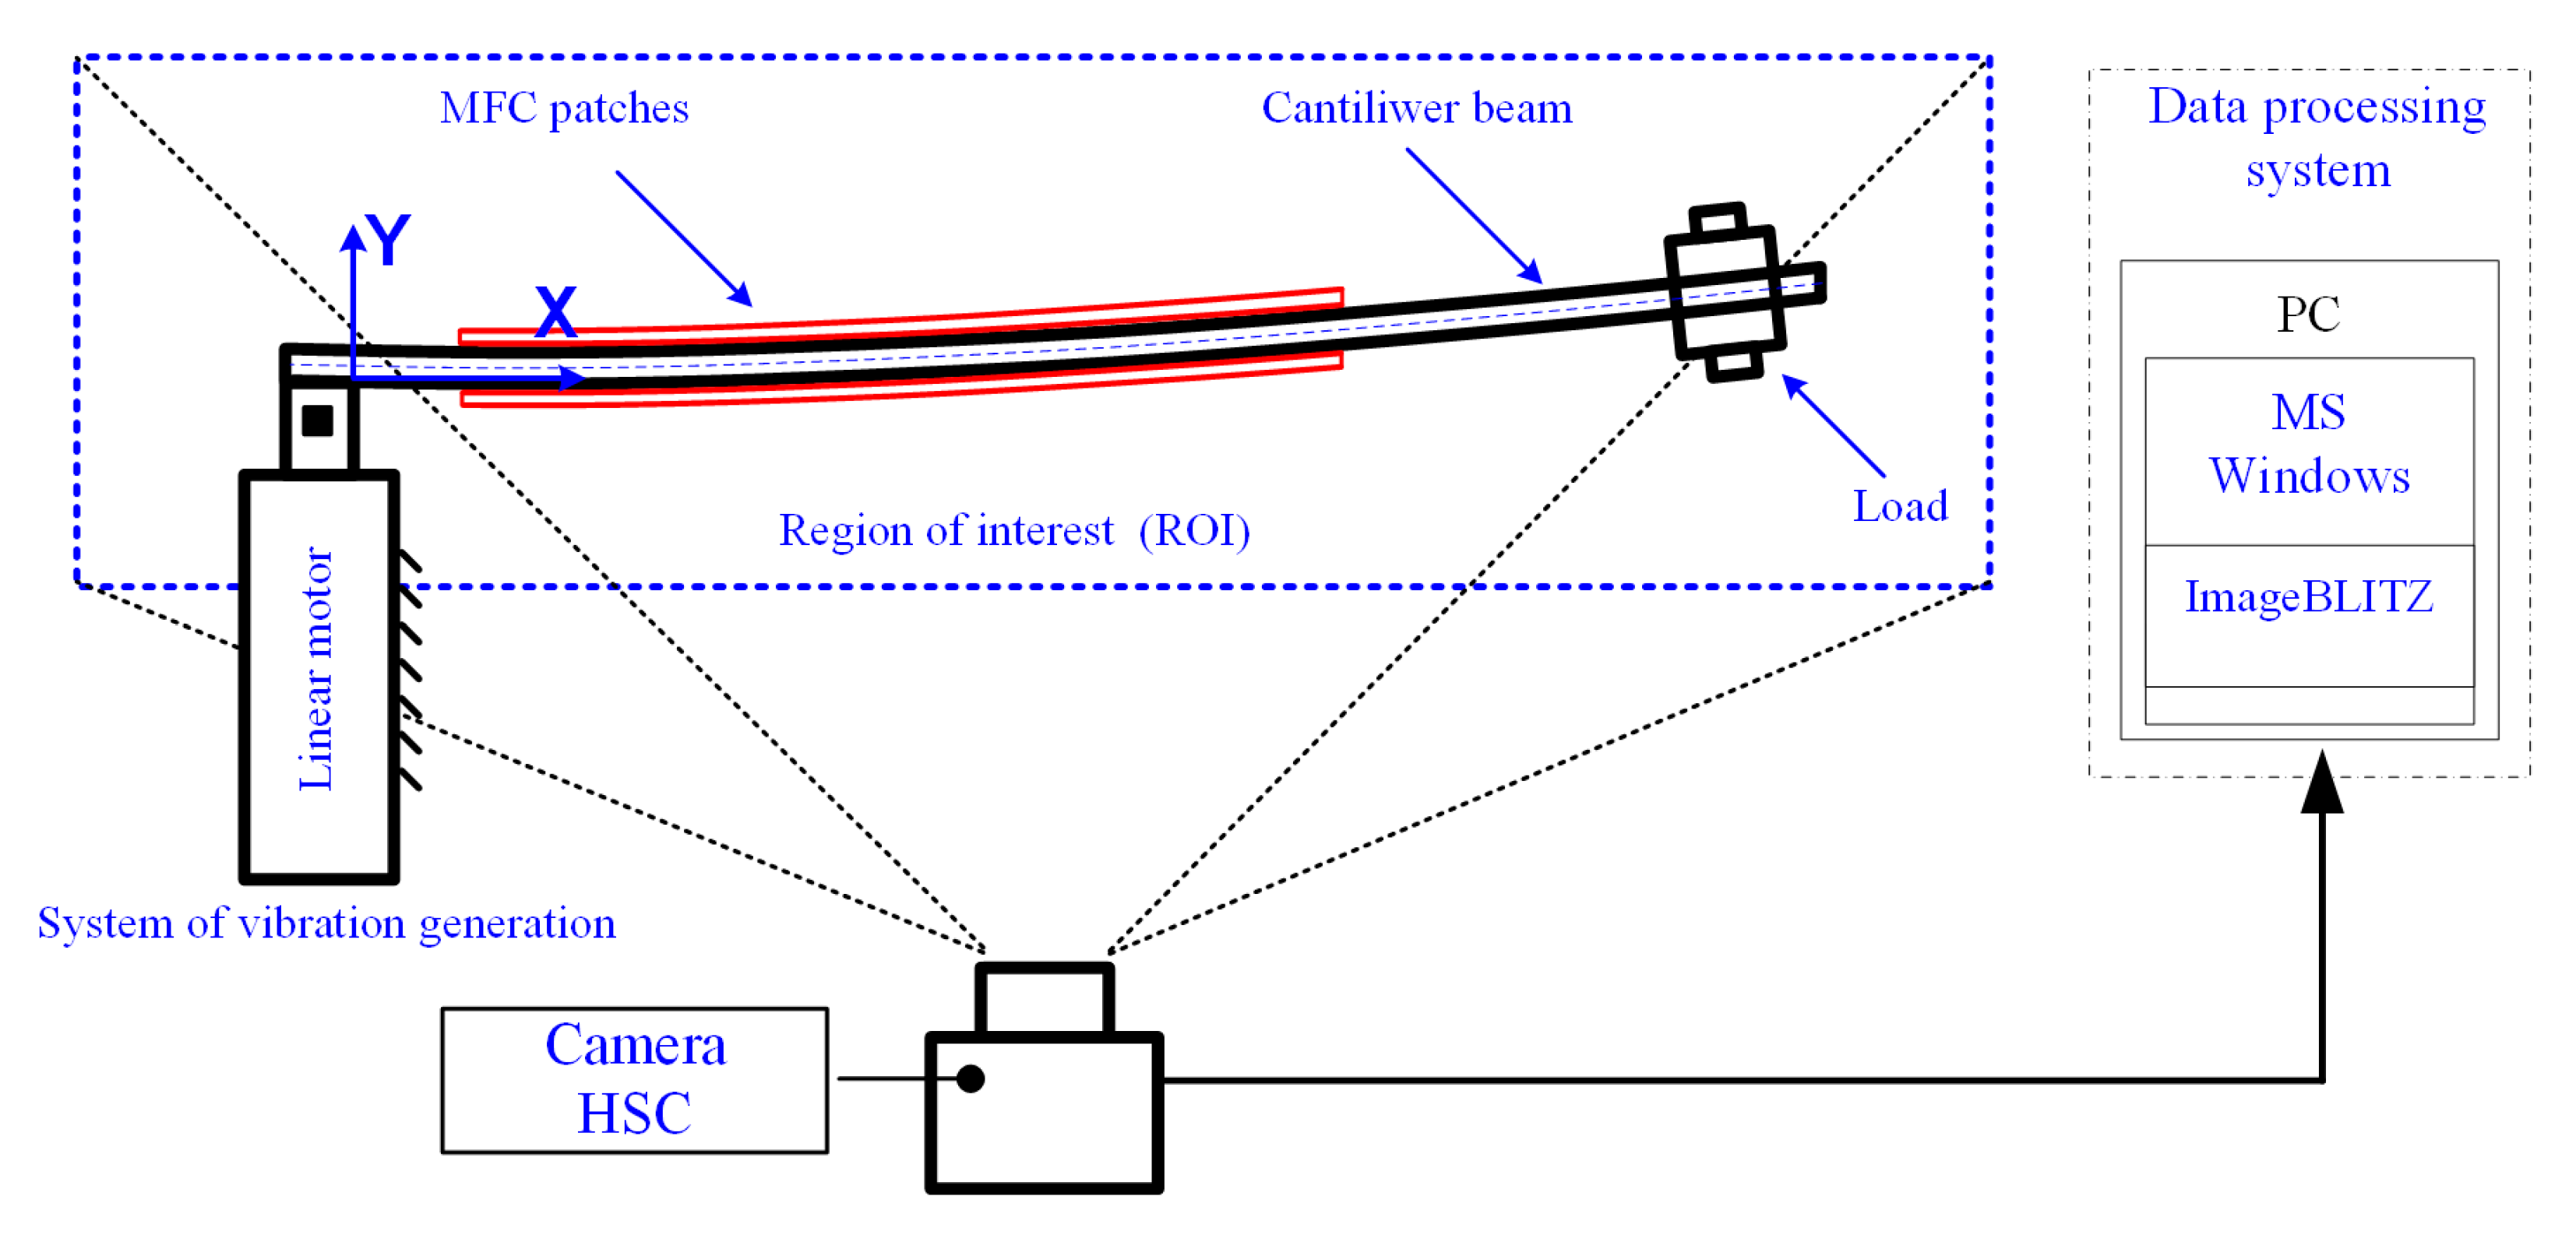
In this study, in order to increase the number of measuring points describing the beam motion, it was decided to perform the measurements using a vision system. A similar application of the vision method for piezoelectric beam testing is presented in [26]. This system enabled contactless recording of the motion of the whole beam, on the basis of which displacement measurement of the selected beam points was done. Schema of the vision system are presented in Figure 3.
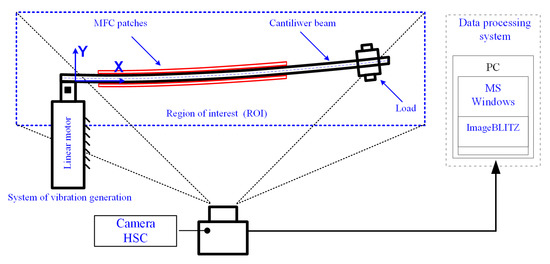
Figure 3.
Schema of the vision system.
Measurement of the beam motion was based on the vision method, enabling recording of a sequence of images. Each image was analyzed using a vision algorithm, allowing the determination of displacements of 16 selected points marked on the cantilever beam. The vision method enabled the observation of 16 points on the beam at the same time, which improves the interdependencies between the points. The displacement of the selected points is presented in Figure 4.
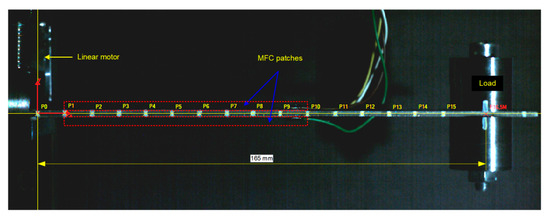
Figure 4.
Arrangement of measured points in the cantilever beam structure.
The displacements of the points were determined in two directions: Perpendicular to the beam axis and along with the axis. Along the beam axis, is the x-axis of the stationary coordinates’ system. The center of the coordinate system was defined as the point P0 rigidly connected in the moving holder. Measurements using the vision method were carried out in following stages:
- analysis of the task and selection of the methods of fixing the beam and the technique of sticking the piezoelectric elements,
- selection of the hardware configuration of the vision system,
- image calibration at the laboratory station,
- recording of the sequence of images at the laboratory station,
- development of an image analysis algorithm,
- performance of measurements and archiving of measurement data.
The first stage encompassed analysis of the measuring task and carrying out preliminary tests. They aimed to determine the necessary field of view (FOV), measuring resolution, and the geometry of the vision system setting, concerning the method of sticking the piezoelectric elements onto the beam and mounting the beam onto the vibration exciter.
The next stage was to project the hardware configuration of the vision system. The field of view was set up so that the entire beam, including the inductor and load, was visible. The vision system parameters were chosen to enable image recording with a 480-frames/second sampling rate and an exposure time equal to 620 μs for a single frame. The images were recorded with a resolution of 1248 × 478 pixels. The frequency of image recording was matched to the frequency of the inductor operation. The lighting conditions at the laboratory test stand were also taken into account. The lighting parameters were selected on the basis of tests to set the appropriate contrast between the background and the image of the beam with 16 marked points. It was assumed that 30 images were recorded for each full period of sinusoidal excitation generated. In the next stage, for such a prepared hardware configuration, the vision system was built on a laboratory stand. Then, in order to prepare the station for measurements, the system was calibrated with the use of a checkerboard calibration pattern [27]. Figure 4 presents one of the recorded images with markers applied on the beam. We can see, too, that the background, enabling observation of both the beam and the markers, is visible. Markers were made on the beam at 16 characteristic points, like a white spot on the beam’s side surface. Points from P0 to P15 were placed at a distance of 10 mm on the beam. The P0 point describes the rigid mounting of the beam on the inductor and the alignment of the coordinate system in which the vibration amplitude was measured. Point 16.5M indicates the center of attachment of the additional mass. The stage realized using the vision method involved acquiring and writing to a disk a sequence of beam vibration images. The series of images were recorded in such a way that the state without forcing the vibrations was visible (the state of rest) and the moment of switching on the exciter and vibrations at different values of the “piezoelectric element load”. After the inductor was activated, the P0 point connected with the inductor moved along the y-axis of the coordinate system with an amplitude of 0.2 mm.
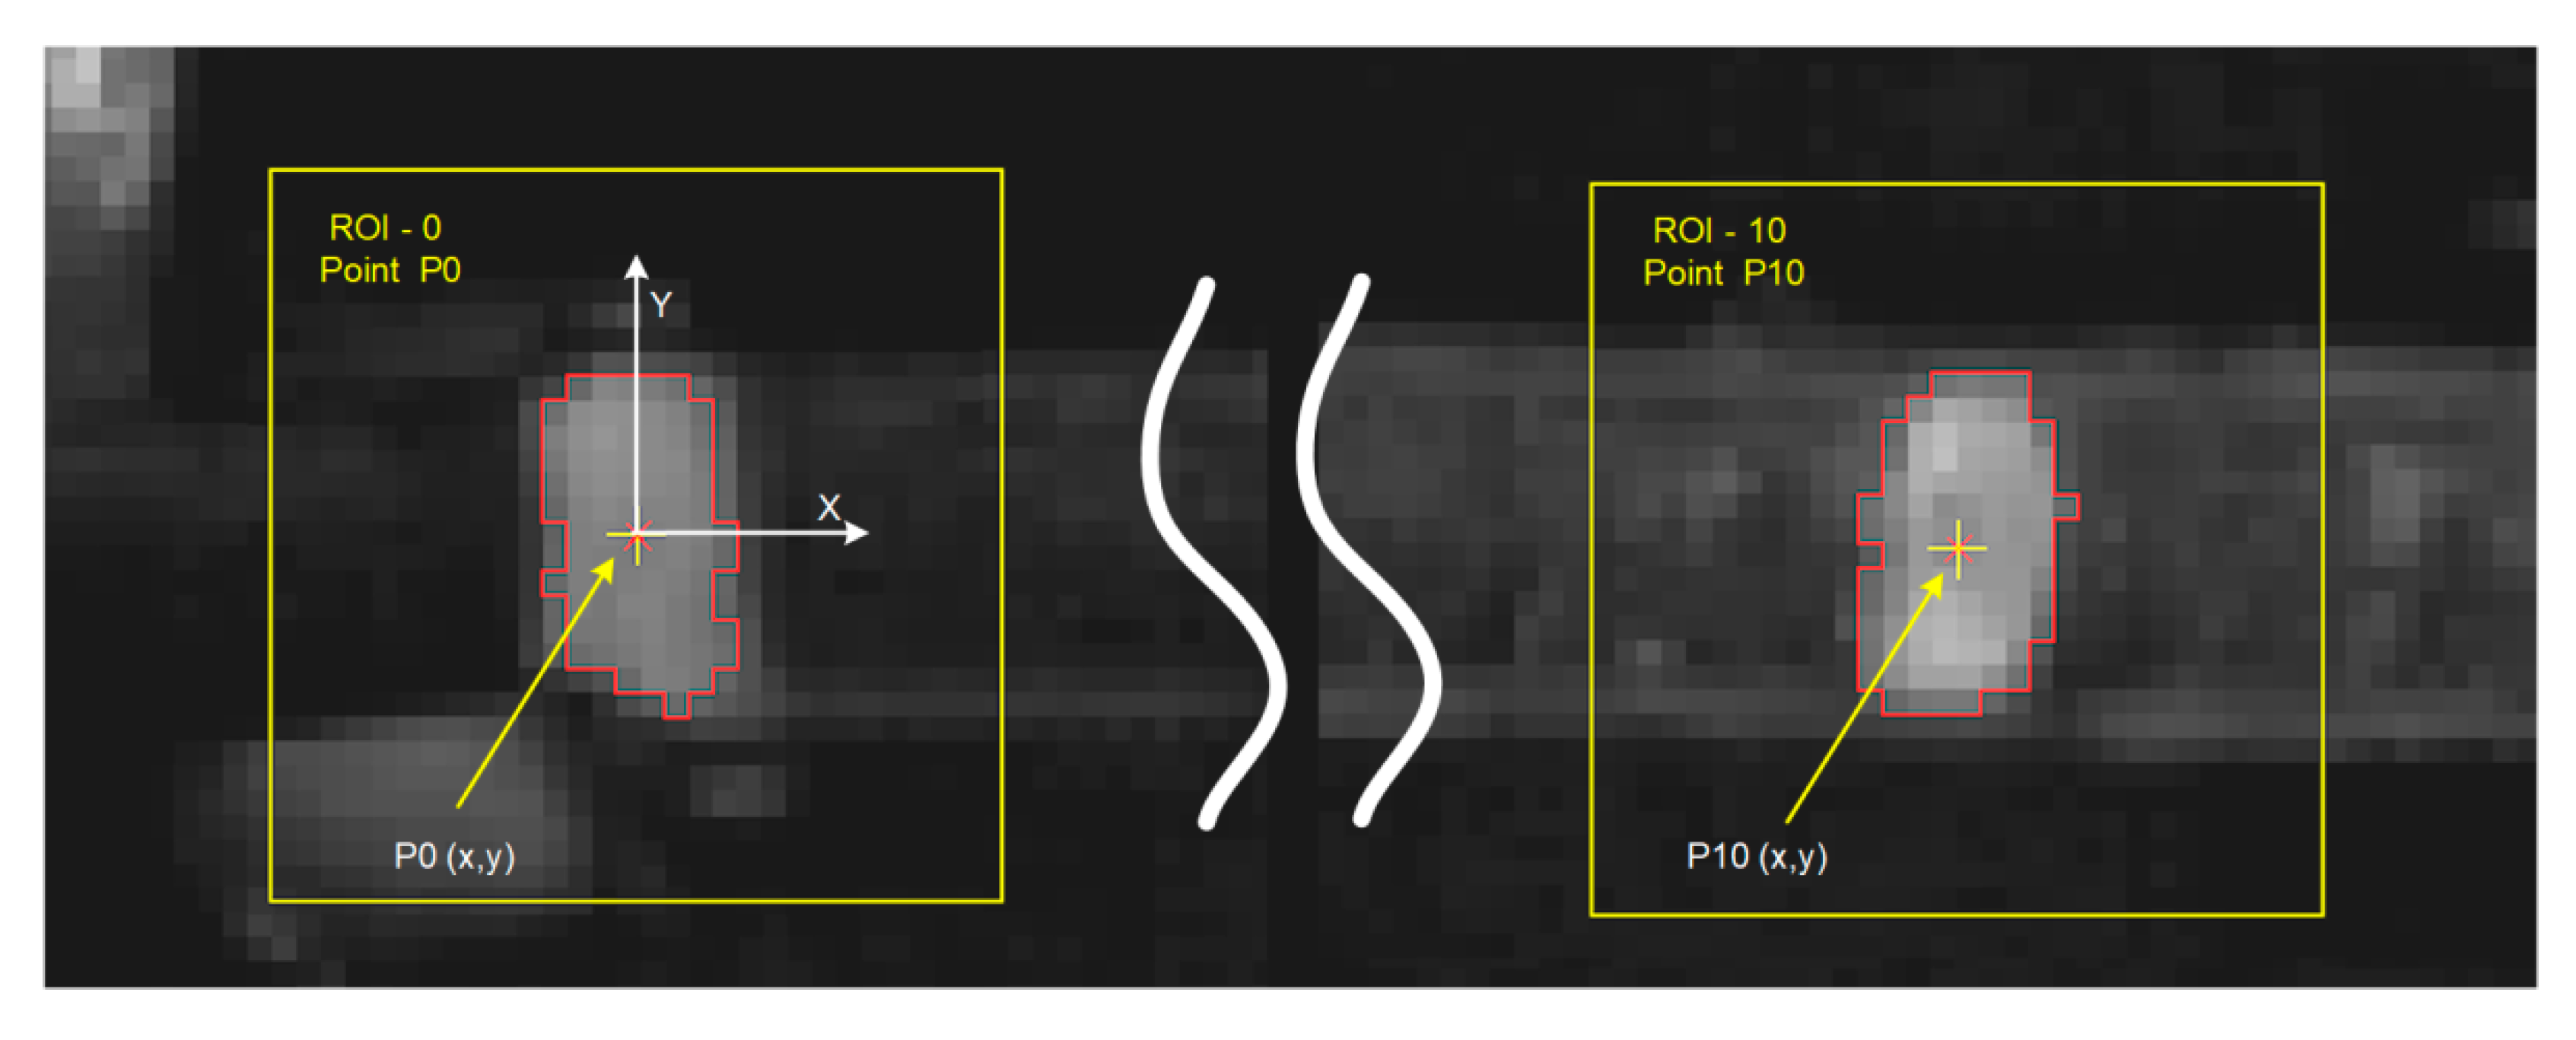
The next stage of the vision measurement procedure of the beam motion involved the development of an algorithm for analysis of the recorded sequence of images. On each of the images, the coordinates (x, y) of the location of each of the points (P0–P16) plotted on the beam had to be determined in the coordinate system adopted for the measurements. The selection of image recording parameters, as well as the lighting method and the mutual positioning of the lighting camera and the examined object, allowed for the registration of an image that did not contain impulse disturbances in the form of reflections or local light scattering. Thus, in the initial stage of image processing, none of the image enhancement filters was applied. The coordinate system for the rest position of the P0 point was set, and then the image-scaling procedure was performed to convert point positions registered in pixels to values expressed in millimeters. For each point, regions of interest (ROI) were defined, i.e., the area within which the coordinates (x, y) of the location of points were determined. An example of an image presenting the definition of ROIs for the selected points of the beam is presented in Figure 5. For each of the points and their corresponding ROI regions, segmentation parameters were set that allowed the selection of pixels belonging to the marker area. Then, the algorithm for determining the position of the center of gravity (COG) was applied for the pixels, forming the marker. All pixels included in the marker segmentation area were used to determine the x and y coordinates of the characteristic point. Figure 3 shows the areas of the P0 point marker and the P10 point marker. The coordinate system was permanently defined at the point P0 determined in the state of rest (without vibrations). The displacement measurements of the points marked on the beam were then carried out after activating the inductor in this coordinate system. The imaging resolution resulting from the size of the field of view and the area of the matrix used to record the image was 0.159 mm per pixel. The resolution of determining the position of the point marked on the beam was 0.01 mm [28].
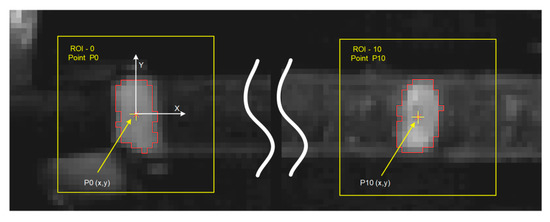
Figure 5.
Beam with the assumed coordinate system and points P0 and P6.
The algorithm for determining the location of all characteristic points was performed for each image in the recorded sequence. Successive images were read, the positions of the marked points were determined on each of them, and then the coordinates of the points were saved in successive records of the .csv file. About 3500 images were recorded for each of the tested load resistances. The use of this type of file made it possible to import data into MATLAB software, in which analysis of the data obtained from the vision method was continued.
3. Analytical Determination of Optimal Load Resistance and Shunt Resistance
3.1. Optimal Load Resitance
Standard motion of fixed end of the cantilever beam is a sinusoidal motion in laboratory testing of a piezoelectric cantilever beam (compare with [2,3]). Hence, values of two parameters should be selected: a frequency of vibration of the fixed end of the cantilever beam and the amplitude of vibration of the fixed end. The determination of the natural frequency of the cantilever beam was the first stage of selection of frequency value because it was assumed that experiments would be conducted for the resonance frequency of the cantilever beam. The natural frequency of cantilever beam is [29]:
where Yb is the Young’s modulus of beam and I is the moment of inertia.
The equivalent modulus of elasticity of beam is [29]:
where sE11 is the compliance constant of MFC patch, Ys is the Young’s modulus of steel substrate, and I is the moment of inertia.
The equivalent moment of inertia for a symmetric bimorph is [29]:
The material properties of the manufactured cantilever beam are presented in Table 2.
Table 2.
Material properties of the composite beam.
Values of resistance should be also selected. For this purpose, the optimal load resistance and the optimal shunt resistance were calculated for the manufactured beam. The optimal load resistance can be calculated from [12]:
where CSpMFC1 is the capacity at a constant strain of the MFC patch glued on the upper surface on the steel substrate and CSpMFC2 is the capacity at a constant strain of the MFC patch glued on the lower surface. Both MFC patches were similar, so it was assumed that CSpMFC1 = CSpMFC2 = CSpMFC. Piezoelectric capacity at constant strain is [11]:
where εS33 is the permittivity under a constant strain of the piezoelectric fibers in the MFC patch and wp is the sum of the width of the rectangular piezoelectric fibers in the MFC patch. The width of the rectangular piezoelectric fibers in the MFC can be approximated as wp = 0.865 × wact [31].
3.2. Optimal Shunt Resistance
The optimal shunt resistance can be determined on the basis of equations presented by Liang et al. [21], which were modified in this paper for the parallel connection of two MFC patches:
where k2e is the coupling coefficient of the piezoelectric element:
where αe is the force–voltage coupling factor of the MFC patch and KE is the short circuit stiffness.
where e31 is the piezoelectric constant and cE11 is the elastic stiffness constant.
3.3. Piezoelectric Material and Bimorph Properties
On the basis of [32], it was assumed that the MFC patch contained PZT-5A ceramic. Material properties for PZT-5A are presented in Table 3.
Table 3.
Material properties of PZT-5A [33].
The calculated values of parameters of the manufactured cantilever beam are presented in Table 4.
Table 4.
Values of calculated parameters of cantilever beam.
3.4. Power Generated in Energy-Harvesting Process
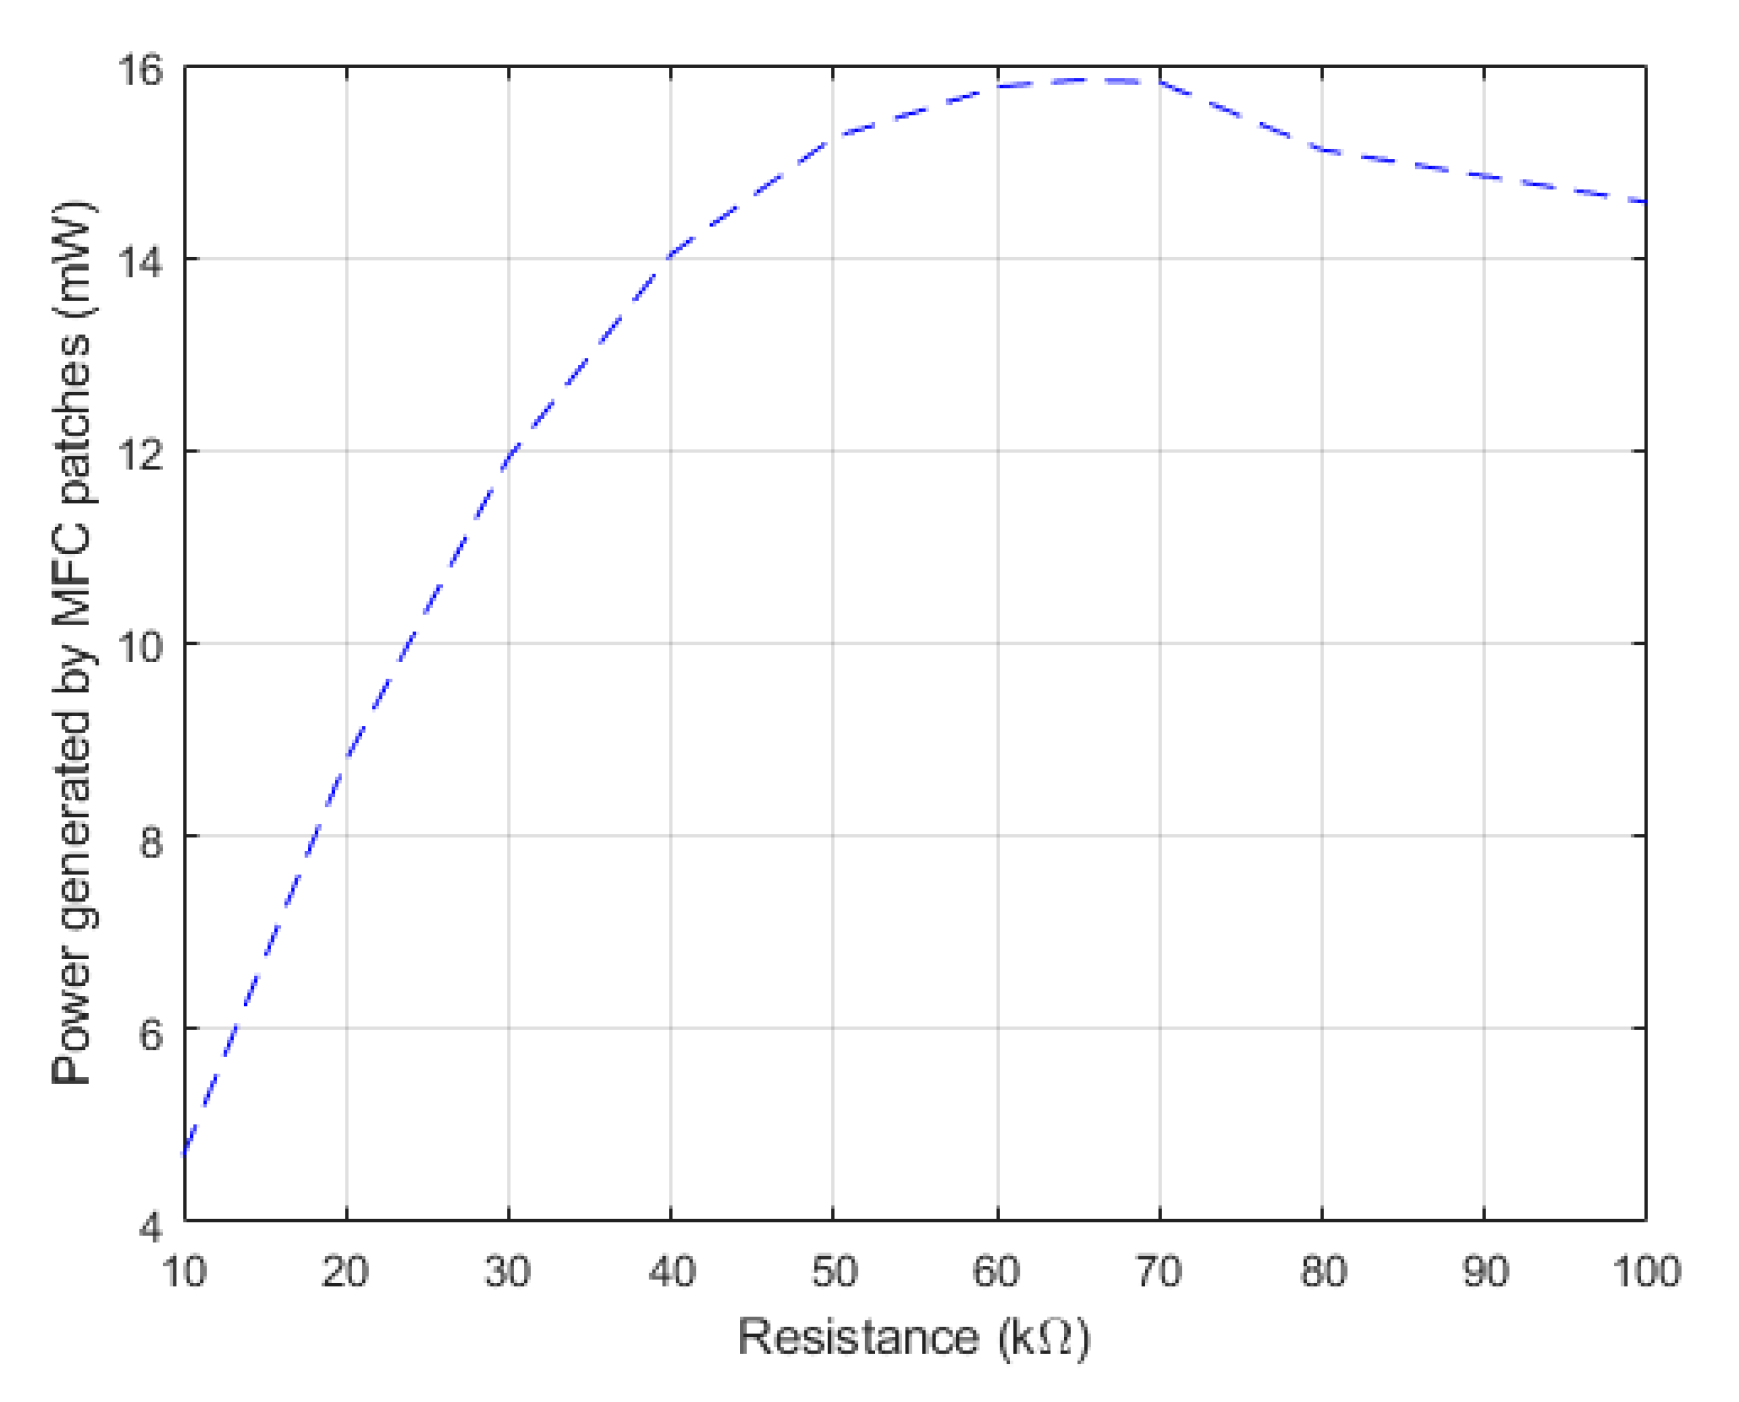
The piezoelectric patches in the cantilever beam structure can be treated as a current source controlled by the displacement of the fixed end of the harvester beam [34]. The motion of the fixed end causes a beam-bending process. The current generated by the cantilever beam was dependent on stress in the piezoelectric material, which resulted from a beam bending. Hence, the power generated by the cantilever beam can be calculated on the basis of formula, which was elaborated by combining the standard beam equations with the constitutive piezoelectric equations and electric circuit equations. To simulate the generated power, we used the equation described by Roundy et al. [35]:
where R is the tested load resistance, k2 is the geometric constant that relates average piezoelectric material strain to the tip deflection, Ain is the acceleration magnitude of the fixed end vibration, ω is the vibration of the fixed end of the beam, and ξ is the dimensionless damping ratio, which represents the viscous loss from the system. The course of power is presented in Figure 6.
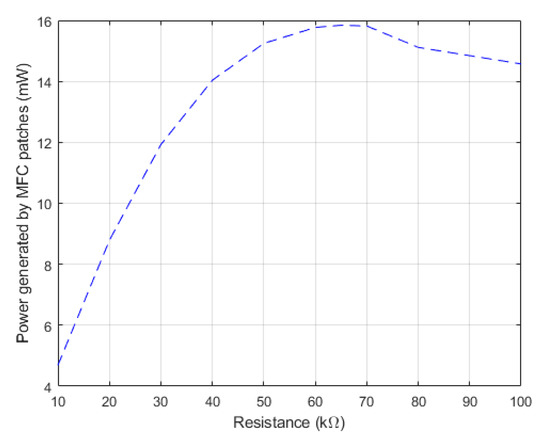
Figure 6.
Simulated power generated by the piezoelectric cantilever beam.
4. Results
4.1. Limiting Conditions
The frequency of vibration of the fixed end of the cantilever beam was calculated on the basis of the formula:
The values of resistance were selected in the range from value, which was close to the calculated optimal shunt resistance (Rsopt) to value, which was close to the calculated optimal load resistance (Rlopt). Hence, the camera recordings and harvested current measurements were made for the following values of resistance (Rl = s): 20 kΩ, 30 kΩ, 40 kΩ, 50 kΩ, 60 kΩ, and 65 kΩ. Additionally, the same experiments were made for resistance (Rl = s): 10 kΩ, 70 kΩ, 80 kΩ, and 100 kΩ in order to get a designation of change direction of the values of the tested quantities. The conditions of the laboratory experiments are presented in Table 5.
Table 5.
Conditions of laboratory experiments.
4.2. Energy-Harvesting Process
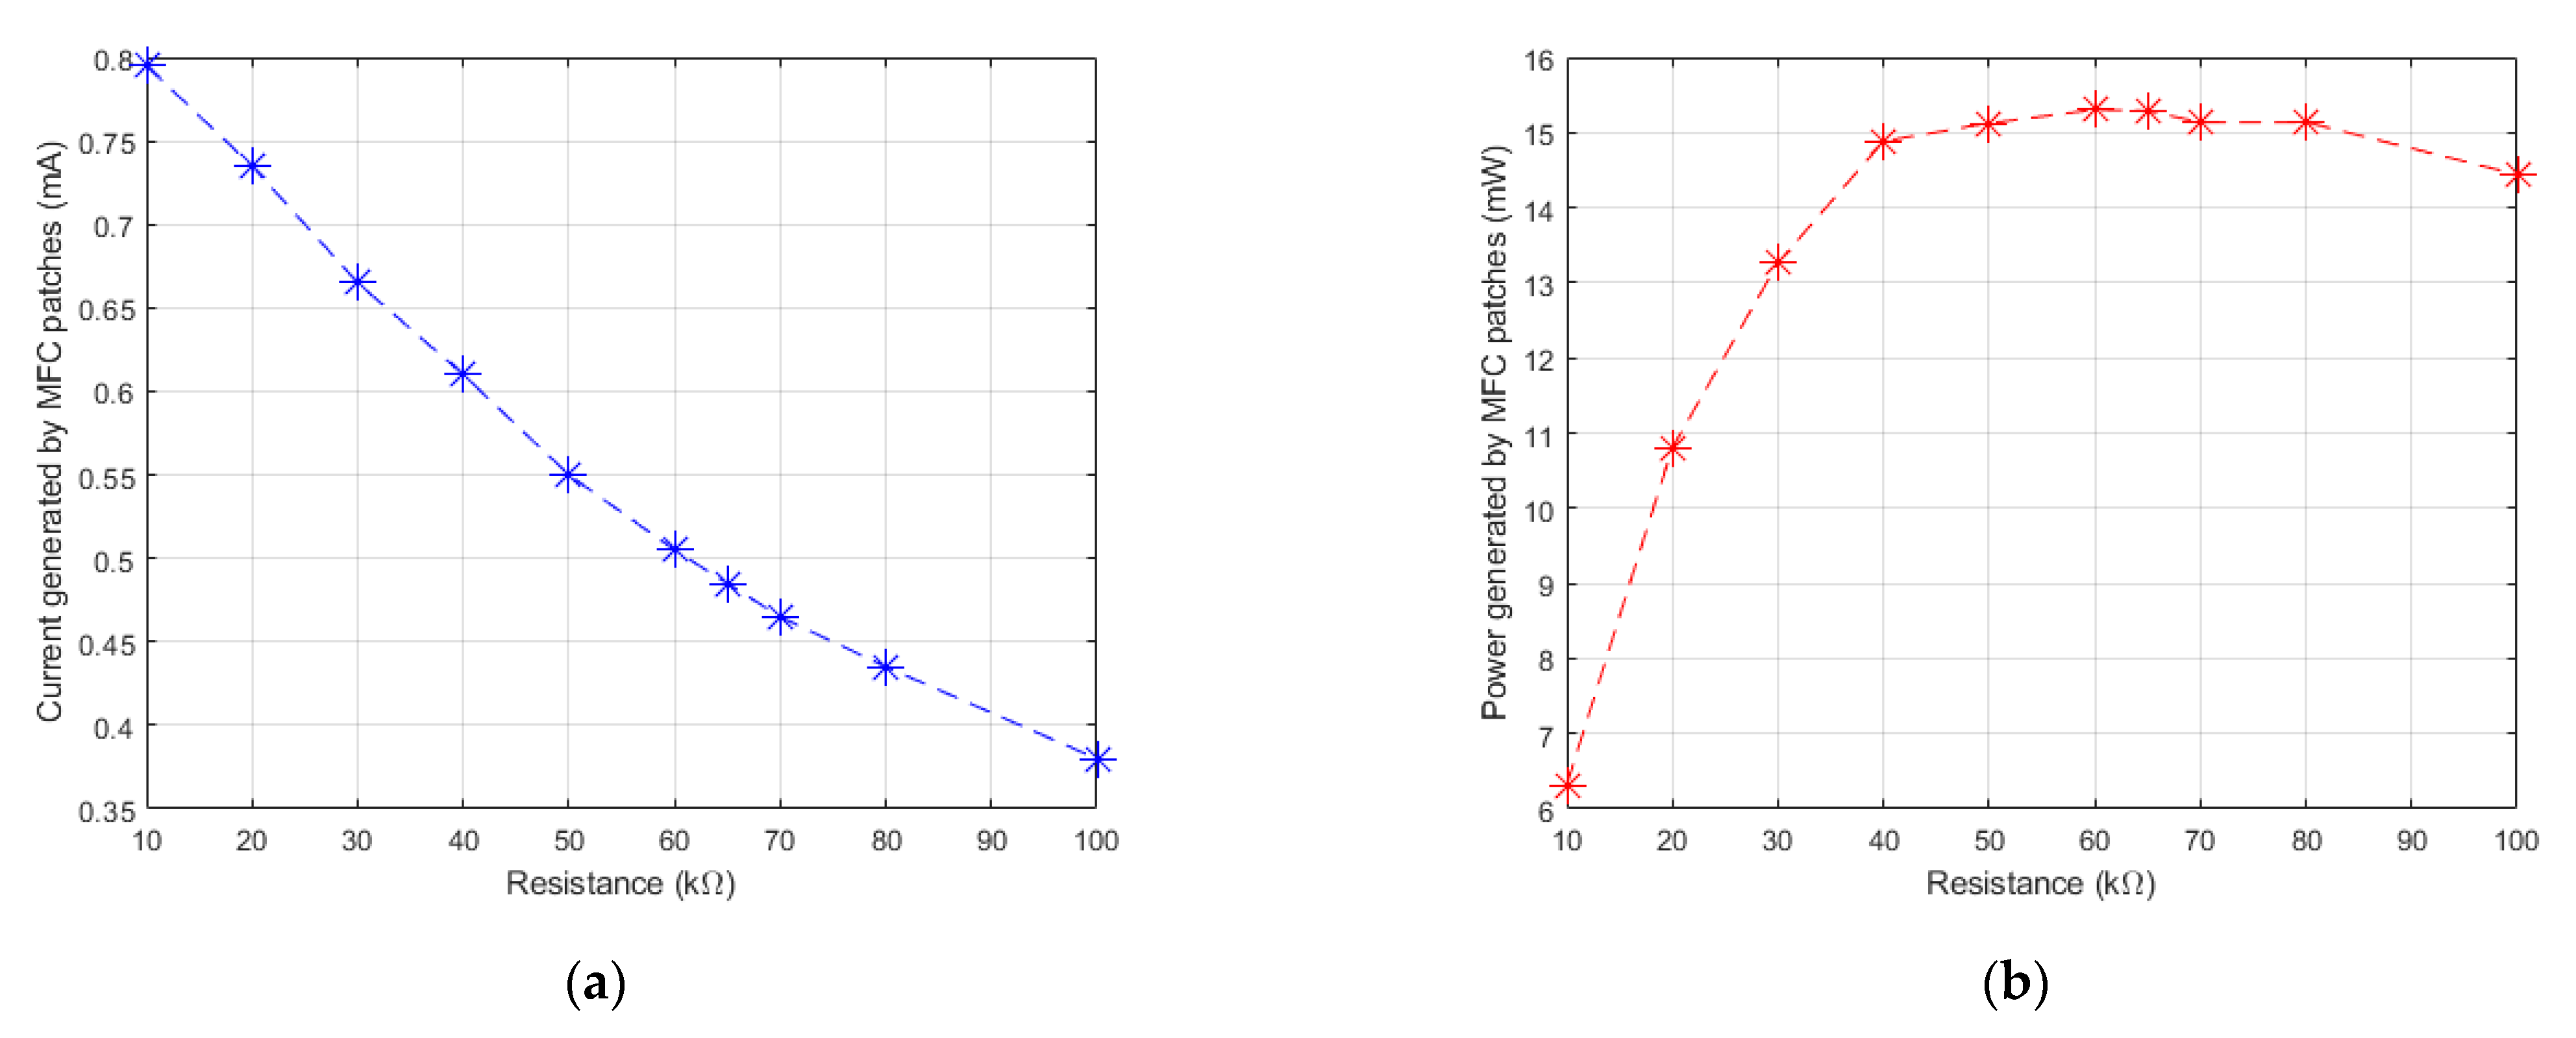
Experiments contained current measurements for 10 values of resistance. The course of the measured current is presented in Figure 7a. On the basis of the values of current (ig) and resistance (Rl = s), harvested power (Figure 7b) was determined by the use of the known formula:
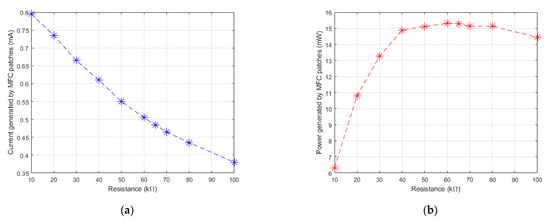
Figure 7.
Energy-harvesting process: (a) Average current generated by MFC patches; (b) Power generated by MFC patches.
The measured values of power, generated by the MFC patches, (Figure 7b) were lower than the simulated values of the power (Figure 6). The supposed cause was an interaction of the adhesive layers between the steel substrate and the MFC patches. The adhesive layers limited a stress transmission between the substrate layer and the piezoelectric material.
4.3. Vibration-Damping Process
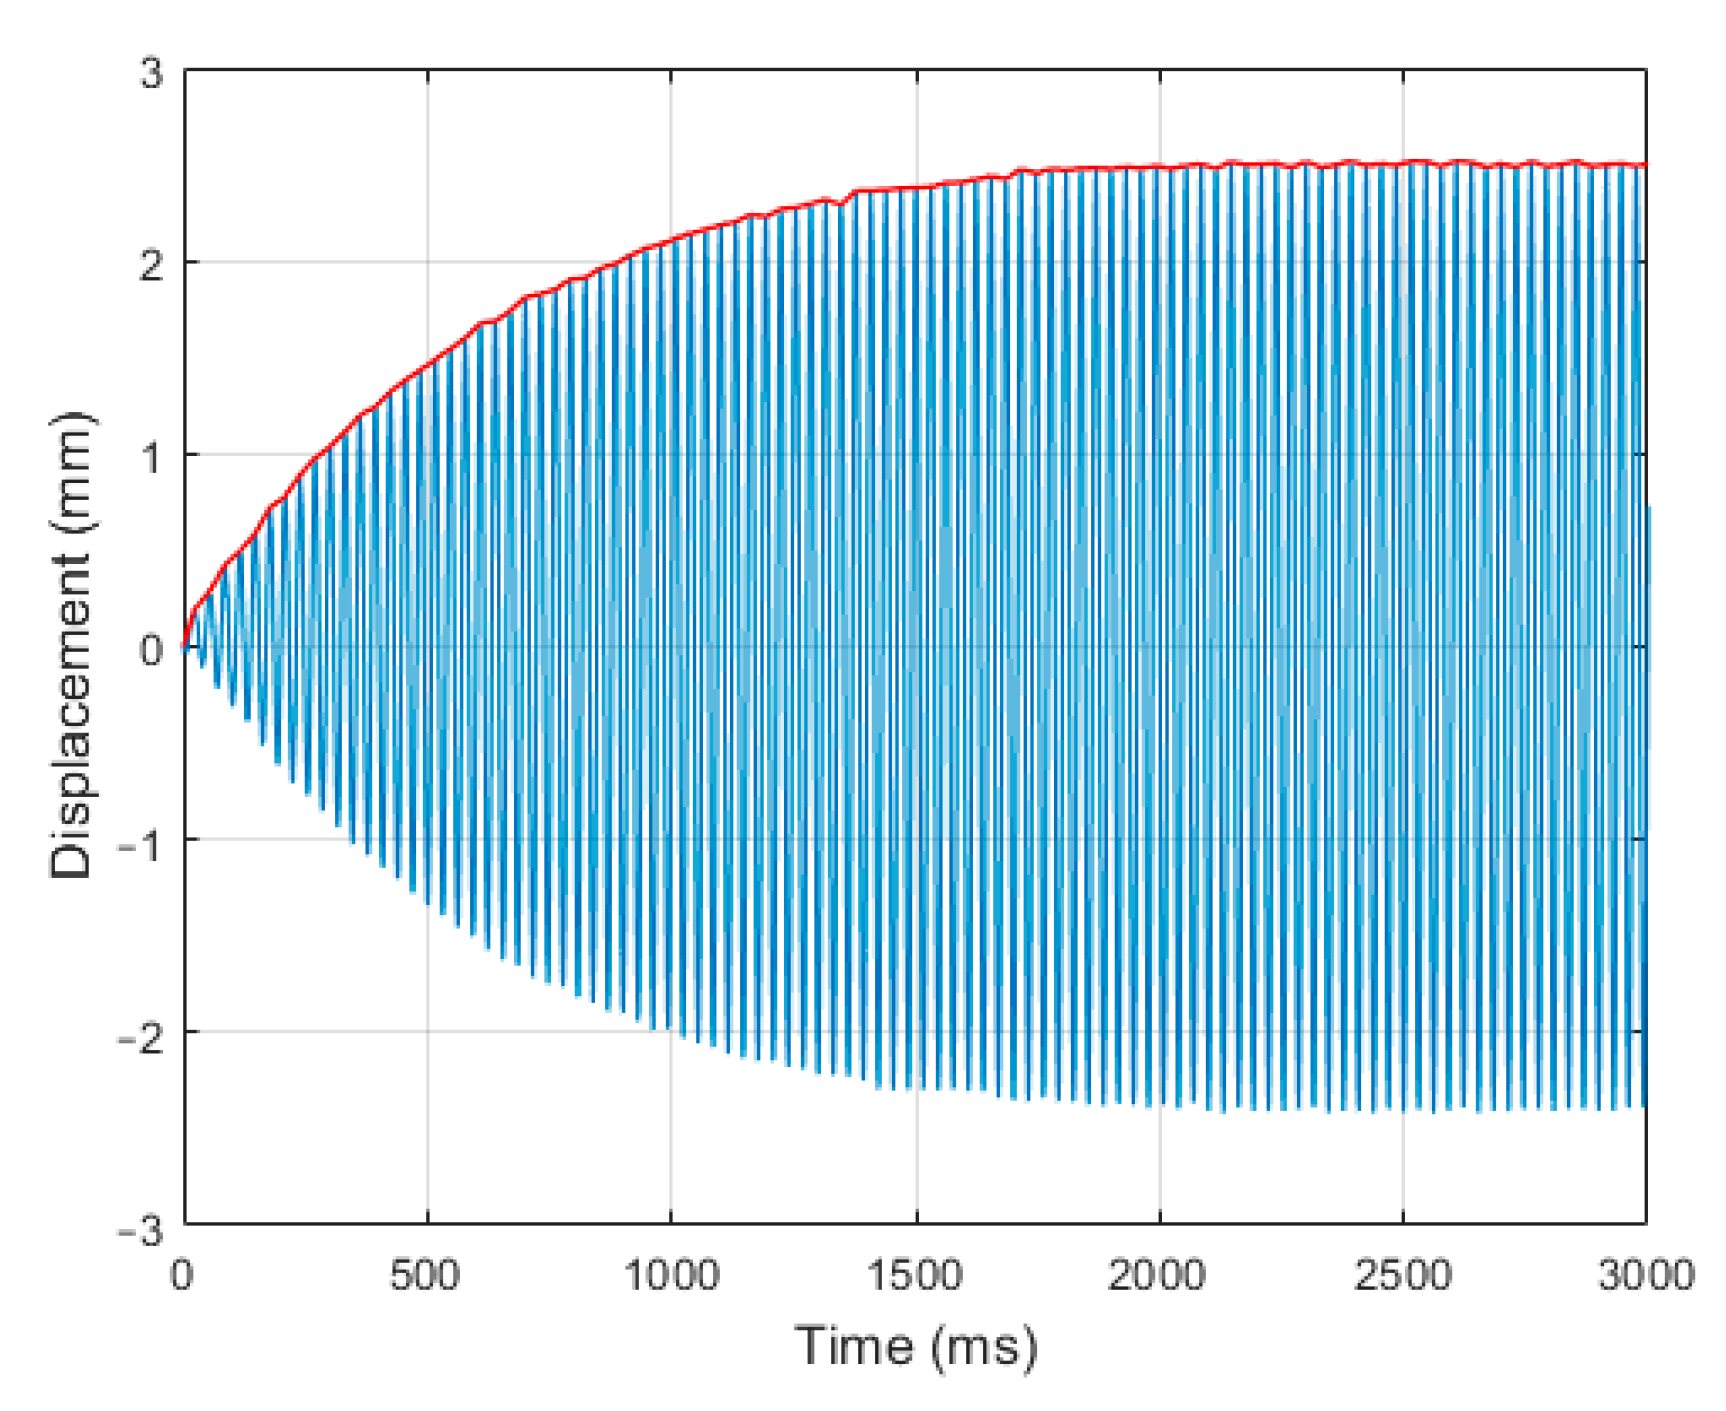
Vibrations of 10 points in the beam structure were measured by the use of the vision method. An arrangement of the measured points is presented in Figure 4. Motion determination of the whole beam structure was carried out in three stages. In the first stage, the courses of displacement of nine selected points in the beam structure were measured for 10 values of resistance. The displacement of exemplary point No. 10 for resistance equal to 65 kΩ is presented in Figure 8.

Figure 8.
Measured displacement of point No. 10 for resistance equal to 65 kΩ.
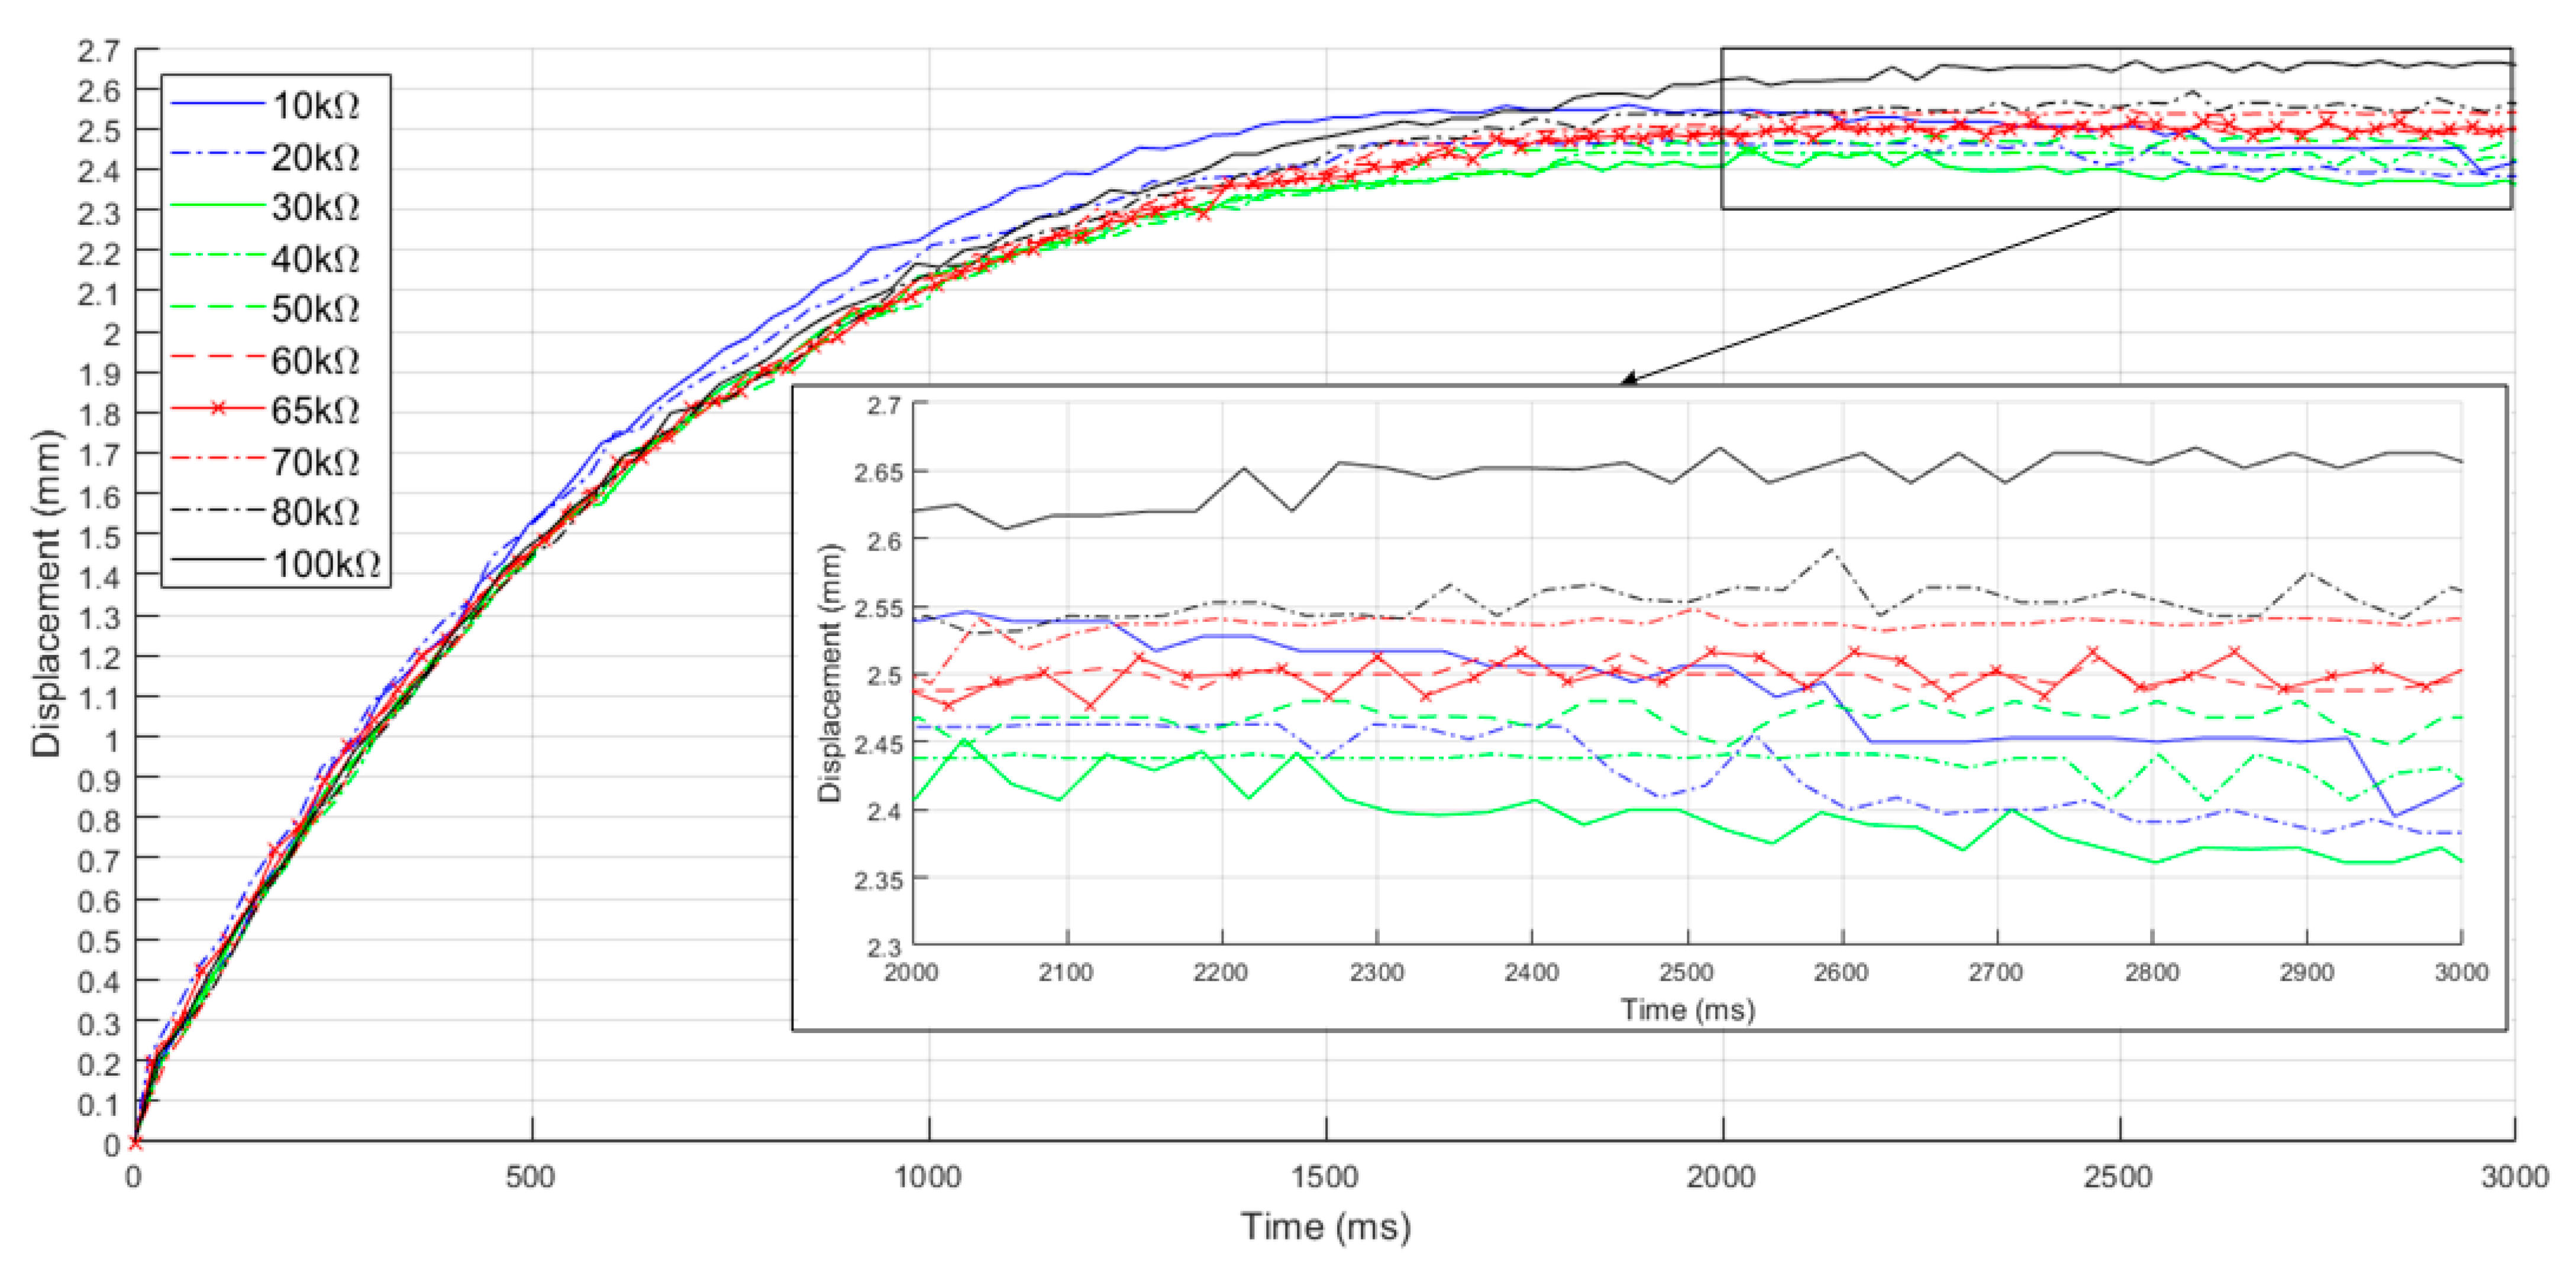
In the second stage, absolute values of the displacement of nine points were calculated for 10 values of resistance. Comparison of the absolute values of the displacements of exemplary point No. 10 for 10 values of the shunt resistance are presented in Figure 9.
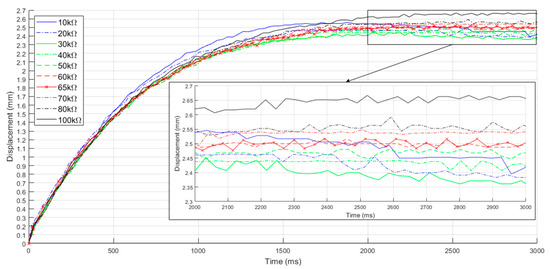
Figure 9.
Absolute values of displacements of point No. 10 for 10 values of resistance.
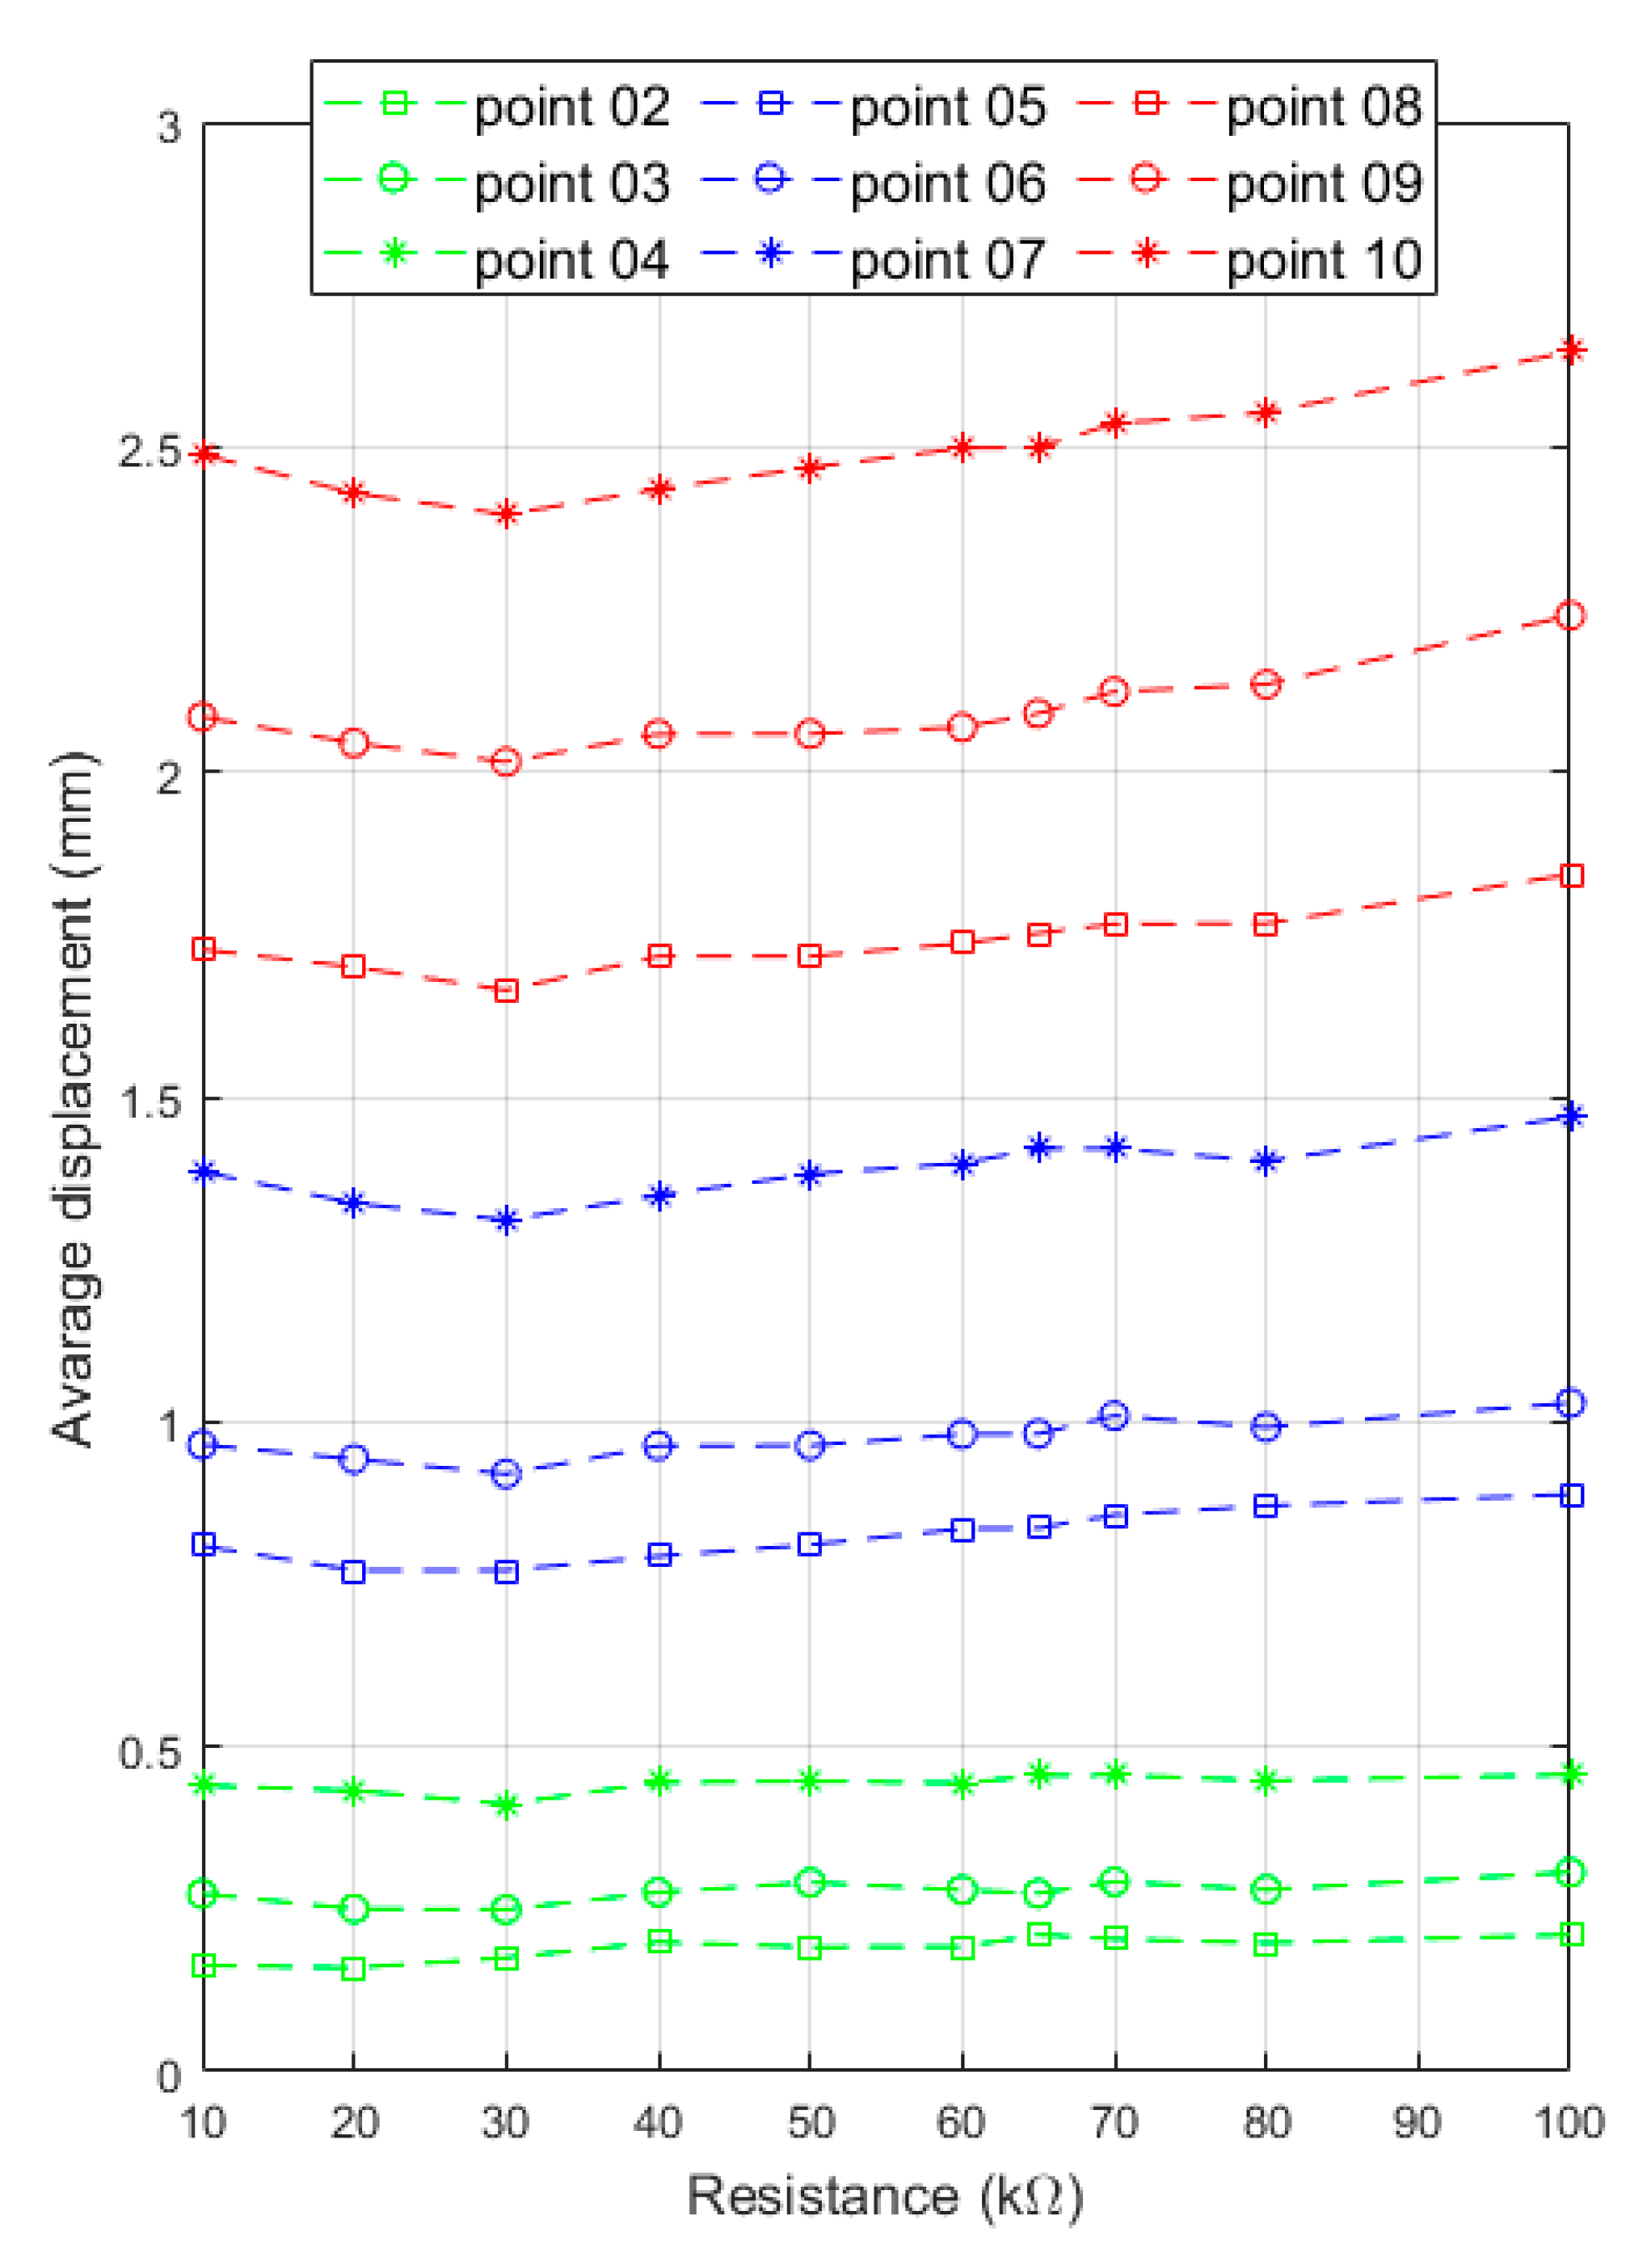
In the third stage, average displacements of nine points were calculated for the time range from 2000 ms to 3000 ms. A comparison of the average displacements of 10 points in the beam structure for 10 values of resistance is presented in Figure 10.
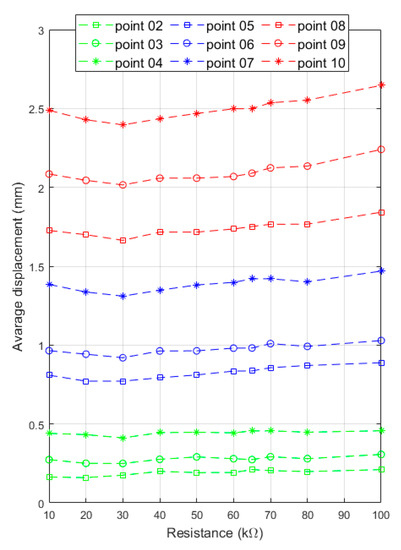
Figure 10.
Comparison of average displacements of points from 2 to 10.
5. Discussion
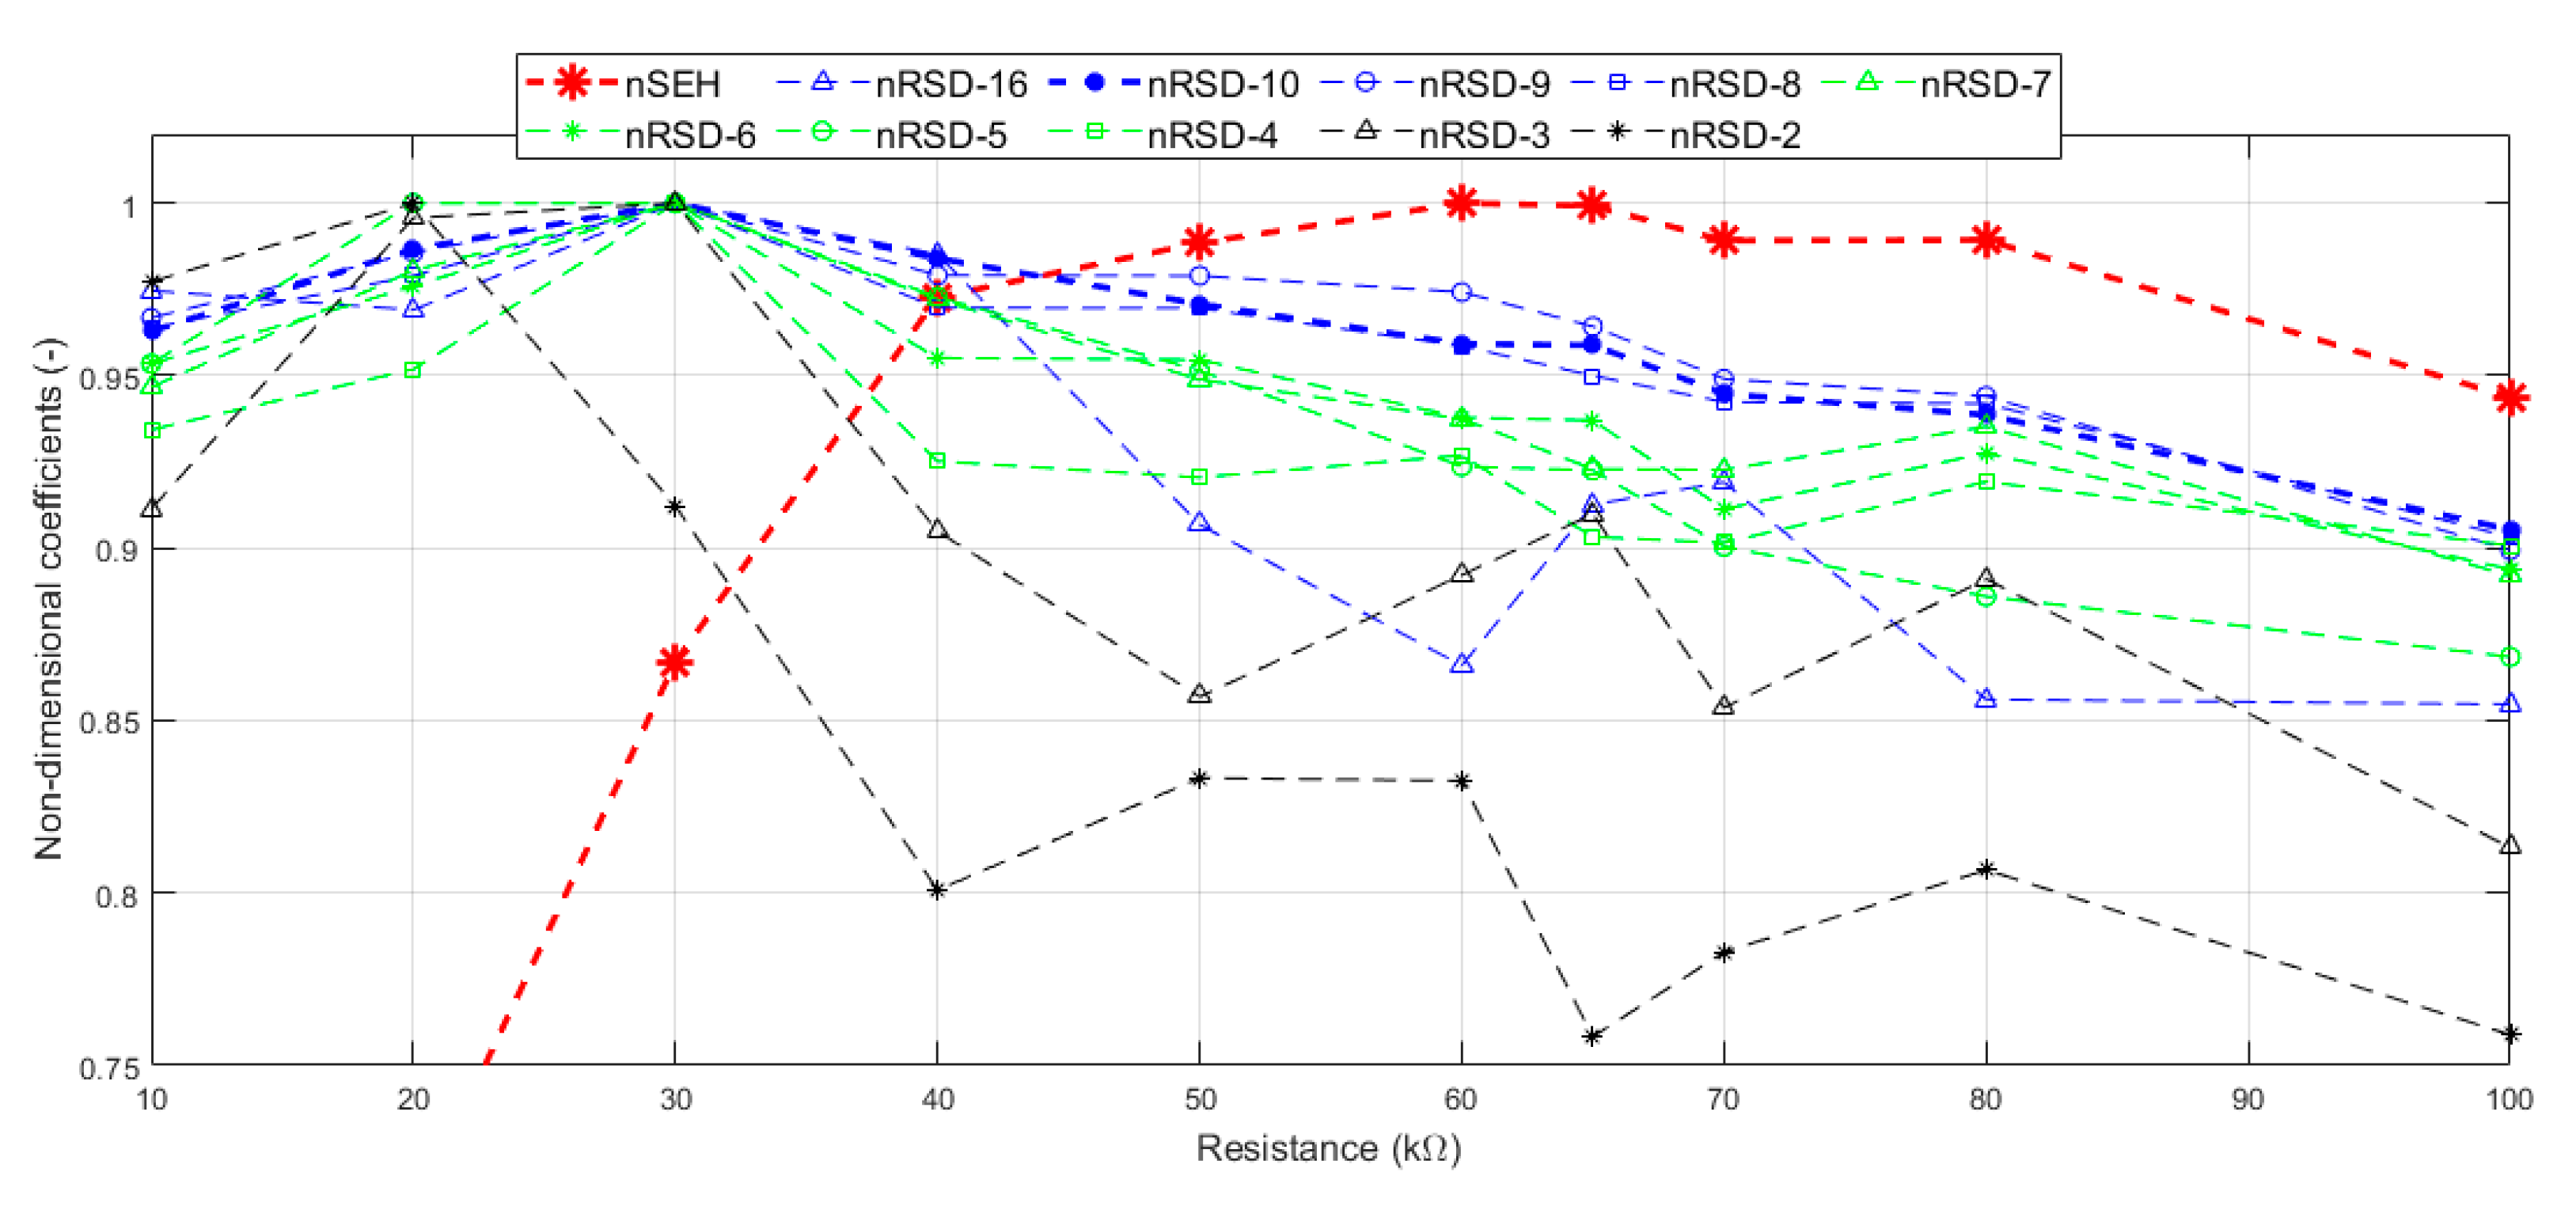
A comparison of characteristics for SEH (Figure 7b) and for RSD (Figure 10) required a definition of additional non-dimensional coefficients:
where nSEHi is the non-dimensional coefficient of harvesting for selected resistance (i), Pgi is the power generated by the MFC patches for selected resistance (i), Pgmax is the maximal power generated by the MFC patches for optimal load resistance (Rlopt), nRSDpi is the non-dimensional coefficient of damping for a selected point (p) and for a selected resistance (i), ypmin is the minimal displacement of a selected point (p) in the beam structure for an optimal shunt resistance (Rsopt), and ypi is the displacement of a selected point (p) in the beam structure for a selected resistance (i). A comparison of the values of the calculated coefficients for points Nos. 2–10 and No. 16 is presented in Figure 11.
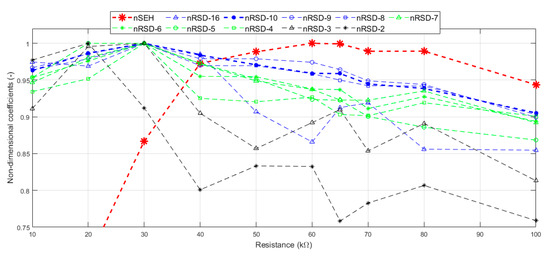
Figure 11.
Comparison of coefficients for energy harvesting and passive vibration damping.
The finding of the optimal resistance for both energy harvesting and vibration damping required a calculation of mean of coefficients nRSDpi:
where p is the number of points in a beam structure.
A definition of a total coefficient for both energy harvesting and vibration damping is:
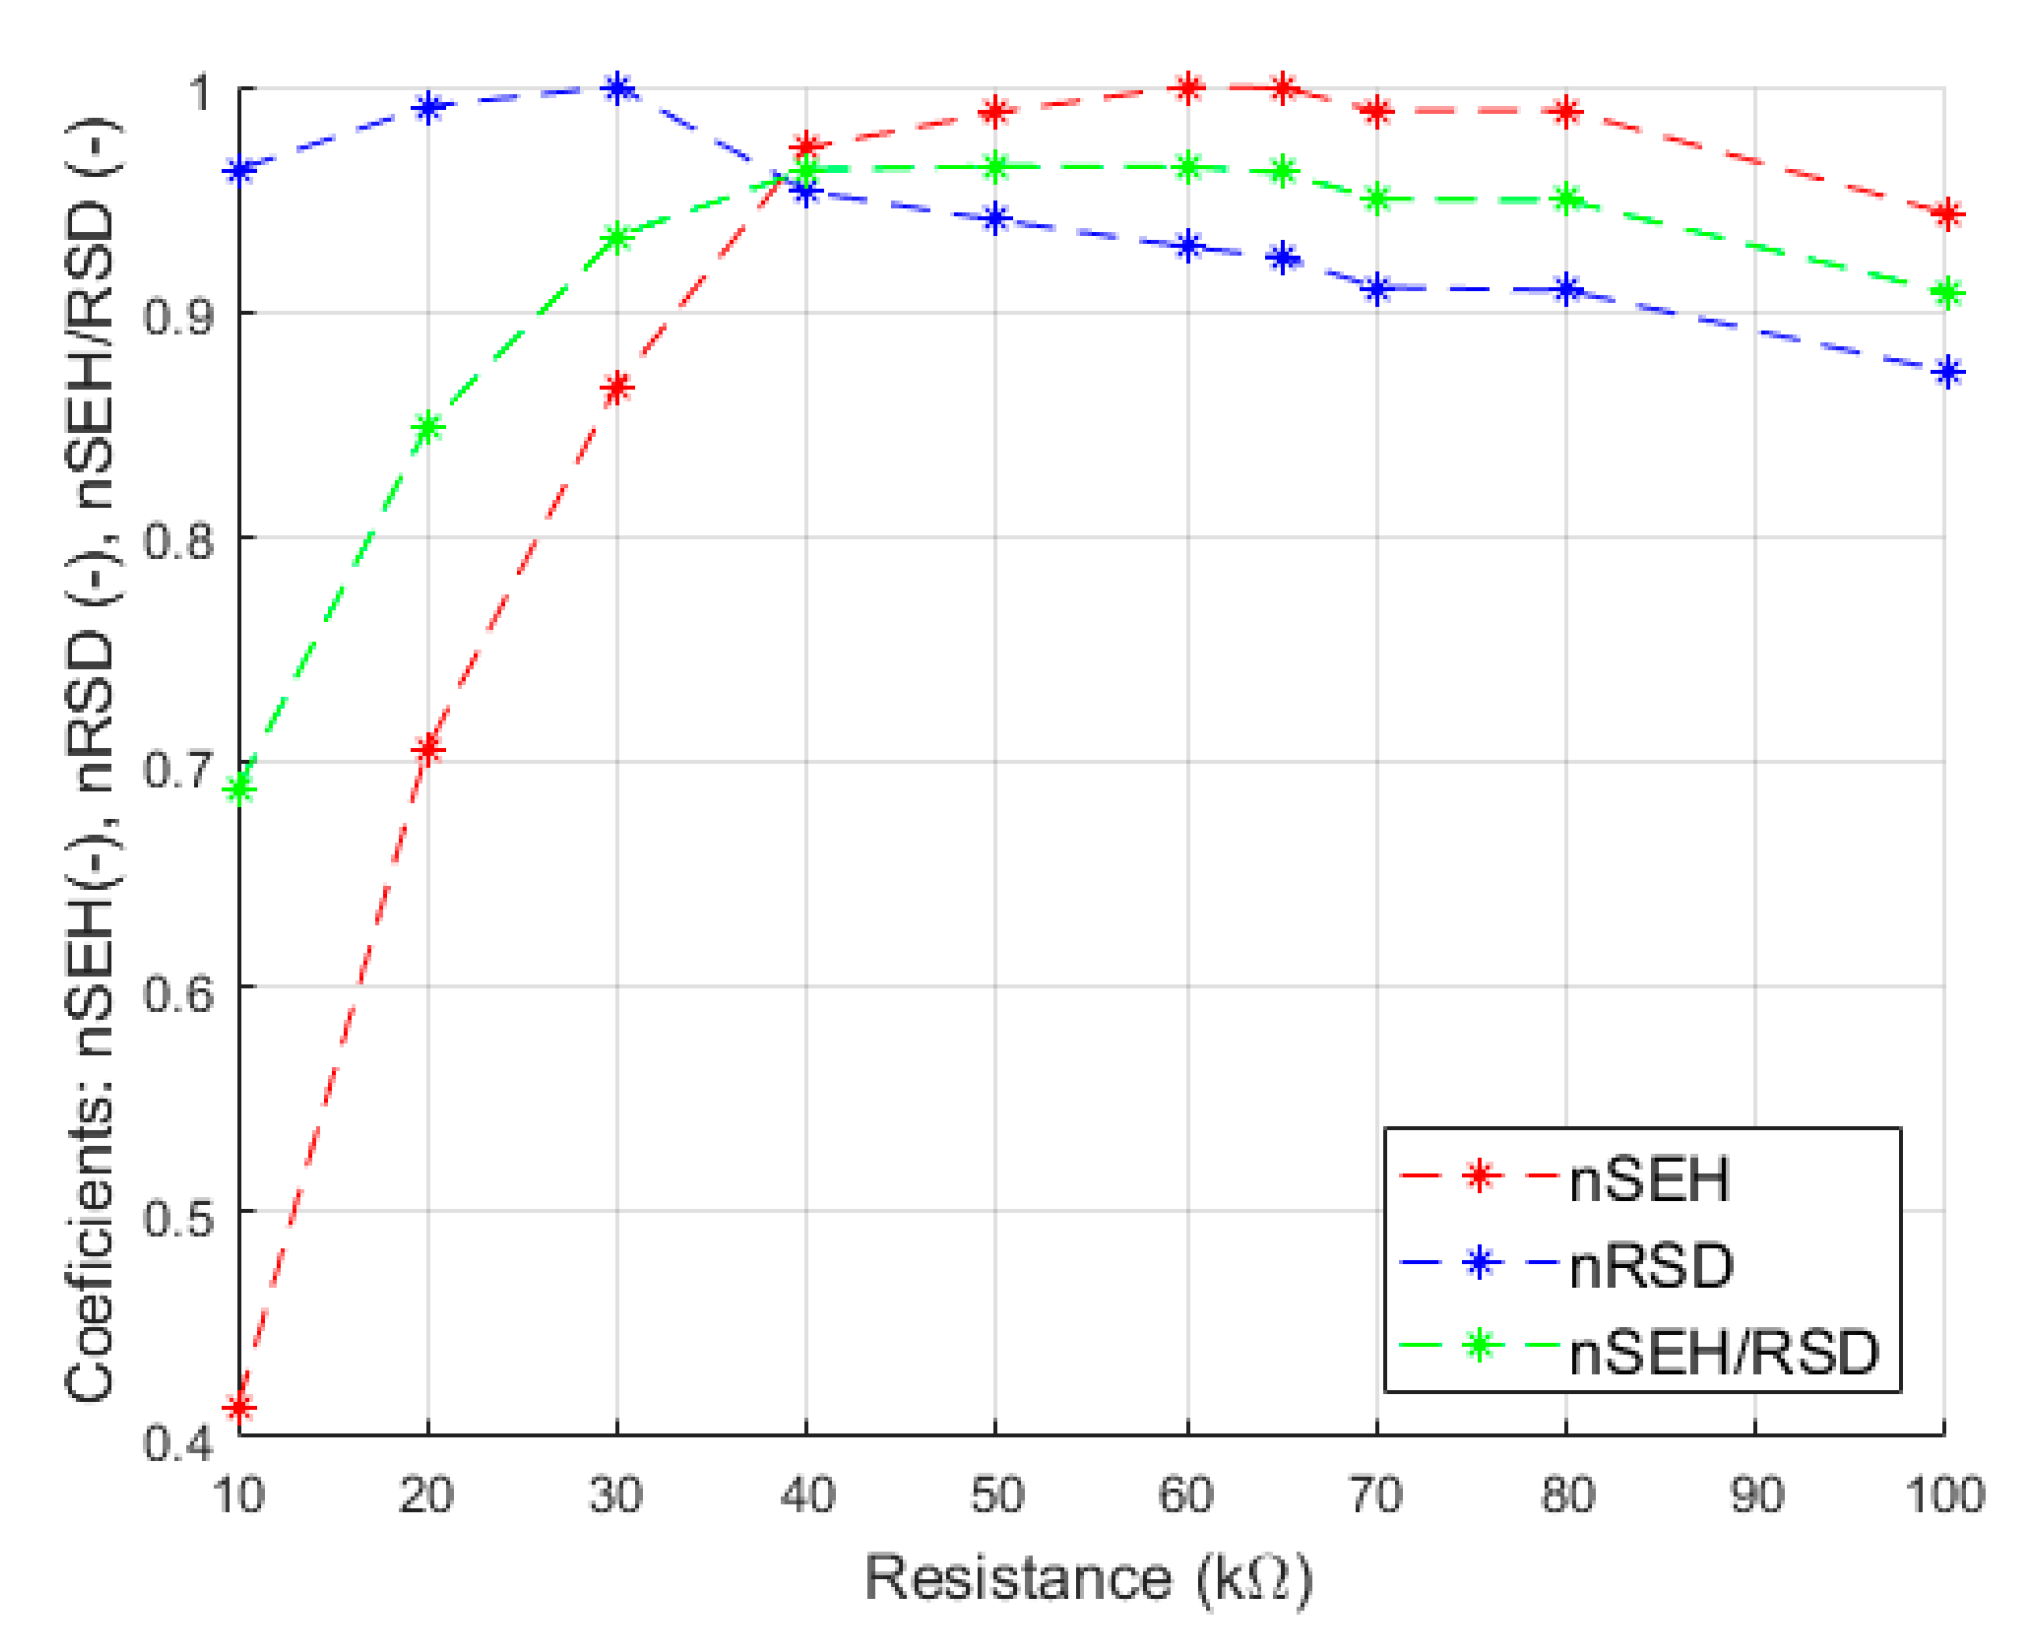
The courses of the calculated coefficients nRSDp and nSEH/RSD are presented in Figure 12. On the basis of the courses presented in Figure 11, it can be noticed that the optimal shunt resistance was included in the range from 20 kΩ to 30 kΩ and the optimal load resistance was included in the range from 60 kΩ to 65 kΩ. The values of shunt and load optimal resistances, analytically calculated based on equations from [12,21], are also included in the same ranges of resistance.
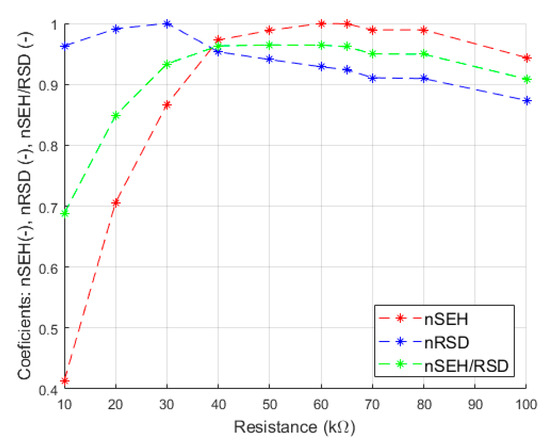
Figure 12.
Comparison of energy harvesting and passive vibration damping.
The resistances, for which an efficiency of energy harvesting and vibration damping (treated as one process) is the highest, should be included in the range from a cross point of nSEH and nRSD curves (38.7 kΩ) to the optimal load resistance. The efficiency was almost the same in this resistance range: from 95.92% to 96.16% of the sum of the non-dimensional coefficient for maximal power generated and the non-dimensional coefficient for maximal damping, which was determined on the basis of minimal displacement of beam points. The highest efficiency equaled 96.45% and for resistance equaled 50 kΩ.
If energy harvesting and vibration passive damping are treated as two separate processes, the highest efficiency of both processes is only in a cross point of nSEH and nRSD curves. In this point, the generated electric power equaled 95.92% of the maximal power generated for an optimal load resistance (Rlopt) and vibration shunt damping equaled 95.92% of the maximal damping for an optimal shunt resistance (Rsopt). For the rest of the resistance range, from the cross point of nSEH and nRSD curves to the optimal load resistance, the efficiencies of energy harvesting and vibration passive damping were different, e.g., for resistance, it equaled 50 kΩ efficiencies that were correspondingly equal to 98.85% and 94.05%.
6. Conclusions
Piezoelectric energy harvesting and vibration shunt damping of a cantilever beam were tested in laboratory research. The research contained 10 experiments in which courses of the energy-harvesting process and vibration passive damping were estimated. Energy harvesting was estimated by measurements of generated current for the given load resistance values. Vibration passive damping was assessed by use of a vision method, which enabled the displacements’ measurements of 10 selected points in the beam structure for the given shunt resistance values. Values of both load resistance and shunt resistance were chosen on the basis of analytically calculated optimal load resistance and optimal shunt resistance. On the basis of conducted experiments, the resistance range for which both the energy-harvesting process and the vibration-damping process are most effective was determined.
The resistances for which both the energy-harvesting process and the vibration shunt-damping process are most effective should be included in the resistance range, the upper limit of which is equal to the optimal load resistance. The lower limit of the resistance range is determined by the cross point of the first non-dimensional coefficient, describing the energy-harvesting process, and the second non-dimensional coefficient, describing the shunt-damping process. The way of determining these coefficients was proposed in an article. A vibration shunt-damping process can be estimated by the use of the vision analysis. Such analysis enables the researcher to make a determination of the damping process for the whole structure of the tested cantilever beam.
The determination of the resistance value, which is optimal in both energy harvesting and vibration passive damping, can be useful for applications in which energy conversion is realized without any additional mechanical structure. In other words, MFC patches are directly glued onto the mechanical structure (e.g., smart trust), vibrations of which are undesirable. In such case, the MFC patches can be used for two purposes: a decrease of undesirable vibration and a generation of an energy-supplying wireless sensor, which was used for the vibration measurement.
The next step of the presented research could be to determine the optimal resistance for a series connection of two MFC patches.
Author Contributions
Conceptualization, D.G.; methodology, D.G. and A.S.; investigation, D.G. and A.S.; writing—original draft preparation, D.G. and A.S.; writing—review and editing, D.G. and A.S.; supervision, D.G. All authors have read and agreed to the published version of the manuscript.
Funding
This research was funded by the AGH University of Science and Technology within the scope of the research program No. 16.16.130.942 and Initiative for Excellence—Research University at AGH UST.
Institutional Review Board Statement
Not applicable.
Informed Consent Statement
Not applicable.
Data Availability Statement
Data are contained within the article.
Conflicts of Interest
The authors declare no conflict of interest.
References
- Roundy, S.; Wright, P.K. A piezoelectric vibration based generator for wireless electronics. Smart Mater. Struct. 2004, 13, 1131–1142. [Google Scholar] [CrossRef] [Green Version]
- Erturk, A.; Inman, D.J. An experimentally validated bimorph cantilever model for piezoelectric energy harvesting from base excitations. Smart Mater. Struct. 2009, 18, 025009. [Google Scholar] [CrossRef]
- Yang, Y.; Tang, L.; Li, H. Vibration energy harvesting using macro-fiber composites. Smart Mater. Struct. 2009, 18, 115025. [Google Scholar] [CrossRef]
- Li, S.; Crovetto, A.; Peng, Z.; Zhang, A.; Hansen, O.; Wang, M.; Li, X.; Wang, F. Bi-resonant structure with piezoelectric PVDF films for energy harvesting from random vibration sources at low frequency. Sens. Actuators A Phys. 2016, 247, 547–554. [Google Scholar] [CrossRef] [Green Version]
- Peigney, M.; Siegert, D. Piezoelectric energy harvesting from traffic-induced bridge vibrations. Smart Mater. Struct. 2013, 22, 095019. [Google Scholar] [CrossRef] [Green Version]
- Khazaee, M.; Rezaniakolaie, A.; Moosavian, A.; Rosendahl, L. A novel method for autonomous remote condition monitoring of rotating machines using piezoelectric energy harvesting approach. Sens. Actuators A Phys. 2019, 295, 37–50. [Google Scholar] [CrossRef]
- Grzybek, D. Piezoelectric generator for the power supply of the monitoring system. In Proceedings of the 2014 15th International Carpathian Control Conference (ICCC), Velke Karlovice, Czech Republic, 28–30 May 2014; pp. 135–138. [Google Scholar]
- Liang, J.; Liao, W.-H. Energy flow in piezoelectric energy harvesting systems. Smart Mater. Struct. 2010, 20, 015005. [Google Scholar] [CrossRef]
- Lefeuvre, E.; Badel, A.; Richard, C.; Petit, L.; Guyomar, D. A comparison between several vibration-powered piezoelectric generators for standalone systems. Sens. Actuators A Phys. 2006, 126, 405–416. [Google Scholar] [CrossRef]
- Lien, I.C.; Shu, Y.-C.; Wu, W.-J.; Shiu, S.M.; Lin, H.C. Revisit of series-SSHI with comparisons to other interfacing circuits in piezoelectric energy harvesting. Smart Mater. Struct. 2010, 19, 125009. [Google Scholar] [CrossRef]
- Zhao, S.; Erturk, A. Electroelastic modeling and experimental validations of piezoelectric energy harvesting from broad-band random vibrations of cantilevered bimorphs. Smart Mater. Struct. 2012, 22, 015002. [Google Scholar] [CrossRef]
- Liao, Y.; Sodano, H.A. Modeling and Comparison of Bimorph Power Harvesters with Piezoelectric Elements Connected in Parallel and Series. J. Intell. Mater. Syst. Struct. 2009, 21, 149–159. [Google Scholar] [CrossRef]
- Billon, K.; Montcoudiol, N.; Aubry, A.; Pascual, R.; Mosca, F.; Jean, F.; Pezerat, C.; Bricault, C.; Chesné, S. Vibration isolation and damping using a piezoelectric flextensional suspension with a negative capacitance shunt. Mech. Syst. Signal Process. 2020, 140, 106696. [Google Scholar] [CrossRef]
- Gripp, J.; Rade, D. Vibration and noise control using shunted piezoelectric transducers: A review. Mech. Syst. Signal Process. 2018, 112, 359–383. [Google Scholar] [CrossRef]
- Hagood, N.W.; von Flotow, A. Damping of structural vibrations with piezoelectric materials and passive electrical net-works. J. Sound Vib. 1991, 146, 243–268. [Google Scholar] [CrossRef]
- Shevtsov, S.N.; Akopyan, V.A. Active and passive vibration control of aircraft composite structures using power piezoelectric patch-like actuators. In Piezoceramic Materials and Devices; Ivan, A., Parinov, N.-Y., Eds.; Nova Science Publishers: Hauppauge, NY, USA, 2010; pp. 285–323. [Google Scholar]
- Thomas, O.; Ducarne, J.; Deü, J.-F. Performance of piezoelectric shunts for vibration reduction. Smart Mater. Struct. 2011, 21, 015008. [Google Scholar] [CrossRef] [Green Version]
- Yun, Y.S.; Kim, J.C.; Noh, H.M.; Kim, M.S. Reduction in High-Frequency Wheel Noise/Vibration of Railway Vehicles Using Piezoelectric Shunt. Int. J. Precis. Eng. Manuf.-Green Technol. 2021, 8, 981–995. [Google Scholar] [CrossRef]
- Lossouarn, B.; Aucejo, M.; Deü, J.-F.; Multon, B. Design of inductors with high inductance values for resonant piezoelectric damping. Sens. Actuators A Phys. 2017, 259, 68–76. [Google Scholar] [CrossRef] [Green Version]
- Lesieutre, G.; Ottman, G.; Hofmann, H. Damping as a result of piezoelectric energy harvesting. J. Sound Vib. 2004, 269, 991–1001. [Google Scholar] [CrossRef]
- Liang, J.; Liao, W.-H. Piezoelectric Energy Harvesting and Dissipation on Structural Damping. J. Intell. Mater. Syst. Struct. 2008, 20, 515–527. [Google Scholar] [CrossRef]
- Shen, H.; Qiu, J.; Balsi, M. Vibration damping as a result of piezoelectric energy harvesting. Sens. Actuators A Phys. 2011, 169, 178–186. [Google Scholar] [CrossRef]
- Liao, Y.; Sodano, H.A. Optimal placement of piezoelectric material on a cantilever beam for maximum piezoelectric damping and power harvesting efficiency. Smart Mater. Struct. 2012, 21, 105014. [Google Scholar] [CrossRef]
- Grzybek, D.; Micek, P. Impact of Series and Parallel Connection of Macro Fiber Composite Patches in Piezoelectric Harvester on Energy Storage. Energies 2021, 14, 2379. [Google Scholar] [CrossRef]
- Smart Material—Home of the MFC. Available online: https://www.smart-material.com/MFC-product-mainV2.html (accessed on 5 August 2021).
- Wolszczak, P.; Łygas, K.; Litak, G. Dynamics identification of a piezoelectric vibrational energy harvester by image analysis with a high speed camera. Mech. Syst. Signal Process. 2018, 107, 43–52. [Google Scholar] [CrossRef]
- Romaszko, M.; Sapiński, B.; Sioma, A. Forced vibrations analysis of a cantilever beam using the vision method. J. Theor. Appl. Mech. 2015, 53, 243–254. [Google Scholar] [CrossRef]
- Sioma, A. Geometry and resolution in triangulation vision systems. In Photonics Applications in Astronomy, Communications, Industry, and High Energy Physics Experiments 2020; SPIE: Bellingham, WA, USA, 2020; Volume 11581, p. 115810. [Google Scholar]
- Al-Ashtari, W.; Hunstig, M.; Hemsel, T.; Sextro, W. Frequency tuning of piezoelectric energy harvesters by magnetic force. Smart Mater. Struct. 2012, 21, 035019. [Google Scholar] [CrossRef]
- Deraemaeker, A.; Nasser, H.; Benjeddou, A.; Preumont, A. Mixing Rules for the Piezoelectric Properties of Macro Fiber Composites. J. Intell. Mater. Syst. Struct. 2009, 20, 1475–1482. [Google Scholar] [CrossRef] [Green Version]
- Biscani, F.; Nasser, H.; Belouettar, S.; Carrera, E. Equivalent electro-elastic properties of Macro Fiber Composite (MFC) transducers using asymptotic expansion approach. Compos. Part B Eng. 2011, 42, 444–455. [Google Scholar] [CrossRef]
- Wilkie, W.K.; Inman, D.J.; Lloyd, J.M.; High, J.W. Anisotropic Laminar Piezocomposite Actuator Incorporating Machined PMN–PT Single-crystal Fibers. J. Intell. Mater. Syst. Struct. 2006, 17, 15–28. [Google Scholar] [CrossRef] [Green Version]
- Erturk, A.; Inman, D.J. Appendix E: Numerical Data for PZT-5A and PZT-5H Piezoceramics. Piezoelectric Energy Harvest. 2011, 373–374. [Google Scholar] [CrossRef]
- Grzybek, D.; Micek, P. Experimental investigation on the piezoelectric energy harvester as the self-powered vibration sensor. J. Theor. Appl. Mech. 2018, 56, 687–699. [Google Scholar] [CrossRef] [Green Version]
- Roundy, S.; Leland, E.S.; Baker, J.; Carleton, E.; Reilly, E.; Lai, E.; Otis, B.; Rabaey, J.M.; Wright, P.K.; Sundararajan, V. Improving power output for vibration-based energy scavengers. IEEE Pervasive Comput. 2005, 4, 28–36. [Google Scholar] [CrossRef]

Publisher’s Note: MDPI stays neutral with regard to jurisdictional claims in published maps and institutional affiliations. |
© 2021 by the authors. Licensee MDPI, Basel, Switzerland. This article is an open access article distributed under the terms and conditions of the Creative Commons Attribution (CC BY) license (https://creativecommons.org/licenses/by/4.0/).