Abstract
The concept of predictive and preventive maintenance and constant monitoring of the technical condition of industrial machinery is currently being greatly improved by the development of artificial intelligence and deep learning algorithms in particular. The advancement of such methods can vastly improve the overall effectiveness and efficiency of systems designed for wear analysis and detection of vibrations that can indicate changes in the physical structure of the industrial components such as bearings, motor shafts, and housing, as well as other parts involved in rotary movement. Recently this concept was also adapted to the field of renewable energy and the automotive industry. The core of the presented prototype is an innovative interface interconnected with augmented reality (AR). The proposed integration of AR goggles allowed for constructing a platform that could acquire data used in rotary components technical evaluation and that could enable direct interaction with the user. The presented platform allows for the utilization of artificial intelligence to analyze vibrations generated by the rotary drive system to determine the technical condition of a wind turbine model monitored by an image processing system that measures frequencies generated by the machine.
1. Introduction
Diagnostic systems play a key role in modern machines and devices. Information about the technical state of a given device has vital importance in many systems’ functioning [1,2] and is a subject of meticulous research conducted by numerous academic institutions [3,4,5,6]. There are many diagnostic systems based on vibration measurement using a laser sensor [7,8], classical piezoelectric accelerometers [9,10], shape-memory sensors [11,12], and fiber optic solutions [13,14]. Very interesting results might be acquired by utilizing the elastoacoustic effect [15,16,17]. Nevertheless, the abundance of different systems does not correspond with simplifying the user experience. The most frequently conducted measurements require off-line post-processing or the use of an isolated subsystem. The measurement system itself needs to meet relatively high installation requirements.
Augmented reality is one of many tools that can be applied to such a system to make it more user-friendly. Information acquired with that technology can be further used to directly supplement an engineer or an assembly line worker in a variety of tasks, including but not limited to research, diagnostics, and system evaluation. The AR interface is bidirectional, which means it can be used both as a data source and as an output information display. Naturally, acquired data might be further processed and used as input data for neural network systems.
One of the widely utilized doctrines in modern-day industrial machinery conservation and servicing is predictive maintenance, which is the methodology based on forecasting possible hardware and software failures or malfunctions beforehand to minimize the overall cost of replacing critical components of the monitored system. There are many possible approaches to this method. However, the most common technique applied in predictive maintenance is monitoring the vibrations generated by the elements of the machinery park.
Currently used detection methods could vary from sophisticated electronic sensor matrices to simply conducting an organoleptic test. The authors of [18] described the utilization of vibration detection in aircraft hardware using a statistical approach based on the generalized likelihood ratio test (GLRT) [19]. The main objective of the selected method was to detect a phenomenon called limit cycle oscillation (LCO), which consists of unwanted sustained oscillations within the aircraft hardware [20]. The standard method of detecting unwanted vibration is based on the experience of the crew and maintenance personnel, including the pilot, who can fill in a ”vibration reporting sheet” to accurately describe an organoleptic measurement of occurring vibrations—this is done using a model of the control surface servo loop and statistical methods, including a Monte Carlo test campaign. The simulation confirmed the ability of the system to accurately detect vibrations with a 100% success rate, although the accuracy of estimating amplitude and duration of a given phenomenon was greatly dependent on specific flight conditions. Many other examples of predictive maintenance are based on the direct measurement of vibrations using electrical sensors. The authors of [21] conducted a measurement of thermal power plant fans using vibration analysis. Measurements were conducted from four different points of the examined bearing that proved to be faulty after the previous examination. After providing sufficient maintenance, vibration intensity significantly decreased, indicating that this method is useful as a diagnostic procedure.
The authors of [22] showed several different approaches to the acceptance criteria for vibrations. The machine evaluation can be conducted using the ISO 10916-1 standard or the manufacturer’s limit. However, the most reliable method is trend comparison, which allows comparing the data collected over time. It is much easier to apply this method with consistent data. It is also possible to establish a baseline comparison using vibration measurement during acceptance testing or comparing readings from several different machines with identical structures or a similar type under the same conditions. Standard measurement hardware includes transducers (accelerometers, velocity, and displacement transducers) and a fast Fourier transform (FFT) analyzer.
One of the commonly tested types of machinery park elements includes bearings. The authors of [23] conducted an experiment involving vibration measurement of taper bearings using a piezoelectric accelerometer and FFT analyzing software and hardware. In order to extract sufficient data, the frequency response function (FRF) was used. The conducted testing proved that by comparing the FRF function of both damaged and intact bearings, it is possible to conclude the technical state of the tested element, although it is not clear how accurate that method is.
The authors of [24] described a predictive maintenance system for a gateway gantry used in a foundry of a steel plant. The developed system allows for contactless measurement and analysis of vibration generated by the device. It consists of wireless vibration sensors as well as a supervisory control and data acquisition (SCADA) system. At the same time, the collected data analysis was based on the real environment. Data analysis was performed using wavelet transform, which is useful for diagnostics of induction engine rotor, bearings, and transmission networks. Sensors used for vibration measurement were installed permanently and wirelessly. The selected hardware was dust-proof and temperature-resistant in order to increase reliability. In order to accurately determine the technical condition of the said gantry, trend analysis, as well as verification tests using renovated gantry, were applied.
The authors of [25] described a vibration analysis method designed for the gas turbine generator (GTG) used in cogeneration power plants. It allows for the technical condition of the engine that drives GTG since abnormal vibration levels can occur in the case of unbalanced rotating elements, misalignment and looseness of mechanical parts, and other malfunctions, such as fatigue cracking of the machine’s rotor. By trend analysis, it was possible to identify faulty elements of the GTG.
It is also possible to apply vibration analysis to other types of malfunctions. The authors of [26] used continuous Morlet wavelet transform in order to detect potential punctual damage to gears coupled to a motor and a generator. It allowed it to accurately detect gears’ faulty teeth, which can be useful in machinery park maintenance.
One of the interesting solutions applied to predictive maintenance is the use of infrared thermography presented in [27,28]. The application of deep learning networks in the analysis of thermographic images results in high performance in classifying the state of photovoltaic panels and, through this, an increase in the efficiency of generating electrical power from these renewable sources. Neural networks can also be applied in power distribution [29] and in the estimation of the current grid parameters [30], which can also contribute to smart grid optimization with renewable sources. The Bayesian optimizer [31,32] is very commonly used in this area. Neural networks of both machine and deep Learning types are implemented most often in cloud computing or less often in edge computing architecture using Industry 4.0 standards and the Internet of Things. [33,34]
While there are many different methods of analyzing the signal, the most popular data acquisition method is based on accelerometers that can accurately measure both frequencies and amplitudes of oscillations induced by the machine’s components, and this method is also used in wind turbines’ predictive maintenance systems, as shown by the authors of [35]. In the case mentioned, the signal analysis was mainly focused on remaining useful life estimation that could give a clear answer on when it is necessary to replace some parts of the device using the health index algorithm and statistical analysis on limited data.
The following article presents a concept and preliminary research for an innovative measurement platform that will ultimately be used for easy and fast wind turbines and other rotating machinery diagnostics. The core of the presented prototype is an innovative augmented reality interface. Utilizing AR goggles allowed the construction of a platform that, on the one hand, allows acquiring data used in rotary elements analysis and, on the other hand, enables direct interaction with potential users. The proposed system was tested on a simple wind turbine model. It allowed choosing the most effective marker for the vision system that could result in the most accurate assessment of oscillations in the construction expressed by the acceleration. Both marker and system architecture were described and explained to ensure that the method’s reasoning was clear.
The proposition of said system included neural network algorithms implemented in a cloud structure designed to learn about possible states of the observed object and interpret the results. The output information, which is the technical state of a given object, might be displayed directly for the use of an operator. Although all of those technologies are wildly used, their combined integration enables achieving a synergistic development of an entirely new predictive maintenance system. In consequence, future operators of a such platform would be able to examine wind turbines without accessing critical parts of the machinery, and they could have the ability to analyze multiple objects in real time, with the only restriction being a clear vision of the markers that are designed to be visible from the ground. The data would be further sent to a cloud structure where neural network algorithms could accurately classify the results and display them using augmented reality goggles. Conducted tests proved the feasibility of such a system and gave an insight into the structure of such an innovation.
2. Methodology
In order to conduct said research, Microsoft HoloLens gen. 2 was used. Measurement was conducted by a camera integrated with this device. It was equipped with many sensors and a camera for analyzing the environment. It allowed the system to map the surrounding area accurately. Microsoft HoloLens gen. 2 is a display device mounted on the user’s head that allows projecting holographic images on the real-time image. The device’s sensors consist of a variety of different RGB cameras and depth analyses. It is possible to detect the edge of a given object and create a cloud of points and their respective coordinates using an inertial measurement unit. It is possible thanks to two integrated processing units: a 32-bit Intel processor (central processing unit—CPU) and a holographic processing unit (HPU). The CPU is responsible for managing the process and the HPU for processing the holographic projection, thus updating viewed holograms in real time. The HPU can define its location and orientation in relation to the surrounding area and build its real-time map. Thanks to those functionalities, the user can move in their environment while being able to see the original image of the environment, which gives an ability to acquire, process, and send a variety of data. At the same time, all the information can be easily displayed using AR goggles. In this case, it is possible to classify the system as mixed reality (MR) because the holographic image displayed over a real-time image of the environment is displaying information gathered from the system in real time.
Figure 1 shows a schematic diagram of a measurement system. The user equipped with AR goggles observes a designated object. Information acquired during the mapping process is transmitted via a wireless communication module to the external processing infrastructure. Ultimately, neural network-based data analysis might be calculated by the integrated CPU directly. However, during preliminary research, it was decided to conduct data post-processing using a cloud infrastructure. The neural network algorithm was located in the exact location as the software responsible for controlling the rotary force generator. In this case, an electrical servomechanism can accurately control the rotational speed of the wind turbine model. Image processing and analysis, marker oscillation detection, and classifying detected defects were conducted in the cloud that sends feedback information wirelessly to the AR goggles to display data concerning an object in real-time.
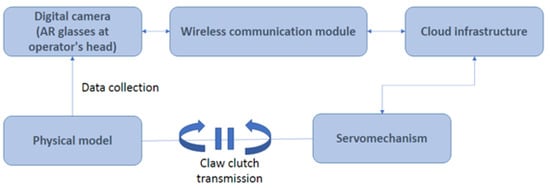
Figure 1.
Schematic diagram of a measurement system.
3. Measurement Stand
The main problem to be solved in the conducted research was to obtain a sufficient amount of input data consisting of the frequencies and amplitudes describing the movement of the propeller. There are several possible ways to approach this issue. The target result was a predictive system for vertical wind turbines. One of the most appealing methods of diagnosis is the utilization of cameras and vision systems that can provide a contactless frequency measurement. However, such technology comes with the drawback of requiring fast, high-resolution digital cameras and the need for optimizing image processing software in real-time applications. In order to obtain sufficient data, the vision measurement requires an additional process of tracking the measurement points, which is often provided by the usage of feature elements such as points, lines, surfaces, and colors that can be extracted from the image. The most basic method involves tracking the movement of a measurement point in units of integer pixels that can be provided by using physical trackers placed on the measurement element or edge-detection algorithms. However, the mean of a multi-interval second-order derivative method could also be applied. Visual methods can prove troublesome in the case of an attempt to create a cost-effective measurement system that can be applied in the industrial environment, especially while detecting high frequencies within a given test object.
The main goal was to determine the feasibility of using a 100 fps camera for detecting unequal weight distributions in wind turbines. That kind of malfunction will commonly occur in the case of mechanical damage of a propeller or in the unlikely event of faulty manufacturing.
In order to conduct proper measurement, a small-scale model of a wind turbine was built using a programmable logic controller (PLC)-controlled servomechanism, steel shaft, clutch, and bearings, as well as a 3D-printed propeller. The design taken into account while preparing the experimental model is presented in Figure 2.
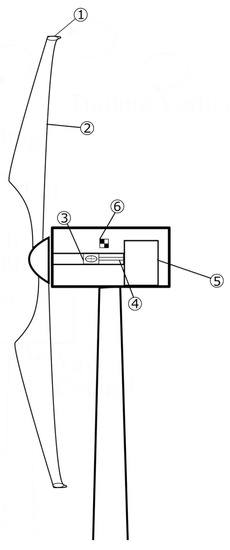
Figure 2.
Model used during tests: 1—bolts mounting; 2—propeller’s blade; 3—bearing; 4—clutch; 5—servomechanism; 6—marker for image processing.
A visual marker for image analysis software was placed on the body of the propeller to gather accurate data. The measurement was conducted using a 100 FPS camera placed perpendicular to the marker so that any angle-related distortions could be neglected.
In order to correctly measure vibrations using the HoloLens camera, a checkerboard pattern was placed on a mounting of bearings used in the wind turbine model. As described in a study regarding low-amplitude frequency analysis [36], it is crucial to prepare a region of interest (ROI), which is an area that will be presented on images used to detect oscillations. The pattern was chosen for two reasons. First of all, it was easier to process the data without binarization, and a checkerboard, which is a pattern widely used in camera calibration, can also be used to take into account the angles and surface curves that could otherwise disturb the measurement. The pattern was presented in Figure 3.

Figure 3.
Visual marker used for oscillation measurement.
In the case of the following experiment, edge analysis was used, which was assumed to be more suitable for pixel and sub-pixel techniques that make it possible to increase the nominal resolution of the images used. Sub-pixel methods require post-processing images of a known shape and are based on interpolating certain image features. Thus, they can significantly increase a maximum frequency that can be measured within a given model beyond the resolution of a camera. It was unnecessary to employ this method fully during conducted measurements, but it will be useful in scaling the proposed solutions and applying developed systems on more commercially available cameras with lower resolution.
In the following application, vibration detection from image sequences was used. In this method, images are recorded using a defined frame rate, and the relative displacement of pixels can be analyzed by a subset as a function of time. The first recorder image was used as a reference image in every measurement. The algorithm uses the following correlation criterion: Function (1) [37].
N represents the number of pixels in the subset, i represents the pixel index, represents the intensity value in the reference subset, represents the intensity value in matching pixels, a represents a scale factor, and b represents the offset parameter. Matching is conducted by minimizing the value of C. For expressing the pixels in the corresponding target, subset shape mapping functions (2) and (3) were used.
where and indicate translation between the centers of subset patterns that are potentially matching; , , stand for displacement gradient [37].
The marker was placed on the mounting of a turbine’s shaft, where the bearings were placed to minimize possible distortions. The marker’s placement and the view from a HoloLens camera are shown in Figure 4.

Figure 4.
Marker’s placement on wind turbine model and view from HoloLens. 1—servomechanism; 2—checkerboard marker; 3—propeller; and 4—measured peak frequency displayed by the HoloLens.
Hand gestures of the user (a) are used by the HPU. This way the HPU can react to specific gestures and allow users to point to an analysis target. Marker (2) was placed on the model’s body close to the bearing of the rotating element (3). Another task of the HPU is constant monitoring of the marker’s placement. Hologram (4) can be moved using the user’s gestures. Its task, in this case, was a direct display of a frequency of oscillations with the highest amplitude.
Another method that could be used, as shown by the authors in [38], is phase-based motion estimation. This method uses image processing to represent an image as a phase and a magnitude domain with wavelet basis functions. However, the first method was deemed more suitable for said experiment and possibly large-scale applications.
For experiments, six different states were defined for the physical model of a wind turbine. They are as follows:
- State 1 (Figure 5a)—reference state with a regular, uninterrupted movement of a wind turbine’s rotary elements, without defective bearings, unbalances, and misalignment of the turbine’s axis
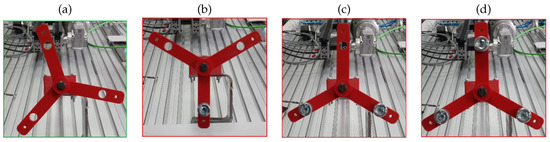 Figure 5. Load distrubution on propeller’s bladess: (a) normal state, (b) unbalanced with a single mass, (c) unbalanced with double mass, (d) balanced with extra mass at every blade.
 - State 2 (Figure 5b)—slight unbalance caused by additional mass on one of the propeller’s blade
- State 3 (Figure 5c)—notable unbalance caused by additional mass on two of the propeller’s blades
- State 4 (Figure 5d)—balanced propeller with the additional mass on all three of the propeller’s blades. This state is supposed to simulate the overloading mechanical components of a wind turbine.
- State 5 (Figure 6)—misalignment of the shaft of the propeller and the shaft of the servomechanism
- State 6 (Figure 7)—faulty bearings, where this effect was achieved by removal of several steel balls from a bearing, which causes abnormal weight distribution.

Figure 6.
Shaft misaligment: (a) normal state, (b) shaft’s misaligment.
Figure 6.
Shaft misaligment: (a) normal state, (b) shaft’s misaligment.


Figure 7.
Normal and faulty bearings.
Figure 7.
Normal and faulty bearings.

In order to simulate the propeller’s blades, imbalanced steel bolts were placed on the ends of each blade so that the mass distribution was equal on the propeller. The device was set in motion by a servomechanism with a velocity ranging from 0 to 600 rpm for training data sets and to check the system’s effectiveness for test data. This velocity exceeded 600 rpm in some data samples. Measurement was conducted for approximately 21 min, then one bolt was removed, and the process was repeated until six data sets were collected. Thus, the data consisted of six different measurements representing six different states of the wind turbine model, where five of them represented a malfunction caused by an unbalanced propeller with different weights or misaligned rotating parts, and one data set was used as a reference. For each of the six data sets, a different rotational speed was used to conduct a measurement, thus ensuring that a variety of scenarios will be included in a learning set.
Each data set was reduced to 25 min and cut into 1200 one-second samples. In order to test deep learning algorithms used in the research, each data set was divided into 1000 training samples and 500 test samples. For each data set, one one-second sample was displayed on the Figure 8 in order to compare the signals visually.
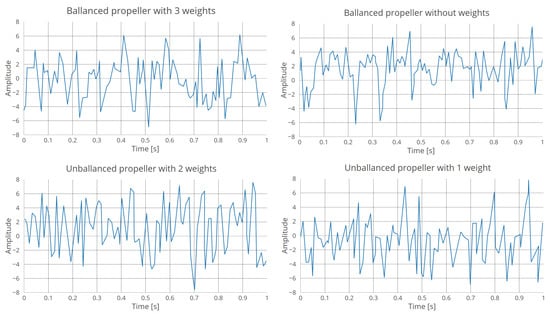
Figure 8.
One-second-long raw data samples.
Each sample was then processed using the fast Fourier transformation (FFT) algorithm (Figure 8). Before using deep learning algorithms for signal analysis, the researchers examined the graphic representation of a frequency domain. Manually recognizing patterns within the charts proved to be a complex process with little to no results. Thus, it was concluded that unsupervised learning must be utilized to analyze gathered data—analysis for one sample from each set. An example of such analysis is presented in Figure 9.
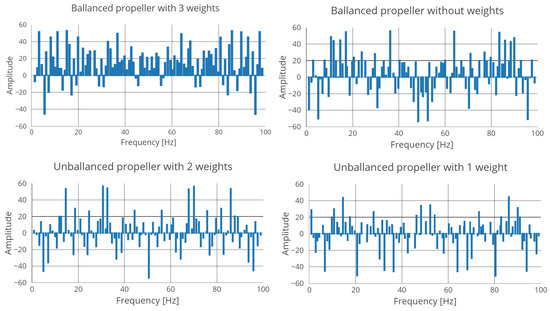
Figure 9.
FFT of signal samples.
The deep learning algorithm was based on the NET1_HF neural network, consisting of 1 hidden layer with 10 neurons and 1 output layer with 2 neurons, where 1500 one-second samples were used as input data, as shown in Figure 10. Both the frequency and the amplitude of oscillations in the model were analyzed in order to classify the sample as either a malfunctioning or a well-maintained wind turbine.
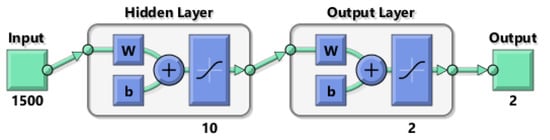
Figure 10.
NET1_HF neural network diagram [39].
As shown in Figure 11, the division of the data into three different subsets required for optimal neural network training was randomized in order to eliminate the possible influence on the learning process. Each sample was randomly selected for a training set that was further used for assessing biases and weights. The validation set and test set were used further to plot errors during the training process and to compare different models. The method chosen for training was the Levenberg–Marquardt algorithm, which utilizes the following approximation to the Hessian matrix (4) [40].
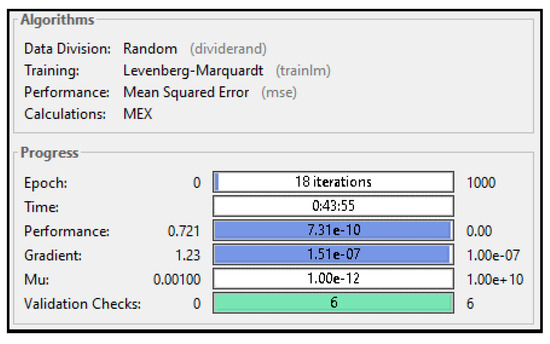
Figure 11.
Algorithm used in NET1_HF neural network and data regarding the learning process.
Scalar (displayed in Figure 11 as Mu) is decreased after each reduction in performance function and increased only in case a step would result in an increase in the performance function [41].
The neural network performance was assessed using a mean squared error method, and output calculations were made with the MEX algorithm [42]. The training continued until the 18th iteration, where the validation error stopped decreasing.
The training efficiency, as presented in Figure 12, shows in which epoch the neural network achieved the best results, in addition to providing an insight into the learning process for the training, validation, and test subsets. The dotted line was used as a reference to represent optimal results; thus, points adjacent to or overlapping with it indicate convergence. In the case of plots divergent in relation to a reference line, it is imperative to train a neural network further to obtain satisfactory results.
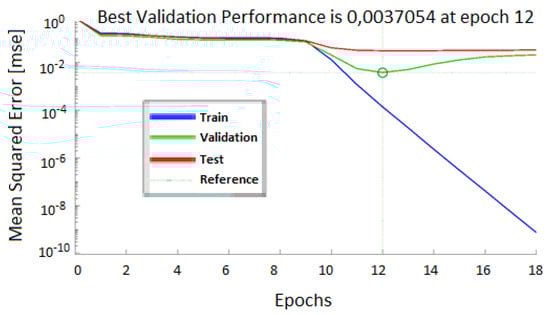
Figure 12.
Training efficiency for NET1_HF neural network.
Figure 13 shows a graphic representation of the learning process during 18 epochs as a relation between several epochs’ gradients, , and validation failure. The gradient represents a numerical calculation used for adjusting neural network parameters, is the control parameter used in the Levenberg–Marquardt algorithm, and ”val fail” (validation failure) represents a condition where training stops after neural network performance degrades for six consecutive epochs. Performance degradation indicates that data sets used might be difficult to process for the training algorithm. Thus, validation check errors could occur.
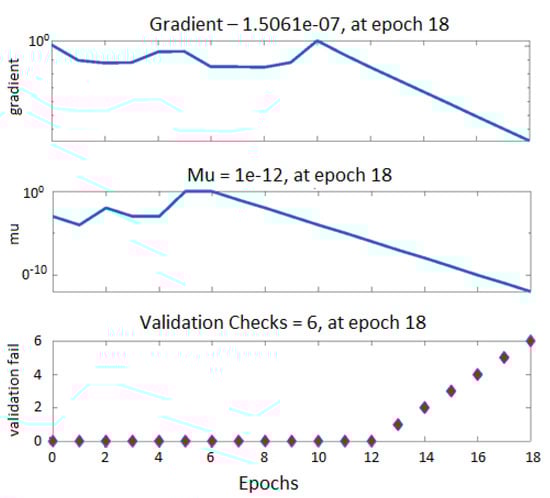
Figure 13.
NET1_HF neural network training.
4. Results
In order to test the neural network, randomly selected test data were used. There were four possible results: true positive, representing detected wind turbine malfunction; true negative, representing correct classification of the model’s state as a proper function; false positive, which is an erroneous assessment that a properly working wind turbine model has malfunctioned; and false-negative, indicating the number of cases where neural networks misclassified a malfunction as a properly working device. The results of classification are shown in Table 1.

Table 1.
Results of test data analysis using NET1_HF neural network.
In order to properly assess the algorithm’s effectiveness, three parameters were used to compare the results:
- Neural network efficiency—the number of correct classifications to the number of all classifications ratio. A model that does not give false-positive nor false-negative results has an efficiency rate of 1.
- Neural network precision—the proportion of true positive identifications to all true identifications. A model that does not generate false-positive results has a precision equal to 1.
- Neural network recall—the proportion of true-positive identifications to all true-positive identifications that an ideal algorithm should make. A model that does not generate false-negative results has a recall parameter equal to 1.
- TP—true positives.
- TN—true negatives.
- FP—false positives.
- FN—false negatives.
The value of each parameter was calculated and listed in Table 2:
Table 2.
Parameters of NET1_HF neural network’s effectiveness.
In order to further investigate possible influences on neural network classification effectiveness, efficiency was calculated separately for each one of the test subsets from six data sets representing six different states of the wind turbine model. The results were shown in Table 3.
Table 3.
Efficiency of NET1_HF neural network in each of 6 data sets.
In the proposed predictive maintenance system, the conducted measurement was supposed to gather one-second samples using vision-based frequency analysis. However, longer signal analysis is known to provide better assessments of a real frequency.
A detailed schematic is provided in Figure 14. The measurement system consists of a servo (1) coupled to a wind turbine model (2). The servomechanism was used to set the rotational speed of the turbine. Rotational speed was constant during every measurement, and its value was 600 rpm. A special marker was applied to the model (3). Hololens® goggles (4) used by the operator were equipped with several subsystems that were used. It is primarily the camera (5). Due to the too-low frame rate of the integrated cameras, a FASTCAM Mini AX50 by Photron® with a rate setting of 200 FPS was attached to the goggles. The measurement parameters are shown in Table 4. The glasses were also equipped with integrated accelerometric and gyroscopic sensors (6). A proprietary algorithm (7) was implemented. It processed the signal from the camera and position sensors into an absolute position of the marker, which was designed to be robust to operator head movement. The data was then wirelessly transmitted to the cloud (8) and received by the communication processor (9). Data were then processed by a neural algorithm (10), and subsequent defect classification by a learned network (11) was performed based on this data. Information about the dominant frequency and the state of the model under testing were then sent back to the operator and displayed as a hologram at the integrated display.
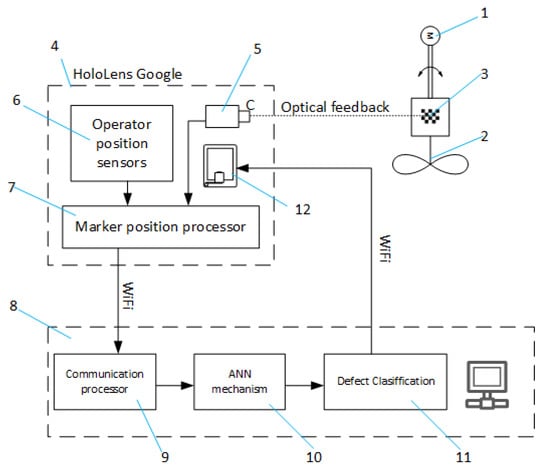
Figure 14.
Scheme of the experiment.
Table 4.
Parameters of the camera.
Shorter measurements were tested because they are more suitable for real-time applications that could accurately classify the technical state of a wind turbine. In order to increase the diagnostic capabilities of developed systems, five-second samples were tested. It was observed that for longer signals, the efficiency of the neural network was close to 100%. However, 98.3% efficiency for one-second samples analysis was assessed to be satisfactory, given that the wind turbine model had some construction problems that made it difficult to simulate the conditions of real-life applications. The diminished efficiency of a model used is a direct result of inaccuracies related to manufacturing flaws inherent to the process of 3D printing. The tolerance of dimensions is significantly greater than that of parts manufactured with CNC machinery. Thus, some additional oscillation may occur due to the looseness-designed mechanism.
Data analysis showed that false-positive classifications were present in individual cases that did not follow a pattern that could indicate the inefficiency of the method used. Every falsely classified sample belonged to a different test subset, and every value that exceeded the frequency range present in the training subsets was correctly identified. It clearly indicates that neural networks can be effectively utilized in predictive maintenance systems that classify the technical state of wind turbines based on possible unbalances in the propeller.
Another important issue with predictive maintenance of wind turbines is classification into two states: malfunction or proper working and identifying the underlying issue that caused the malfunction. It is imperative for proper maintenance of a wind turbine to accurately assess which part requires replacement and how severe is the machine’s defect. In severe cases, it could require immediate intervention. In order to tackle this issue, a second neural network was used: NET2_STATE. As shown in Figure 15, it had a similar structure to NET1_HF; although, in the output layer, six neurons were used, and the fault detection was based on amplitude characteristics instead of frequency analysis.
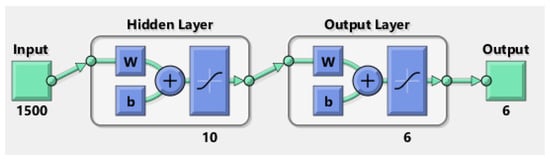
Figure 15.
NET2_STATE neural network diagram [39].
In a real-life application, it is possible to use this method for trend analysis, where data are constantly gathered over time to compare previous readings with recently measured changes in the signal’s characteristics. It allows the system to assess the mechanical wear of components accurately and, in consequence, predict the future changes in the material structures that could potentially lead to a critical malfunction. In order to train and test the new neural network, the same data divided into six states with six different rotational speeds were used in analogy to previously conducted tests. As shown in Figure 16, the same algorithms and methods were used, as well as some of the validation check conditions and the parameter. However, a different gradient and performance values were achieved. Due to the increased complexity of a NET2_STATE compared to the previous neural network, it took longer to train it.
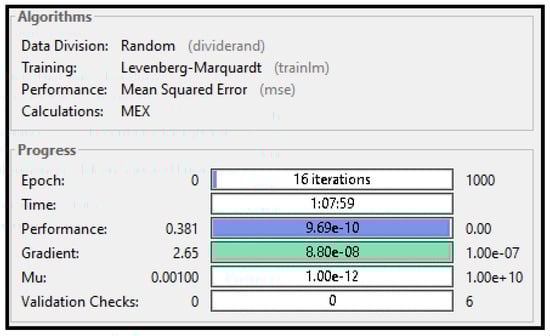
Figure 16.
Algorithm used in NET2_STATE neural network and data regarding the learning process.
The relation between mean squared error and the number of epochs was is shown in Figure 17 Analogously to a previous plot regarding the neural network’s performance, the dotted line was used as a point of reference.
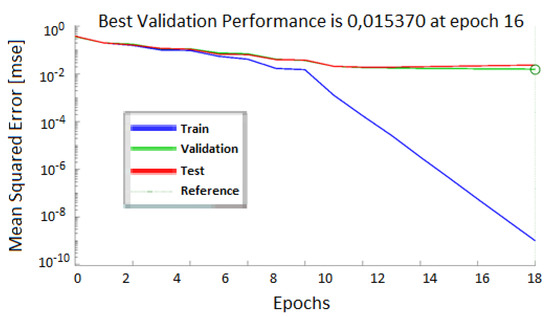
Figure 17.
NET2_STATE neural network training efficiency.
Detailed information about the learning, validation, and testing process was displayed in Figure 18. What is worth noting is that the validation check condition was not triggered while using the NET2_STATE network. Thus, the validation error continued to decrease.
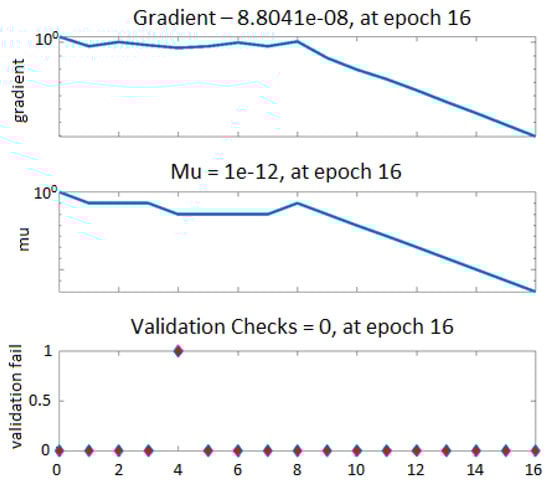
Figure 18.
NET2_STATE neural network training.
Further examination showed that the NET2_STATE neural network accurately identified 224 out of 240 test signals, which translates into 93.3% accuracy. The parameters measured in each of six test subsets representing six different data sets are shown in Table 5.
Table 5.
Parameters of NET2_STATE neural network’s effectiveness in each data sets.
Analyzing the simulation results showed that erroneous classification did not follow any patterns that could indicate that an algorithm is insufficient for solving this problem, with one notable exception. In case of rotational velocities exceeding those present in the training data subsets, the neural network always classified a sample as a malfunction of a wind turbine caused by the misalignment of rotating elements. It clearly shows that the developed algorithm needs more input data to classify samples with rotational speeds exceeding 600 rpm, which was the upper limit for all training data sets. This defect was most visible in state 2, where only one propeller blade had an extra weight attached to it to simulate imbalance. When the efficiency of the neural network was calculated with the exclusion of samples with rotational speeds exceeding 600 rpm, the accuracy increased up to 95.73%, which is a satisfactory result for such a complex predictive maintenance system.
5. Conclusions
The article described a new method for predictive inspection of machines with rotary elements. The most important part of said method is a measurement platform. It utilizes augmented reality goggles to acquire data describing the observed system. Preliminary research on a wind turbine model allowed confirmation of the following functionalities of the designed system:
- Detection of marker placement via vision system and creating frequency spectrum using acquired data. The marker’s location can be analyzed frame-by-frame, allowing a series of data representing changes in an object’s oscillations in time for construction to which a marker is mounted.
- Data acquired by the AR platform can be efficiently interpreted by neural-network-based object identification.
- Data acquired by the use of identification algorithms can be displayed to a user online on the same device that was used for data acquisition.
In the conducted research, it was shown that it is possible to use the described methodology to develop a predictive maintenance system for wind turbines. NET1_HF, an algorithm used to provide a binary output describing the technical state of a wind turbine, achieved 98.3% efficiency, 93.2% precision, and 97.6% recall, which is sufficient for detecting significant signs of malfunction. The other neural network, NET2_STATE, proved to be a reliable method to classify different types of malfunctions, given that a 93.3% accuracy was achieved. However, it was discovered that it is necessary to increase the number of input data with rotary velocities exceeding 600 rpm because the system had some difficulties processing new samples from that range.
The advantage of the proposed measurement method is a significant simplification of the maintenance process that could result in an enormous improvement of current maintenance procedures. In the case of full-scale wind turbine installations, it is possible to quickly determine the condition of the turbine and the type of damage from ground level, rather than by entering the turbine nacelle. In this way, the process of condition monitoring is significantly accelerated. The main disadvantage of the solution can be a defined and finite tolerance of the marker viewing angle, which can distort the results. Although it is not an essential issue in a model, it is close to impossible to achieve such a level of precision while measuring oscillations present in full-scale wind turbines.
Objectively, the proposed system components are a combination of known machine learning and some measurement methods and tools. Hence, it should be highlighted that the main innovation is the method itself, which, based on the images from the cameras and the set of sensors for the mobile operator, allows the non-contact generation of source data for predictive maintenance. Although the synergy of the applied systems and neural networks increases the prediction efficiency, the method of data generation is the most significant advantage of the proposed solution.
The main goal of conducted measurements was a preliminary analysis of the capabilities of such a system. Although tests were conducted in a troublesome environment where many physical elements were present (as well as edges, points, visual distortions, etc.), further experimentation is necessary for assessing the effectiveness of this method. Most notably, the distance factor present in industrial application can play a huge role in the accuracy of wind turbine diagnostics. The researched model was stripped of anything but the most basic mechanical components, which is a noticeable deviation from full-scale turbines. The obligatory subject for further research is testing the system on industrial wind turbines and extending a number of defects that can be measured.
Author Contributions
Conceptualization, K.L.; methodology, F.W. and K.L.; software, F.W.; validation, K.L.; formal analysis, K.L.; investigation, K.L. and F.W.; resources, K.L. and F.W.; data curation, K.L.; writing—original draft preparation, K.L.; writing—review and editing, K.L. and F.W.; visualization, K.L.; supervision, K.L.; project administration, K.L. All authors have read and agreed to the published version of the manuscript.
Funding
This study was written under the grant entitled “Control and measurement platform for fault prediction in electric drives” Agreement No. 24/GRANT/2021-IDUB.
Institutional Review Board Statement
Not applicable.
Informed Consent Statement
Not applicable.
Data Availability Statement
Not applicable.
Conflicts of Interest
The authors declare no conflict of interest.
Abbreviations
The following abbreviations are used in this manuscript:
| AR | Augmented reality |
| MR | Mixed reality |
| IMU | Inertial measurement unit |
| HPU | Holographic processing unit |
| CPU | Central processing unit |
| FFT | Fast Fourier transform |
| FRF | Frequency response function |
| SCADA | Supervisory control and data acquisition |
| PLC | Programmable logic controller |
References
- Han, X.; Wang, Z.; Xie, M.; He, Y.; Li, Y.; Wang, W. Remaining useful life prediction and predictive maintenance strategies for multi-state manufacturing systems considering functional dependence. Reliab. Eng. Syst. Saf. 2021, 210, 107560. [Google Scholar] [CrossRef]
- Zheng, H.; Paiva, A.R.; Gurciullo, C.S. Advancing from Predictive Maintenance to Intelligent Maintenance with AI and IIoT. arXiv 2020, arXiv:2009.00351. [Google Scholar]
- Konieczny, J.; Stojek, J. Use of the K-Nearest Neighbour Classifier in Wear Condition Classification of a Positive Displacement Pump. Sensors 2021, 21, 6247. [Google Scholar] [CrossRef]
- Massaro, A.; Selicato, S.; Galiano, A. Predictive Maintenance of Bus Fleet by Intelligent Smart Electronic Board Implementing Artificial Intelligence. IoT 2020, 1, 180–197. [Google Scholar] [CrossRef]
- Calabrese, F.; Regattieri, A.; Bortolini, M.; Gamberi, M.; Pilati, F. Predictive Maintenance: A Novel Framework for a Data-Driven, Semi-Supervised, and Partially Online Prognostic Health Management Application in Industries. Appl. Sci. 2021, 11, 3380. [Google Scholar] [CrossRef]
- Çınar, Z.M.; Abdussalam Nuhu, A.; Zeeshan, Q.; Korhan, O.; Asmael, M.; Safaei, B. Machine learning in predictive maintenance towards sustainable smart manufacturing in industry 4.0. Sustainability 2020, 12, 8211. [Google Scholar] [CrossRef]
- Lalam, N.; Lu, P.; Venketeswaran, A.; Buric, M.P. Pipeline Monitoring Using Highly Sensitive Vibration Sensor Based on Fiber Ring Cavity Laser. Sensors 2021, 21, 2078. [Google Scholar] [CrossRef]
- Kamata, M.; Obara, M.; Gattass, R.R.; Cerami, L.R.; Mazur, E. Optical vibration sensor fabricated by femtosecond laser micromachining. Appl. Phys. Lett. 2005, 87, 051106. [Google Scholar] [CrossRef]
- Li, Q.; Xing, J.; Shang, D.; Wang, Y. A flow velocity measurement method based on a PVDF piezoelectric sensor. Sensors 2019, 19, 1657. [Google Scholar] [CrossRef]
- Vitola, J.; Pozo, F.; Tibaduiza, D.A.; Anaya, M. Distributed piezoelectric sensor system for damage identification in structures subjected to temperature changes. Sensors 2017, 17, 1252. [Google Scholar] [CrossRef]
- Dominik, I.; Kwaśniewski, J.; Kaszuba, F. Ionic polymer-metal composite displacement sensors. Sens. Actuators A Phys. 2016, 240, 10–16. [Google Scholar] [CrossRef]
- Kwasniewski, J.; Dominik, I.; Kaszuba, F. Energy harvesting system based on Ionic polymer-metal composites–identification of electrical parameters. Pol. J. Environ. Stud. 2014, 23, 2339–2343. [Google Scholar]
- Ferreira, M.S.; Becker, M.; Bartelt, H.; Mergo, P.; Santos, J.L.; Frazão, O. A vibration sensor based on a distributed Bragg reflector fibre laser. Laser Phys. Lett. 2013, 10, 095102. [Google Scholar] [CrossRef]
- Wang, Y.; Liu, X.; Jin, B.; Song, X.; Wang, D.; Bai, Q.; Wang, Y.; Wang, A. Optical fiber vibration sensor using chaotic laser. IEEE Photonics Technol. Lett. 2017, 29, 1336–1339. [Google Scholar] [CrossRef]
- Kwaśniewki, J.; Dominik, I.; Lalik, K. Application of self-oscillating system for stress measurement in metal. J. Vibroeng. 2012, 14, 61–66. [Google Scholar]
- Lalik, K.; Dominik, I.; Ćwiąkała, P.; Kwaśniewski, J. Integrated stress measurement system in tower crane mast. Measurement 2017, 102, 47–56. [Google Scholar] [CrossRef]
- Kieliba, I.; Dominik, I.; Lalik, K.; Tonnesen, T.; Szczerba, J.; Telle, R. Self-Excited Acoustical System Frequency Monitoring for Refractory Concrete under Uniaxial Compression. Energies 2021, 14, 2222. [Google Scholar] [CrossRef]
- Urbano, S.; Chaumette, E.; Goupil, P.; Tourneret, J. Aircraft vibration detection and diagnosis for predictive maintenance using a GLR Test. IFAC-PapersOnLine 2018, 51, 1030–1036. [Google Scholar] [CrossRef]
- Puranik, B.; Madhow, U.; Pedarsani, R. Adversarially Robust Classification Based on GLRT. In Proceedings of the ICASSP 2021–2021 IEEE International Conference on Acoustics, Speech and Signal Processing (ICASSP), Toronto, ON, Canada, 6–11 June 2021; pp. 3785–3789. [Google Scholar]
- Andrievsky, B.; Kudryashova, E.V.; Kuznetsov, N.V.; Kuznetsova, O.A. Aircraft wing rock oscillations suppression by simple adaptive control. Aerosp. Sci. Technol. 2020, 105, 106049. [Google Scholar] [CrossRef]
- Taplak, H.; Kurt, E.; Parlak, M. Fault diagnosis for exhaust fan using experimental predictive maintenance method. Int. J. Acoust. Vib. 2016, 21, 274–280. [Google Scholar] [CrossRef]
- Sutar, S.; Warudkar, V.; Sukathankar, R. Vibration analysis of rotating machines with case studies. Int. J. Sci. Technol. Res. 2018, 7, 70–76. [Google Scholar]
- Susanto, A.; Yusuf, S.Q.; Hamid, A.; Wahyudi, H.; Subekti, S. Implementation of frequency response function on tapper bearing maintenance. Sinergi 2019, 23, 132–138. [Google Scholar] [CrossRef]
- Sikora, M.; Szczyrba, K.; Wróbel, Ł.; Michalak, M. Monitoring and maintenance of a gantry based on a wireless system for measurement and analysis of the vibration level. Eksploat. I Niezawodn. 2019, 21, 341–350. [Google Scholar] [CrossRef]
- Reksono, M.B.; Miasa, I.M. Vibration Analysis For Reducing Excessive Vibration Level on Gas Turbine Generator (GTG) 100 MW in Cogeneration Power Plant. J. Phys. Conf. Ser. 2019, 1351, 012083. [Google Scholar] [CrossRef]
- Pereira, A.L.V.; Gonçalves, A.C.; Ribeiro, R.; Chavarette, F.R.; Outa, R. Detecting punctual damage to gears through the continuous Morlet wavelet transform. Shock Vib. 2020, 2020, 1–9. [Google Scholar] [CrossRef]
- Balasubramani, G.; Thangavelu, V.; Chinnusamy, M.; Subramaniam, U.; Padmanaban, S.; Mihet-Popa, L. Infrared thermography based defects testing of solar photovoltaic panel with fuzzy rule-based evaluation. Energies 2020, 13, 1343. [Google Scholar] [CrossRef]
- Ahmed, W.; Hanif, A.; Kallu, K.D.; Kouzani, A.Z.; Ali, M.U.; Zafar, A. Photovoltaic panels classification using isolated and transfer learned deep neural models using infrared thermographic images. Sensors 2021, 21, 5668. [Google Scholar] [CrossRef]
- Massaro, A.; Meuli, G.; Galiano, A. Intelligent electrical multi outlets controlled and activated by a data mining engine oriented to building electrical management. Int. J. Soft Comput. Artif. Intell. Appl. (IJSCAI) 2018, 7, 1–20. [Google Scholar] [CrossRef]
- Causone, F.; Carlucci, S.; Ferrando, M.; Marchenko, A.; Erba, S. A data-driven procedure to model occupancy and occupant-related electric load profiles in residential buildings for energy simulation. Energy Build. 2019, 202, 109342. [Google Scholar] [CrossRef]
- Jin, X.B.; Zheng, W.Z.; Kong, J.L.; Wang, X.Y.; Bai, Y.T.; Su, T.L.; Lin, S. Deep-Learning Forecasting Method for Electric Power Load via Attention-Based Encoder-Decoder with Bayesian Optimization. Energies 2021, 14, 1596. [Google Scholar] [CrossRef]
- Alizadeh, B.; Bafti, A.G.; Kamangir, H.; Zhang, Y.; Wright, D.B.; Franz, K.J. A novel attention-based LSTM cell post-processor coupled with bayesian optimization for streamflow prediction. J. Hydrol. 2021, 601, 126526. [Google Scholar] [CrossRef]
- Miraftabzadeh, S.M.; Longo, M.; Foiadelli, F.; Pasetti, M.; Igual, R. Advances in the Application of Machine Learning Techniques for Power System Analytics: A Survey. Energies 2021, 14, 4776. [Google Scholar] [CrossRef]
- Li, W.; Chai, Y.; Khan, F.; Jan, S.R.U.; Verma, S.; Menon, V.G.; Li, X. A comprehensive survey on machine learning-based big data analytics for IoT-enabled smart healthcare system. Mob. Netw. Appl. 2021, 26, 234–252. [Google Scholar] [CrossRef]
- Wang, J.; Liang, Y.; Zheng, Y.; Gao, R.X.; Zhang, F. An integrated fault diagnosis and prognosis approach for predictive maintenance of wind turbine bearing with limited samples. Renew. Energy 2020, 145, 642–650. [Google Scholar] [CrossRef]
- Ferrer, B.; Espinosa, J.; Roig, A.B.; Perez, J.; Mas, D. Vibration frequency measurement using a local multithreshold technique. Opt. Express 2013, 21, 26198–26208. [Google Scholar] [CrossRef]
- Paunescu, G.; Lutzmann, P.; Wegner, D.; Göhler, B. Detecting vibration features from remote objects based on high-speed imagery. Opt. Eng. 2021, 60, 013102. [Google Scholar] [CrossRef]
- Wee, C.; Ngali, M. Full-Field Vibration Measurement Using Camera Through Shearlet System. Matec Web Conf. Edp Sci. 2018, 217, 01002. [Google Scholar] [CrossRef][Green Version]
- MATLAB, version 9.3.0.713579 (R2017b); The Mathworks, Inc.: Natick, MA, USA, 2017.
- de Rubio, J.J. Stability analysis of the modified Levenberg-Marquardt algorithm for the artificial neural network training. IEEE Trans. Neural Netw. Learn. Syst. 2021, 32, 3510–3524. [Google Scholar] [CrossRef]
- Gavin, H.P. The Levenberg-Marquardt Algorithm for Nonlinear Least Squares Curve-Fitting Problems; Department of Civil and Environmental Engineering, Duke University: Durham, NC, USA, 2019; pp. 1–19. [Google Scholar]
- Alonso, P.; Peinado, J.; Ibáñez, J.; Sastre, J.; Defez, E. Computing matrix trigonometric functions with GPUs through Matlab. J. Supercomput. 2019, 75, 1227–1240. [Google Scholar] [CrossRef]
- Imtiaz, S.I.; ur Rehman, S.; Javed, A.R.; Jalil, Z.; Liu, X.; Alnumay, W.S. DeepAMD: Detection and identification of Android malware using high-efficient Deep Artificial Neural Network. Future Gener. Comput. Syst. 2021, 115, 844–856. [Google Scholar] [CrossRef]


Publisher’s Note: MDPI stays neutral with regard to jurisdictional claims in published maps and institutional affiliations. |
© 2021 by the authors. Licensee MDPI, Basel, Switzerland. This article is an open access article distributed under the terms and conditions of the Creative Commons Attribution (CC BY) license (https://creativecommons.org/licenses/by/4.0/).