Article

The Connection between Architectural Elements and Adaptive Thermal Comfort of Tropical Vernacular Houses in Mountain and Beach Locations

by
Hermawan Hermawan
1 and
Jozef Švajlenka
2,*
1
Architecture Department, Faculty of Engineering and Computer Science, Qur’anic Science University, Wonosobo 56351, Indonesia
2
Department of Construction Technology, Economy and Management, Faculty of Civil Engineering, Technical University of Košice, 042 00 Košice, Slovakia
*
Author to whom correspondence should be addressed.
Energies 2021, 14(21), 7427; https://doi.org/10.3390/en14217427
Submission received: 20 September 2021 / Revised: 3 November 2021 / Accepted: 3 November 2021 / Published: 8 November 2021
(This article belongs to the Special Issue Thermal Energy Storage and Solar Thermal Energy Systems)

Abstract

:
Passive thermal comfort has been widely used to test the thermal performance of a building. The science of active thermal comfort is important to be connected with the science of architecture. The currently developing active thermal comfort is adaptive thermal comfort. Vernacular houses are believed to be able to create thermal comfort for the inhabitants. The present study seeks to analyze the connection between the architectural elements of vernacular houses and adaptive thermal comfort. A mixed method was applied. A quantitative approach was used in the measurement of variables of climate, while a qualitative methodology was employed in an interview on thermal sensations. The connection between architectural elements and adaptive thermal comfort was analyzed by considering the correlation among architectural features, the analysis results of thermal comfort, and the Olgyay and psychrometric diagrams. At the beginning of the rainy season, residents of exposed stone houses had the highest comfortable percentage of 31%. In the middle of the rainy season, the highest percentage of comfort was obtained by residents of exposed brick and wooden houses on the beach at 39%. The lowest comfortable percentage experienced by residents of exposed stone houses at the beginning of the dry season was 0%. The beginning of the dry season in mountainous areas has air temperatures that are too low, making residents uncomfortable. The study results demonstrate that adaptive thermal comfort is related to using a room for adaptation to create thermal comfort for the inhabitants.

1. Introduction

Energy efficiency has been a significant issue considering the limited supplies of energy sources [1]. Researchers have tried to seek alternative energy sources but failed to discover alternative energy equal to fossil energy. The point of energy efficiency will forever be essential despite the discovery of alternative energy. Energy efficiency will contribute to the optimal use of energy. The energy efficiency of a building is related to the thermal comfort of the building and its inhabitants [2]. Facilities that can realize thermal comfort will reduce the use of equipment to produce energy-efficient buildings. Building efficiency will be created by creating thermal comfort for its occupants [3].
An assessment of the thermal comfort of a building is known as building performance. Such assessment involves EBP (Environmental Building Performance) and IEQ (Indoor Environment Quality). The Environmental Building Performance (EBP) is the assessment of overall thermal comfort created by a building. Thermal comfort has been one of the elements of the EBP. Other elements of a building that influence the thermal performance of a building include the building design, orientation, materials, and maintenance [4]. In addition to the EBP, the IEQ has been an instrument to determine the level of inhabitants’ satisfaction. Thermal comfort is also related to room hygiene and the circulation of both clean and dirty air. The types of air entering a room are connected with the creation of the inhabitants’ thermal comfort. Studies on building hygiene often compare buildings’ thermal comfort. A building survey in Auckland, New Zealand, indicated that the building design focused on winter. The procedure leads to humidity which has adverse effects on the inhabitants [5].
Reliable design strategies are required to cope with high temperatures for the inhabitants’ comfort. An extreme heatwave will cause the inhabitants’ health to decline and even to die. Several thermal comfort experts suggest a regulation that limits the architectural elements to create a specific temperature. A building and its inhabitants are two inseparable things in creating thermal comfort. This can be seen from the inhabitants’ clothing and activity. The change in the inhabitants’ behaviors to achieve thermal comfort will lead to the difference in the building design [6].
The thermal comfort or the thermal performance of a building is influenced by building envelopes. A study to improve building performance is continuously conducted to find design strategies for comfortable buildings in a specific region. One of the strategies is biomimetic design, a combination of shape and morphology with nature. The technique combines nature and designs to create sustainable designs [7]. The thermal comfort of vernacular houses is believed to create thermal comfort of the buildings, especially in tropical areas [8]. A balcony in a two-story house in a standard room also plays an essential role in creating the thermal comfort of the building [9].
Building envelopes (walls, floors, and roofs) are architectural elements that are believed to affect the thermal comfort of occupants. An architect needs to pay attention to environmental conditions in determining the right building envelope. Environmental conditions with different air temperatures require different building envelope designs [10]. The tropics have extreme cold air temperatures in mountainous areas and sweltering air temperatures in coastal areas. Research on building envelopes in two regions with different climates will provide knowledge input for architectural designs to create efficient buildings in energy use.

The Thermal Comfort of Vernacular Buildings

The vernacular architecture was built a long time ago and provided thermal comfort for its inhabitants. The vernacular architecture approach was applied to establish contemporary development strategies. A study in Portugal on thermal comfort found passive cooling techniques such as thermal inertia, the use of colors, and the existence of a courtyard. Both air temperature and humidity were measured during the summer. The discussion includes the area’s layout, natural ventilation system, reduction of solar heat in summer, an increase of solar heat in winter, reduction of heat loss, and increase of heat gain [11].
Studies on traditional houses are frequently conducted to find responsive solutions towards the climate. A survey on traditional houses in Bushehr, Iran, analyzed solutions of thermal comfort for the inhabitants. A field study presented a basis for a design simulation to find design strategies that can create thermal comfort for the inhabitants [12]. Vernacular houses are mainly examined due to the designs and physiological resilience, which evolve to create thermal comfort. Vernacular architecture designs consider the characteristics of spatial patterns in terms of layouts, orientation, courtyard, ventilation, roofing, and the use of materials. Another study in Suggenalhalli, a village near Bangalore, India, showed a typical yard to achieve thermal comfort. The study also analyzed the survey of thermal sensations using Fanger’s analysis of PMV (Predicted Mean Vote) and Humphreys’ adaptive thermal comfort. Changing thermal comforts had complicated the investigation, and therefore the survey was repeatedly conducted. The method used was the combination of a field study and a building simulation. The inhabitants’ habit serves as a parameter in the analysis of thermal comfort [13].
Portable vernacular houses can provide thermal comfort for the inhabitants, although they are located in cold climates. The inhabitants adapt to the environment by setting up a specific room: using a fireplace for cooking and warming the body [14]. Tropical areas have two regions: plateaus and lowlands. Both have different microclimate characteristics, leading to other treatments towards the buildings: either indoor cooling or heating. The treatment can be done using modification strategies of the building envelopes, both in shapes and materials [15].
Vernacular houses in tropical beaches and mountains have different building envelope characters. Vernacular houses in coastal areas use wooden walls and exposed brick walls with tile roofs [16]. Vernacular houses in tropical mountains use wooden walls and exposed stone walls with tin roofs [17]. Vernacular house research is essential to find aspects of vernacular houses that can create thermal comfort for residents.
A study on thermal comfort was analyzed using several indices of comfort, including air temperature (Ta), effective temperature (E.T.), Corrected Effective Temperature (CET), Operation Temperature (To), Standard Effective Temperature (SET), and the humidity index (humidex). The analysis was used to evaluate the thermal comfort of two universities in Indonesia. The study results strengthened a previous study conducted in Bogor, concluding that the outdoor temperature was lower than the indoor temperature. The number of students who used A.C. at one university was half the number of students at another university [18].

2. Materials and Methods

Many studies on active thermal comfort have used the ASHRAE 55 standards. The results of the study contribute to the increasing number of models of thermal comfort. A study on thermal comfort in Brazil indicated similar results to the ASHRAE 55 standards when temperature variables have a small amplitude. A temperature with a large amplitude will lead to different acceptability [19]. Studies on thermal sensations can result in thermal sensation zones. In the beginning, the thermal sensation zones were determined by air temperature, but later they were developed with such variables as humidity, solar radiation, and wind speed. A study on thermal sensation zones was carried out in Athens using 2313 questionnaires of thermal sensations. The study results can be used to create a design that meets human perceptions of the climatic conditions of each zone [20].
A study on thermal comfort in Madurai, India, found a model of adaptive thermal comfort and explored the possibility of designing a shading device using solar charts and shadow angle protractors for the classrooms in the case study building to reduce the heat gain from the windows and external walls. The combination of passive and active thermal comfort became an item of analysis to enhance the inhabitants’ thermal comfort [21]. A field study-based research on PMV and adaptive thermal comfort in plateaus was also conducted in Bogota, Colombia. The study revealed a model of thermal comfort used as a prediction of thermal comfort [22].
Personal variables exert an influence on building design. Such variables include variables of clothing and activities. Clothing can be the inhabitants’ behavioral strategy to cope with thermal comfort. A study on traditional Indian clothing (Sari) indicated that clothing insulation could create thermal comfort. The Sari offered a range of insulation values of 0.62–0.96 clo, while winter Indian Sari ensembles provided 1.11–1.30 clo. The study was carried out using a thermal manikin, and it recorded the insulation values on all 16 selected body parts [23].

2.1. Evaluation of the Internal Environment

The Indoor Environment Quality (IEQ) has a strong relationship with the inhabitants’ thermal comfort. It enables the inhabitants to change their behaviors to create thermal comfort. Besides thermal comfort, other IEQ parameters include noise, light, and air quality. A study on the IEQ is a post-occupancy evaluation. Maximum levels of the inhabitants’ satisfaction towards the IEQ parameters have not yet been achieved. Therefore further studies are required to find strategies to attain the inhabitants’ satisfaction towards the IEQ parameters in optimal ways. As one of the IEQ parameters, thermal comfort plays a significant role in creating the inhabitants’ thermal comfort [24]. Thermal comfort is closely related to health in addition to the inhabitants’ satisfaction [25].
A study carried out in Turkey showed that design features influence the levels of the inhabitants’ satisfaction. Such features involve the existence of exterior insulation, dimmers, thermostat, and natural ventilation control through windows. Fieldwork was conducted on 240 inhabitants of apartments and houses. The study investigated factors restricting thermal levels, ventilation, lighting, the levels of noise, and the quality of humidity through a 7-point Likert scale starting from extremely satisfied to highly dissatisfied. Descriptive analysis and the Kruskal-Wallis H-test were used to analyze data. The research demonstrated the characteristics of the inhabitants. Responses of the inhabitants of apartments and two types of houses were compared to gain the average satisfaction for each kind of buildings [26].
Studies on adaptive thermal comfort using a field study were carried out. A study in China on two different seasons was conducted using a theory of adaptive thermal comfort. The analysis compared the PMV (Predicted Mean Vote) and the AMV (Actual Mean Vote). The use of graphs dominated the research. The strategies of adaptation on thermal comfort were found by making use of building envelopes [27,28]. The building envelopes served to both express an aesthetic intent and enhance the inhabitants’ thermal comfort. The achievement of thermal comfort can lead to building energy efficiency. The selection of the building materials has been a factor influencing the design of the building envelopes [29].
A field study was used to construct a theory and find thermal comfort strategies for the inhabitants. The thermal acceptance was focused on a survey of the thermal performance of a building using both field study and simulation [30]. Location raises concerns since different elevations cause different thermal conditions. Plateau and lowlands require different strategies (either heating or cooling). Therefore, villages were the focus of studies on thermal comfort regarding the ability of the buildings to create thermal comfort. Orientation was analyzed in a study on thermal comfort in villages in China. The building envelopes were also considered to attain the building passive thermal comfort strategies [31].
The phenomenon of the existence of vernacular houses has been a reference to construct a comfortable building. Therefore, the science of adaptive thermal comfort is necessary to investigate the connection between the architectural elements of vernacular houses and adaptive thermal comfort. The present study examined vernacular houses in mountain and beach locations that presented different thermal conditions. Predictions of thermal comfort models in both regions were carried out but have not been combined with the discussion of architectural elements [32].
The present study was conducted on four types of vernacular houses, both in beach and mountain locations. Vernacular houses in beach locations have wooden walls and exposed brick walls, while those in mountain locations have wooden walls and exposed stone walls. It is essential to study the vernacular house to find architectural elements that are believed to realize thermal comfort. The results of previous studies show that the vernacular houses on the beach are houses with wooden walls and exposed brick walls. Vernacular houses on the beach are houses with wooden walls and exposed stone walls [33,34]. The four samples were taken based on the results of previous studies that have succeeded in making predictions of thermal comfort models in both regions using four vernacular house samples [32].

2.2. Methodology of Internal Environment Assessment

The measured variables were air temperature, wall surface temperature, humidity, wind speed, clothing, activities, and thermal sensations. The selection of these variables was based on several studies that discussed thermal variables. Field surveys were carried out in the rainy and dry seasons to obtain differences in thermal conditions in the environment. The thermal variables of each different area will affect the thermal comfort of the occupants of each region. The length of the measurement is five days for each house and each season. In the tropics, five days of size are representative of the current season. Determination of the measurement date begins with a preliminary survey to ensure that the rainy and dry seasons have occurred [16,35,36].
The measurement was done in both objective and subjective manners. Accurate measurement was performed using a thermal imaging camera, while subjective measurement was carried out using a questionnaire (Figure 1). The former aimed to measure such variables of climate as air temperature, humidity, wind speed, and wall surface temperature. The wall surface temperature was measured in four spaces: an outdoor area, a terrace, a guest room, and a kitchen. The thermal tools were attached to a tripod in the middle of the spaces.
The objective measurement was done every hour for 16 h between 6:00 and 10:00 Western Indonesian Time (WIT) and recorded three times to find the mean. Measures every one hour can already represent the measurement of thermal variables for one day. Changes in every hour are small. Measurements for 16 h were carried out with the consideration that the activity at the residence began. Each size was recorded three times to take the average recording; the recording was carried out three times to obtain valid results. The instrument was calibrated by PT Multi Instrumentasi Mandiri Indonesia. The calibration results show an accuracy of ±0.3 °C. Responses were taken for 5 days over 3 season periods. Every day, responses were taken from 16 subjects in 4 time periods (morning, afternoon, evening, night). The number of responses was 2880 responses. Gender representation was followed by 62.5% men and 37.5% women. The occupations of the participants were: fisherman 25%, farmer 37.5%, student 12.5%, laborer 6.25% and housewife 18.75%. A field survey was conducted in wet and dry seasons between October and December of 2017 and from June to August of 2018, for five days for each house and each season. A questionnaire was administered four times day in the morning (6:00–07:00), in the afternoon (12:00–13:00) and (16:00–17:00), and in the evening (20:00–21:00). Personal data collection four to 4 times in one day represented the human response to different thermal conditions. Both objective and subjective measurements of variables were equipped by four-times of documentation in a day of size. The items of thermal sensations were constructed using the 7-point ASHRAE standards, including very hot (+3), hot (+2), warm (+1), comfortable (0), very cold (−3), cold (−2), and cool (−1) [37].
The analysis was done by recapitulating the data using graphs. The recap of climate variable data (air temperature, humidity, wall surface temperature) is displayed in several charts, namely the average climate variable per day and the total average (in five days). The difference in wall surface temperature is measured to determine the wall’s role in creating thermal comfort. Other variables are processed in Olgyay diagrams and psychrometric diagrams. The graphs’ interpretations are associated with architectural elements so that a thermally comfortable residence is found. Validation of survey results is done by comparing the charts that were made, Olgyay diagrams, and psychrometric diagrams. The measurement results will be seen in the same area on the Olgyay diagram and the psychrometric diagram. These measurements were compared with previous studies as a final validation

2.3. Typology of Vernacular Houses

The average air temperature in mountainous areas is 16–20 °C, while the air temperature in coastal areas is 27–30 °C. The difference in air temperature is quite significant, causing people to build local houses with unique characteristics. Previous research on the typology and characteristics of vernacular dwellings in the mountains and the coast found that the local houses in both areas were houses with exposed wood, exposed stone, and exposed brick. In the beach area, the activities of the house residents are dominated by sitting and chatting. In the beach area, residents sit chatting in the family room or living room for those who do not have a family room. In mountainous regions, residents sit chatting in the kitchen [33].
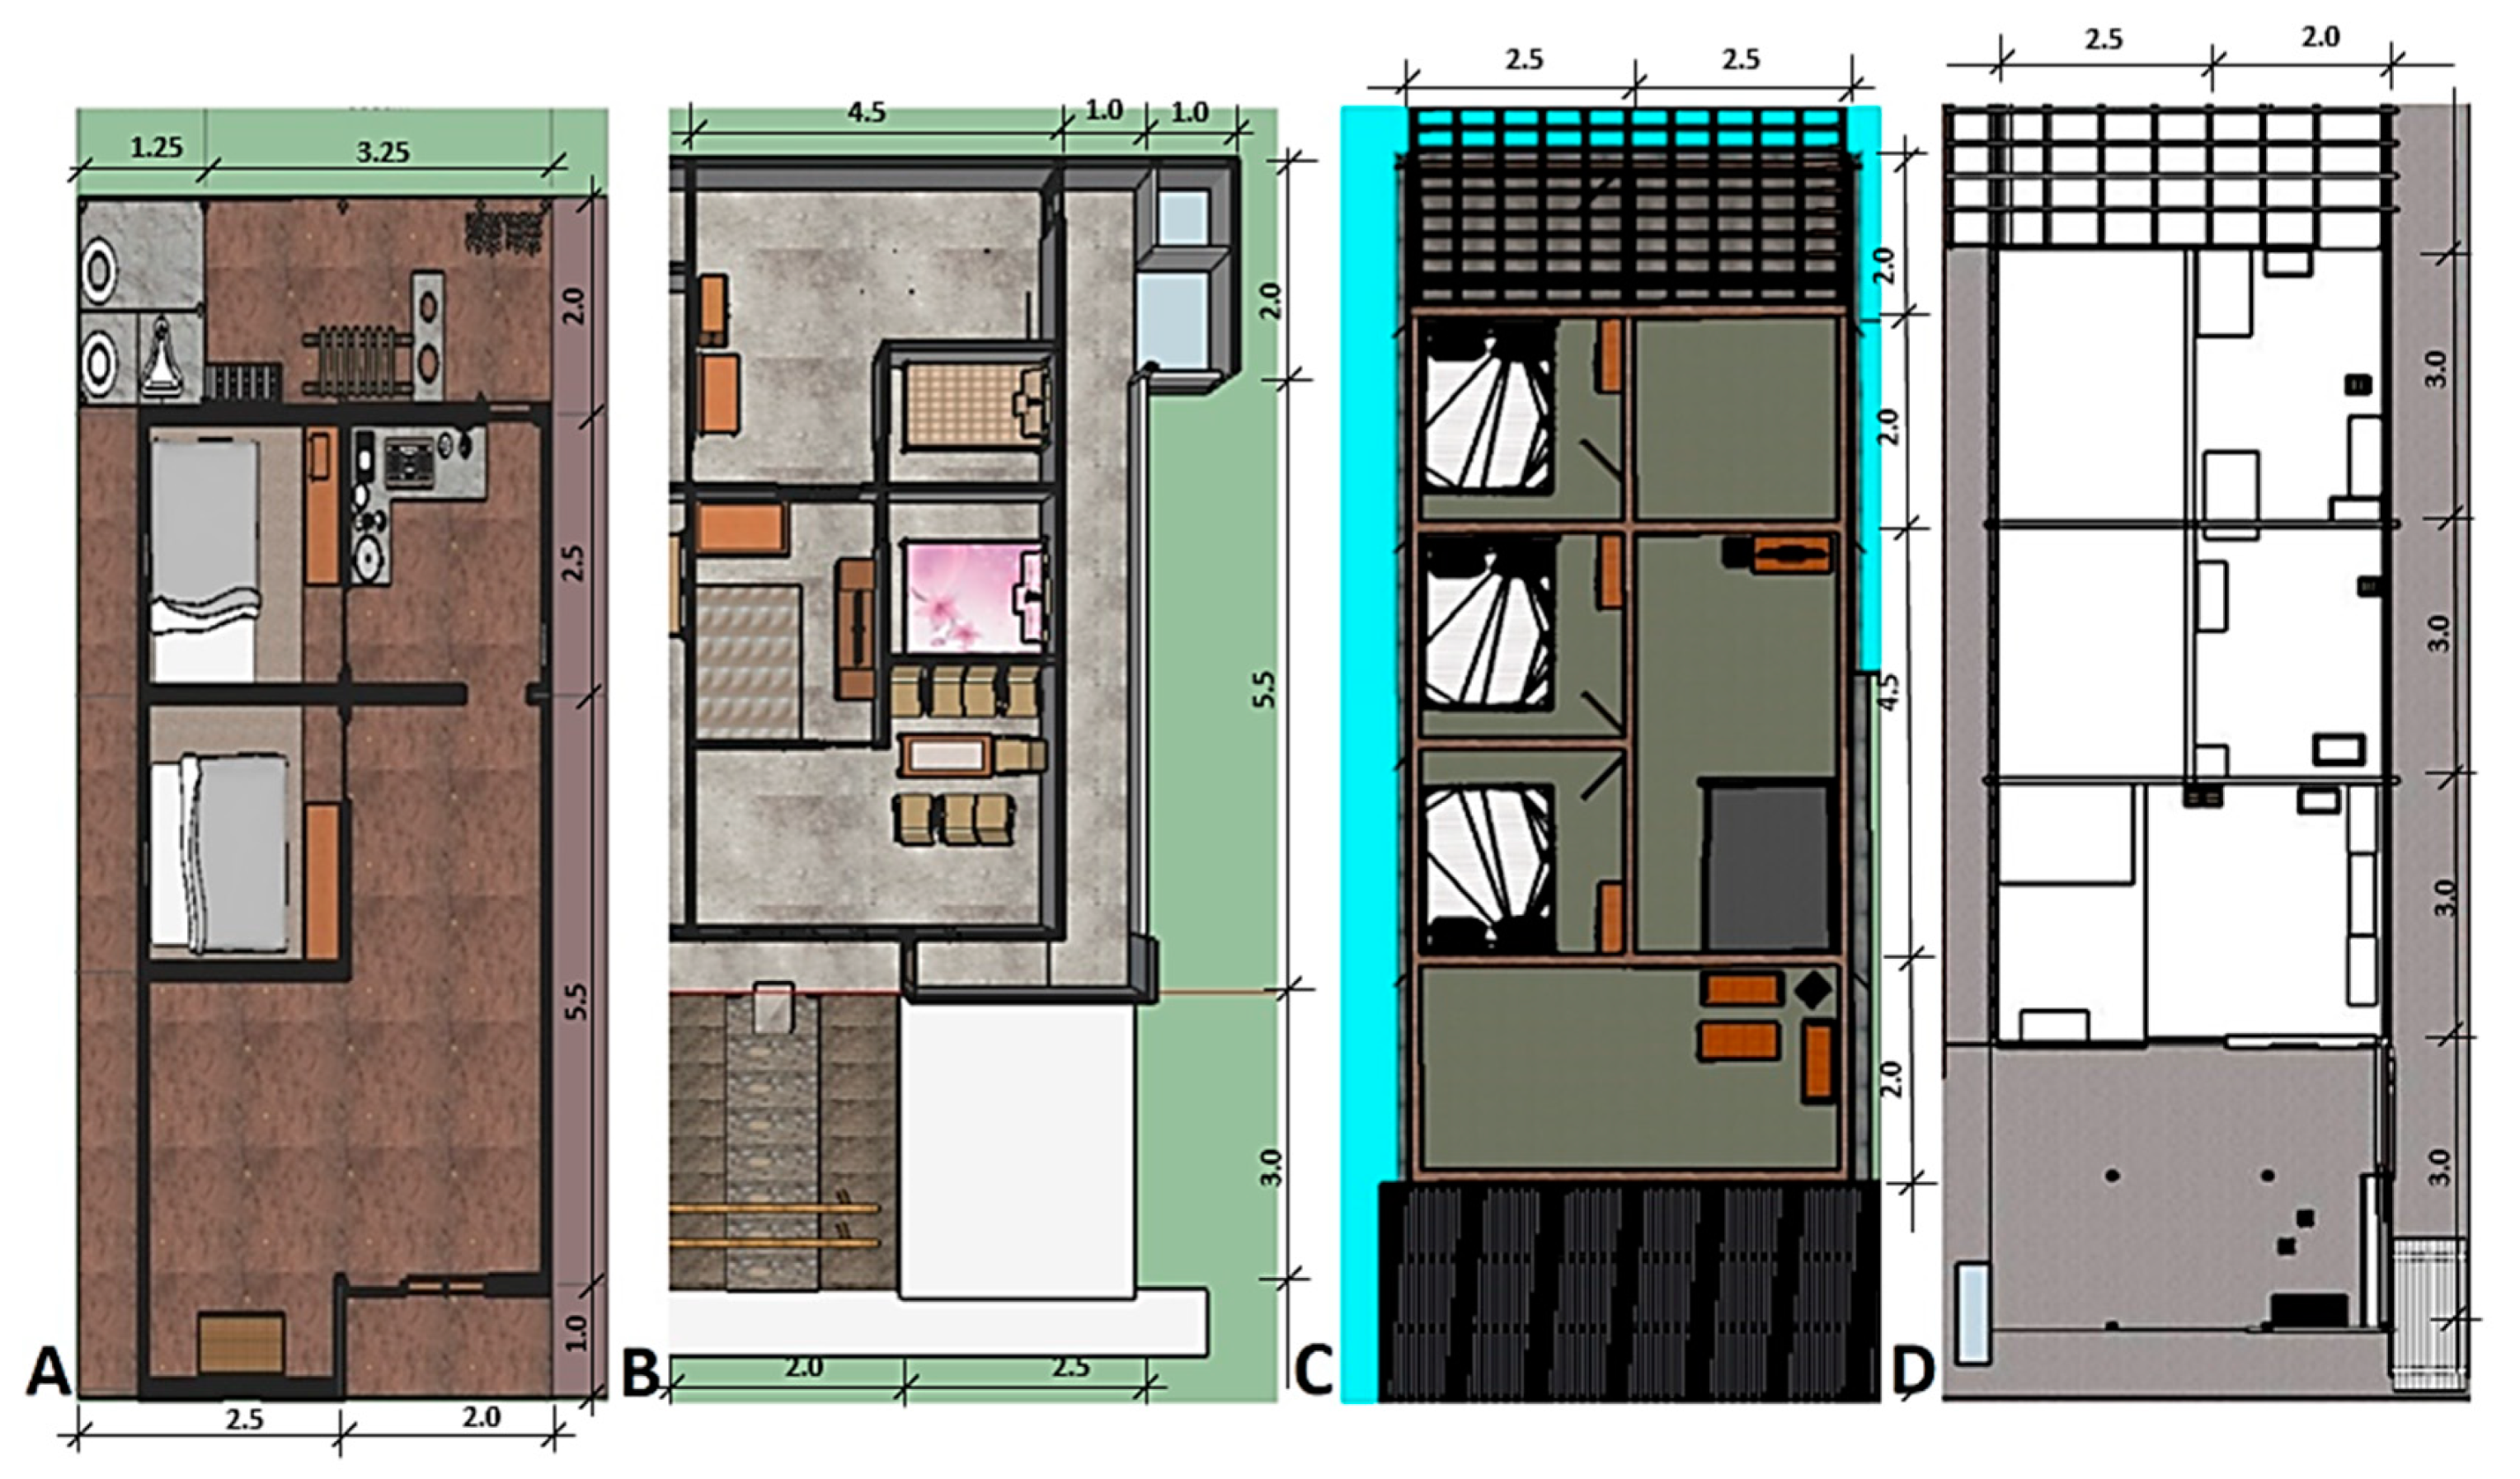
The sample houses comprising exposed stone houses and wooden houses in the mountains and exposed brick houses and wooden houses on beaches indicate a sharp difference in wall materials (Figure 2 and Figure 3). Locations with different elevations lead to further treatment towards the houses. A typical characteristic of vernacular houses in the mountains is seen from exposed stones and wood materials. In contrast, that of vernacular houses on beaches is indicated by their exposed bricks and wood materials. There is a difference in the tendency of treatment of house terraces in mountain and beach locations. In mountain locations, the house terraces were not designed for activities. The activity of having chitchat was performed in a kitchen together with the movement of warming the body.
Meanwhile, in a beach location, the house terraces were designed for such activities as having chitchat and relaxing. The room division of the houses in mountain and beach locations is not far different. The rooms were divided based on the inhabitants’ needs and financial capability. The difference in room division is found in the front room. The front room in mountain houses was more prominent than in beach houses since it stores the crops. The crops are not placed on a terrace due to the cold outdoor air temperature, which causes difficulties in processing the produce.
A sufficiently different air temperature condition of mountain and beach locations leads to various inhabitants’ treatment towards the house ventilation. In mountain locations, ventilation was provided but infrequently accomplished by natural means (e.g., opening a window) due to the cold temperature. Meanwhile, ventilation plays an essential role in providing fresh air to a room in a beach location. In wooden houses on beaches, several windows are closed due to an attempt to elevate the homes. To provide ventilation, several roof tiles are removed. The interaction between the individual aspects that affect thermal comfort proved to be significant in the work of Rijal et al. [34] and Rijal et al. [35], where it was shown that the behavior when opening windows is related to indoor and outdoor air temperature.

3. Results and Discussion

Building envelopes are essential to creating thermal comfort, especially adaptive thermal comfort [38]. The building envelopes, which are characterized by local architecture, have been a factor determining the creation of thermal comfort. This fact is in line with a study on exposed houses in mountain areas [39]. On beaches, roofs of vernacular houses, exposed brick, and wooden houses are constructed using clay roof tiles. The clay roof tiles are considered to be able to prevent heat transfer. Meanwhile, roofs of vernacular dwellings in the mountains are made of zinc since it is a highly heat absorbing material. In some houses, the roofs were painted black, as it is believed to create heat.
Vernacular houses in the mountains have either exposed stone walls or wooden walls, while vernacular houses on beaches have either exposed brick walls or wooden walls. Both exposed stone walls and exposed brick walls are believed to be able to maintain a cool temperature. Wood has been a material for vernacular houses in mountains and beaches since it adapts to the local climate. The wood will create heat in a cold environment while keeping the house cool in a hot environment. Either clay or lean concrete is used as the flooring material due to economic reasons.

3.1. The Comparison of Outdoor and Indoor Temperatures

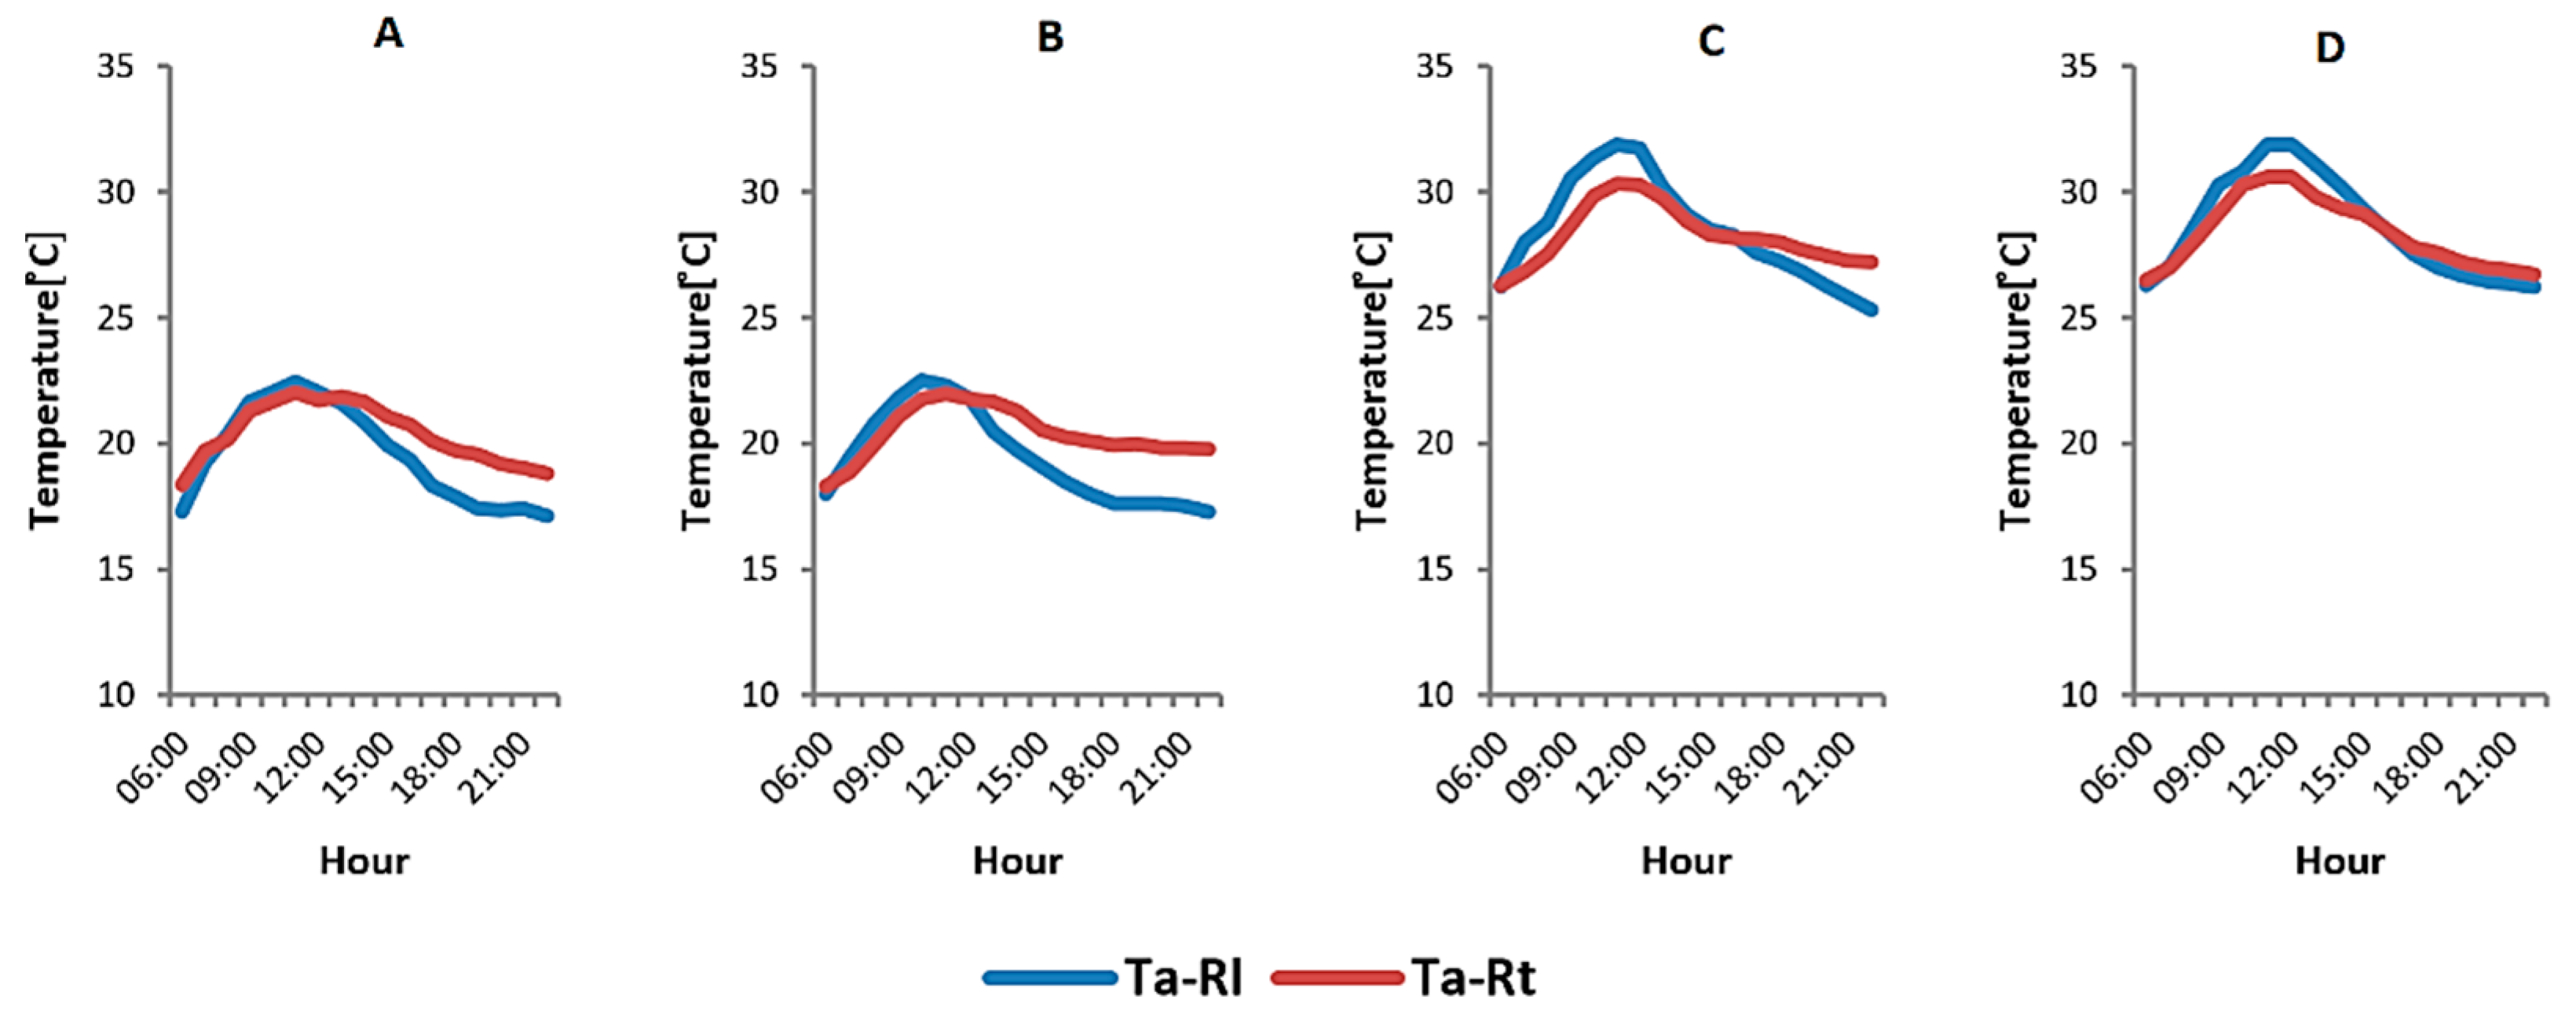
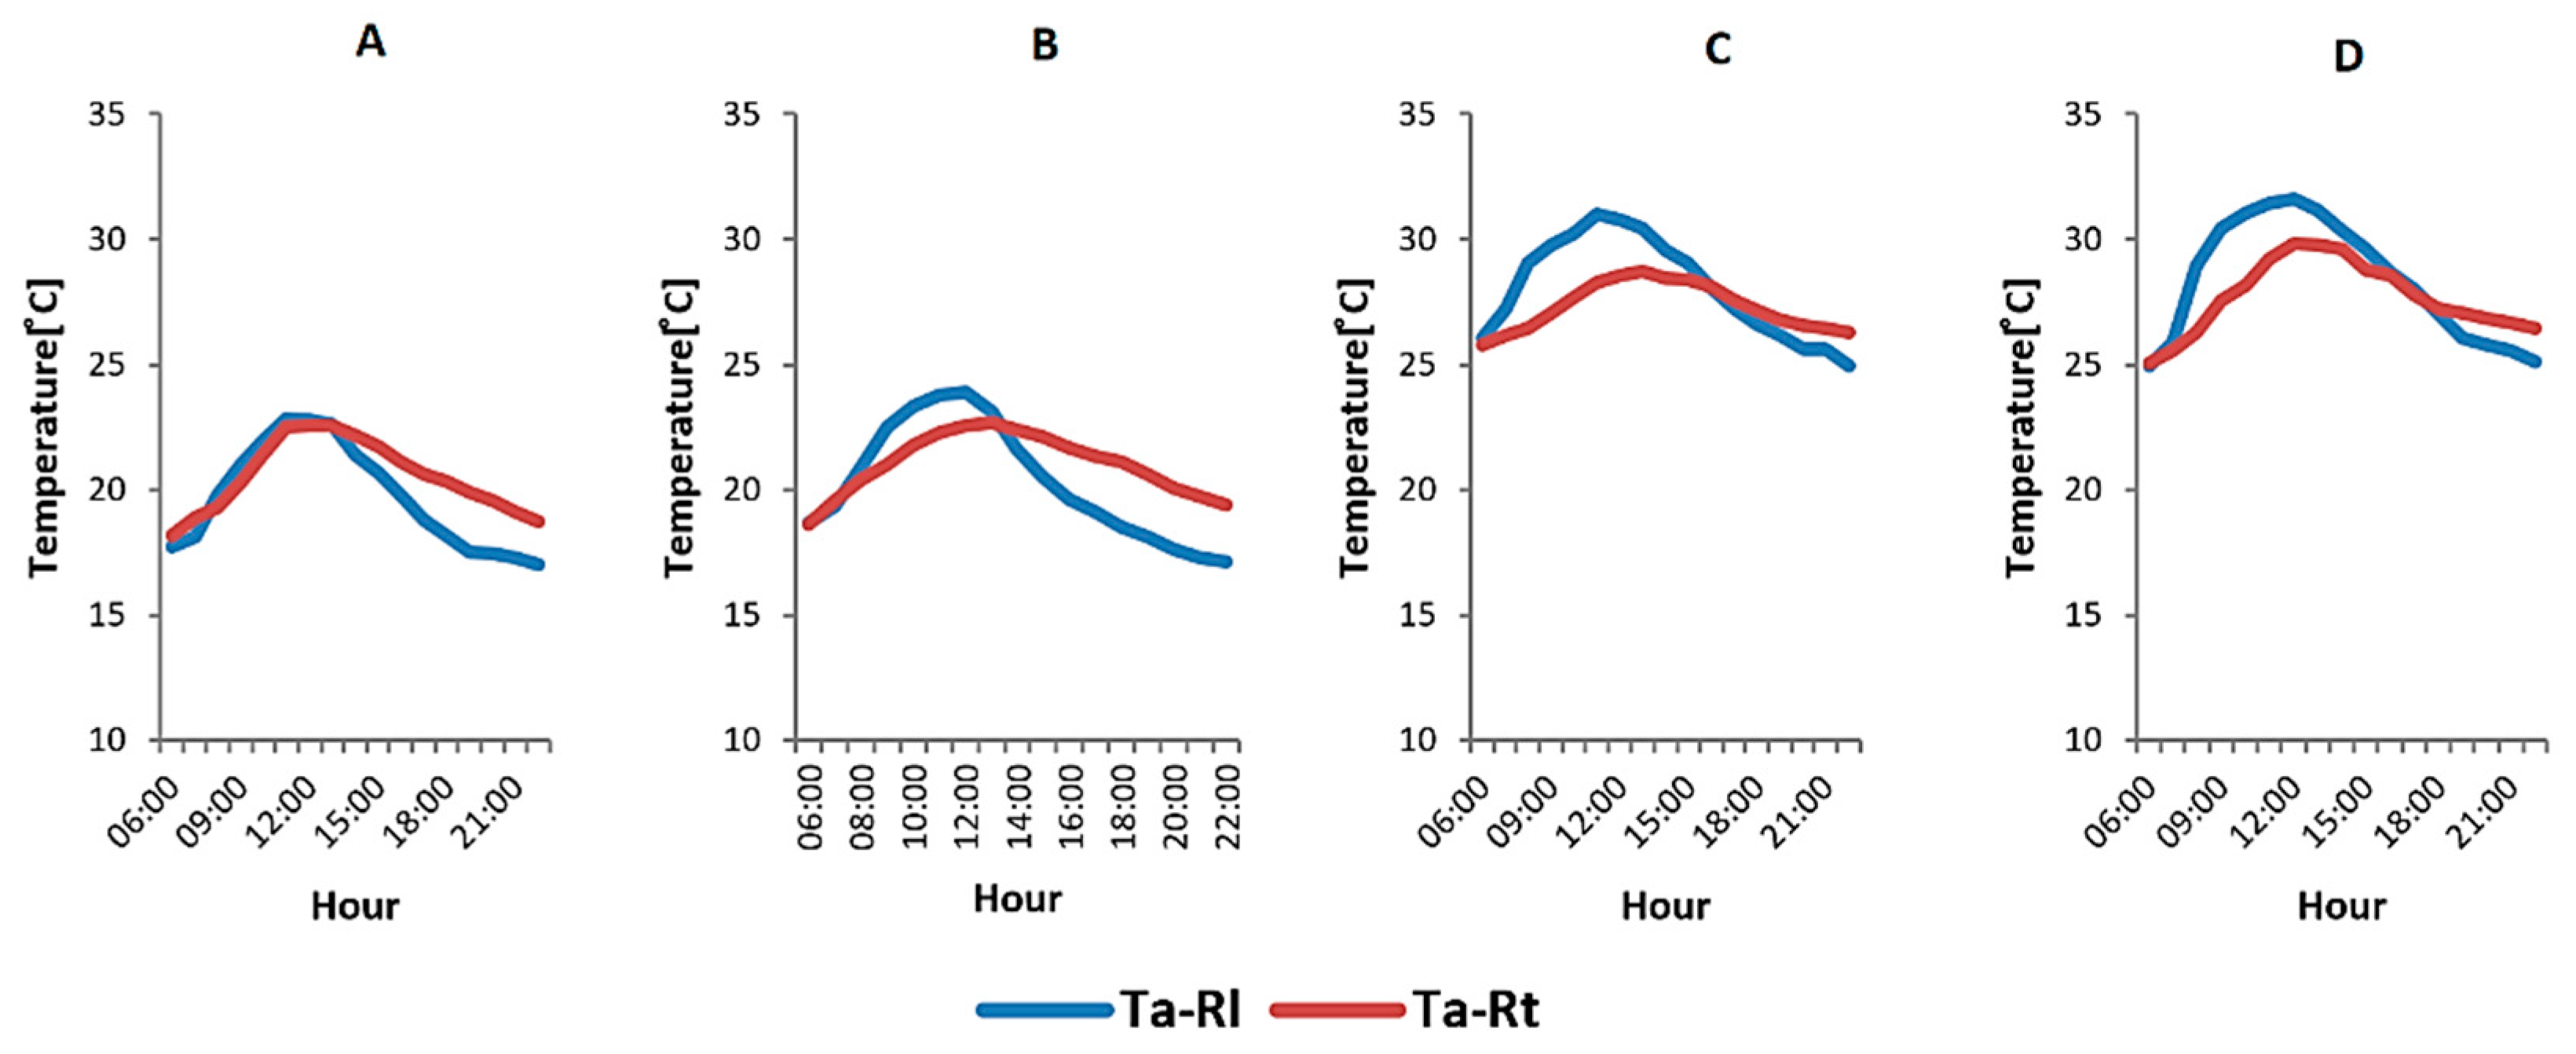
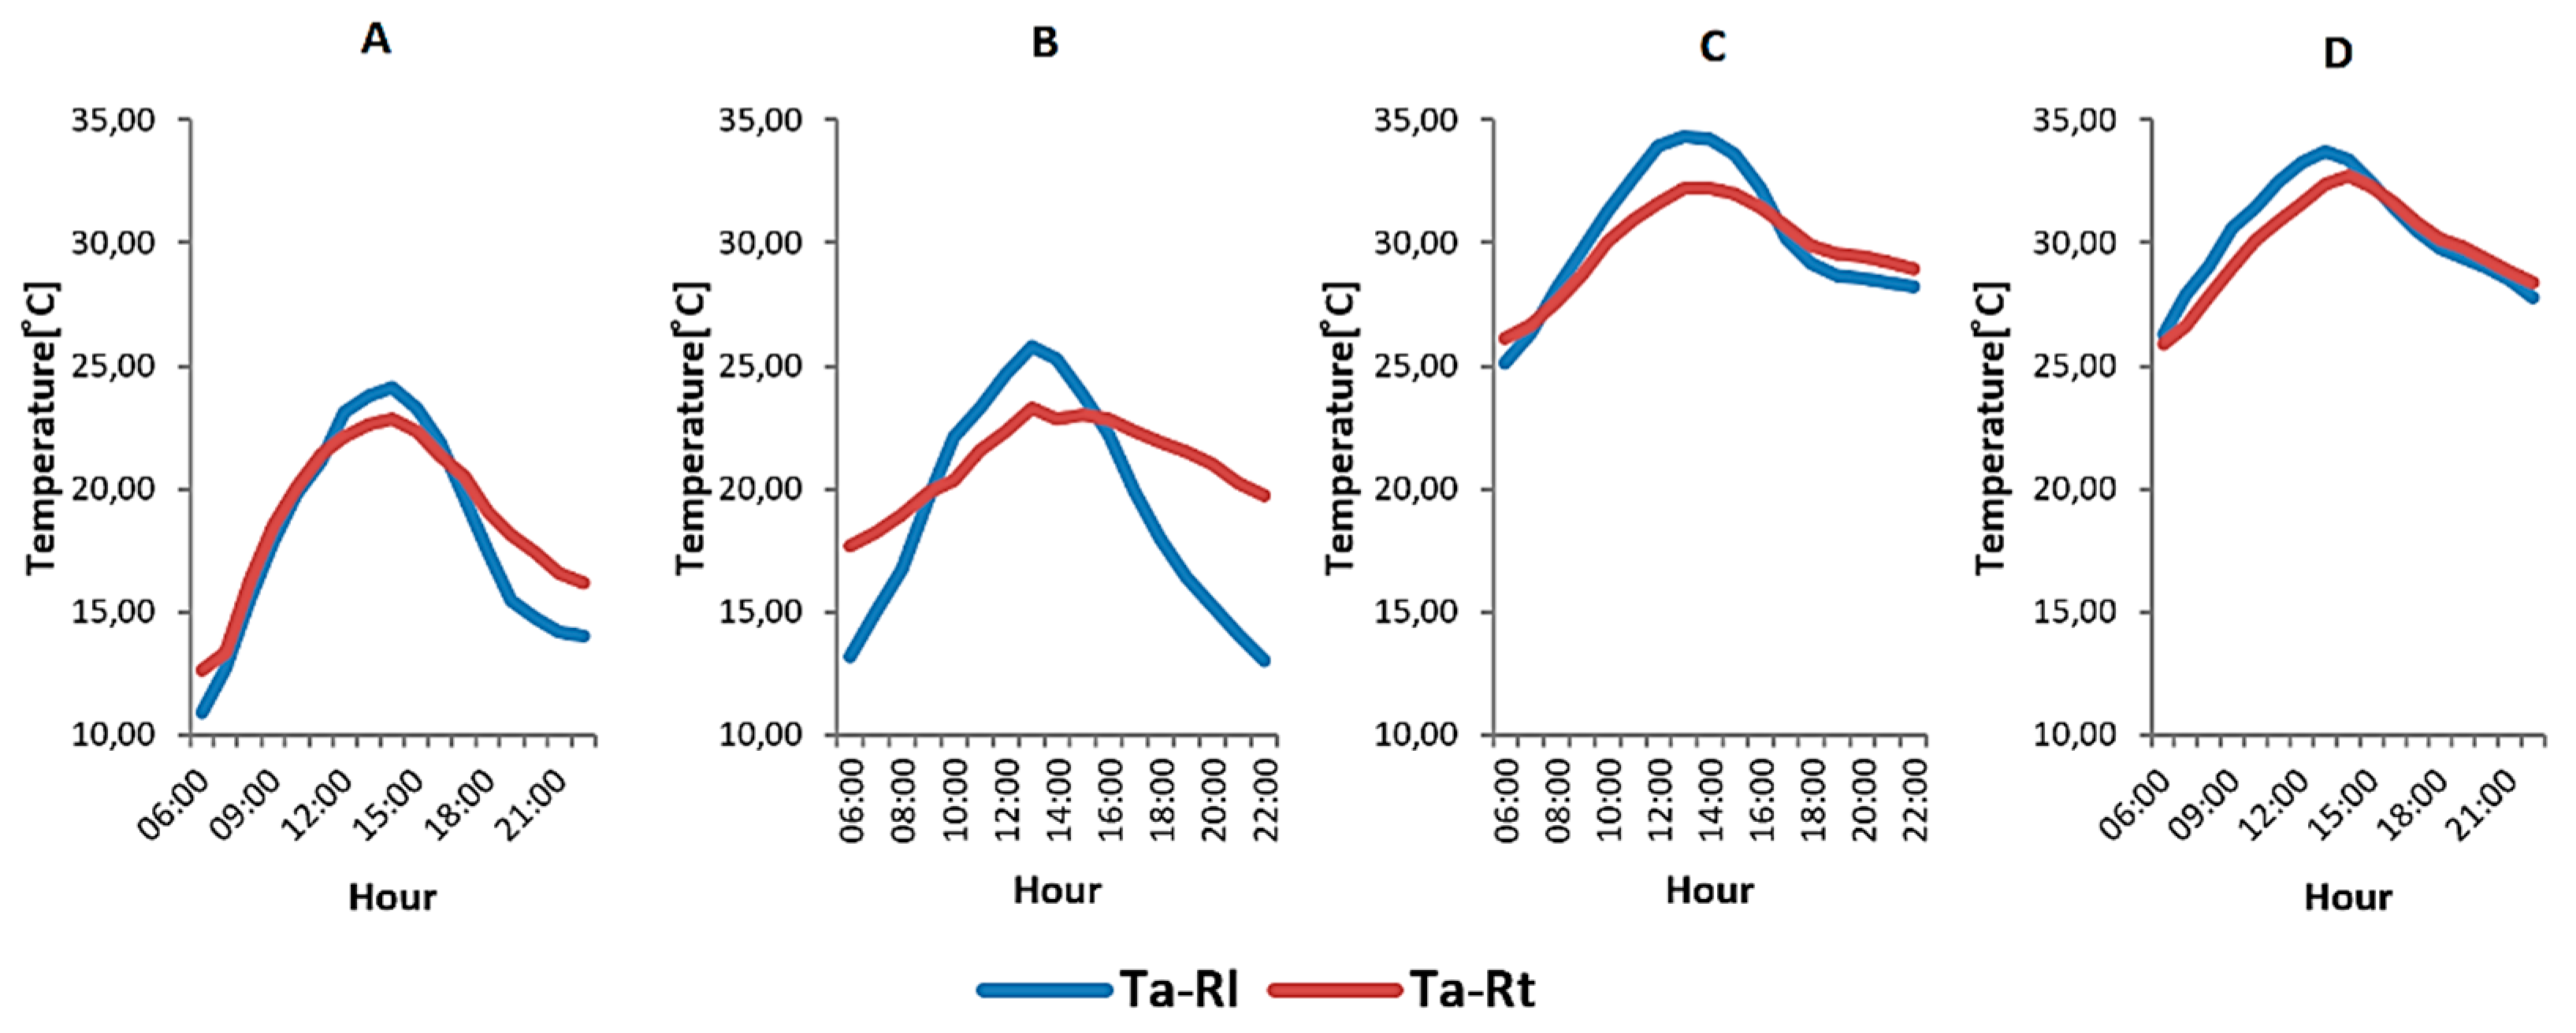
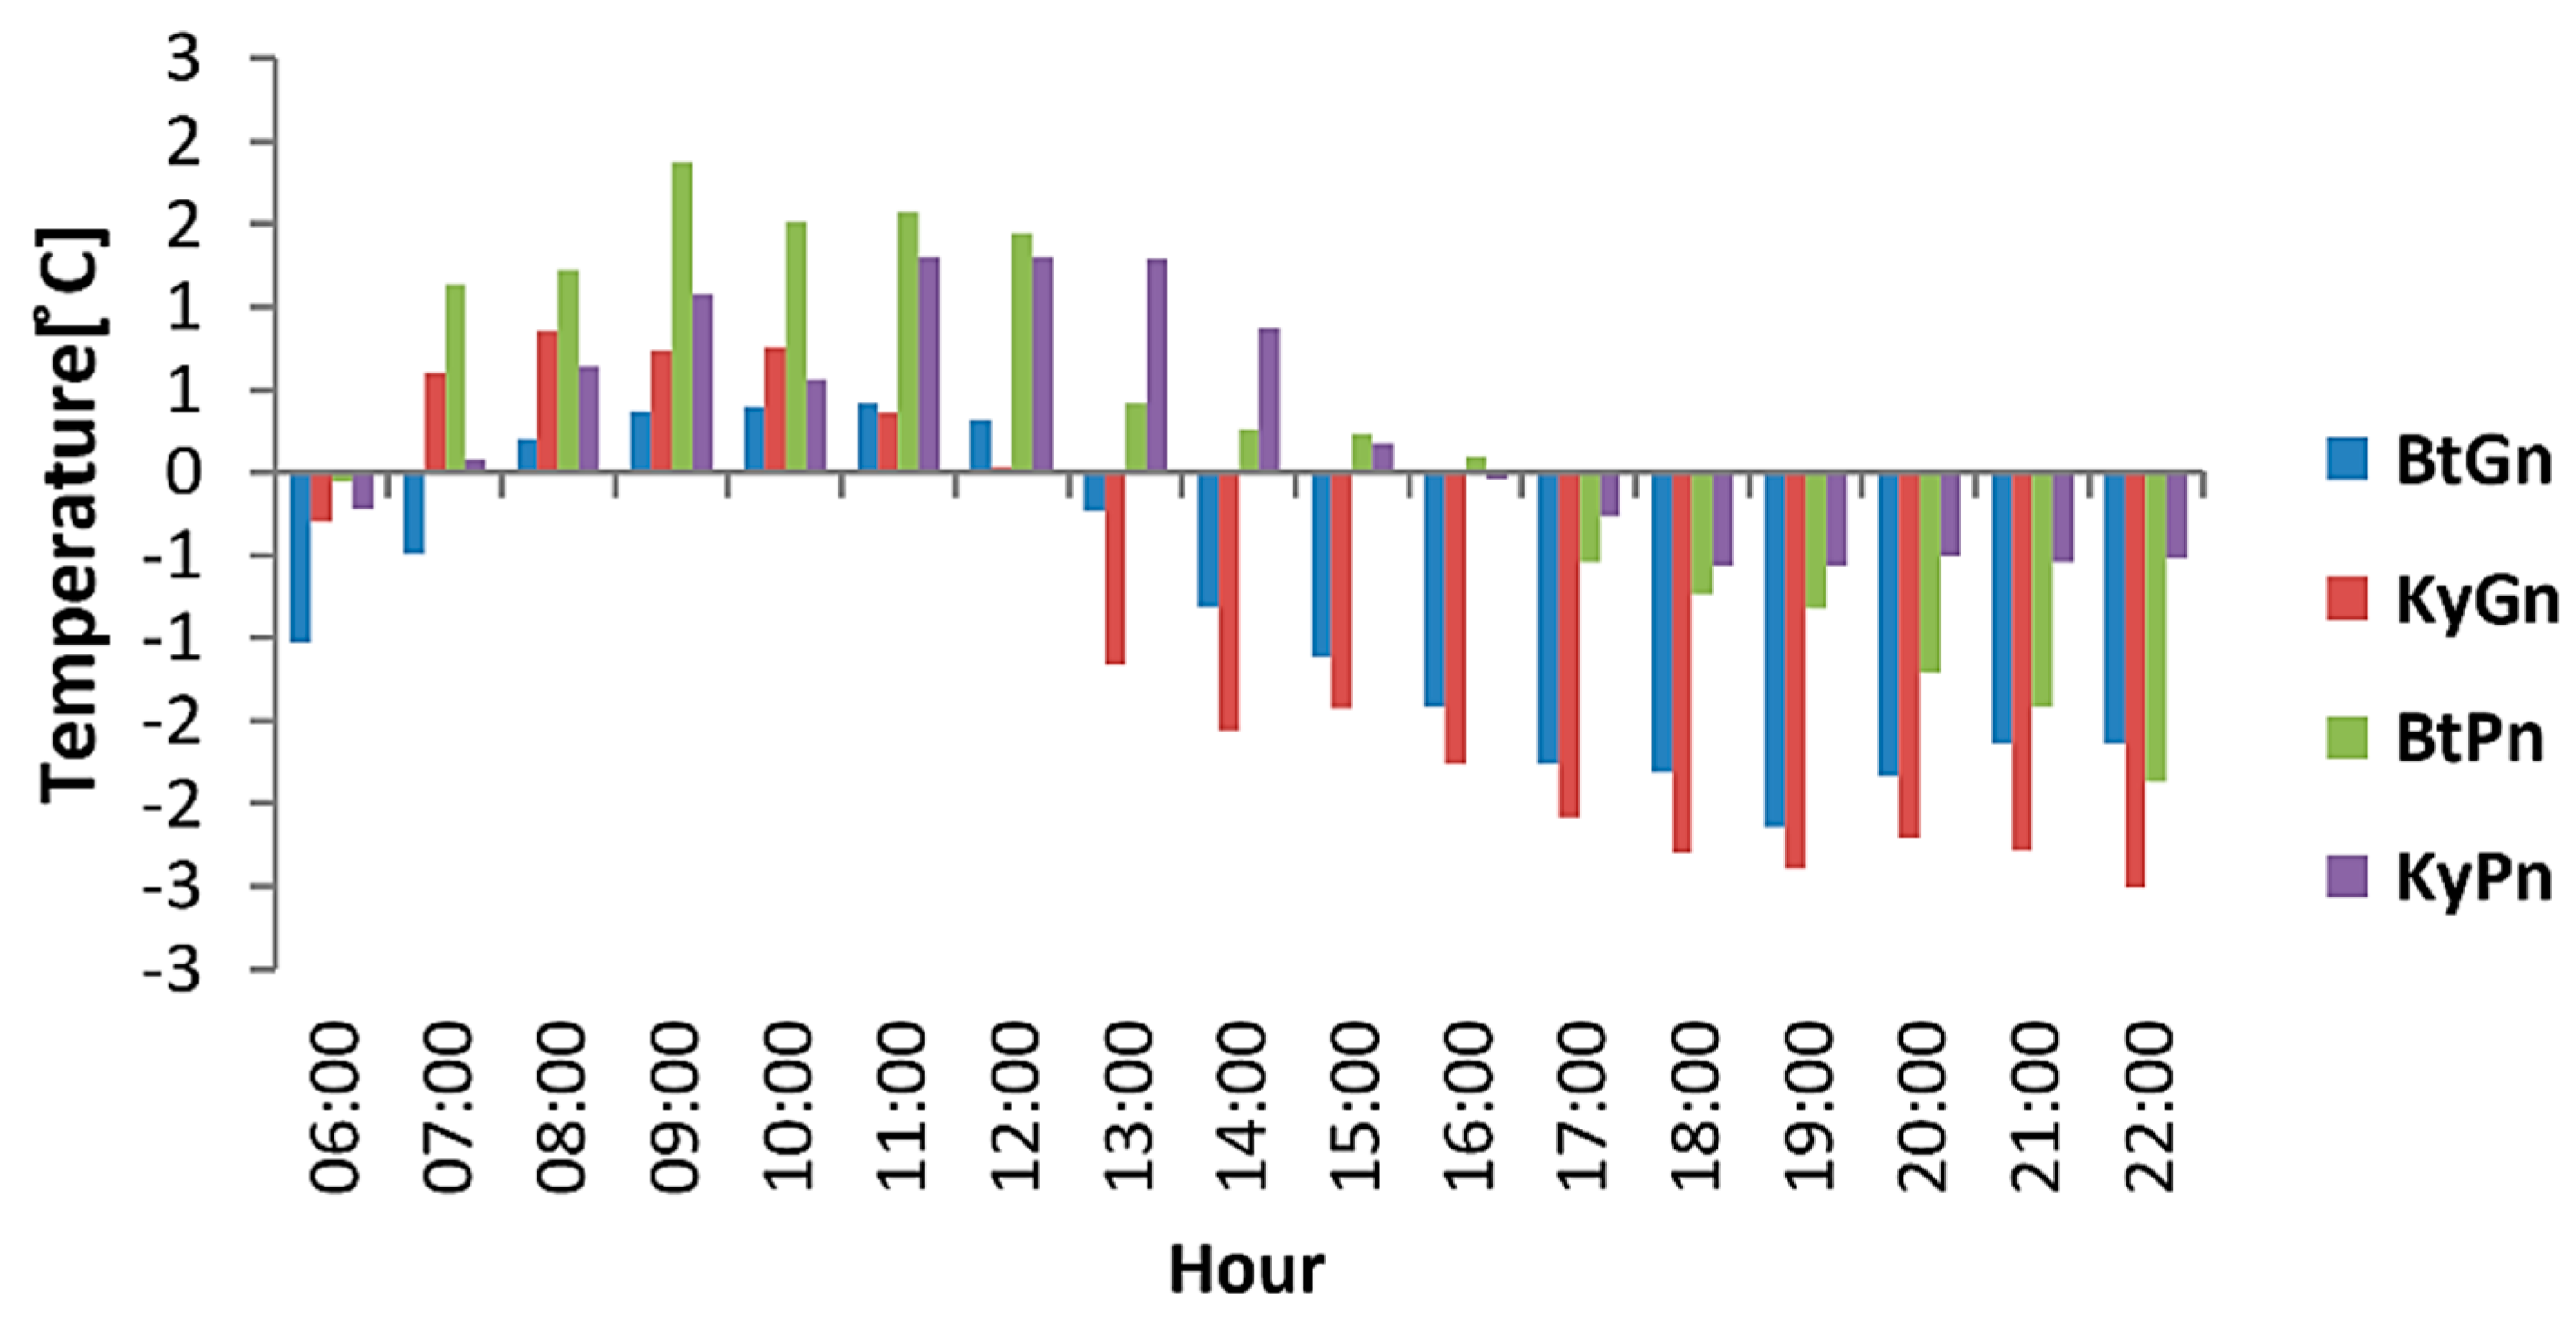
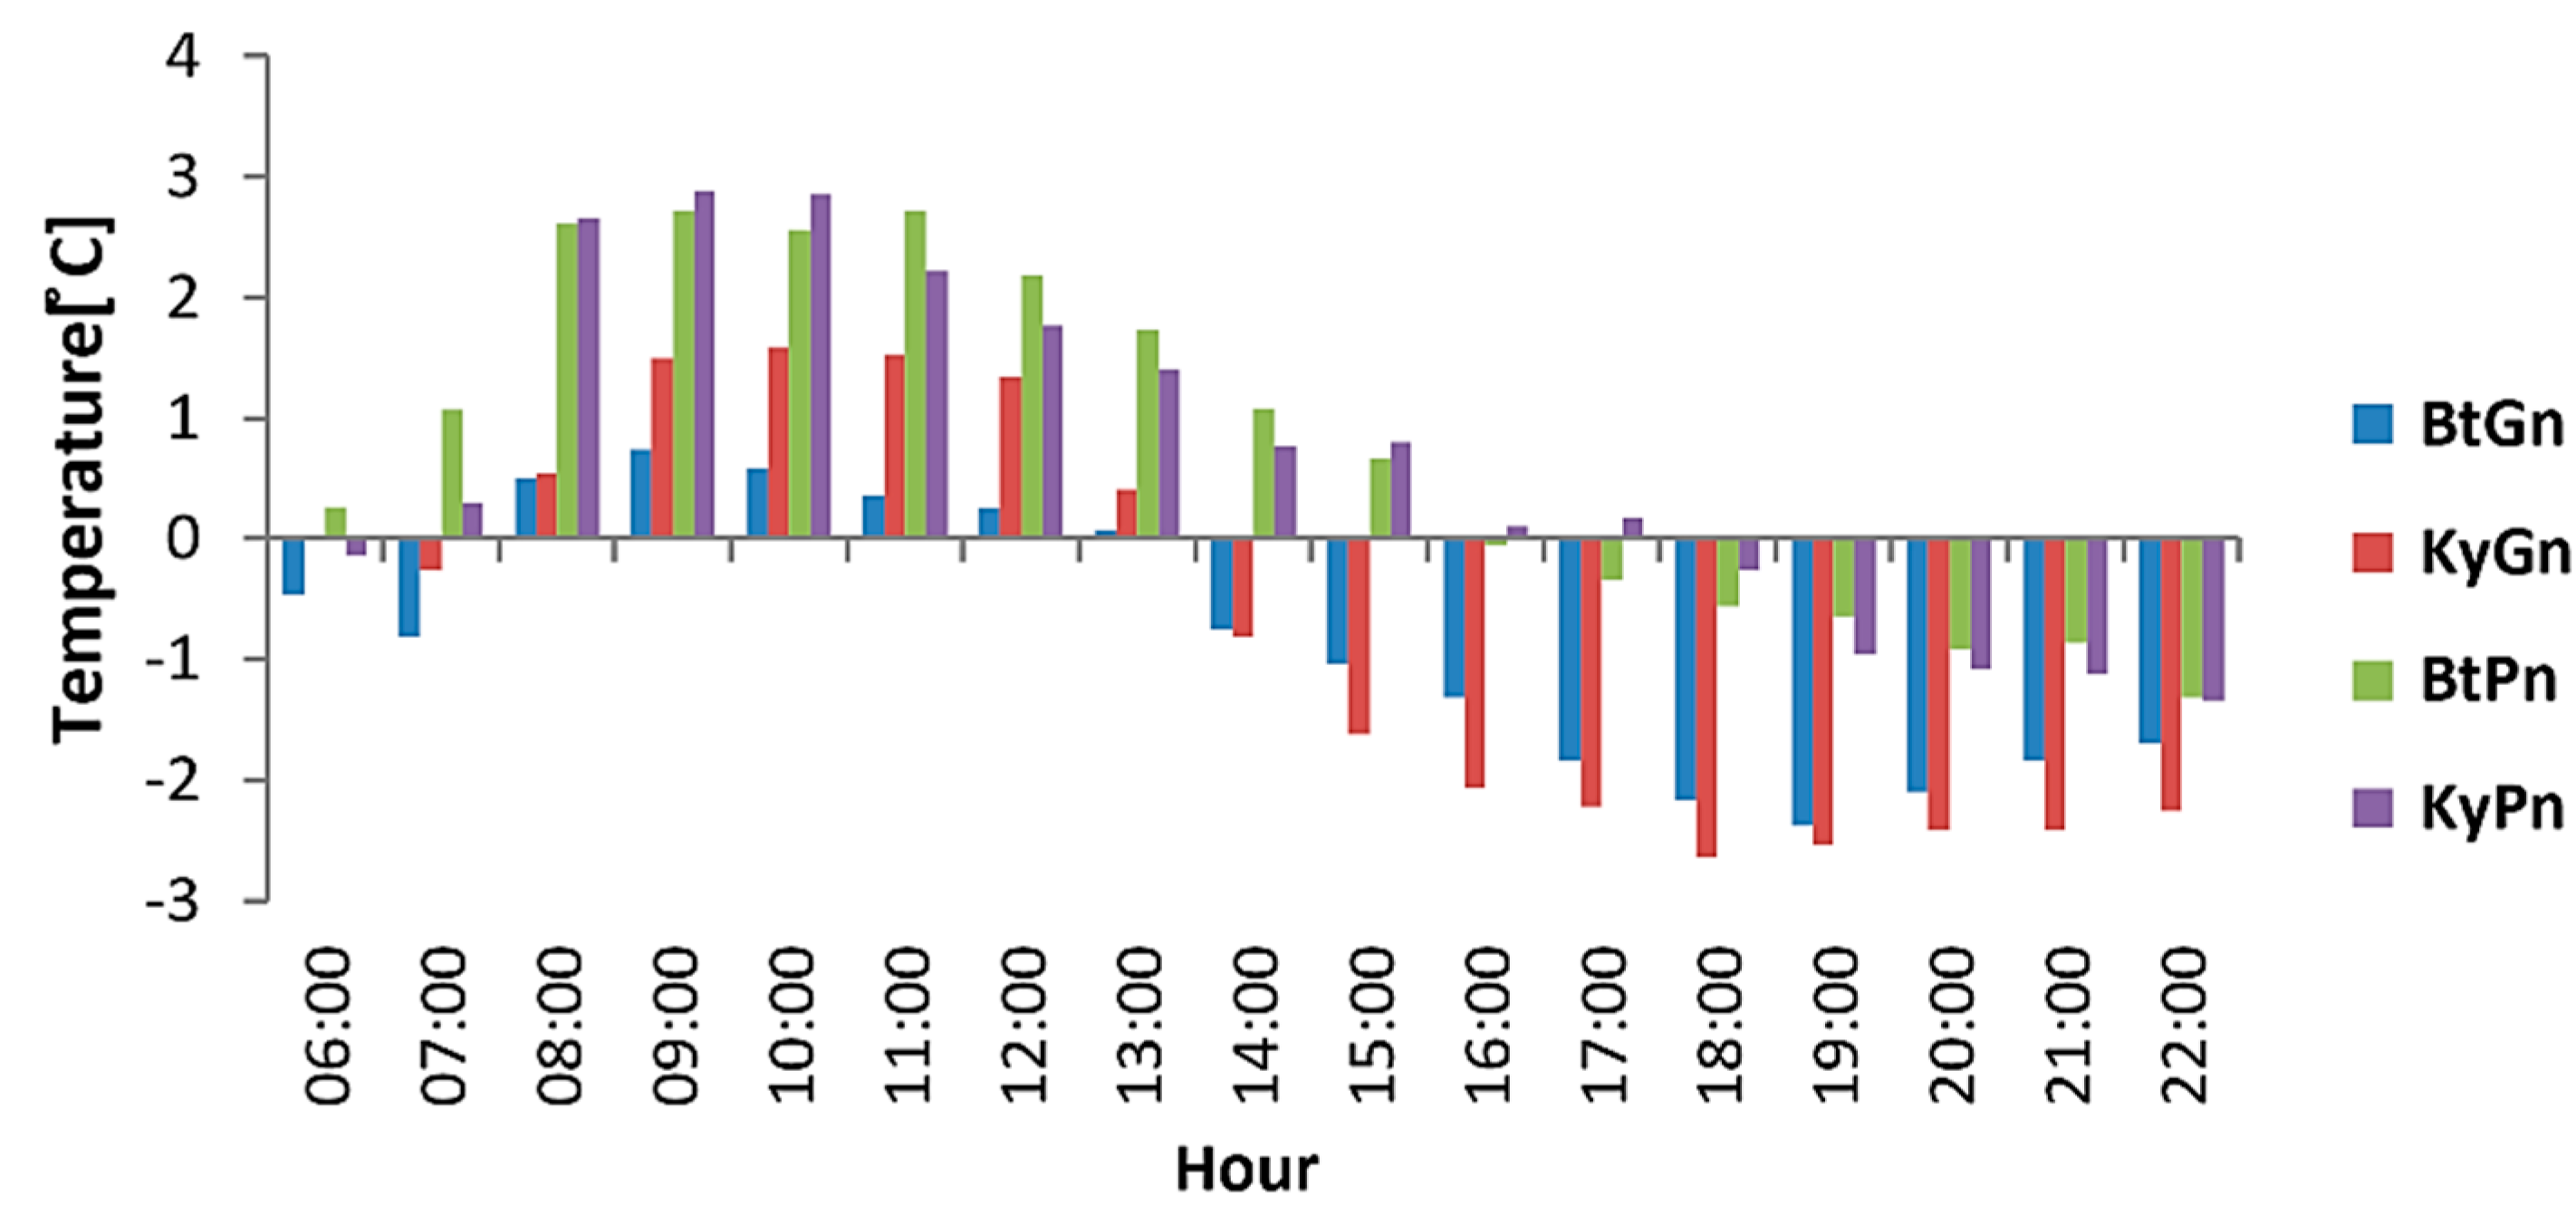
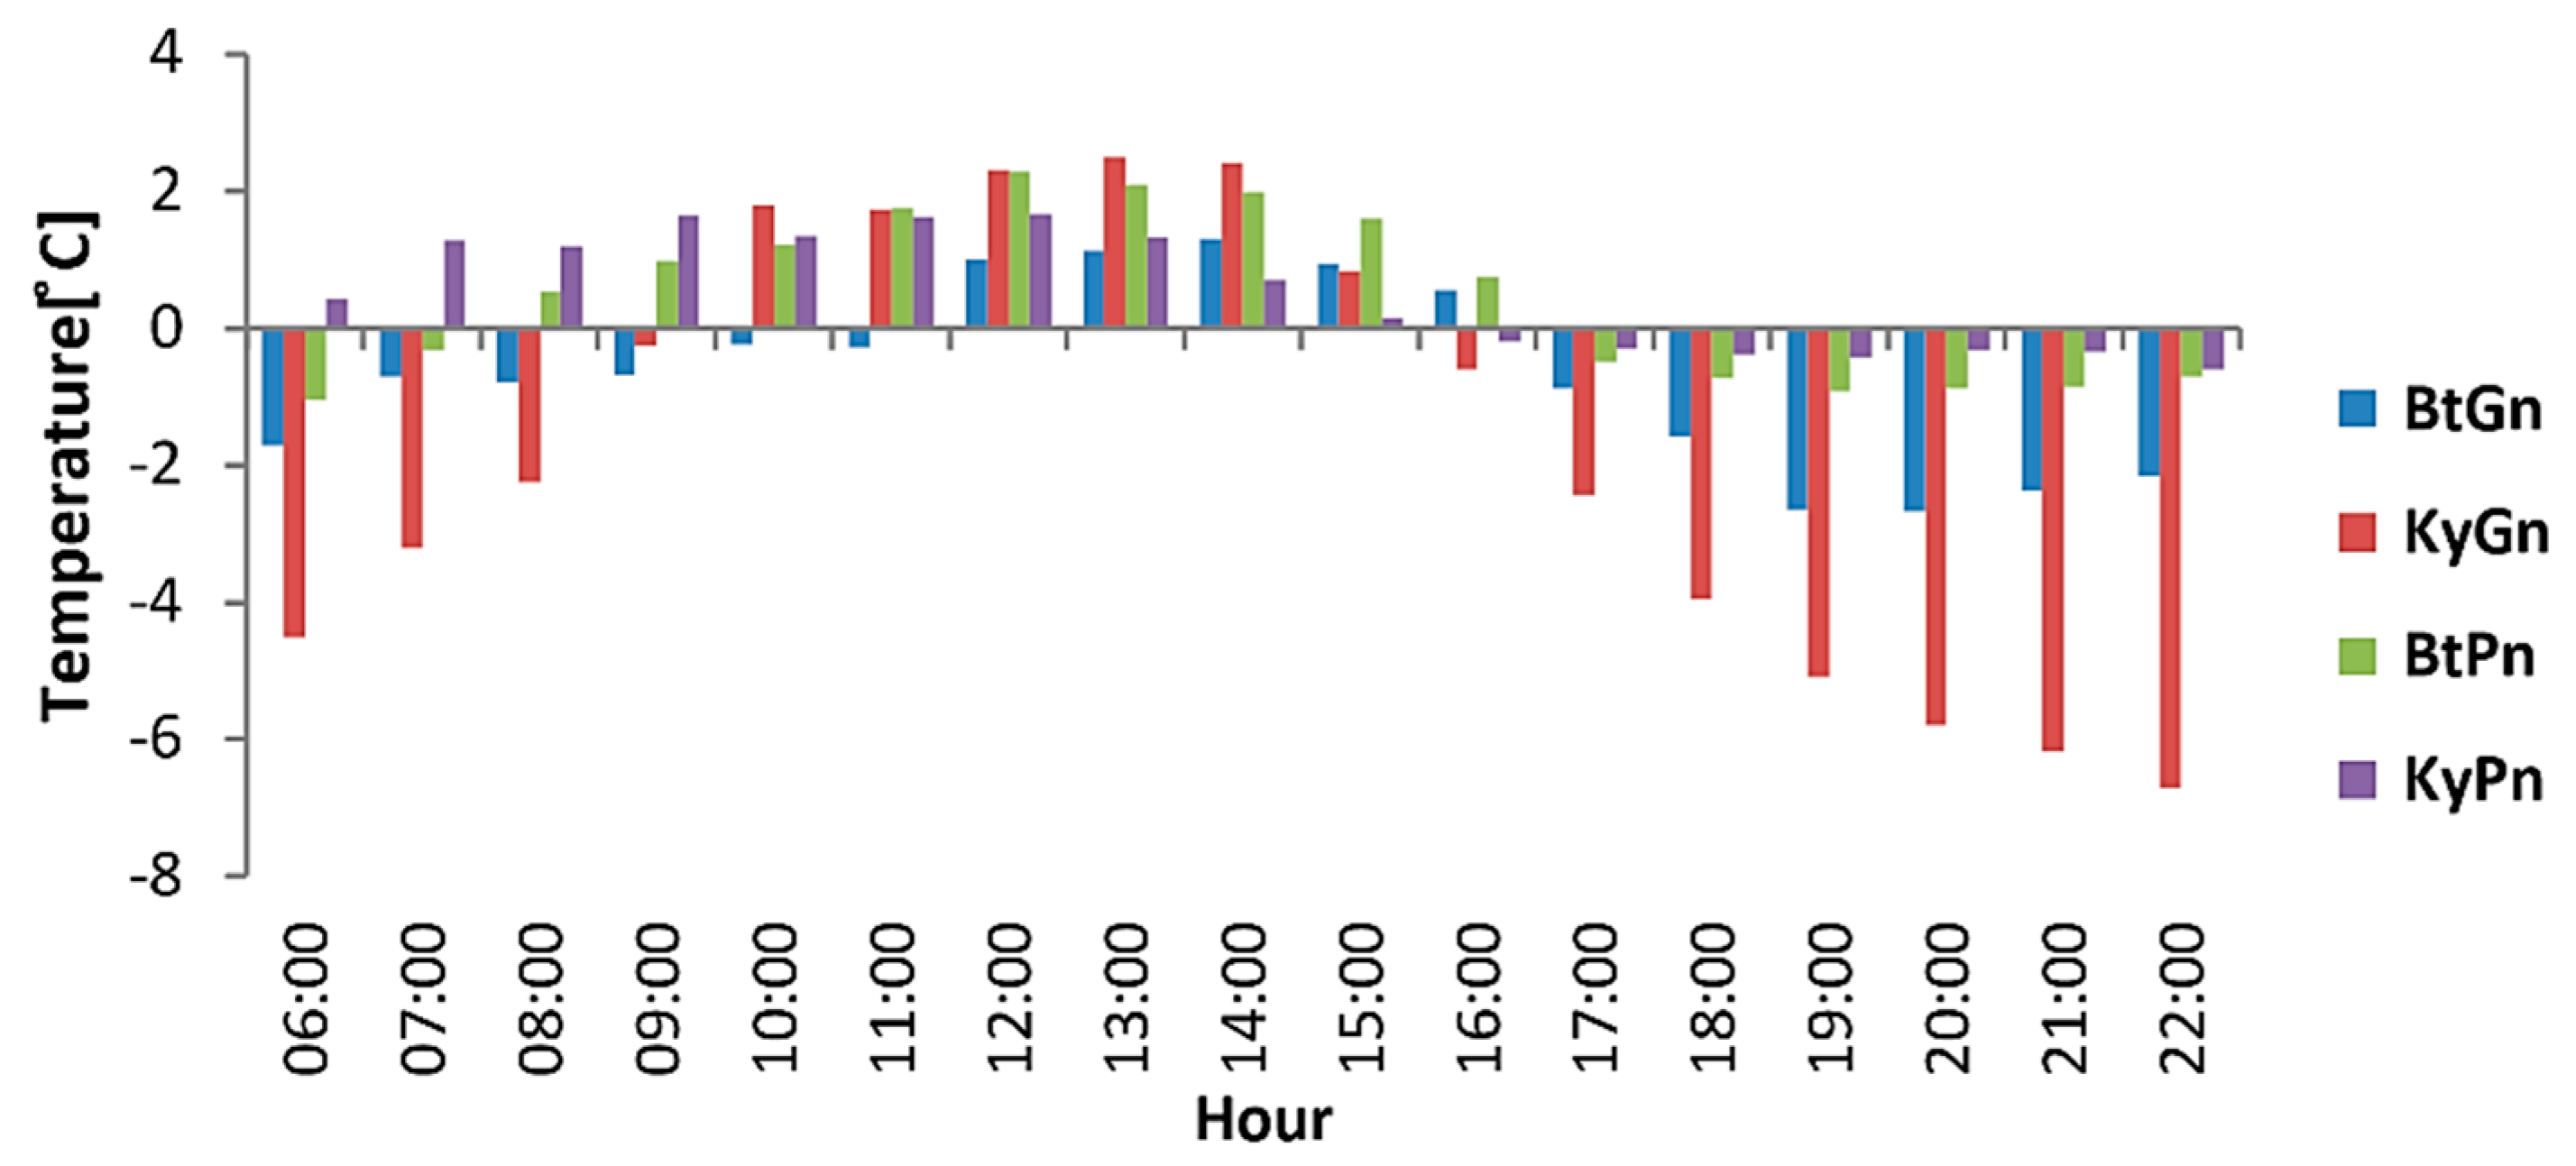
Air temperature is a factor influencing thermal comfort. Building performance is seen from how well the building can keep the rooms either cool (by maintaining a lower temperature than the outdoor temperature) or warm (by maintaining a higher temperature than the outdoor temperature). The comparison of outdoor and indoor temperatures can benchmark thermal performance to create thermal comfort (Figure 4, Figure 5, Figure 6, Figure 7, Figure 8 and Figure 9). The present study compares outdoor and indoor air temperatures by taking the difference of both temperatures into account.
During the transitional season from dry to wet seasons in exposed stone houses in the mountains, the healing process starts between 6:00 and 08:00. Meanwhile, the cooling process occurs between 8:00 and 13:00, and then the heating process reoccurs between 13:00 and 22:00. Therefore, the heating process takes 11 h in total, while the cooling process requires 5 h. In wooden houses in the mountains, the cooling process occurs between 06:00 and 12:00, while the heating process occurs between 12:00 and 22:00. Therefore, the cooling process takes 6 h in total, while the heating process requires 10 h.
On the contrary to houses in the mountains, homes on beaches have a sufficiently high temperature. In exposed brick houses on beaches, the cooling process occurs between 6:00 and 16:00, while the heating process occurs between 16:00 and 22:00. Therefore, the duration of the heating process is 10 h, while the period of the cooling process is 6 h. In wooden houses on beaches, the heating process occurs between 6:00 and 07:00 with the duration of 1 h, while the cooling process occurs between 7:00 and 15:00 with the period of 8 h. Afterward, the heating process reoccurs between 15:00 and 22:00 for 7 h. Therefore, both heating and cooling processes take 8 h. The heating process in mountain houses is required, and thus houses with more heating indicate better thermal performance provided that the maximum temperature does not exceed a comfortable temperature threshold. Exposed stone houses in the mountains have more heating processes than wooden houses in the hills. In beach locations, the cooling process indicates better thermal performance. Most cooling processes occur in wooden houses (8 h).
In the wet season, the heating process in stone houses in the mountains occurs in two stages: at 06:00–07:00 and 13:00–22:00, while the cooling process takes place at 7:00–13:00. The heating process takes 9 h, while the cooling process requires 7 h. In wooden houses in the mountains, the heating process occurs at 7:00–08:00 and 13:00–22:00, and the cooling process occurs at 6:00–07:00 and 8:00–13:00. The heating process takes 9 h, while the cooling process requires 7 h. The calculation results of both heating and cooling processes reveal that exposed stone houses and wooden houses in the mountains share similar thermal performance in heating the rooms (for 9 h). Exposed brick houses on beaches are seen to cool the rooms with a duration of 9 h starting from 06:00 to 15:00. At 15:00–22:00, the houses warm the rooms for 7 h. In wooden houses on beaches, the cooling process occurs between 7:00 and 17:00 Western Indonesian Time. The heating process occurs between 6:00–7:00 and between 17:00 and 22:00. The cooling process in the houses requires 10 h, while the heating process takes 6 h in total. The thermal performance of wooden houses on beaches is better than that of exposed brick houses on beaches in terms of the duration of the cooling process duration.
The transitional season from wet to dry seasons seems to be different from the previous season. The heating process in exposed stone houses in the mountains starts between 06:00 and 11:00 and 17:00 and 22:00, while the cooling process starts between 11:00 and 17:00 Western Indonesian Time. The heating process in exposed stone houses in the mountains requires 10 h, while the cooling process requires 6 h. There are two stages of the heating process in wooden huts in the hills: between 6:00 and 09:00 and 16:00 and 22:00. The cooling process is seen between 9:00 and 16:00. The heating process takes 9 h in total, while the cooling process requires 7 h in total.
Regarding the total hours of the heating process, exposed stone houses in the mountains are revealed to warm the indoor rooms longer than wooden houses on the hill. However, a longer duration of the heating is found in wooden huts in the mountains. In exposed brick houses on beaches, the heating process occurs between 6:00 and 07:00 and 17:00 and 22:00. The heating process takes 6 h in total. The cooling process in exposed brick houses occurs between 7:00 and 17:00 (with a duration of 10 h). In wooden houses on beaches, the cooling process occurs between 6:00 and 15:00, while the heating process occurs between 15:00 and 22:00. The duration of the cooling process is 9 h, while that of the heating process is 7 h. From the cooling process, the thermal performance of exposed brick houses on beaches is better than that of wooden houses on beaches.
The study results reveal that exposed stone houses in the mountains can create warmer indoor air temperatures. However, when seen from the increase in the air temperature, wooden houses contribute to a sufficiently significant rise in air temperature by 2 °C on average. In comparison, exposed stone houses in the mountains increase the air temperature by 1 °C on average. This finding is in line with the results of the previous research conducted in two similar locations [40]. The diagrams show that both exposed brick and wooden houses have a similar capability to make the rooms cool. At one time, exposed brick houses on beaches were more able to make the rooms cool, but at another time, wooden houses on beaches were more able to cool the rooms. The average decrease in air temperature in both exposed brick and wooden cabins on beaches was 1.5 °C.

3.2. Adaptive Thermal Comfort

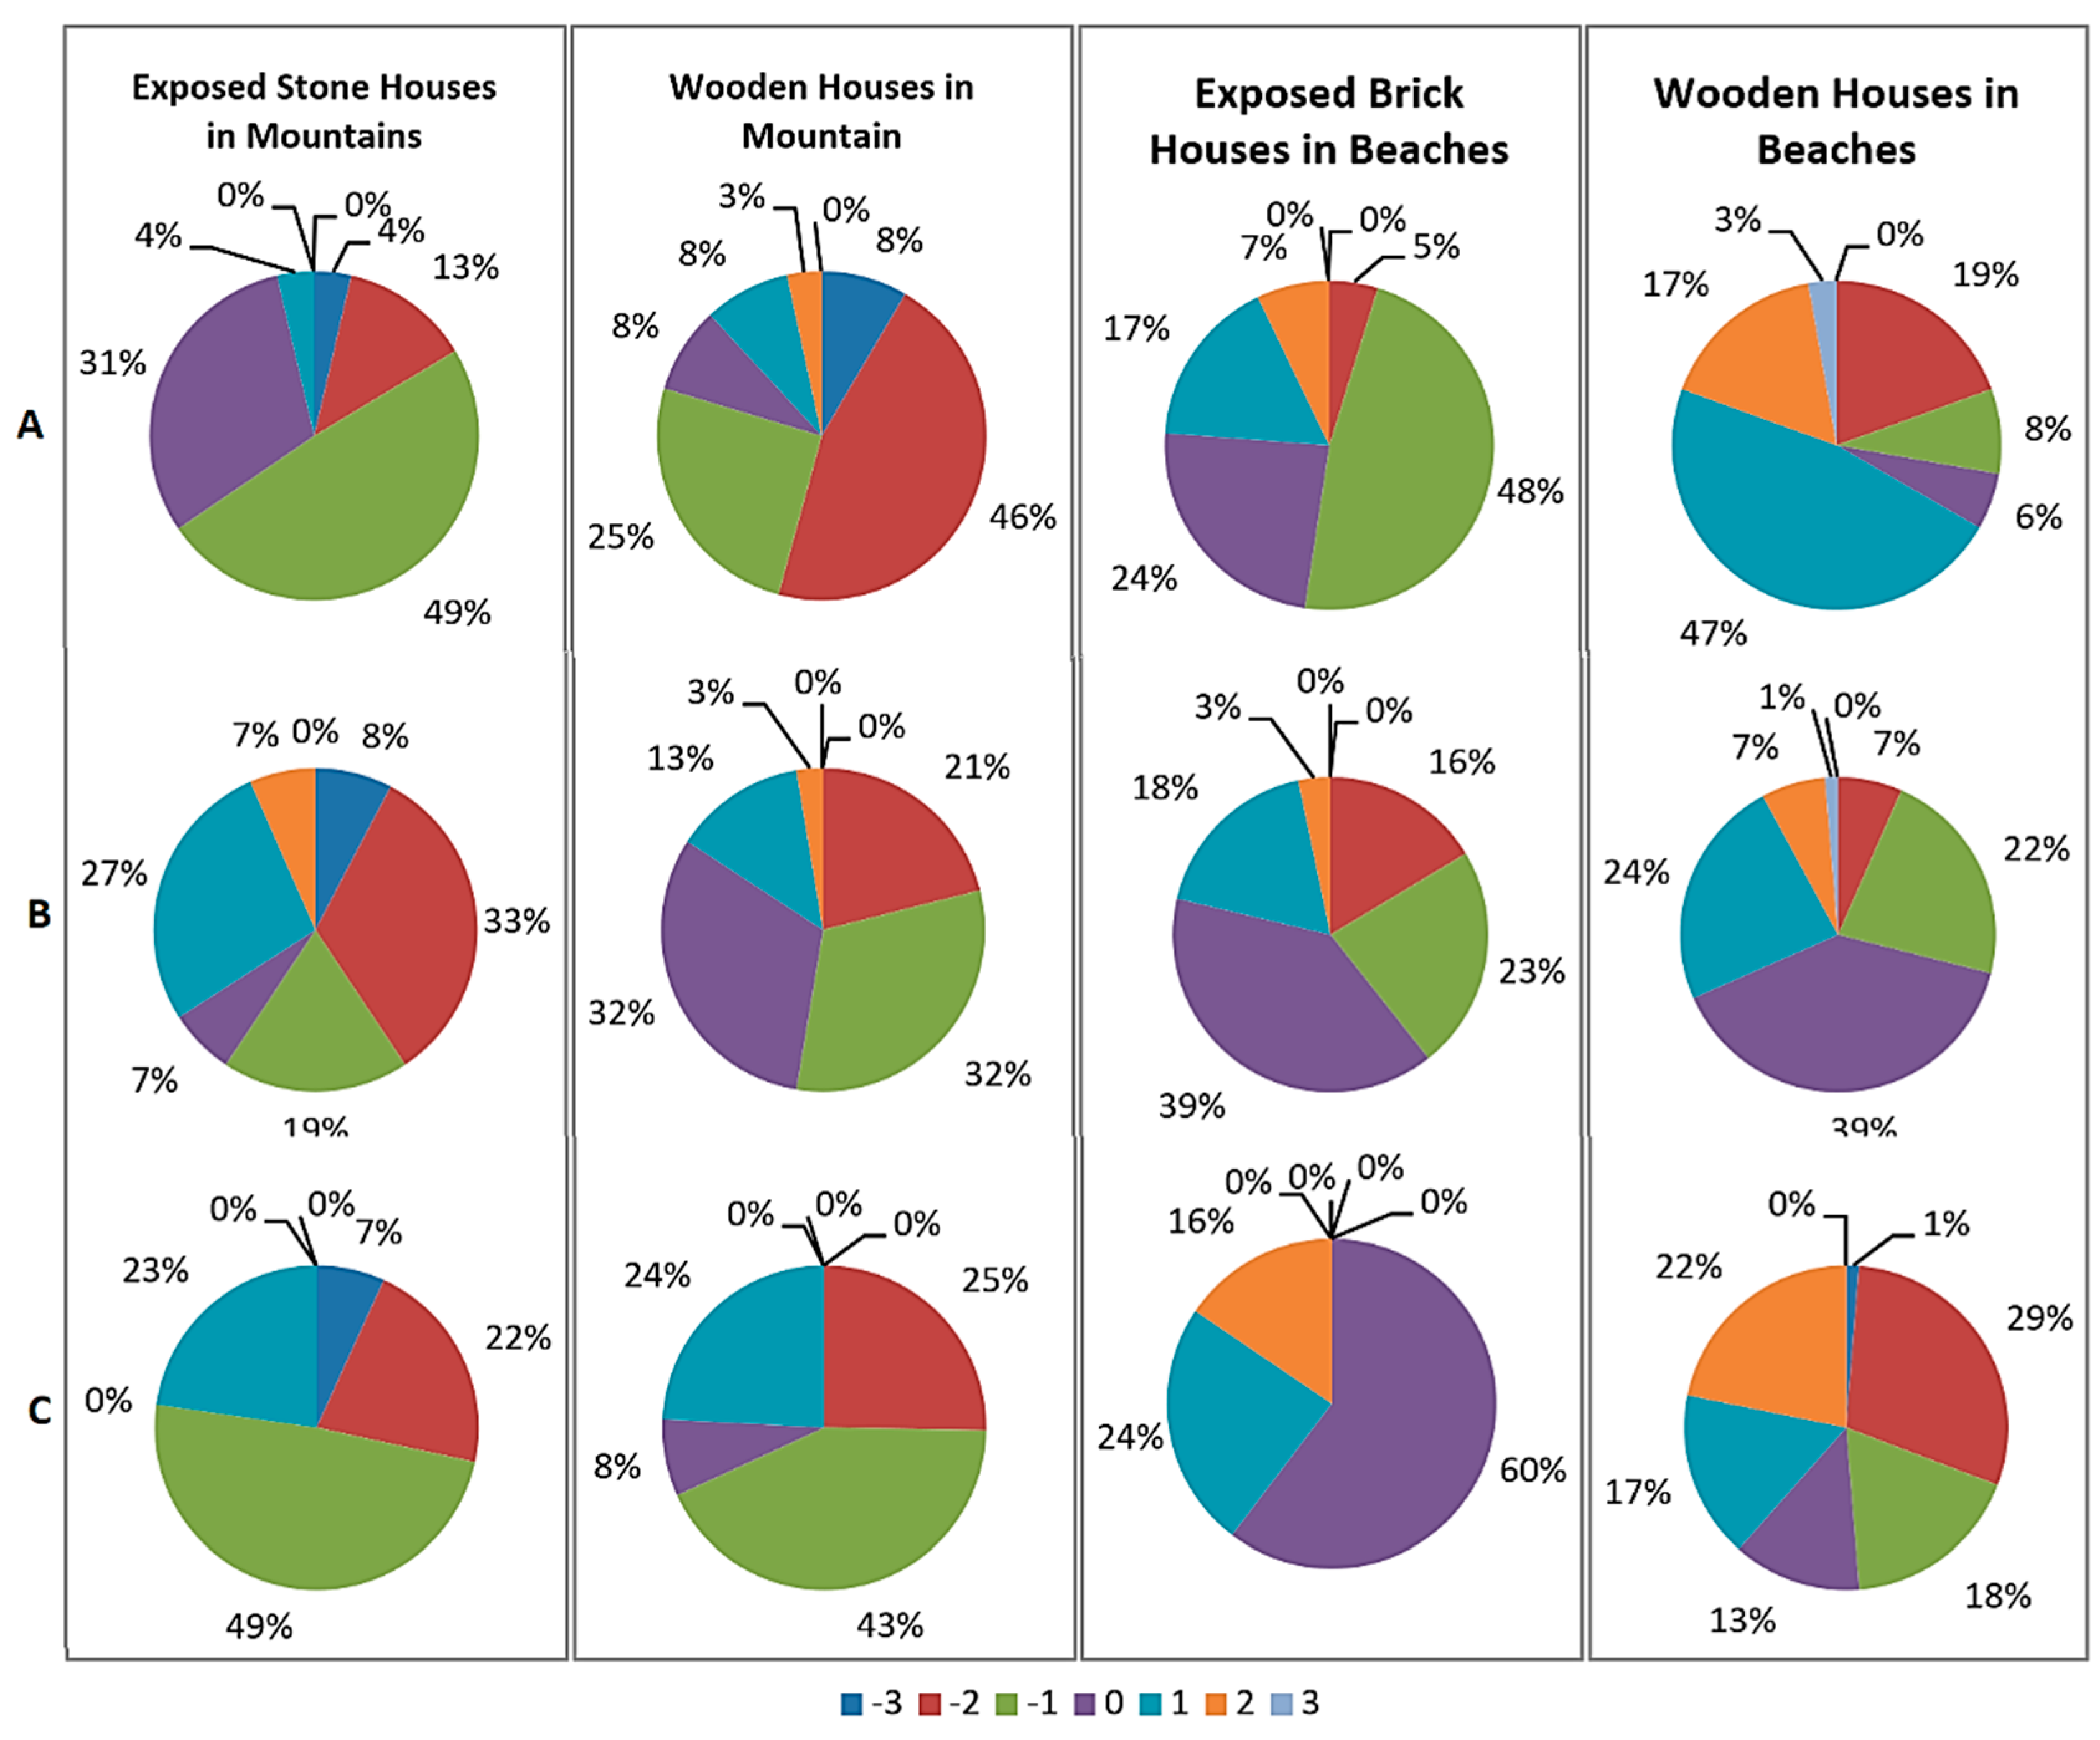
Thermal sensations have been a basis for determining adaptive thermal comfort carried out using a field study. It involves seven scales including −3, −2, −1, 0, +1, +2, +3 according to ASHRAE standards (Figure 10). The scales, which were obtained from interviews and questionnaires, represent the inhabitants’ thermal perceptions: very cold, cold, cool, comfortable, warm, hot, and very hot. The validity of the scales, however, was questioned. Therefore, an appropriate way to attain valid data of thermal sensations is required. The data in the present study were repeatedly collected to obtain valid data. The interviewer’s skills in facilitating a relaxed, non-threatening atmosphere where interviewees feel comfortable expressing their thermal sensations are required. The data of thermal sensations are presented in the form of percentage per seasonal period, including the beginning of the wet season, the middle of the wet season, and the beginning of the dry season.
The results of the investigation on thermal sensations demonstrate that at the beginning of the wet season, in the middle of the wet season, and at the start of dry season (1) the inhabitants of exposed stone houses in the mountains create a comfortable thermal sensation by 31%, 7%, and 0% respectively, (2) the inhabitants of wooden houses in the mountains create a comfortable thermal sensation by 8%, 32%, and 8% respectively, (3) the inhabitants of exposed brick houses in beaches create a comfortable thermal sensation by 24%, 39%, and 60% respectively, and (4) the inhabitants of wooden houses in beaches create a comfortable thermal sensation by 6%, 39%, and 13% respectively.

3.3. Analysis of the Psychrometric Diagrams

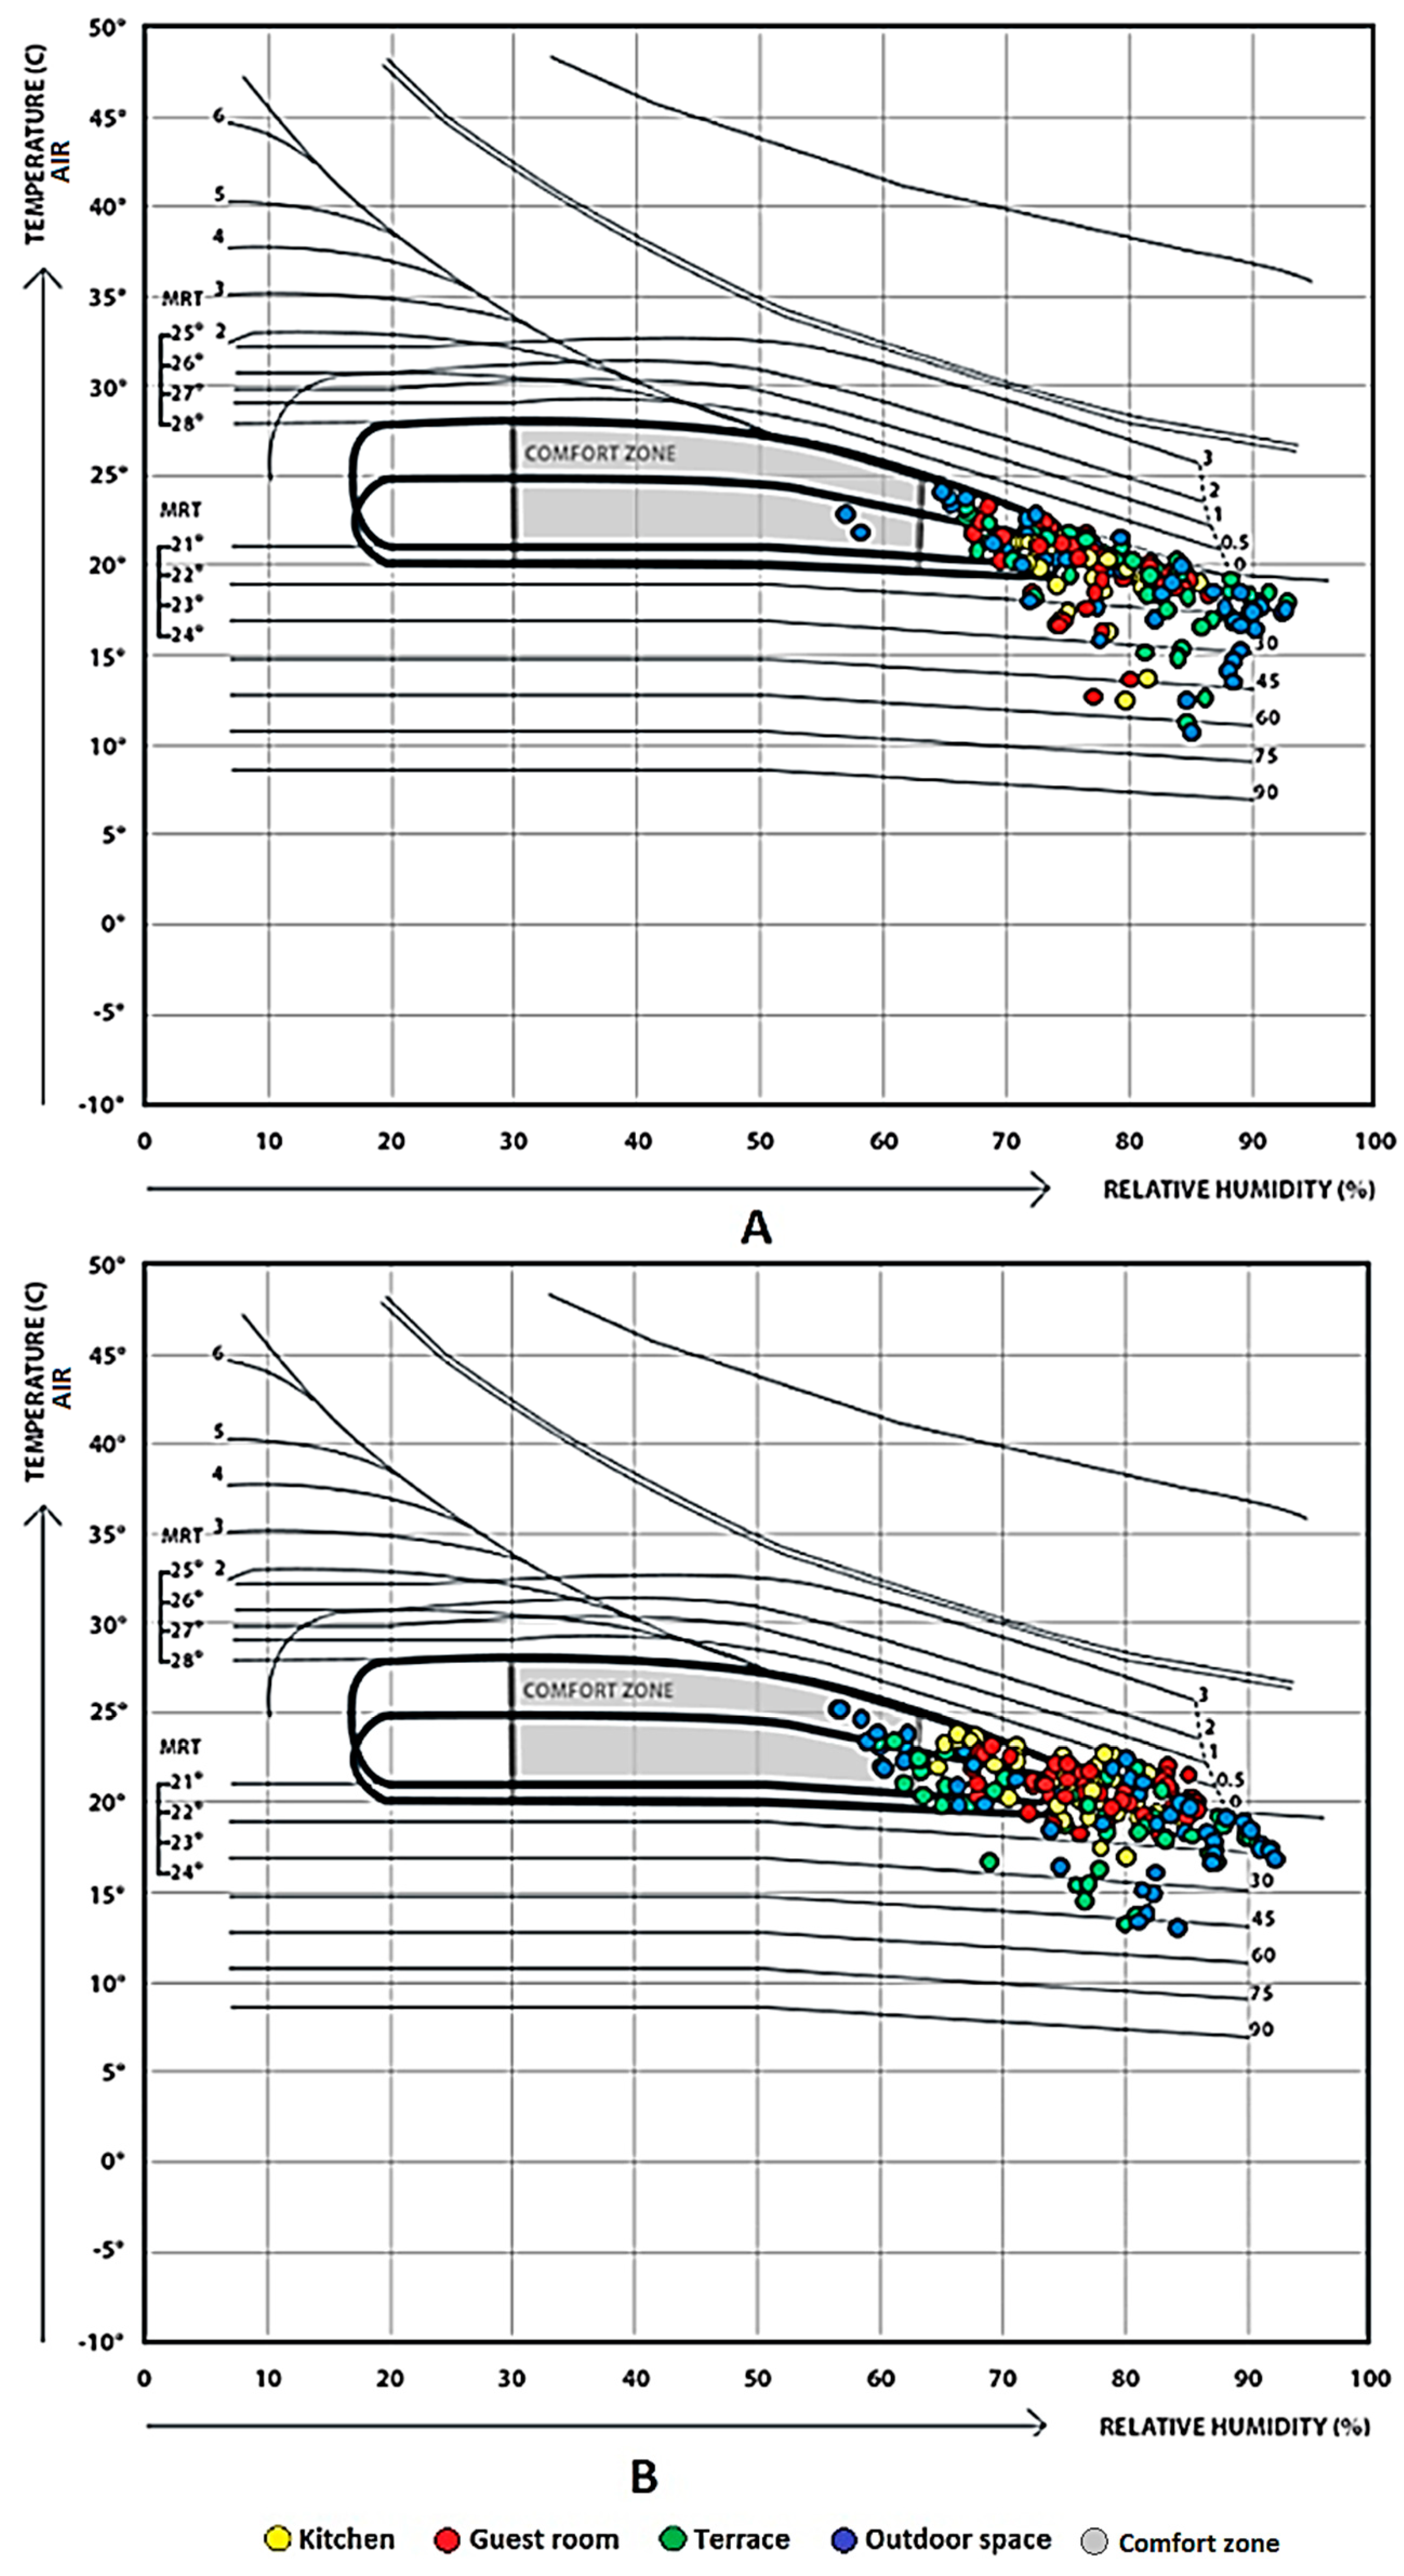
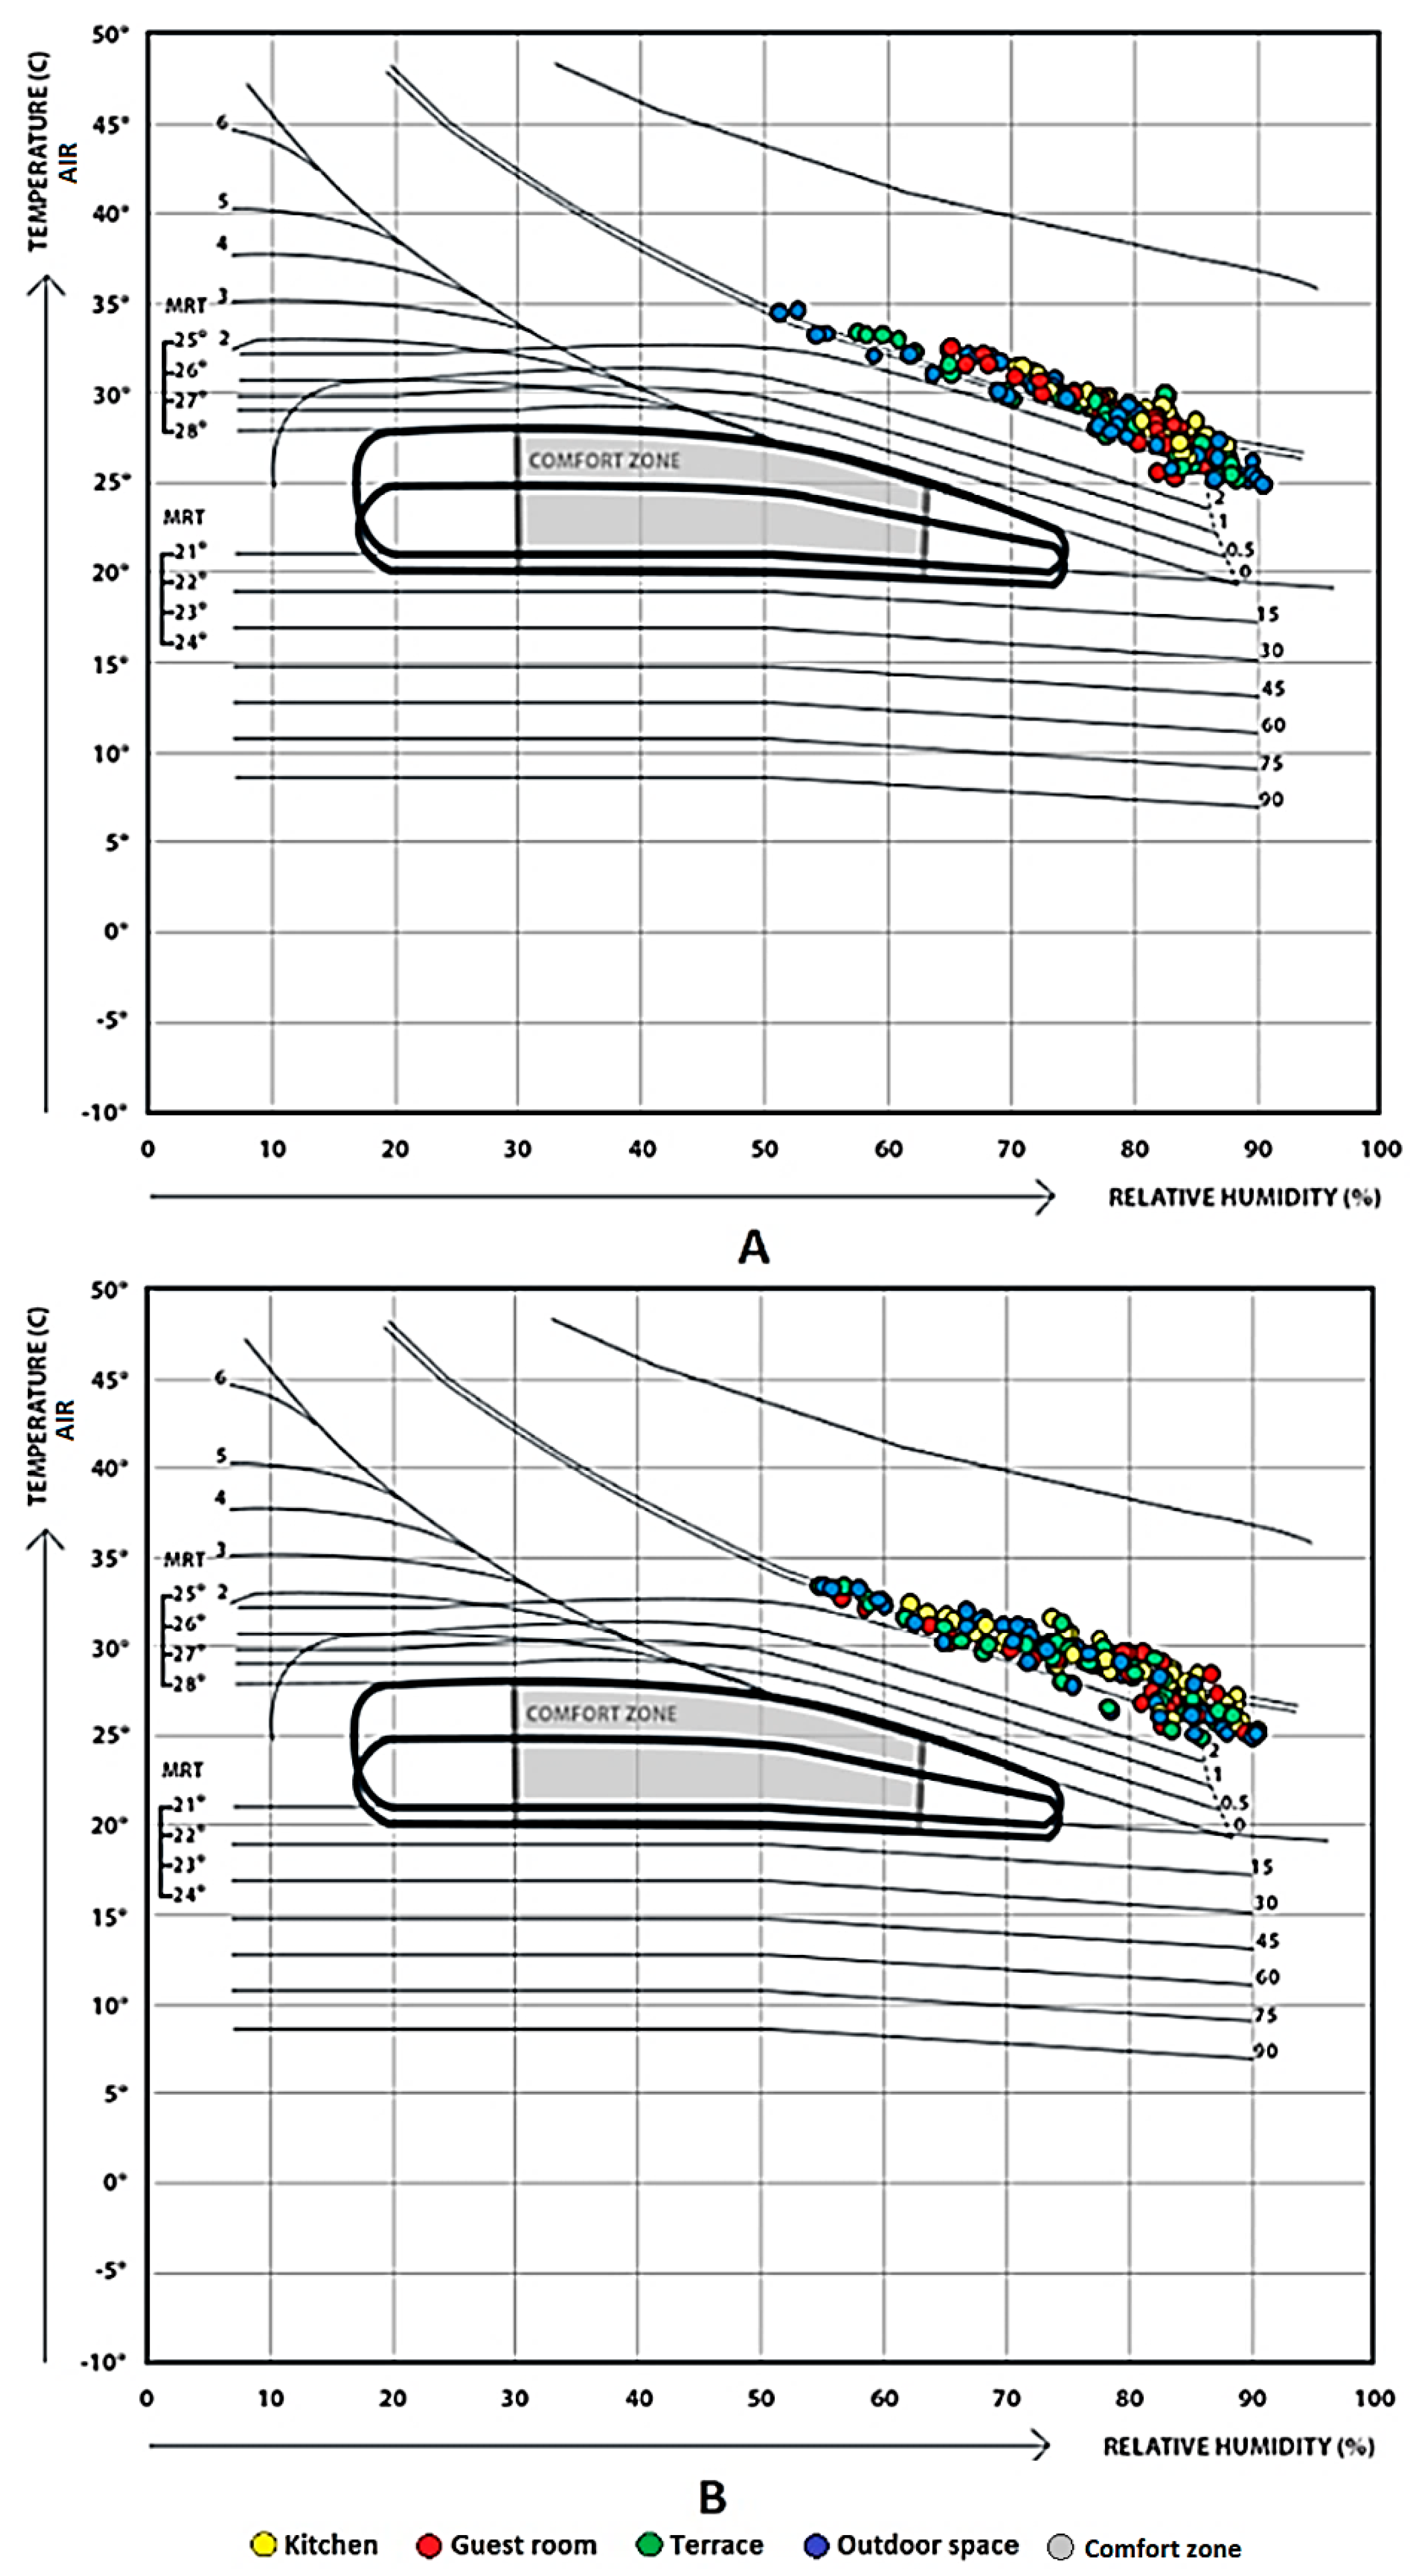
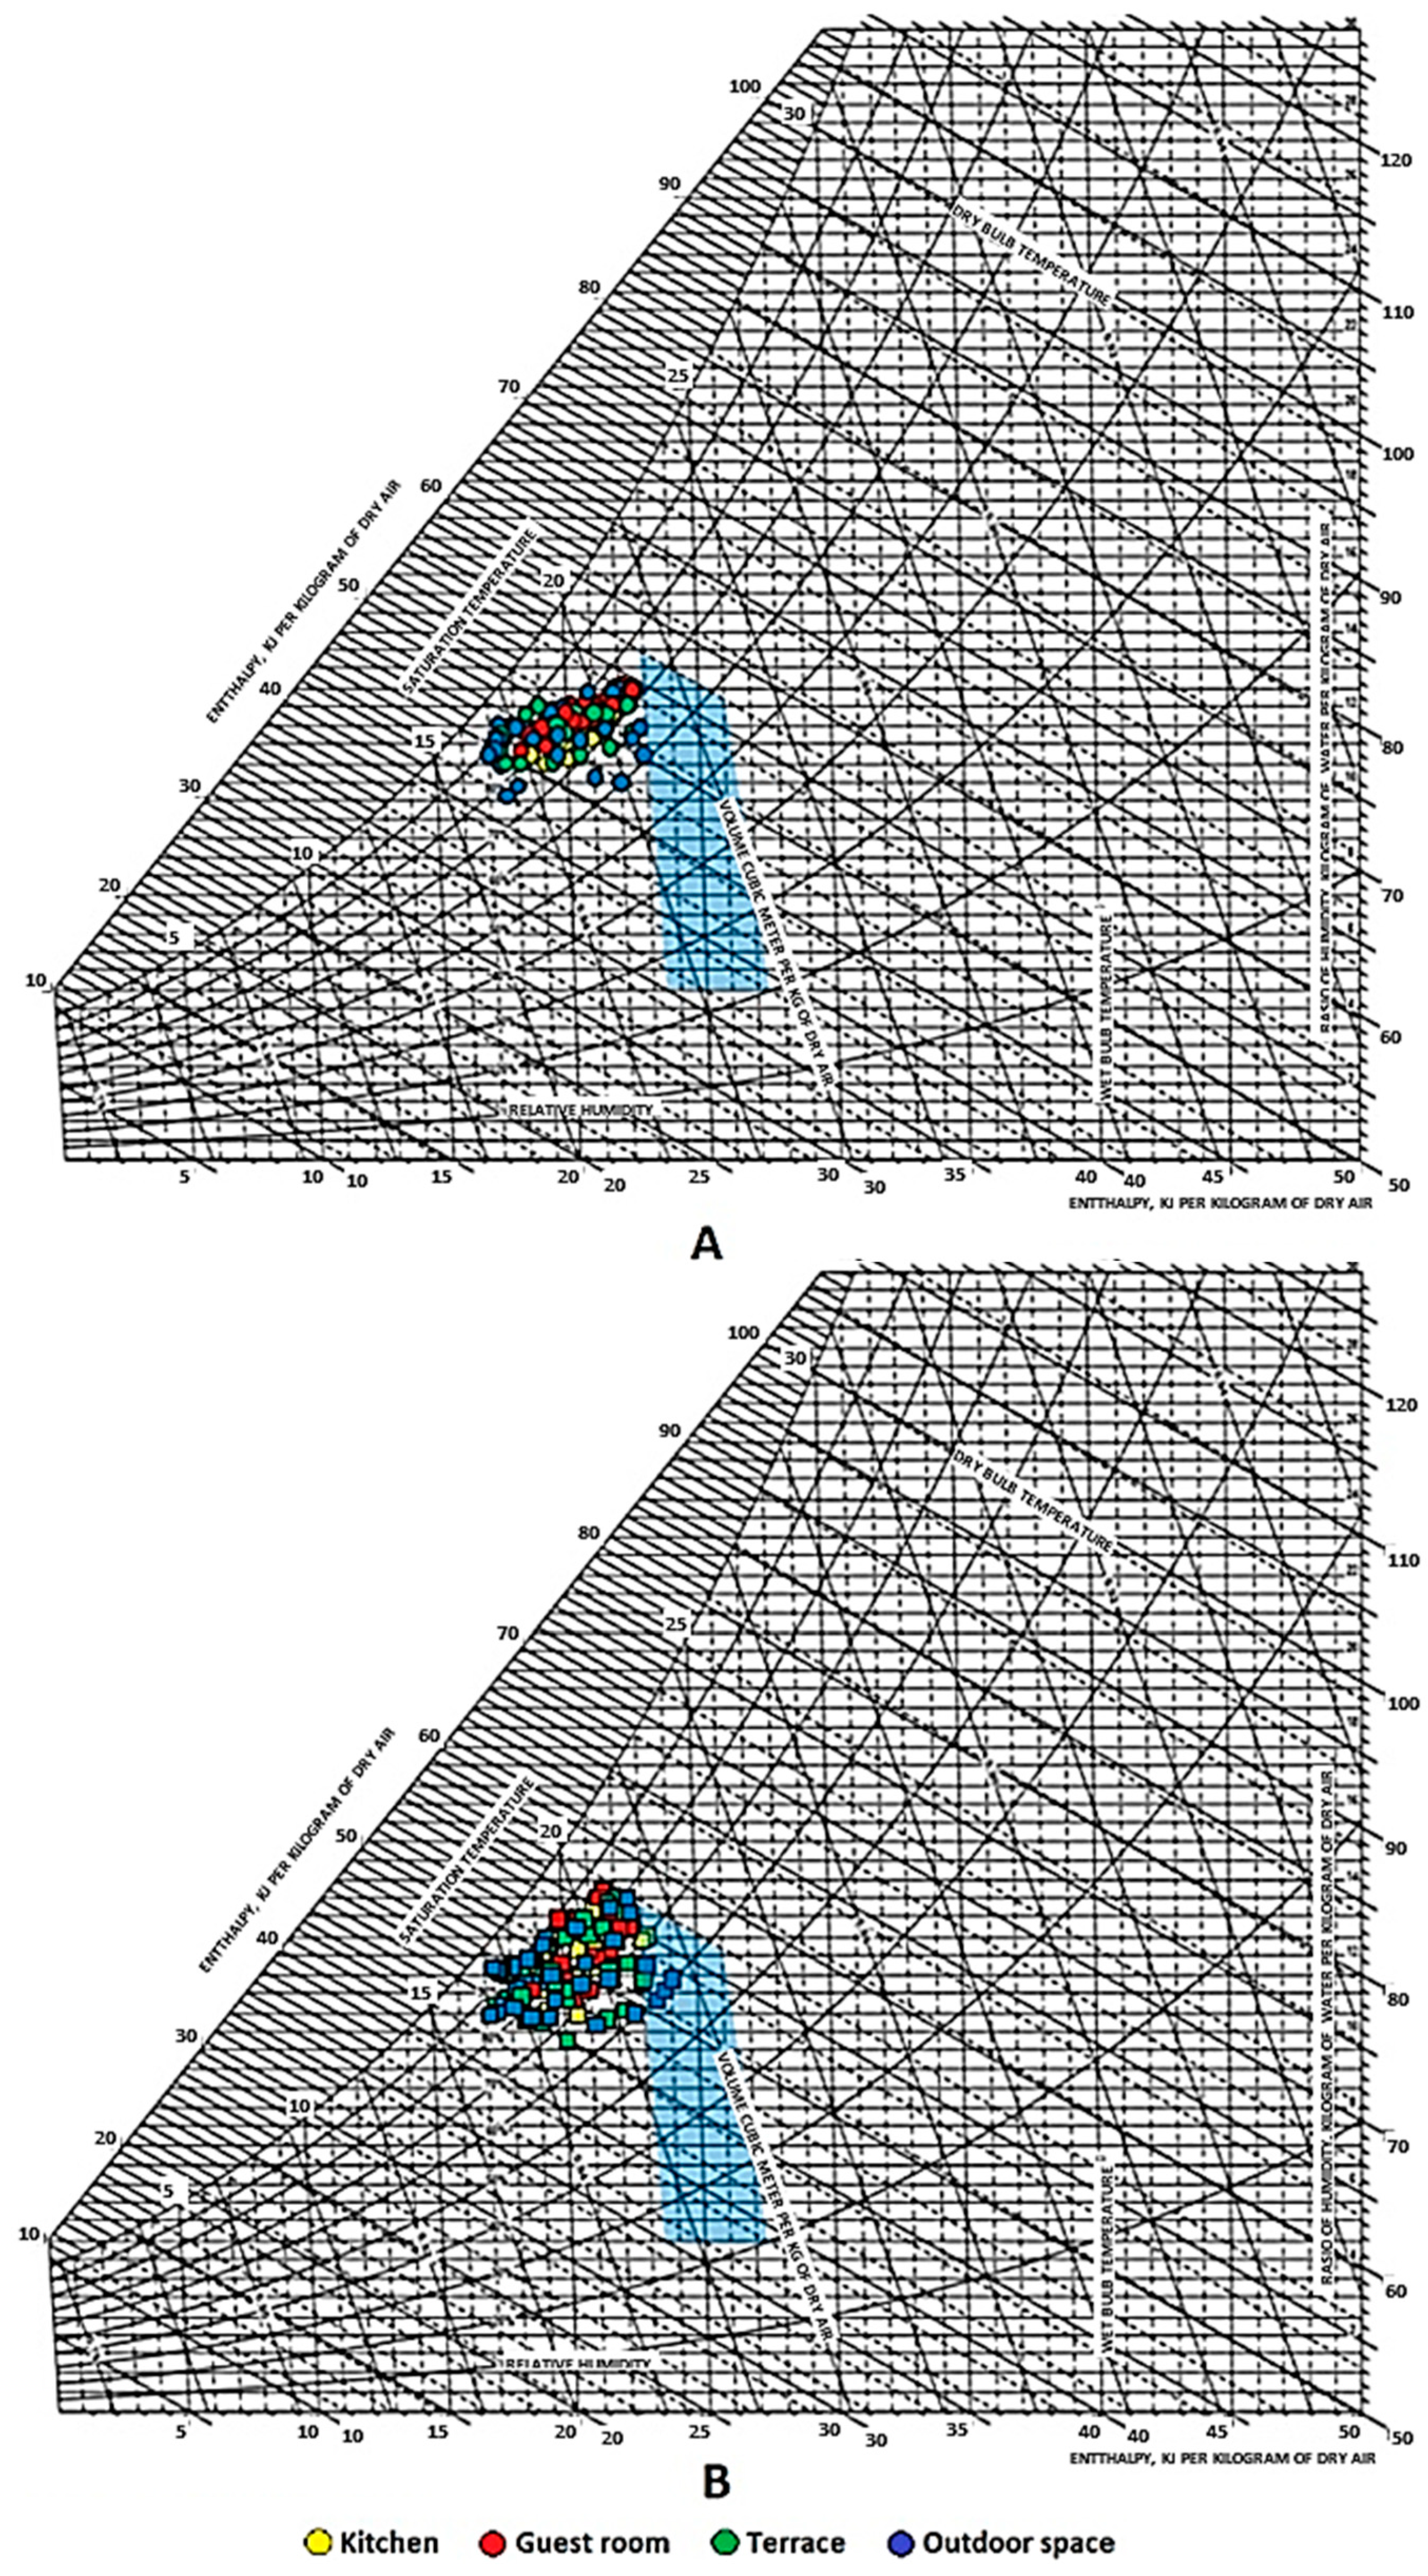
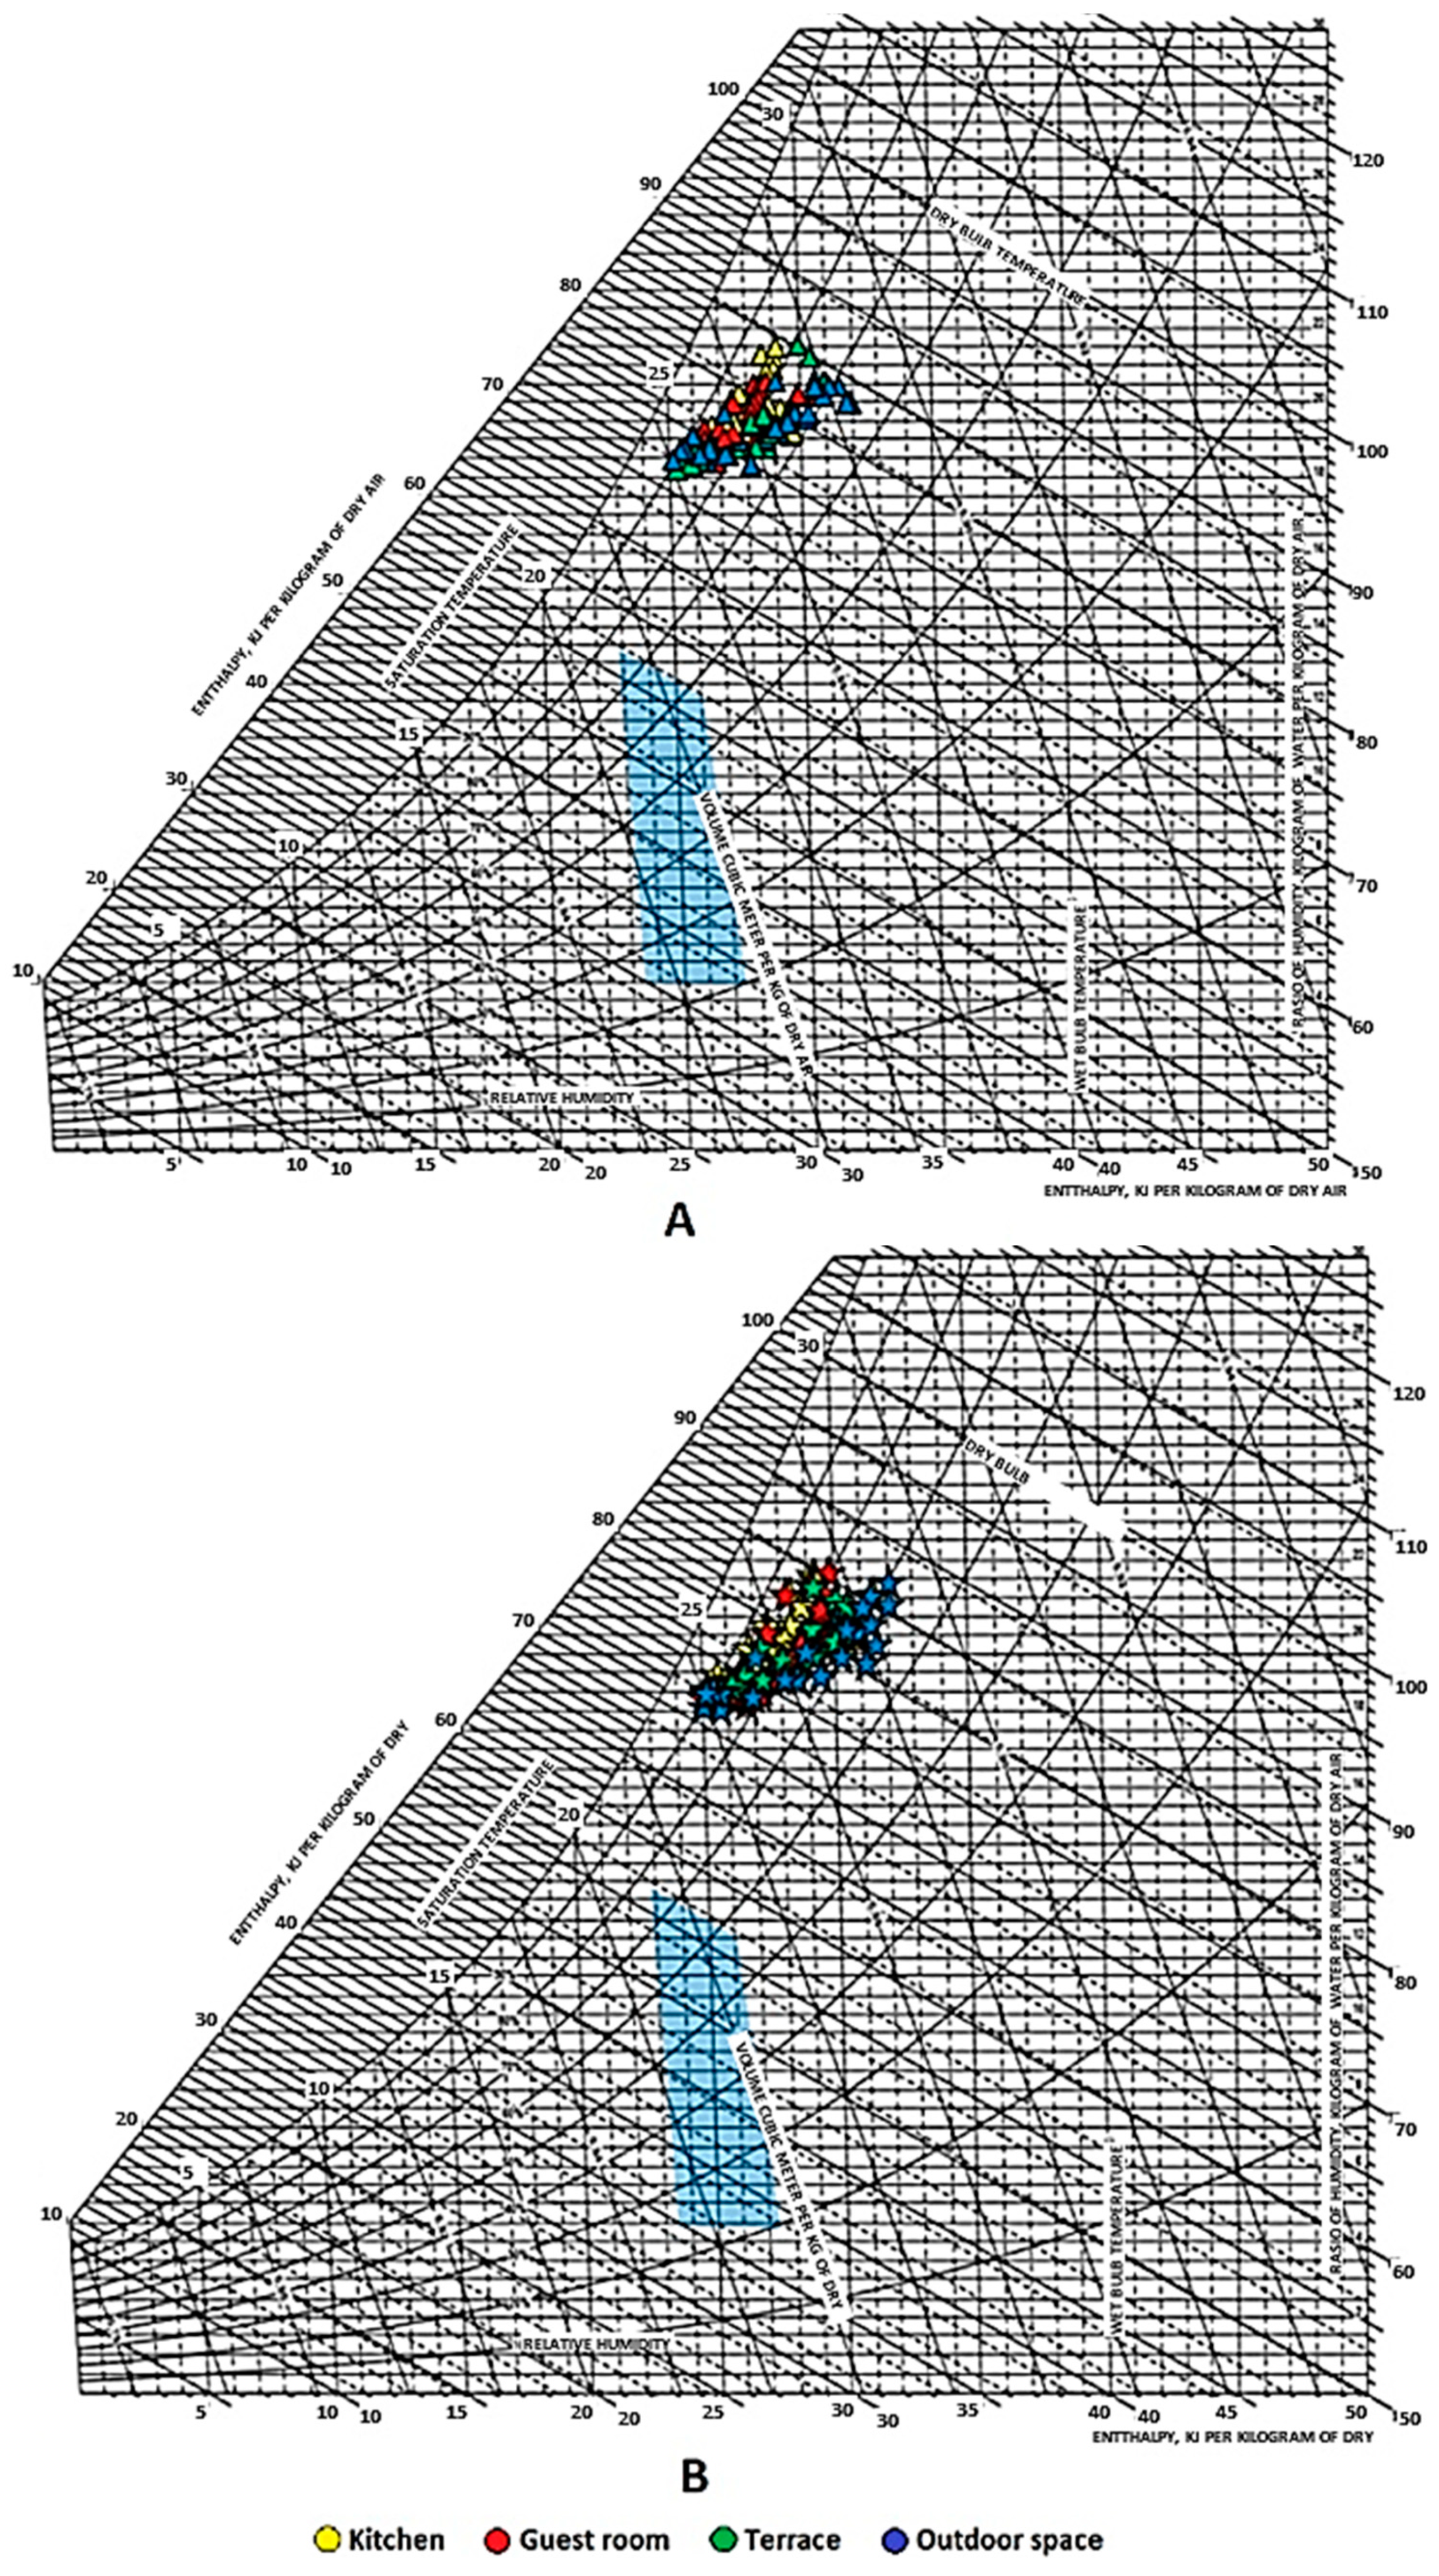
The Olgyay and psychrometric diagrams can be used in the thermal analysis to define a comfort zone (Figure 11, Figure 12, Figure 13 and Figure 14). The present study applied the charts to demonstrate the position of thermal variables in a comfort zone according to the Olgyay and psychrometric diagrams. The role of the variables is shown in the two graphs to display the thermal comfort of the four sample houses.
Variables of thermal comfort in exposed stone houses and wooden houses in the mountains are seen to approach a comfort zone, while thermal variables in exposed brick houses and wooden houses on beaches are far from the comfort zone. The inhabitants of mountain homes attempt to perform behaviors influencing the thermal conditions of a room, one of which is warming their body using a fireplace. In contrast, the inhabitants of houses on beaches do not perform behaviors influencing the thermal conditions. However, their behaviors are connected to their activities and clothing.
The location of the thermal variables as indicated by the psychrometric diagrams is not far different from that of thermal variables shown by the Olgyay charts. The variables in both types of houses in the mountains are seen to approach the comfort zone, while those in both places in beaches are far away from the comfort zone. Therefore, it is essential to create architectural design strategies to make the inhabitants comfortable. The thermal comfort will lead to energy efficiency since devices to create thermal comfort are no longer needed.
The limitations of the research results are mainly from the limitations concerning the respondents. Here in the future, the idea would be to provide even more data and analyze a larger group of people categorized into individual occupations. Even in this case, there was some selection with respect to employment, but it was not possible to do everything separately because there was limited data. We evaluate the impact of employment as a significant factor because everyone is in their home at a different time and has different preferences in terms of comfort with respect to the internal environment of buildings. In the future, we plan to expand this research to the mentioned aspects. Limitations regarding data evaluation can be considered as multiple data processing techniques. In our case, we used the methodology we created. For future progress in this area, we want to be inspired by similar works [41,42] where they have applied other techniques such as regression analysis. Another possible area of research into the construction of buildings mentioned in this study is the possibility to deal with thermal-technical properties of the perimeter walls of buildings in the context of studying the occurrence of biological agents on external and internal parts of buildings, for example according to the methodologies [43,44,45].
Vernacular strategies attempt to discover a passive cooling strategy. Traditional houses in areas with the hot climate in Iran serve as passive cooling systems which can modify indoor climate conditions. The procedures were implemented by optimizing the thermal performance of the seasonal rooms. They were obtained from the results of a study conducted through the interview, observation, socio-cultural questionnaire, and observation of a variety of temperatures and thermal comfort. The strategies indicate how climatic elements influence the behaviors of the inhabitants [46]. Thermal comfort strategies were discovered from a study on Galconde, the first modern reinforced concrete building in India. Passive design strategies include the building’s surrounding vegetation promoting natural ventilation, its orientation minimizing solar exposure, the ventilated double roof reducing indoor temperatures, and the louvers working as solar shading devices. The variables used involve air temperature, relative humidity, and surface temperature. The measurement was done every hour for one and a half years [47].
The studies’ results can be references in creating strategies for vernacular houses in mountain and beach locations. Techniques upon mountain houses can be employed by setting up a space to gather in the middle of the house to minimize cold conditions. Meanwhile, strategies upon beach houses are implemented by creating an area bordered by outdoor spaces to allow wind to enter into play. The building envelopes are materials that can make rooms warm (in the mountains) or cool (in beach locations). The study results indicate that exposed stone houses in the mountains can create warm conditions, while exposed brick houses on beaches can provide cold conditions.
Passive thermal comfort strategies on building envelopes were also employed in a building in India. The techniques include light-colored external surfaces, reflective paints, window treatments, and roof gardens [48]. Yazd traditional buildings in Iran are proved to be able to create thermal comfort for the inhabitants. In all seasons, the internal temperature of summer sections has less fluctuation than the outdoor temperature, although some rooms require cooling devices [49]. The philosophy of sustainable houses and living in them is a more current topic than ever before [50], so it is necessary to examine the interactions of the indoor and outdoor environment with the starting points for more innovative and sustainable buildings, as such.

4. Conclusions

Comparing outdoor and indoor air temperatures in the four vernacular houses shows that wooden houses make the indoor air temperature warmer. Exposed stone houses and exposed brick houses make the air temperature in the room cooler. This finding is reinforced by the difference in wall surface temperature, which shows that the average wall surface temperature in wooden houses is warmer than the inner wall surface temperature. At the beginning of the rainy season, residents of exposed stone houses had the highest comfortable percentage of 31%. In the middle of the rainy season, the highest percentage of comfort was obtained by residents of exposed brick and wooden houses on the beach at 39%. The lowest comfortable percentage experienced by residents of exposed stone houses at the beginning of the dry season was 0%. The beginning of the dry season in mountainous areas has air temperatures that are too low, making residents uncomfortable.
Olgyay and psychrometric diagrams show the difference in the comfort area at the two locations. The mountainous region is still included in the comfort area, while the coastal area is not included. The two diagrams validate the findings when the survey uses a comparison of outside and inside air temperatures. The results of the Olgyay and psychrometric graphs confirm the previous findings, especially in mountainous areas. In the coastal zone, the Olgyay and psychrometric diagrams are different from the earlier findings. Some results are still the same, but other results are different from the previous results.
Architectural elements and adaptive thermal comfort are closely related. The well-designed features will result in optimal adaptive thermal comfort. Human behaviors towards the architectural details are the inhabitants’ ways to anticipate the thermal comfort of their environment. The architectural elements influence adaptive thermal comfort, particularly in the selection of materials of the building envelopes. Local material-based strategies of building envelope design are of concern in the architectural plans.

Author Contributions

Conceptualization, H.H. and J.Š.; methodology, H.H.; software, H.H.; validation, H.H. and J.Š.; formal analysis, H.H. and J.Š.; investigation, H.H.; resources, H.H. and J.Š.; data curation, H.H.; writing—original draft preparation, H.H. and J.Š.; writing—review and editing, H.H. and J.Š.; visualization, H.H.; supervision, H.H. and J.Š.; project administration, H.H. and J.Š.; funding acquisition, H.H. and J.Š. All authors have read and agreed to the published version of the manuscript.

Funding

This research received no external funding.

Data Availability Statement

Data is available on request.

Conflicts of Interest

No potential conflict of interest was reported by the authors.

References

  1. Ahuja, D.; Tatsutani, M. Sustainable energy for developing Countries. Sapiens. 2009. 2.1. Available online: https://www.researchgate.net/publication/40810676_Sustainable_energy_for_developing_Countries (accessed on 7 November 2021).
  2. Albatayneh, A.; Alterman, D.; Page, A.; Moghtaderi, B. The impact of the thermal comfort models on the prediction of building energy consumption. Sustainability 2018, 10, 3609. [Google Scholar] [CrossRef] [Green Version]
  3. Demanega, I.; Mujan, I.; Singer, B.C.; Anđelković, A.S.; Babich, F.; Licina, D. Performance assessment of low-cost environmental monitors and single sensors under variable indoor air quality and thermal conditions. Build. Environ. 2020, 187, 107415. [Google Scholar] [CrossRef]
  4. Maslesa, E.; Jensen, P.A.; Birkved, M. Indicators for quantifying environmental building performance: A systematic literature review. J. Build. Eng. 2018, 19, 552–560. [Google Scholar] [CrossRef]
  5. Su, B. Field study to compare and evaluate winter indoor thermal and health conditions of school buildings with different envelopes. Arch. Sci. Rev. 2016, 60, 40–48. [Google Scholar] [CrossRef]
  6. Roaf, S.; Nicol, F.; Rijal, H.B. Designing for comfort at high temperatures. Arch. Sci. Rev. 2014, 58, 35–38. [Google Scholar] [CrossRef]
  7. Badarnah, L.; Kadri, U. A methodology for the generation of biomimetic design concepts. Arch. Sci. Rev. 2014, 58, 120–133. [Google Scholar] [CrossRef]
  8. Prianto, E.; Bonneaud, F.; Depecker, P.; Peneau, J.-P. Tropical-Humid Architecture in Natural Ventilation Efficient Point of View, a Reference of Traditional Architecture in Indonesia. Int. J. Archit. Sci. 2000, 1, 80–95. [Google Scholar]
  9. Prianto, E.; Depecker, P. Characteristic of airflow as the effect of balcony, opening design and internal division on indoor velocity: A case study of traditional dwelling in urban living quarter in tropical humid region. Energy Build. 2002, 34, 401–409. [Google Scholar] [CrossRef]
  10. Liu, S.; Kwok, Y.T.; Lau, K.K.-L.; Tong, H.W.; Chan, P.W.; Ng, E.Y.Y. Development and application of future design weather data for evaluating the building thermal-energy performance in subtropical Hong Kong. Energy Build. 2020, 209, 109696. [Google Scholar] [CrossRef]
  11. Fernandes, J.; Mateus, R.; Bragança, L.; Da Silva, J.J.C. Portuguese vernacular architecture: The contribution of vernacular materials and design approaches for sustainable construction. Arch. Sci. Rev. 2015, 58, 324–336. [Google Scholar] [CrossRef]
  12. Mohammadi, A.; Saghafi, M.R.; Tahbaz, M.; Nasrollahi, F. The study of climate-responsive solutions in traditional dwellings of Bushehr City in Southern Iran. J. Build. Eng. 2017, 16, 169–183. [Google Scholar] [CrossRef]
  13. Shastry, V.; Mani, M.; Tenório, R. Evaluating thermal comfort and building climatic response in warm-humid climates for vernacular dwellings in Suggenhalli (India). Arch. Sci. Rev. 2016, 59, 12–26. [Google Scholar] [CrossRef]
  14. Molodin, A.V. The contribution of multi-level heating strategies in thermal performance of vernacular architecture in Chukotka. Arch. Sci. Rev. 2016, 59, 71–80. [Google Scholar] [CrossRef]
  15. Pan, L.; Xu, Q.; Nie, Y.; Qiu, T. Analysis of climate adaptive energy-saving technology approaches to residential building envelope in Shanghai. J. Build. Eng. 2018, 19, 266–272. [Google Scholar] [CrossRef]
  16. Hermawan; Prianto, E.; Setyowati, E.; Sunaryo. The Thermal Condition and Comfort Temperature of Traditional Residential Houses Located in Mountainous Tropical Areas: An Adaptive Field Study Approach. Int. J. Adv. Sci. Eng. Inf. Technol. 2019, 9, 1833–1840. [Google Scholar] [CrossRef] [Green Version]
  17. Hermawan, H.; Hadiyanto, H.; Sunaryo, S.; Kholil, A. Analysis of thermal performance of wood and exposed stone-walled buildings in mountainous areas with building envelop variations. J. Appl. Eng. Sci. 2019, 17, 321–332. [Google Scholar] [CrossRef] [Green Version]
  18. Karyono, T.H.; Heryanto, S.; Faridah, I. Air conditioning and the neutral temperature of the Indonesian university students. Arch. Sci. Rev. 2015, 58, 174–183. [Google Scholar] [CrossRef]
  19. De Vecchi, R.; Sorgato, M.J.; Pacheco, M.; Cândido, C.; Lamberts, R. ASHRAE 55 Adaptive Model Application in Hot and Humid Climates: The Brazilian Case. Arch. Sci. Rev. 2015, 58, 93–101. [Google Scholar] [CrossRef]
  20. Tseliou, A.; Tsiros, I.X.; Nikolopoulou, M.; Papadopoulos, G. Outdoor thermal sensation in a Mediterranean climate (Athens): The effect of selected microclimatic parameters. Arch. Sci. Rev. 2015, 59, 190–202. [Google Scholar] [CrossRef]
  21. Subhashini, S.; Thirumaran, K. A passive design solution to enhance thermal comfort in an educational building in the warm humid climatic zone of Madurai. J. Build. Eng. 2018, 18, 395–407. [Google Scholar] [CrossRef]
  22. Natarajan, S.; Rodriguez, J.; Vellei, M. A field study of indoor thermal comfort in the subtropical highland climate of Bogota, Colombia. J. Build. Eng. 2015, 4, 237–246. [Google Scholar] [CrossRef] [Green Version]
  23. Indraganti, M.; Lee, J.; Zhang, H.; Arens, E.A. Thermal adaptation and insulation opportunities provided by different drapes of Indian saris. Arch. Sci. Rev. 2015, 58, 87–92. [Google Scholar] [CrossRef] [Green Version]
  24. Esfandiari, M.; Zaid, S.M.; Ismail, M.A. Investigating the Indoor Environment Quality Parameters and Their Relationship with Occupants’ Satisfaction in Office Buildings: A Review. J. Des. Built Environ. 2017, 181–194. [Google Scholar] [CrossRef] [Green Version]
  25. Luther, M.B.; Horan, P.; Tokede, O. Investigating CO2 concentration and occupancy in school classrooms at different stages in their life cycle. Arch. Sci. Rev. 2018, 61, 83–95. [Google Scholar] [CrossRef]
  26. Afacan, Y.; Demirkan, H. The influence of sustainable design features on indoor environmental quality satisfaction in Turkish dwellings. Arch. Sci. Rev. 2015, 59, 229–238. [Google Scholar] [CrossRef] [Green Version]
  27. Ge, J.; Wu, J.; Chen, S.; Wu, J. Energy efficiency optimization strategies for university research buildings with hot summer and cold winter climate of China based on the adaptive thermal comfort. J. Build. Eng. 2018, 18, 321–330. [Google Scholar] [CrossRef]
  28. Humphreys, M.A.; Nicol, J.F. The validity of ISO-PMV for predicting comfort votes in every-day life. Energy Build. 2002, 34, 667–684. [Google Scholar] [CrossRef]
  29. Suk, J.Y.; Schiler, M.; Kensek, K. Reflectivity and specularity of building envelopes: How materiality in architecture affects human visual comfort. Arch. Sci. Rev. 2017, 60, 256–265. [Google Scholar] [CrossRef]
  30. Barbosa, S.; Ip, K. Predicted thermal acceptance in naturally ventilated office buildings with double skin façades under Brazilian climates. J. Build. Eng. 2016, 7, 92–102. [Google Scholar] [CrossRef] [Green Version]
  31. Shao, N.; Zhang, J.; Ma, L. Analysis on indoor thermal environment and optimization on design parameters of rural residence. J. Build. Eng. 2017, 12, 229–238. [Google Scholar] [CrossRef]
  32. Hermawan; Prianto, E.; Setyowati, E. The comfort temperature for exposed stone houses and wooden houses in mountainous areas. J. Appl. Sci. Eng. 2020, 23, 571–582. [Google Scholar] [CrossRef]
  33. Hermawan, H.; Prianto, E.; Setyowati, E. Studi Tipologi Rumah Vernakular Pantai Dan Gunung (Studi Kasus Di Kabupaten Demak Dan Kabupaten Wonosobo). J. Penelit. Dan Pengabdi. Kpd. Masy. Unsiq 2018, 5, 259–266. [Google Scholar] [CrossRef] [Green Version]
  34. Rijal, H.B.; Humphreys, M.A.; Nicol, J.F. Development of a window opening algorithm based on adaptive thermal comfort to predict occupant behavior in Japanese dwellings. Jpn. Arch. Rev. 2018, 1, 310–321. [Google Scholar] [CrossRef]
  35. Rijal, H.B.; Honjo, M.; Kobayashi, R.; Nakaya, T. Investigation of comfort temperature, adaptive model and the window-opening behaviour in Japanese houses. Archit. Sci. Rev. 2013, 56, 54–69. [Google Scholar] [CrossRef]
  36. Hendriani, A.S.; Hermawan; Retyanto, B. Comparison analysis of wooden house thermal comfort in tropical coast and mountainous by using wall surface temperature difference. Conf. Proc. 2017, 1887, 020007. [Google Scholar] [CrossRef]
  37. Zhao, Q.; Lian, Z.; Lai, D. Thermal comfort models and their developments: A review. Energy Built Environ. 2021, 2, 21–33. [Google Scholar] [CrossRef]
  38. Hermawan; Prianto, E.; Setyowati, E. Thermal Comfort of Wood-wall House in Coastal and Mountainous Region in Tropical Area. Procedia Eng. 2015, 125, 725–731. [Google Scholar] [CrossRef]
  39. Hermawan; Prianto, E. Thermal Evaluation for Exposed Stone House with Quantitative and Qualitative Approach in Mountainous Area. In Proceedings of the IOP Conf. Series: Earth and Environmental Science, Wonosobo, Indonesia, 9–10 August 2017; pp. 1–10. [Google Scholar]
  40. Hermawan; Prianto, E.; Setyowati, E.; Sunaryo. The Comparison of Vernacular Residences’ Thermal Comfort in Coastal with that in Mountainous Regions of Tropical Areas. Conf. Proc. 2017, 1903, 080001. [Google Scholar] [CrossRef]
  41. Rijal, H.B.; Yoshida, H.; Umemiya, N. Seasonal and regional differences in neutral temperatures in Nepalese traditional vernacular houses. Build. Environ. 2010, 45, 2743–2753. [Google Scholar] [CrossRef]
  42. Rijal, H.B. Thermal adaptation of buildings and people for energy saving in extreme cold climate of Nepal. Energy Build. 2020, 230, 110551. [Google Scholar] [CrossRef]
  43. Antošová, N.; Belániová, B.; Chamulová, B.; Janušová, K.; Takács, J. The protection of environment during cleaning ETICS with biocides. In Advances and Trends in Engineering Sciences and Technologies III; CRC Press: London, UK, 2019; pp. 281–286. [Google Scholar]
  44. Belániová, B.; Antošová, N.; Šupejová, L. Solution of problems of ETICS with biocorrosion. In MATEC Web of Conferences; EDP Sciences: Les Ulis, France, 2018; Volume 146, p. 03007. [Google Scholar] [CrossRef] [Green Version]
  45. Antošová, N.; Ďubek, M.; Petro, M. Diagnostics to determine the cause of occurrence of cracks on ETICS. In Advances and Trends in Engineering Sciences and Technologies II; CRC Press: London, UK, 2016; pp. 335–340. [Google Scholar]
  46. Foruzanmehr, A. Thermal comfort and practicality: Separate winter and summer rooms in Iranian traditional houses. Arch. Sci. Rev. 2016, 59, 1–11. [Google Scholar] [CrossRef]
  47. Doctor-Pingel, M.; Lavocat, H.; Bhavaraju, N. Performance of naturally ventilated buildings in a warm-humid climate: A case study of Golconde Dormitories, South India. Arch. Sci. Rev. 2017, 60, 205–214. [Google Scholar] [CrossRef]
  48. Latha, P.; Darshana, Y.; Venugopal, V. Role of building material in thermal comfort in tropical climates—A review. J. Build. Eng. 2015, 3, 104–113. [Google Scholar] [CrossRef]
  49. Asadi, S.; Fakhari, M.; Sendi, M. A study on the thermal behavior of traditional residential buildings: Rasoulian house case study. J. Build. Eng. 2016, 7, 334–342. [Google Scholar] [CrossRef]
  50. Kubota, T.; Rijal, H.B.; Takaguchi, H. (Eds.) Sustainable Houses and Living in the Hot-Humid Climates of Asia; Springer Nature Singapore Pte Ltd.: Singapore, 2018. [Google Scholar]
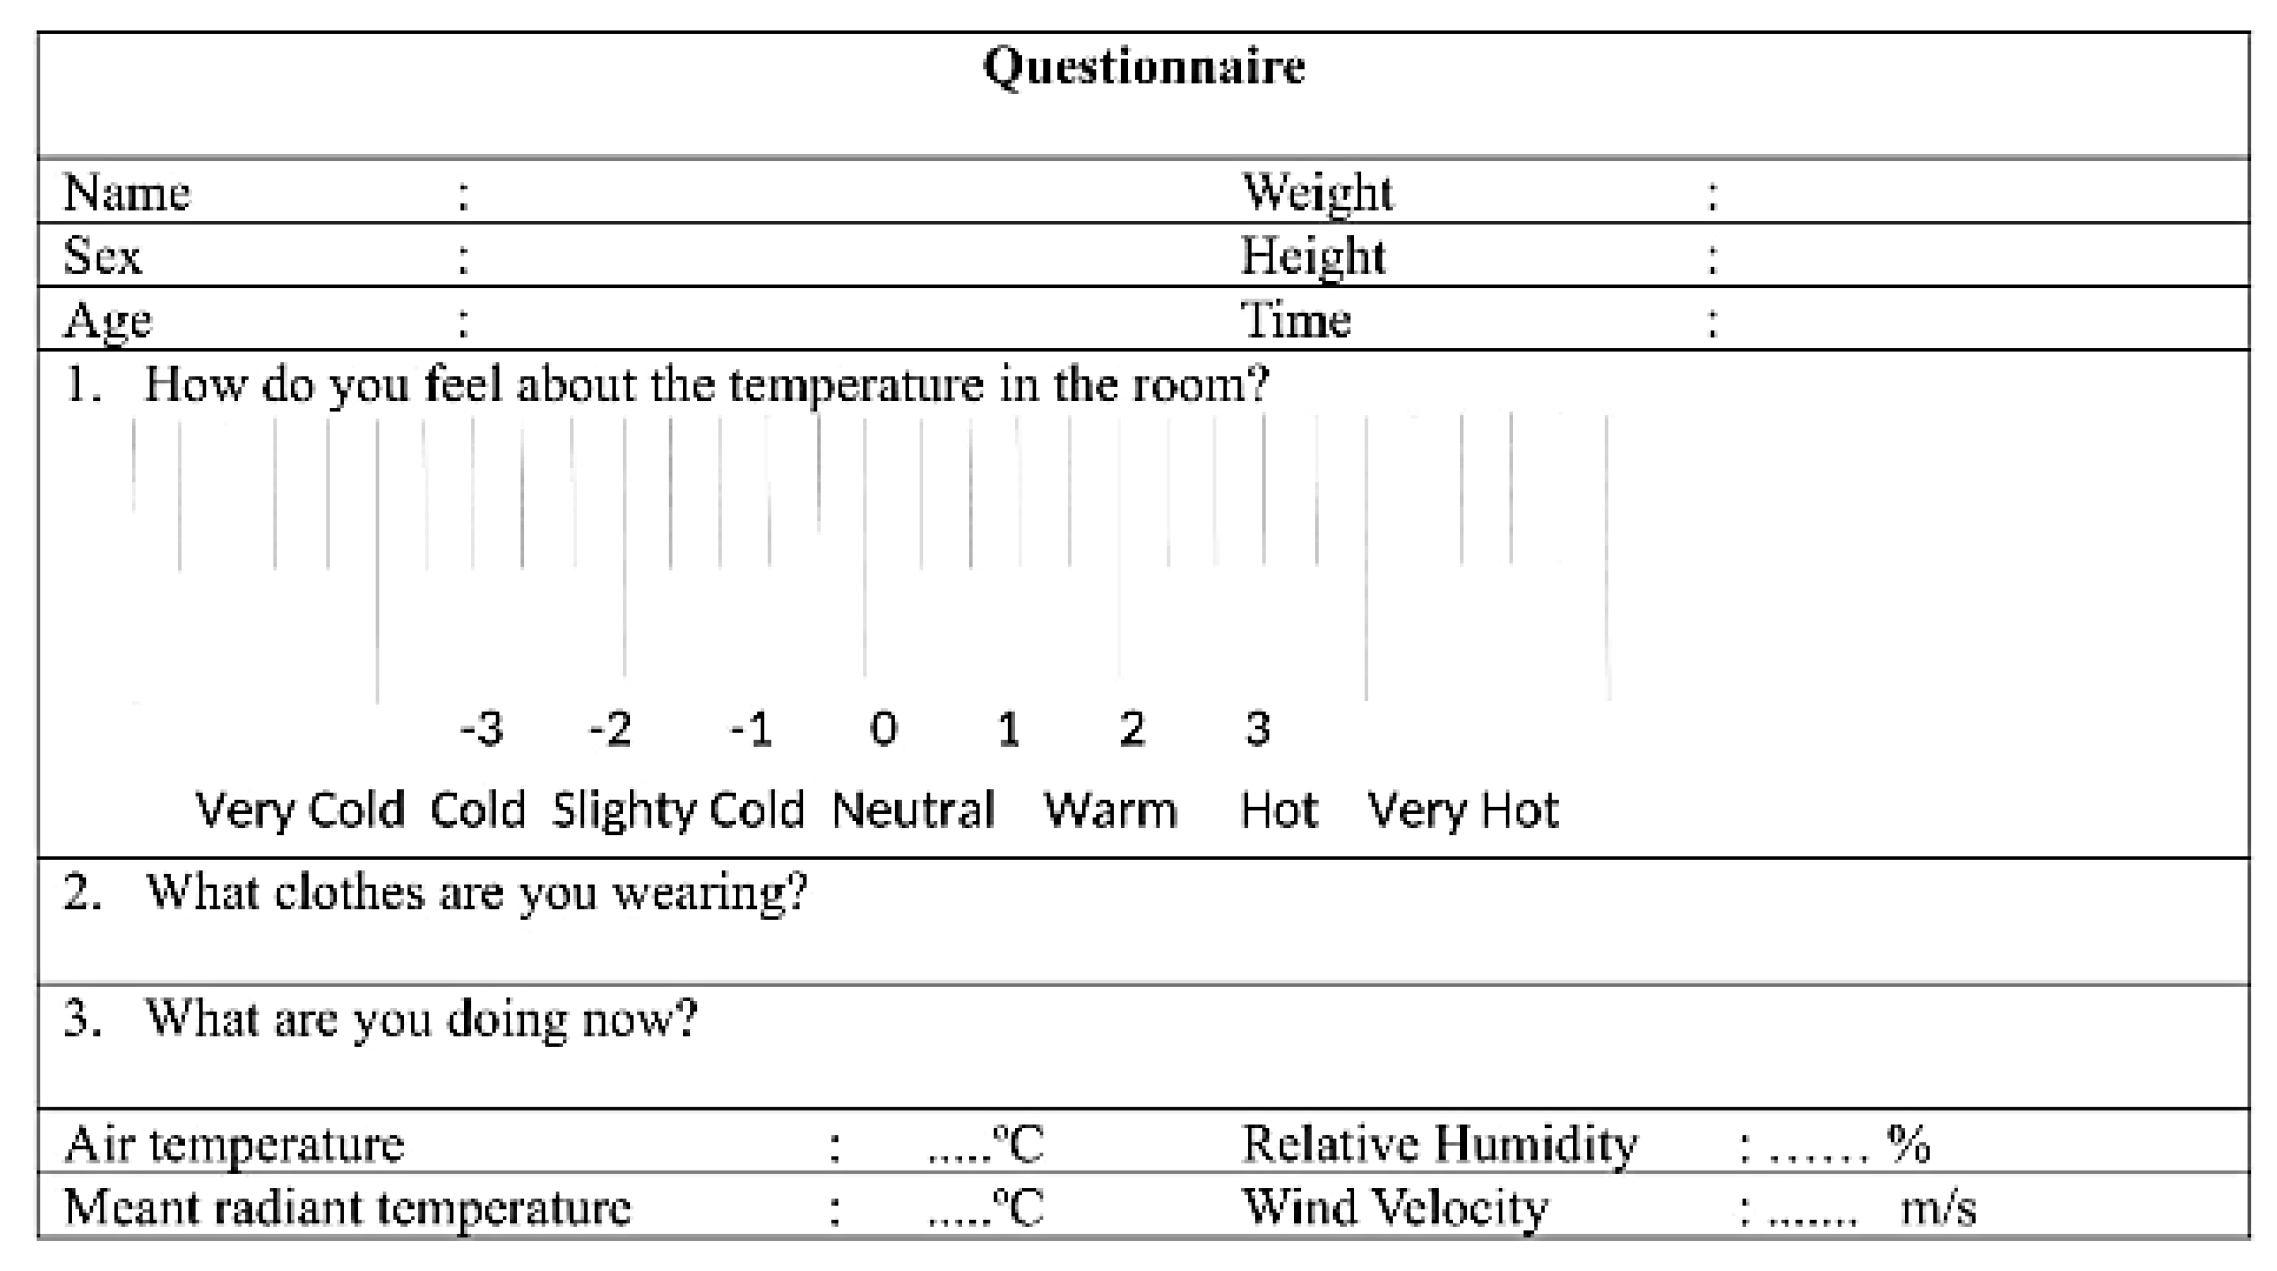
Figure 1. Questionnaire.
Energies 14 07427 g001
Figure 2. The floor plan of the sample houses: (A) exposed stone houses in the mountains, (B) wooden houses in the mountains, (C) exposed brick houses on beaches, and (D) wooden houses on beaches.
Energies 14 07427 g002
Figure 3. The sample houses: (A) exposed stone houses in the mountains, (B) wooden houses in the mountains, (C) exposed brick houses on beaches, and (D) wooden houses on beaches.
Energies 14 07427 g003
Figure 4. The comparison of outdoor and indoor air temperatures in the transitional season from dry to wet seasons: (A) exposed stone houses in the mountains, (B) wooden houses in the mountains, (C) exposed brick houses on beaches, and (D) wooden houses on beaches.
Energies 14 07427 g004
Figure 5. Data of wet season measurement results, (A) exposed stone houses in the mountains, (B) wooden houses in the mountains, (C) exposed brick houses on beaches, and (D) wooden houses on beaches.
Energies 14 07427 g005
Figure 6. Measuring the transitional season from wet to dry seasons: (A) exposed stone houses in the mountains, (B) wooden houses in the mountains, (C) exposed brick houses in beaches, and (D) wooden houses on beaches.
Energies 14 07427 g006
Figure 7. The difference of air temperatures in the transitional season from the dry to wet season.
Energies 14 07427 g007
Figure 8. The difference of air temperatures in the wet season.
Energies 14 07427 g008
Figure 9. The difference of air temperatures in the transitional season from the wet to dry season.
Energies 14 07427 g009
Figure 10. The percentage of thermal sensation of each type of house at the beginning of the wet season (A), in the middle of the wet season (B), and at the start of the dry season (C).
Energies 14 07427 g010
Figure 11. The Olgyay diagrams for exposed stone houses (A) and wooden houses (B) in the mountains.
Energies 14 07427 g011
Figure 12. The Olgyay diagrams for exposed brick houses (A) and wooden houses (B) on beaches.
Energies 14 07427 g012
Figure 13. The psychrometric diagrams for exposed stone houses (A) and wooden houses in the mountains, (B).
Energies 14 07427 g013
Figure 14. The psychrometric diagrams for exposed brick houses (A) and wooden houses on beaches, (B).
Energies 14 07427 g014
Publisher’s Note: MDPI stays neutral with regard to jurisdictional claims in published maps and institutional affiliations.