Article

CFD Analysis of the Influence of the Front Wing Setup on a Time Attack Sports Car’s Aerodynamics

1
Institute of Metrology and Biomedical Engineering, Warsaw University of Technology, 02-525 Warszawa, Poland
2
Institute of Aeronautics and Applied Mechanics, Warsaw University of Technology, 00-665 Warszawa, Poland
*
Author to whom correspondence should be addressed.
Energies 2021, 14(23), 7907; https://doi.org/10.3390/en14237907
Submission received: 19 October 2021 / Revised: 8 November 2021 / Accepted: 20 November 2021 / Published: 25 November 2021
(This article belongs to the Special Issue Future of Road Vehicle Aerodynamics)

Abstract

:
In time attack races, aerodynamics plays a vital role in achieving short track times. These races are characterized by frequent braking and acceleration supported by aerodynamic downforce. Usually, typical cars are modified for these races by amateurs. Adjusting the aerodynamic solutions to work with bodies developed for other flow conditions is difficult. This paper presents the results of a numerical analysis of the effects of installing a straight wing in front of or above the body on the modified vehicle system’s aerodynamic characteristics, particularly on the front wheels’ aerodynamic downforce values. The paper presents the methodology and results of calculations of the aerodynamic characteristics of a car with an additional wing placed in various positions in relation to the body. The numerical results are presented (Cd, Cl, Cm, Clf, Clr), as well as exemplary pressure distributions, pathlines, and visualizations of vortex structures. Strong interactions between the wing operation and body streamline structure are shown. An interesting and unexpected result of the analysis is that the possibility of obtaining aerodynamic downforce of the front wheels is identified, without an increase in aerodynamic drag, by means of a wing placed in a proper position in front of the body. A successful attempt to balance the additional downforce coming from the front wing on the front axle is made using a larger spoiler. However, for large angles of attack, periodically unsteady flow is captured with frequency oscillations of ca. 6–12 Hz at a car speed of 40 m/s, which may interfere with the sports car’s natural suspension frequency.

Graphical Abstract

1. Introduction

Vehicles are usually equipped with inverted rear wings to compensate for aerodynamic body lift. Sometimes they are so effective that together with the body they generate aerodynamic force, pressing the vehicle against the road.
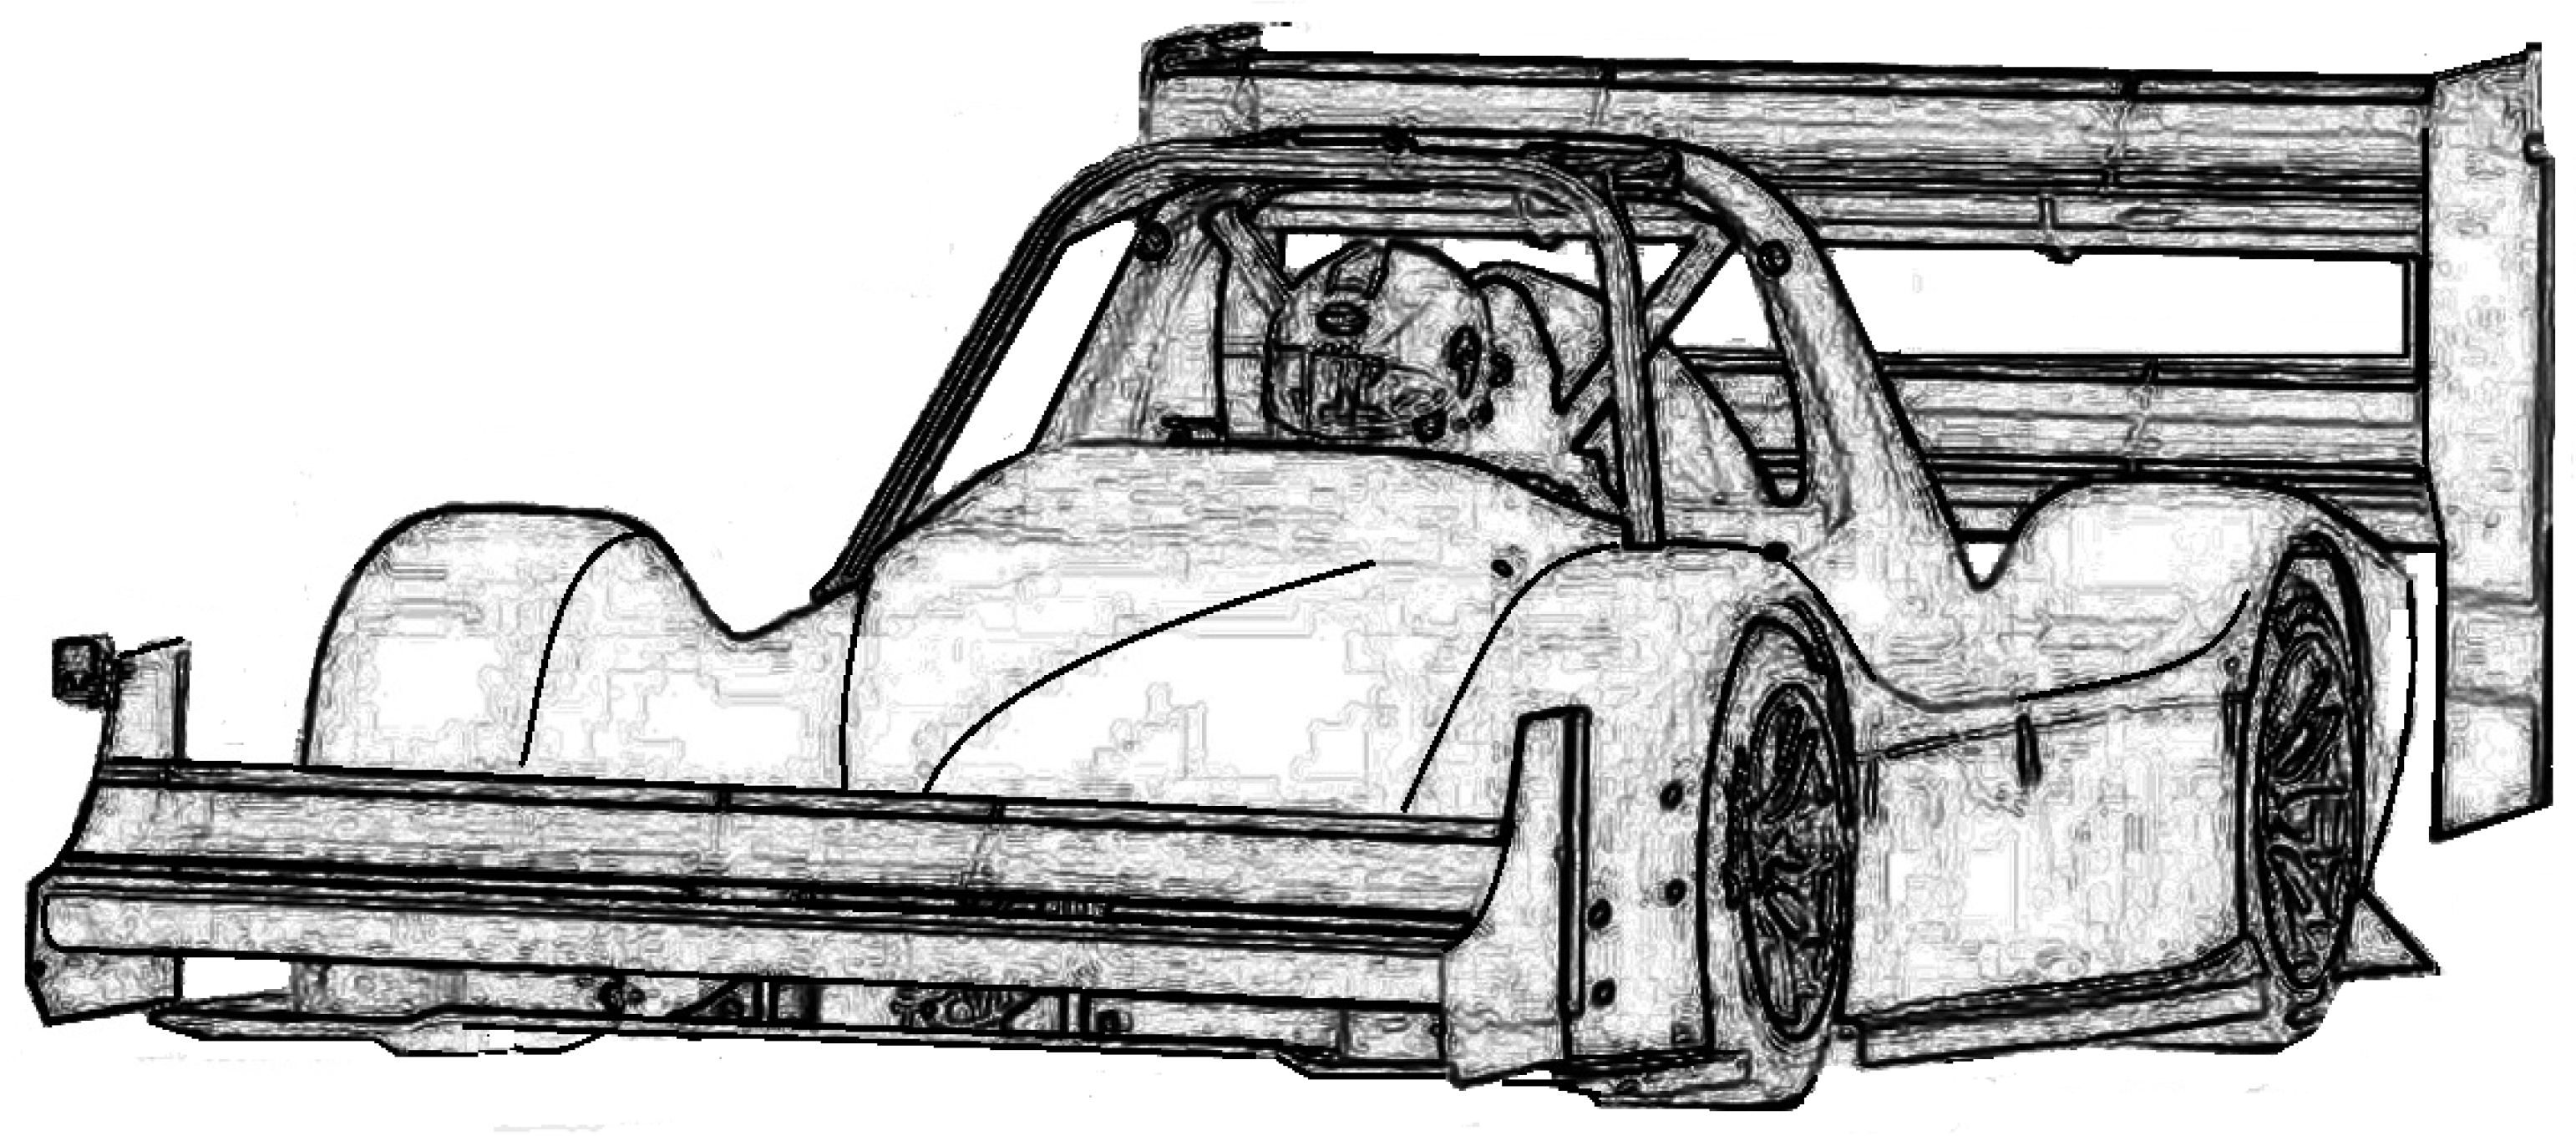
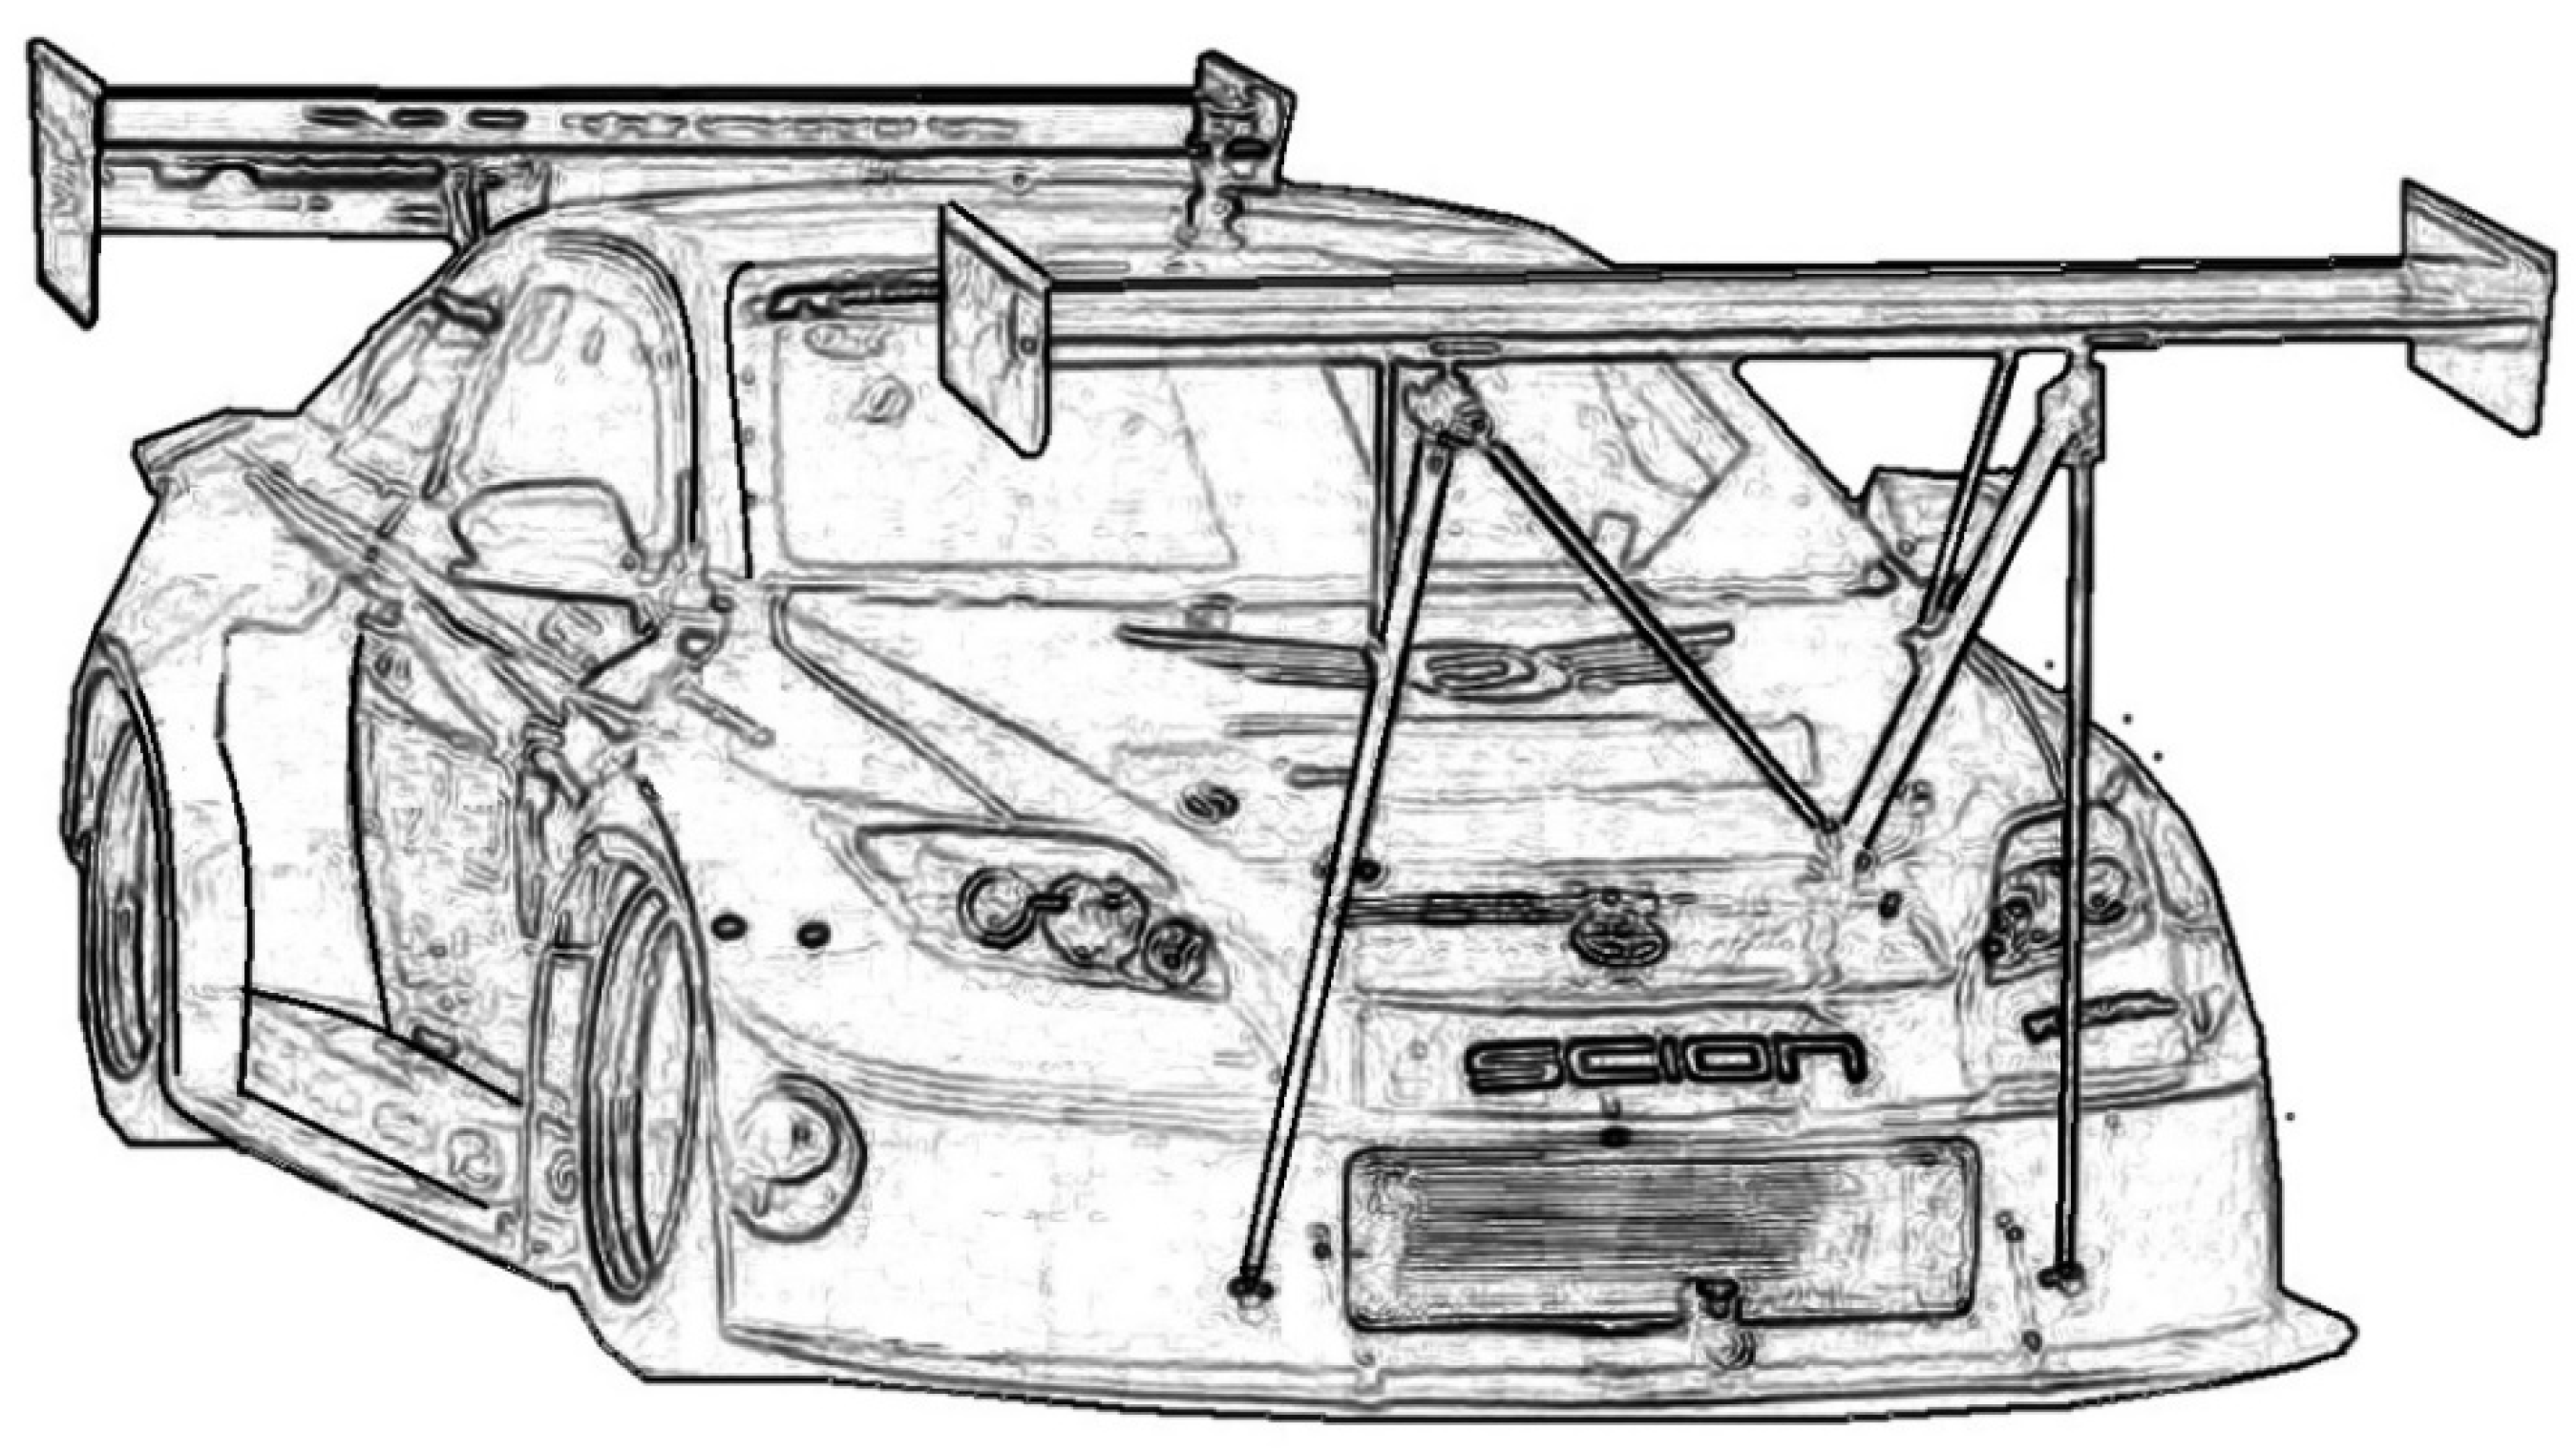
A lot of work is devoted to rear and front wings on open-wheel vehicles. Front wings have been a feature of open-wheel racing cars since the 1960s. In contrast, front wings are extremely rarely used in motorsports on vehicles with covered wheels. Examples of such unusual features include the Toyota TMG-EV-P002 (Figure 1) built for mountain racing and some cars used in time attack racing (
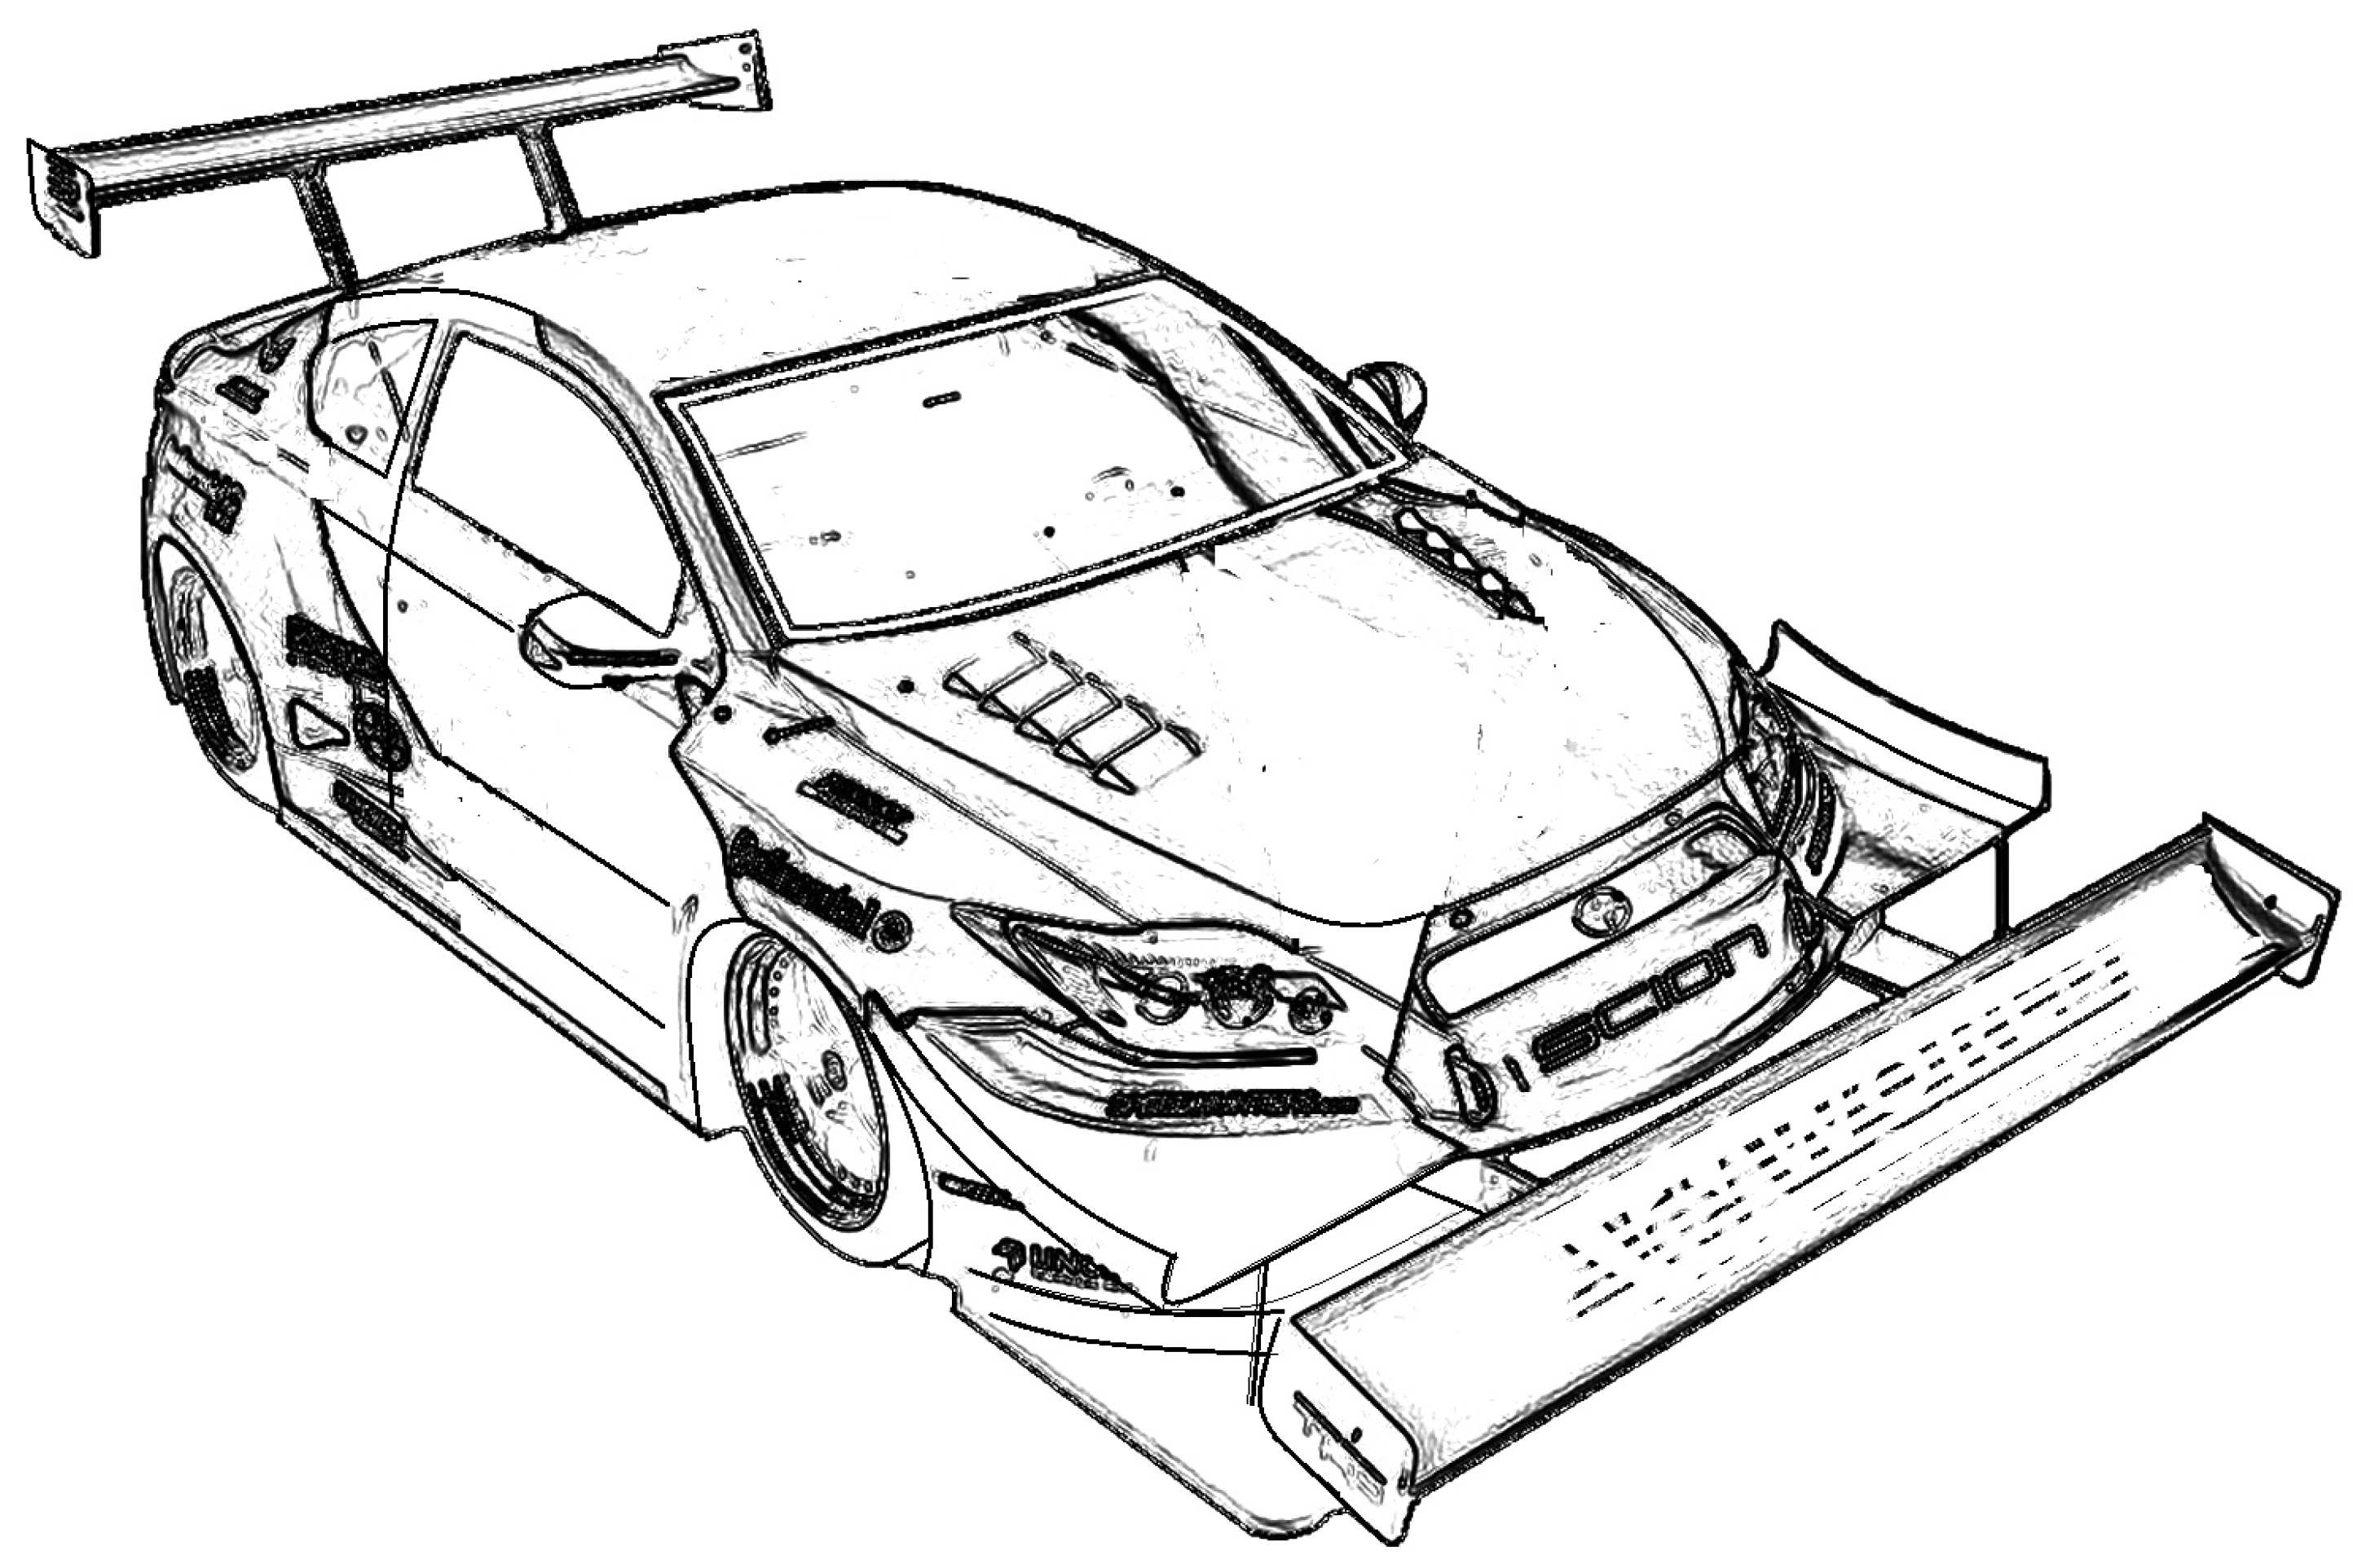
Figure 2, Figure 3 and Figure 4).
An example is a mountain race held annually named the Pikes Peak International Hill Climb (PPIHC), where cars ascend Pikes Peak in Colorado, USA. The track is 12.42 miles (19.99 km) long with 156 turns, and an elevation difference of 4720 ft (1440 m) from the start at Mile 7 on the Pikes Peak Highway to the finish at 14,115 ft (4302 m), with an average gradient of 7.2%.
To achieve high aerodynamic downforce, mountain racing at relatively high altitudes (2000 m) requires large wing areas to provide downforce. Going uphill with an average gradient of 7% and the need to accelerate after successive turns and brake sharply before the next turns requires a high aerodynamic force on the front wheels.
The sport popularly known as time attack has grown over the last ten years [1,2], primarily because of the generally open regulations. According to participants, 60% of the design of very fast time attack cars is influenced by aerodynamic solutions, 20% by the engine and drivetrain, and the remaining 20% by the structural reinforcement used to transfer aerodynamic and drivetrain forces and inertia forces resulting from aerodynamic influence. Aerodynamics in the sport of time attack plays a very big role in this class. The participants create the aerodynamic solutions based on their own knowledge and experience. The powertrains of the cars are very different, including front-drive, rear-drive, and all-wheel-drive systems.
The purpose of this paper is to attempt to explain the complex interactions between a front inverted wing and body flow structure and to help designers use this unusual way of increasing the front axle downforce. While there are many papers devoted to the front wings of cars with exposed wheels, there is only one paper devoted to the front wing for a car with covered wheels [3].
The main problem arising from the use of wings in the front of vehicle arises from their strong influence on the flow structure over the rest of the vehicle. In the early period of development of open-wheel racing car designs, front wings, usually one- or two-segmented, were fitted to bulky bodies with radiators, along with a central air intake. Further vehicle shapes evolved to reduce the cross-sectional area of the front of the body and to lower it. As the aerodynamic study of racing cars progressed, both experimentally and aerodynamically, the front wings moved away from the narrower front ends of the bodies, moving closer to the roadway.
For racing class cars, regulations have an extremely strong influence on the development of their designs and shapes. Aerodynamic solutions are developed within a strict framework set by the regulations. The regulations, in turn, are based on the conclusions of analyses, mainly track safety analyses and analyses of the attractiveness of the course, usually resulting from overtaking opportunities.
Mountain and time attack races have much more open regulations, allowing for more innovative aerodynamic solutions. For the vehicles used in time attack races, popular sports cars converted for racing are used. Therefore, the bodies themselves are typical and additional aerodynamic components are fitted to them. This makes it significantly more difficult to fit them together.
The typical way to achieve aerodynamic downforce on the front wheels is to use a flat plate called a splitter, placed as close to the ground as possible and located in front of the body. This solution is simple and effective but has a few drawbacks. The most significant disadvantage is the strong dependence of the splitter’s action on the momentary ground clearance values under the plate. In races with rapid braking and acceleration, the use of sprung wheel suspensions causes large changes in the splitter’s momentary distance from the ground. This element located close to the road is very susceptible to damage.
For this reason, other solutions are being sought. One of them involves triangular plates called canards located on the front side surfaces of the body. They generate aerodynamic forces that press the body to the road, and at the same time reduce its aerodynamic resistance. This is a very good solution, although the downforce values achieved are limited by the relatively small size of the tiles.
A drastic solution is to use a wing in front of the body to generate the downforce. In practice, the seemingly effective solution significantly loses its effectiveness due to the interaction between the wing and the body flow structure.
This paper will present the results of numerical analyses of vehicle characteristics with different front wing layouts.
The literature on wings used to generate aerodynamic downforce is extensive but not very related to the problem of front wing interaction with a covered-wheel car, as analyzed in this paper.
There is a large body of work devoted to the aerodynamic characteristics of the wing themselves, and in particular wings placed near the ground.
Knowles et al. [4] presented an aerodynamic study of a wing operating near the ground.
The studies by Mokhtar [5,6,7] and Mokhtar et al. [8] presented the results of numerical calculations of the aerodynamic characteristics of wings near the ground, including an inverted wing. Zerihan and Zhan in [9,10,11,12] presented the experimental results from simple one-element and two-element wings operating near the ground, along with the effects of using a Gurney flap. Ratzenbach et al. [13] presented the numerical and experimental results for a multi-element wing operating near the ground. Angle et al. [14] numerically studied the longitudinal stability of a wing with a transverse gap binding the two surfaces of the airfoil. Ahmed et al. [15] presented the experimental results for a wing placed over a moving wind tunnel floor. Lee et al. [16,17] analyzed the effects of distance of an oscillating wing from the ground and the effects of ground undulation on its aerodynamic characteristics. McBeath [18] has extensively discussed the use of a front wing with multi-element airfoils, Gurney flaps, and edge plates.
Many studies are available in the literature on the interactions of wings placed low to the ground with uncovered wheels behind them. Most of the articles are related to Formula 1 cars.
The study by Basso et al. [19] presented an analysis of the interaction of a front wing with a Gurney flap on the components of a Formula 1 car. Some of these studies, such as the study by Roberts et al. [20], have dealt with the operation of a front wing during curved or slanted inflow. Katz [21] presented a model for the generation of aerodynamic downforce caused by the interaction of the front and rear wings with the exposed wheels of a car based on the panel method. Katz [22] presented an analysis of front wing performance near the ground and the effect of a Gurney flap. Martins et al. [23] studied the effect of the slender fuselage of a car with a flap on the pressure distribution in the wake behind the uncovered wheel behind it. Diasinos et al. [24] studied the effect of wing span on the aerodynamic characteristics near the ground. The studies by Diasinos et al. [25,26] presented problems involving front wing interactions with exposed wheels. Ogawa et al. [27] presented problems and solutions related to the integration of a front wing with the wheels and body of an F1 vehicle. Correia et al. [28] presented the scale effect on the aerodynamic characteristics of a single-element inverted wing in terms of ground effects.
There are quite a few studies on the interactions of rear wings with cars with shielded wheels. The classic study is that by Katz et al. [29], in which the interaction of a rear wing with a body with covered wheels and long diffuser channels is presented. Gogal and Sakurai [30] demonstrated the effects of rear wing end plates on performance under oblique inflow. Kurec et al. [31] presented the impact of the position of the rear wing on the aerodynamic loading on both axles of a car with covered wheels, along with changes in braking performance. Broniszewski and Piechna [32] presented a coupled simulation of car dynamics and aerodynamics with a movable rear wing.
The only paper devoted to the interaction of the front wing with the body of a car with covered wheels is that by Piechna et al. [3], in which the strong interaction of the front wing on the pressure distributions on the body of the car and the reduction of its effectiveness are shown.

2. Materials and Methods

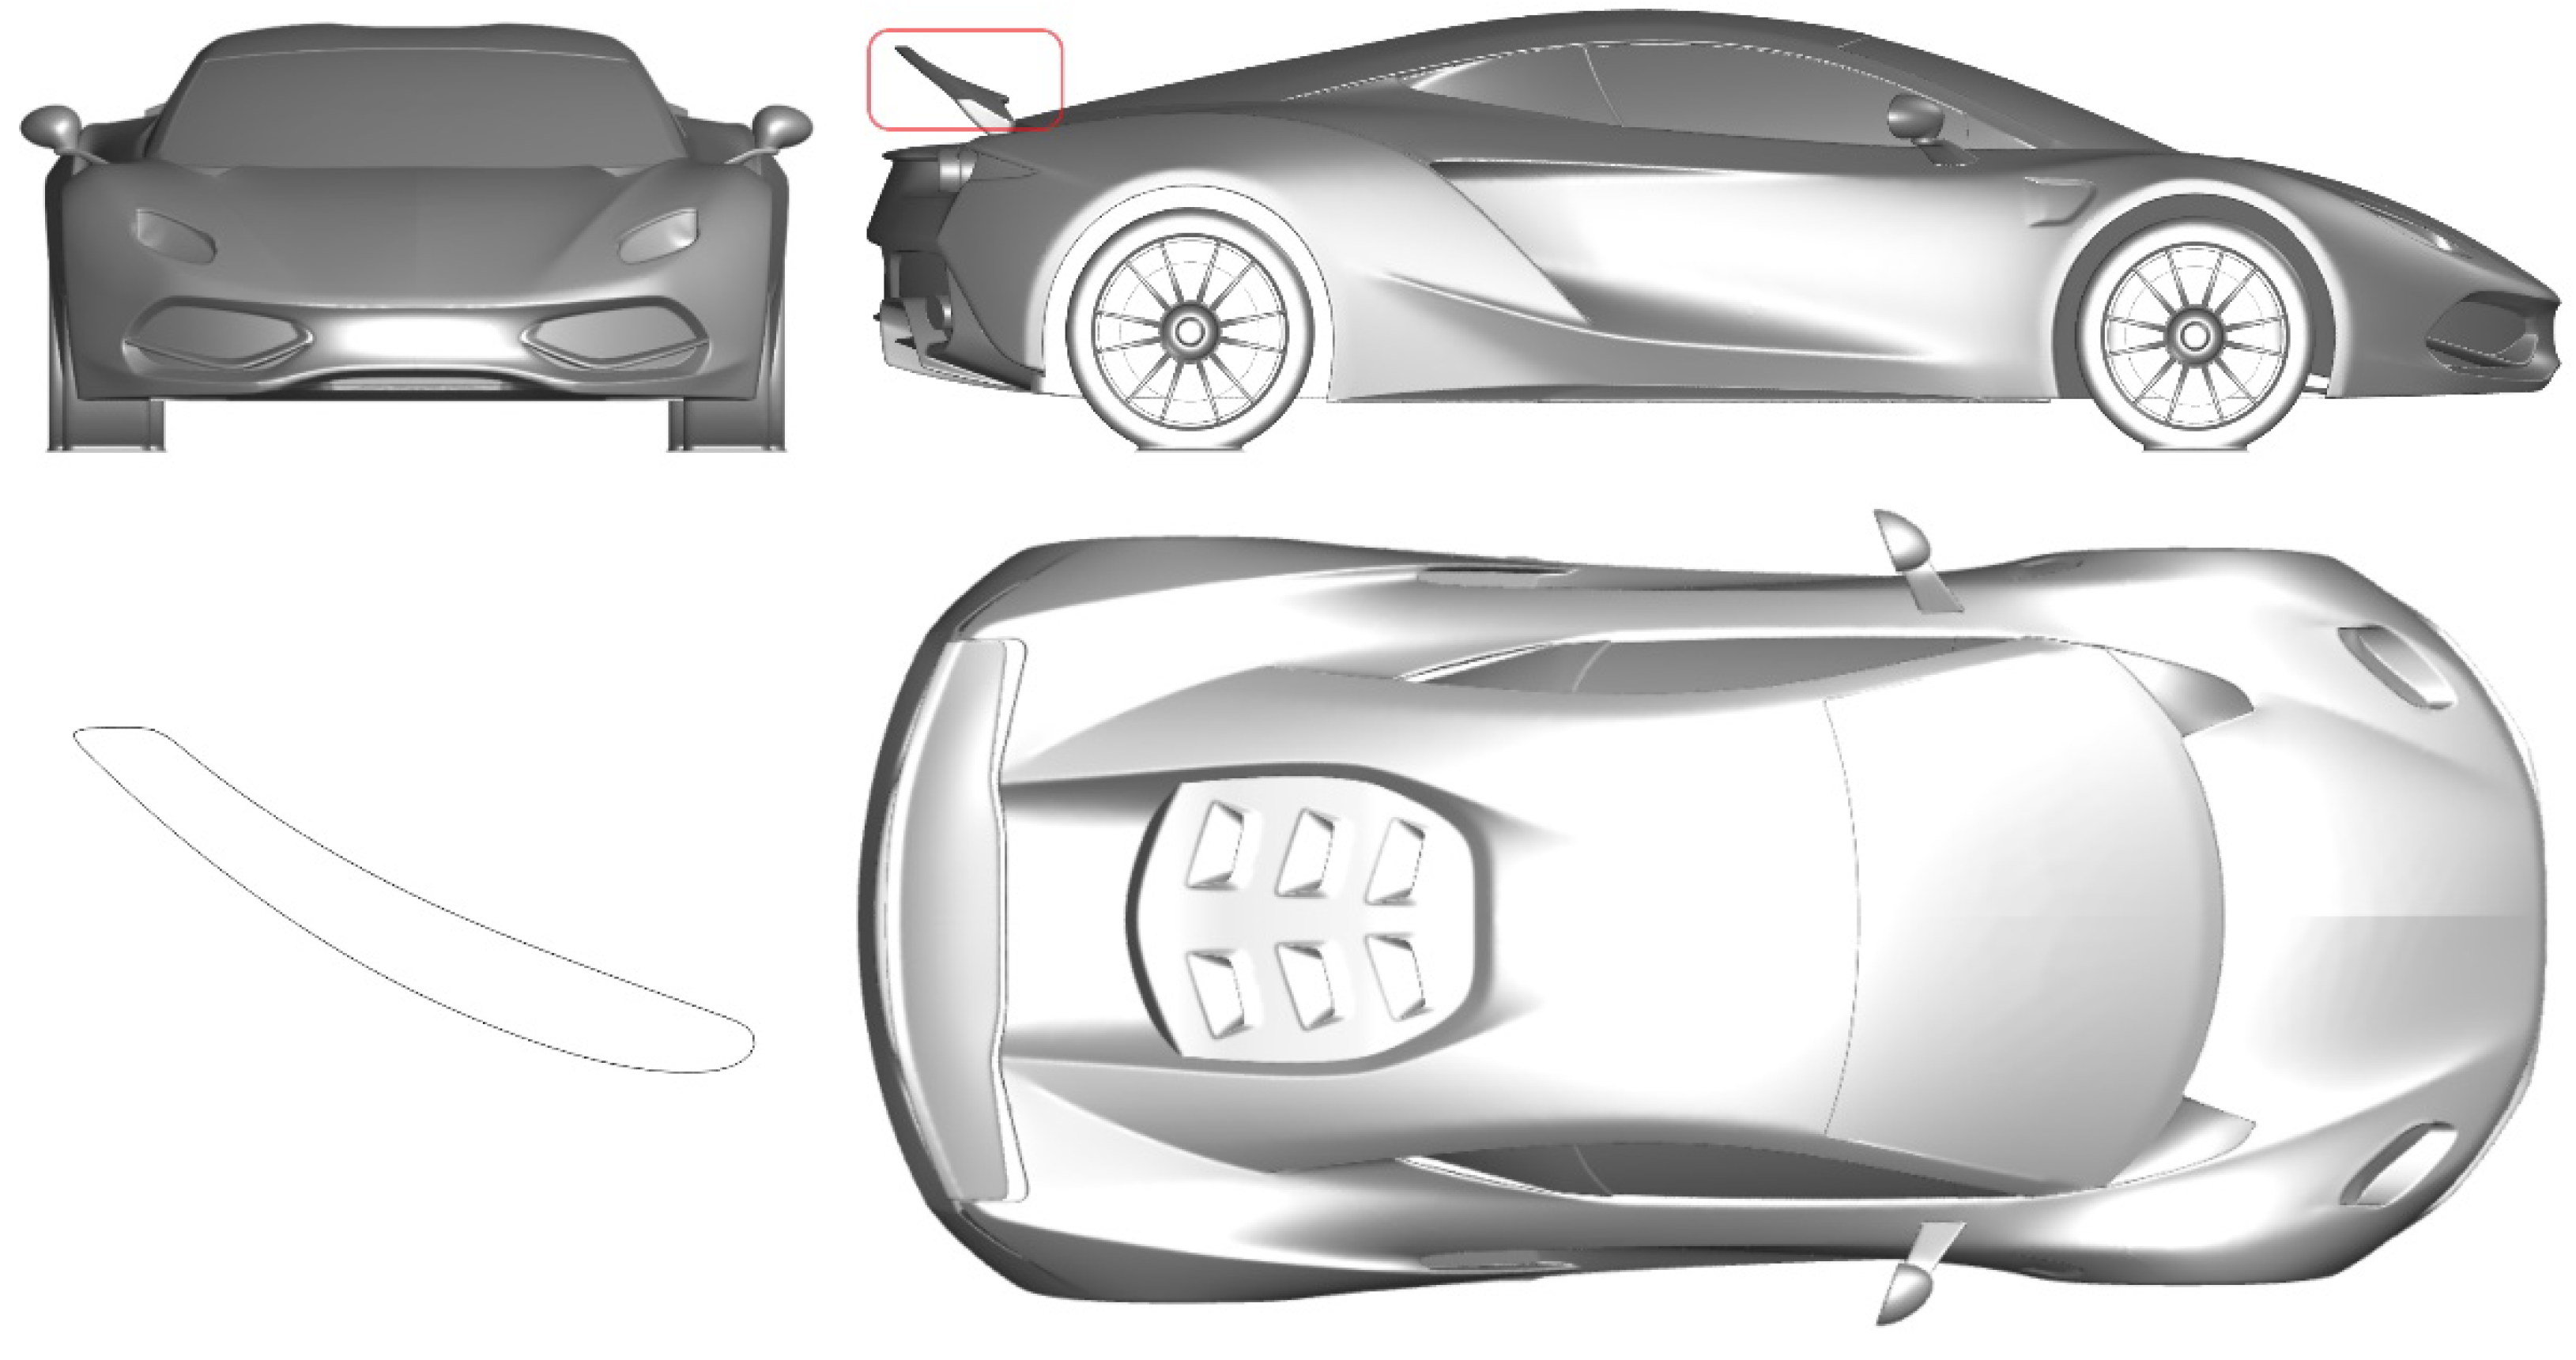
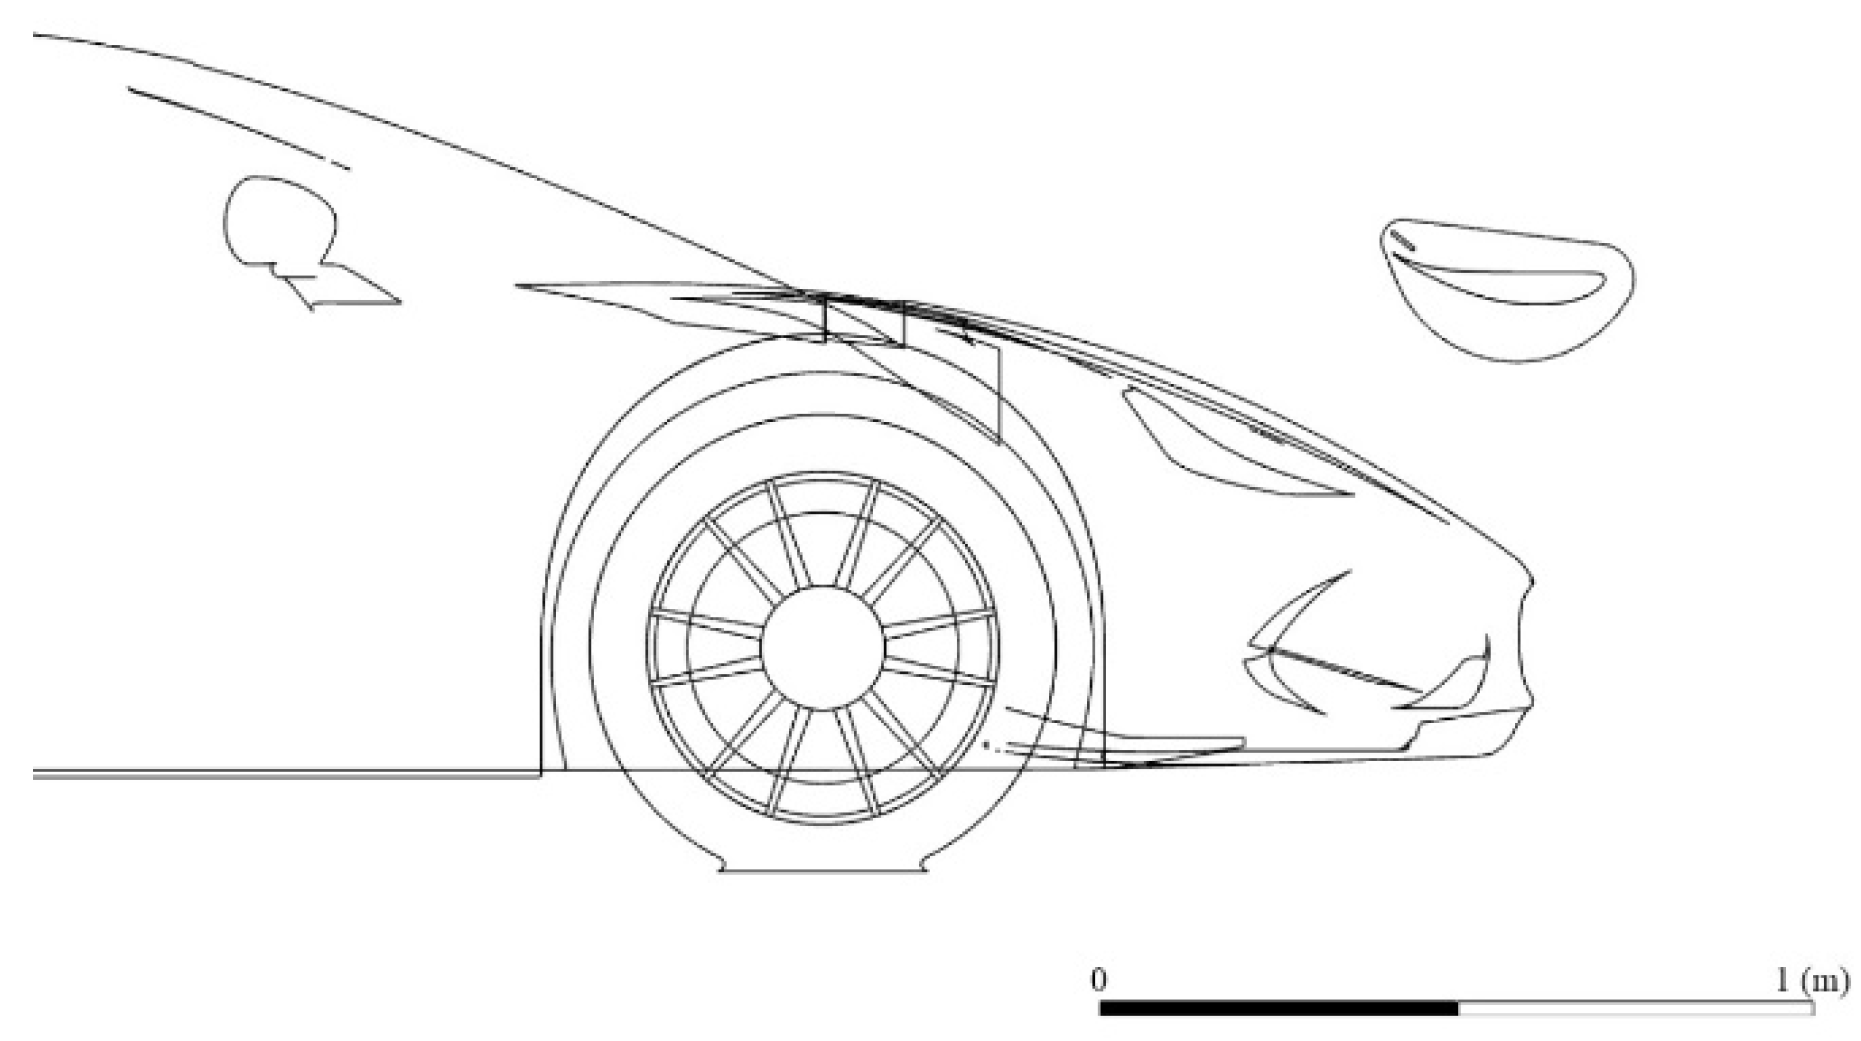
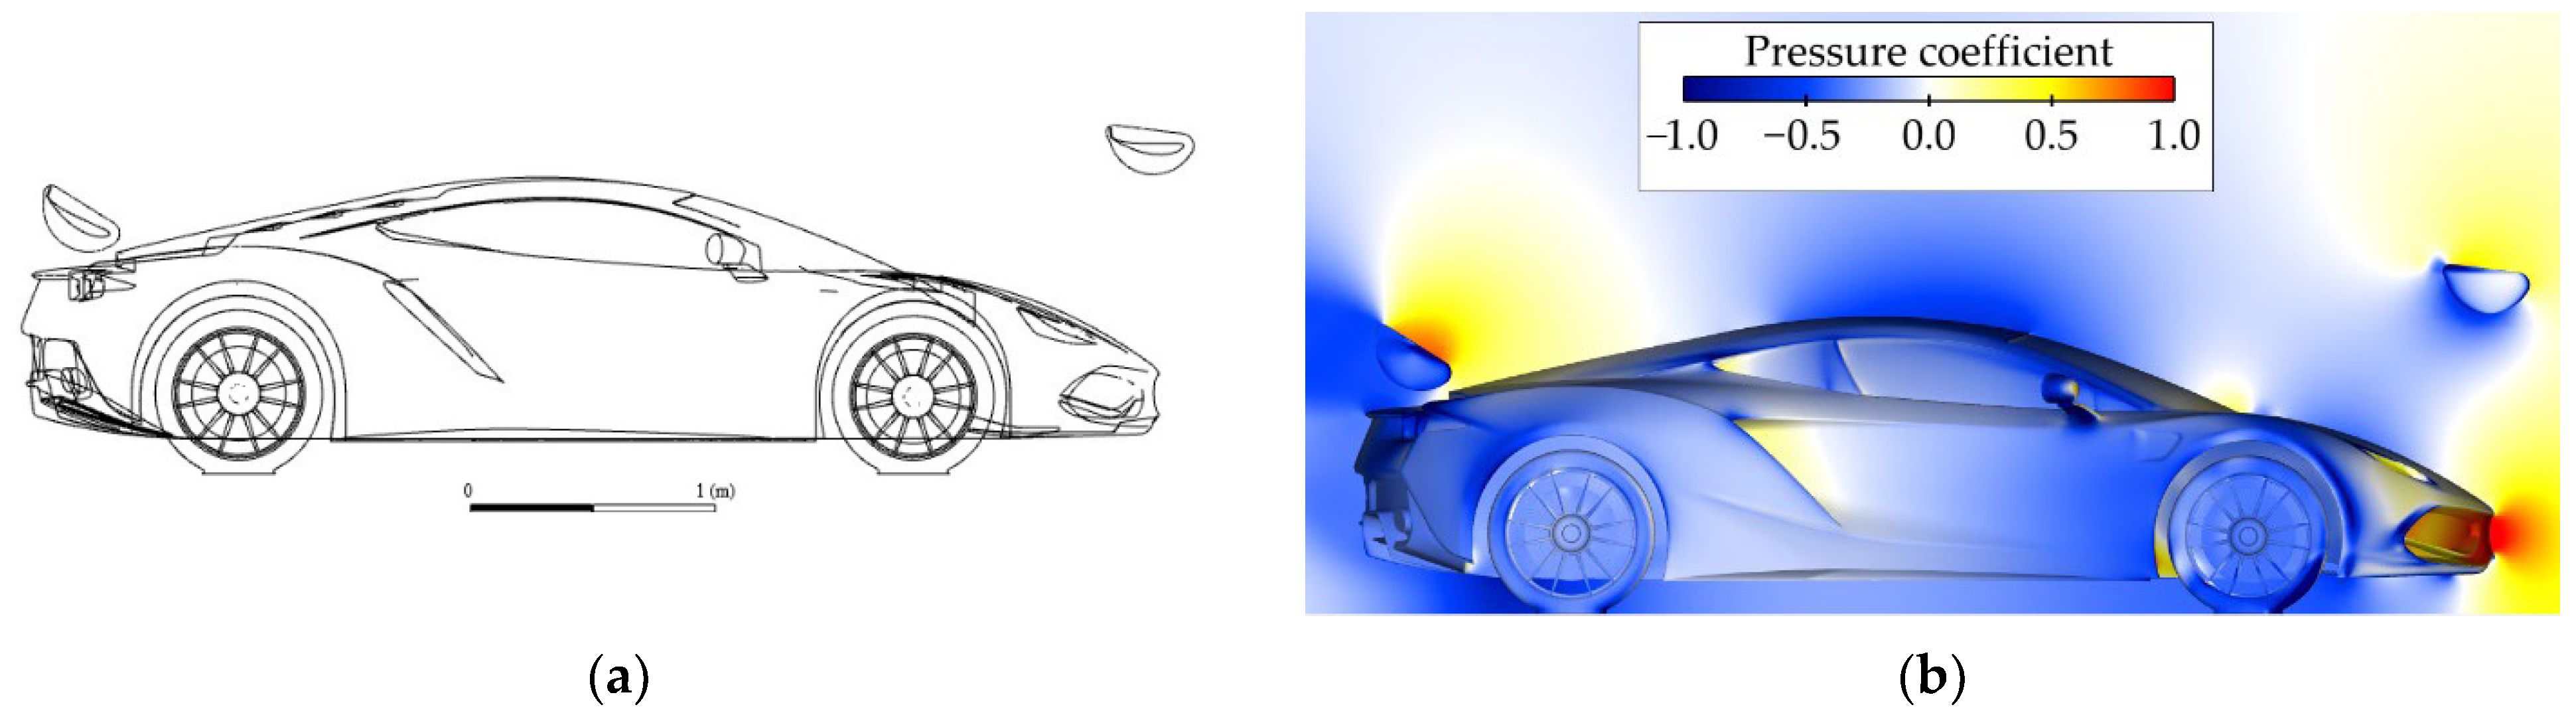
The analyzed geometry was for an Arrinera Hussarya Polish supercar (manufacturer Arrinera Automotive S.A. based in Warsaw, Poland), with a moderate rear spoiler and without a splitter. At the rear of the plain underside, there is a moderate diffuser. Details of the wheels and mirrors were modelled. The idea was to analyze the configurations of front wings in a realistic context, whereby the main features affecting the car’s aerodynamics would be presented. The geometry is shown in Figure 5.
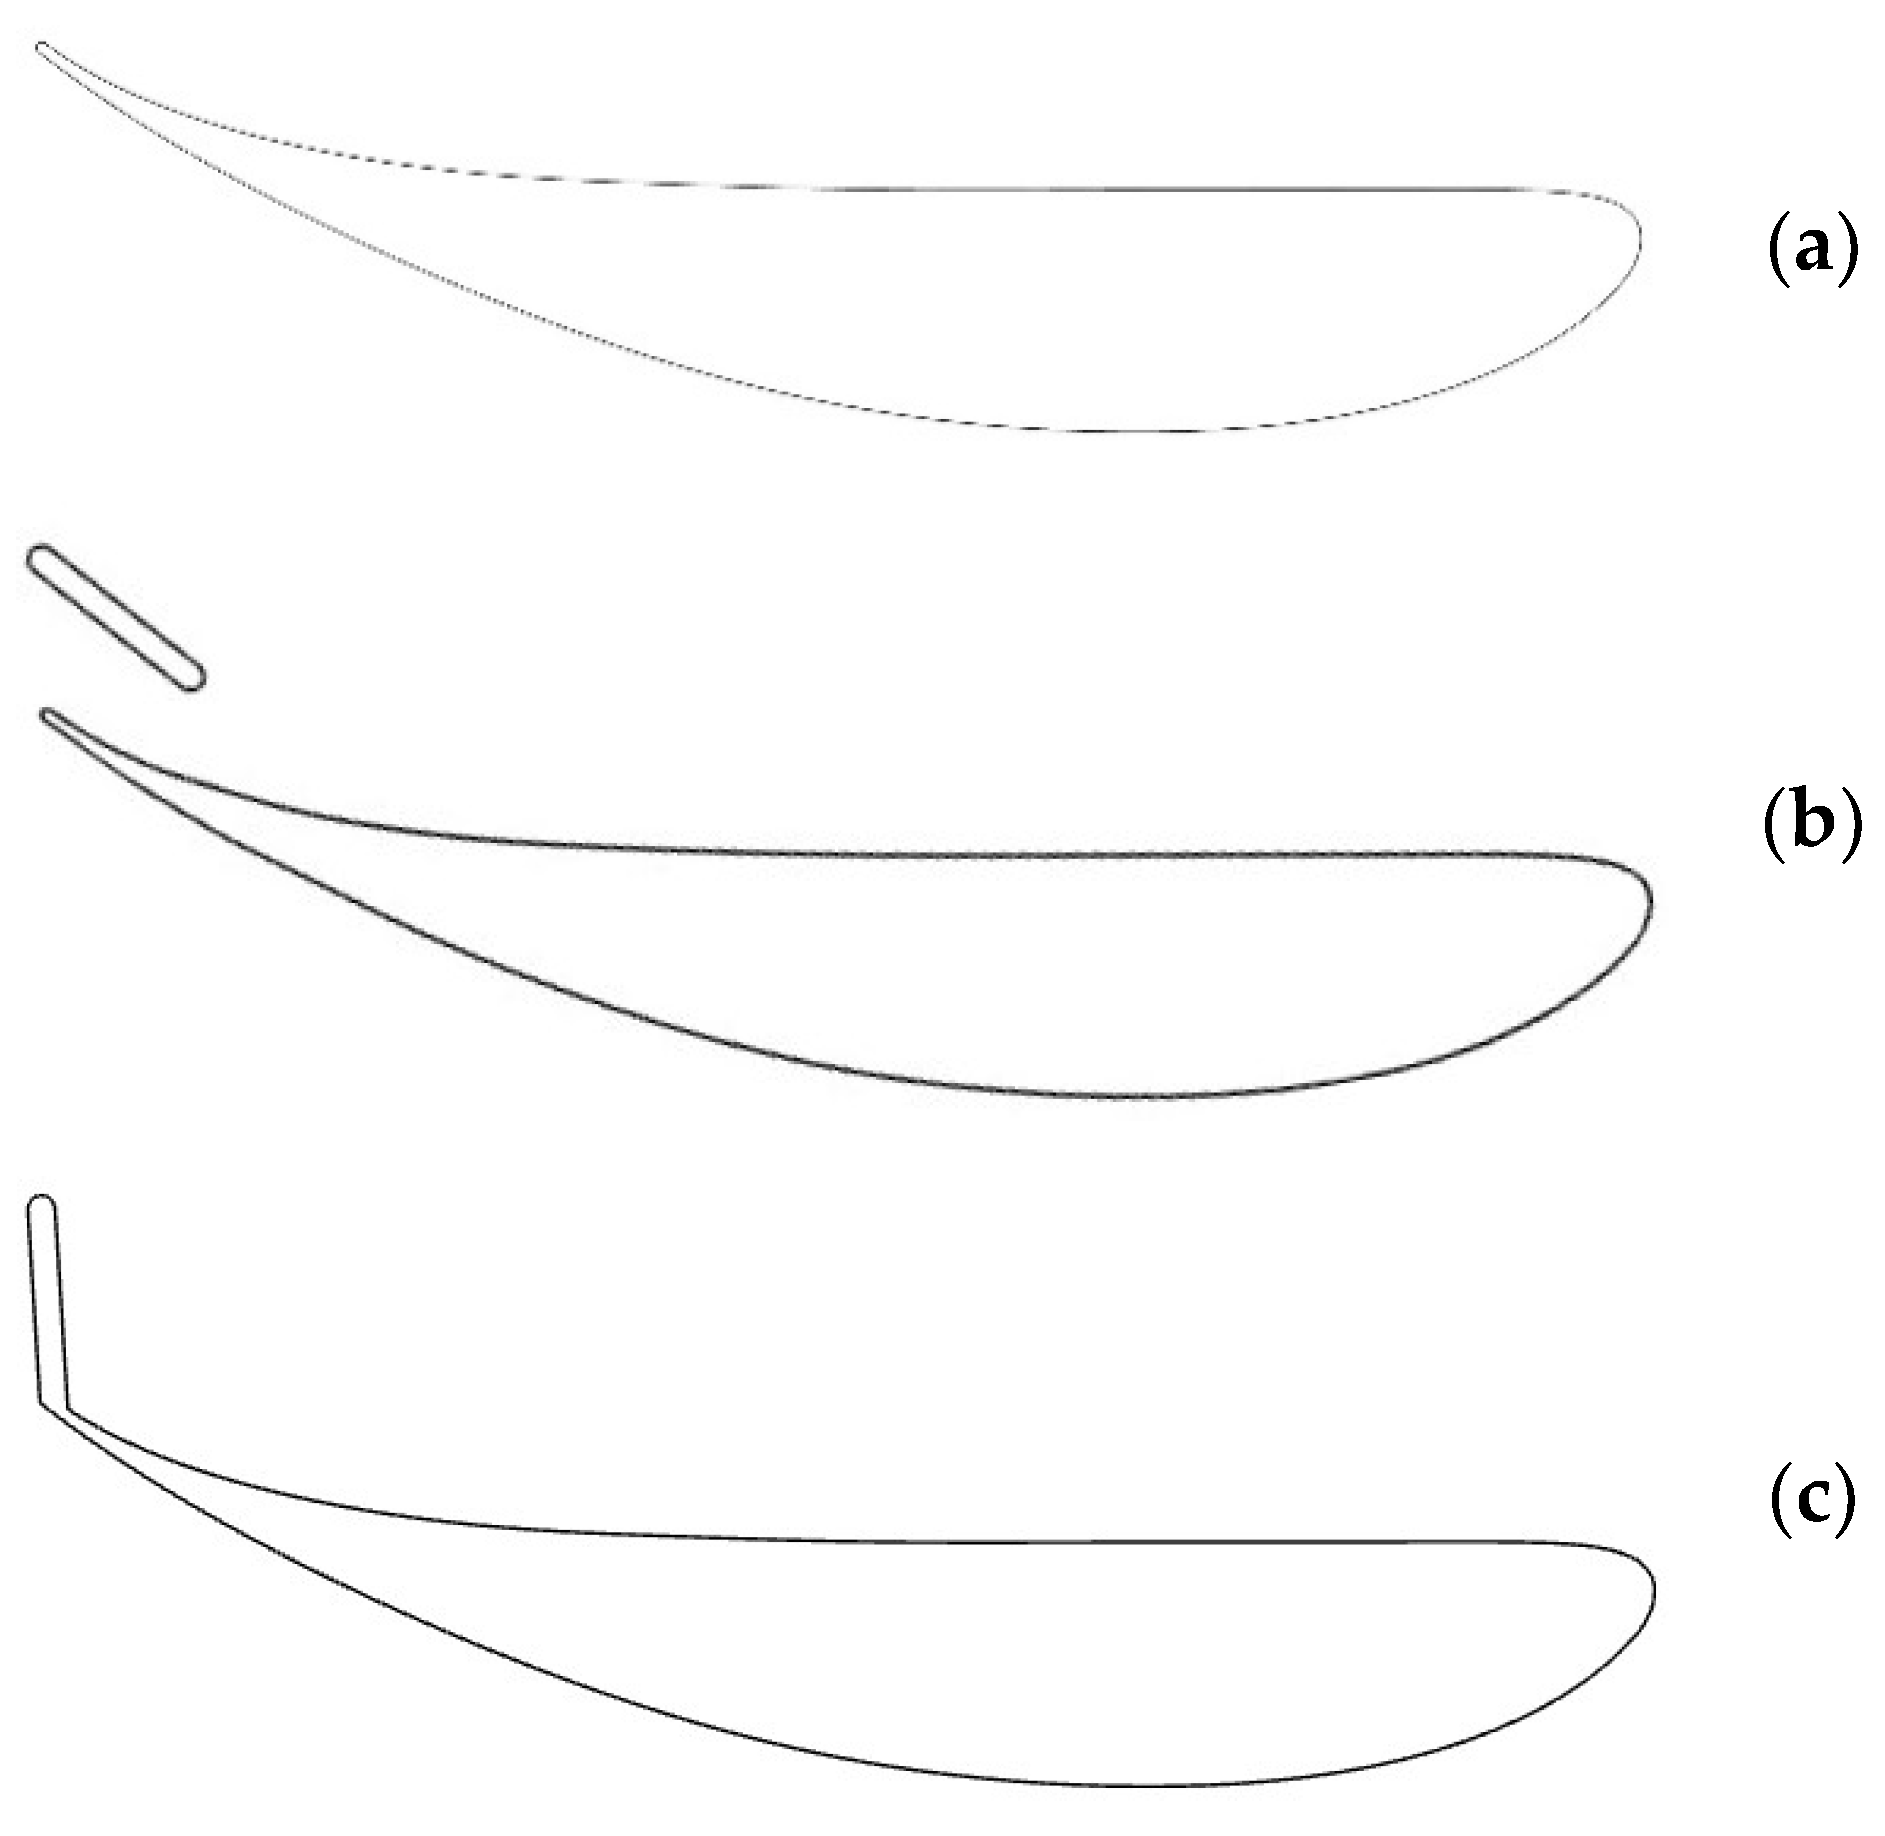
Two wing types, shown in Figure 6, were used in the study, namely a clean wing and a wing with a Gurney flap, which could be turned on or off.
The front wing needs to be attached to the main car body with an appropriate structure. The structure itself may alter the car’s aerodynamic performance. However, there are numerous possible configurations for attaching the front wing to the car, as shown in Figure 2, Figure 3 and Figure 4. In some cases, it may be possible to modify the front of the car and hide the front wing in the body outline. For this reason, the modelling of wing supports was neglected.
Lift and drag coefficients Cl and Cd are defined as forces divided by ½ρv2A, where reference values of density ρ = 1.225 kg/m3, velocity v = 40 m/s, and the area of A = 0.9879 m2 are used. The area corresponds to the projected front area of a symmetric half of the car.
The pitching moment was computed along an axis placed in the middle of the distance between car axles. The distance between the axles was 2.655 m. The positive moment coefficient indicates the downforce on the front axle. The moment coefficient is calculated as:
C m = C l r r r C l f r f ,
where in the studied case rr = rf = 1.3275 m, which is nondimensionalized by (rr + rf). Clf and Clr are lift coefficients at the front and rear axles, respectively:
C l = C l f + C l r .
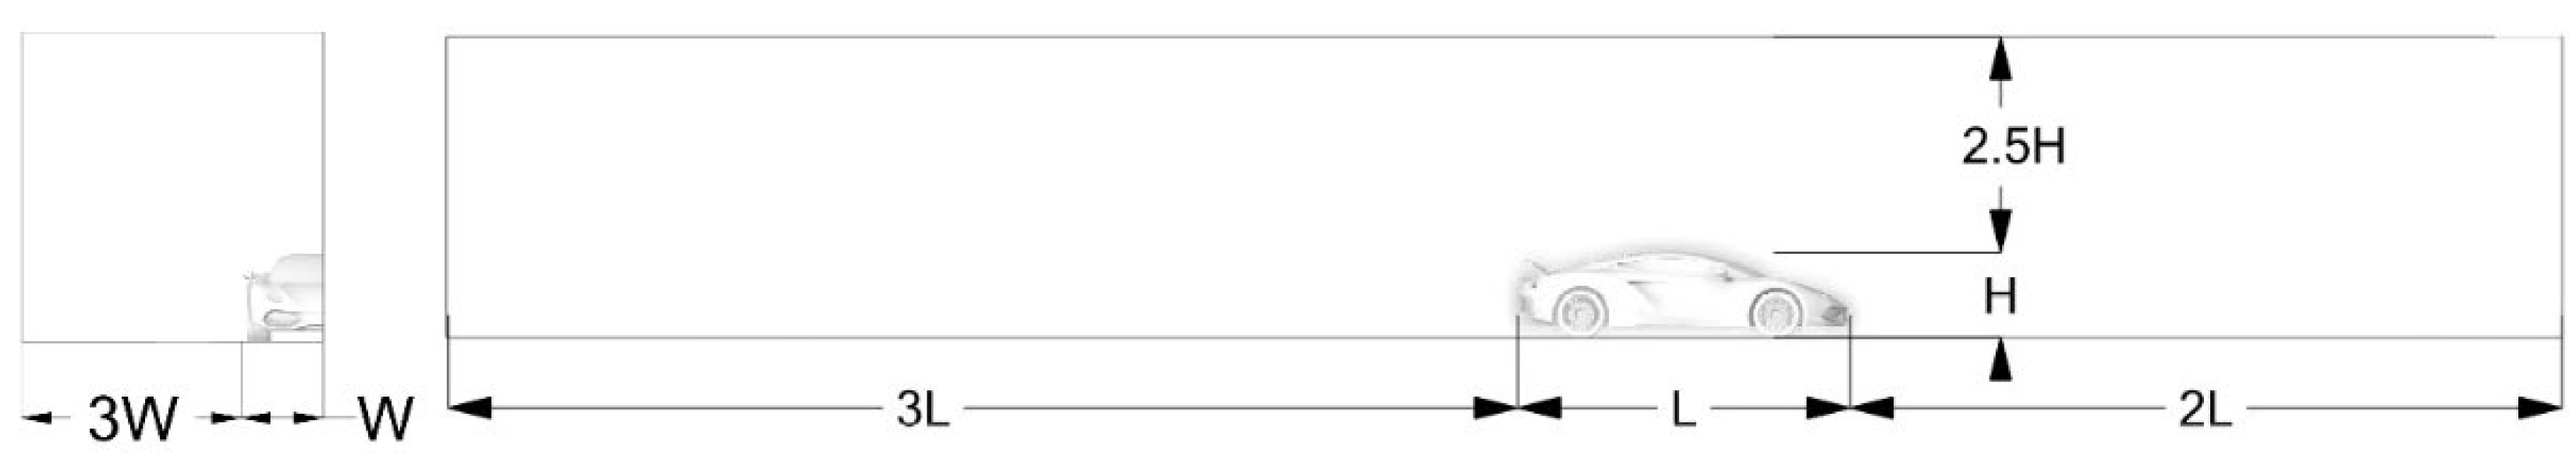
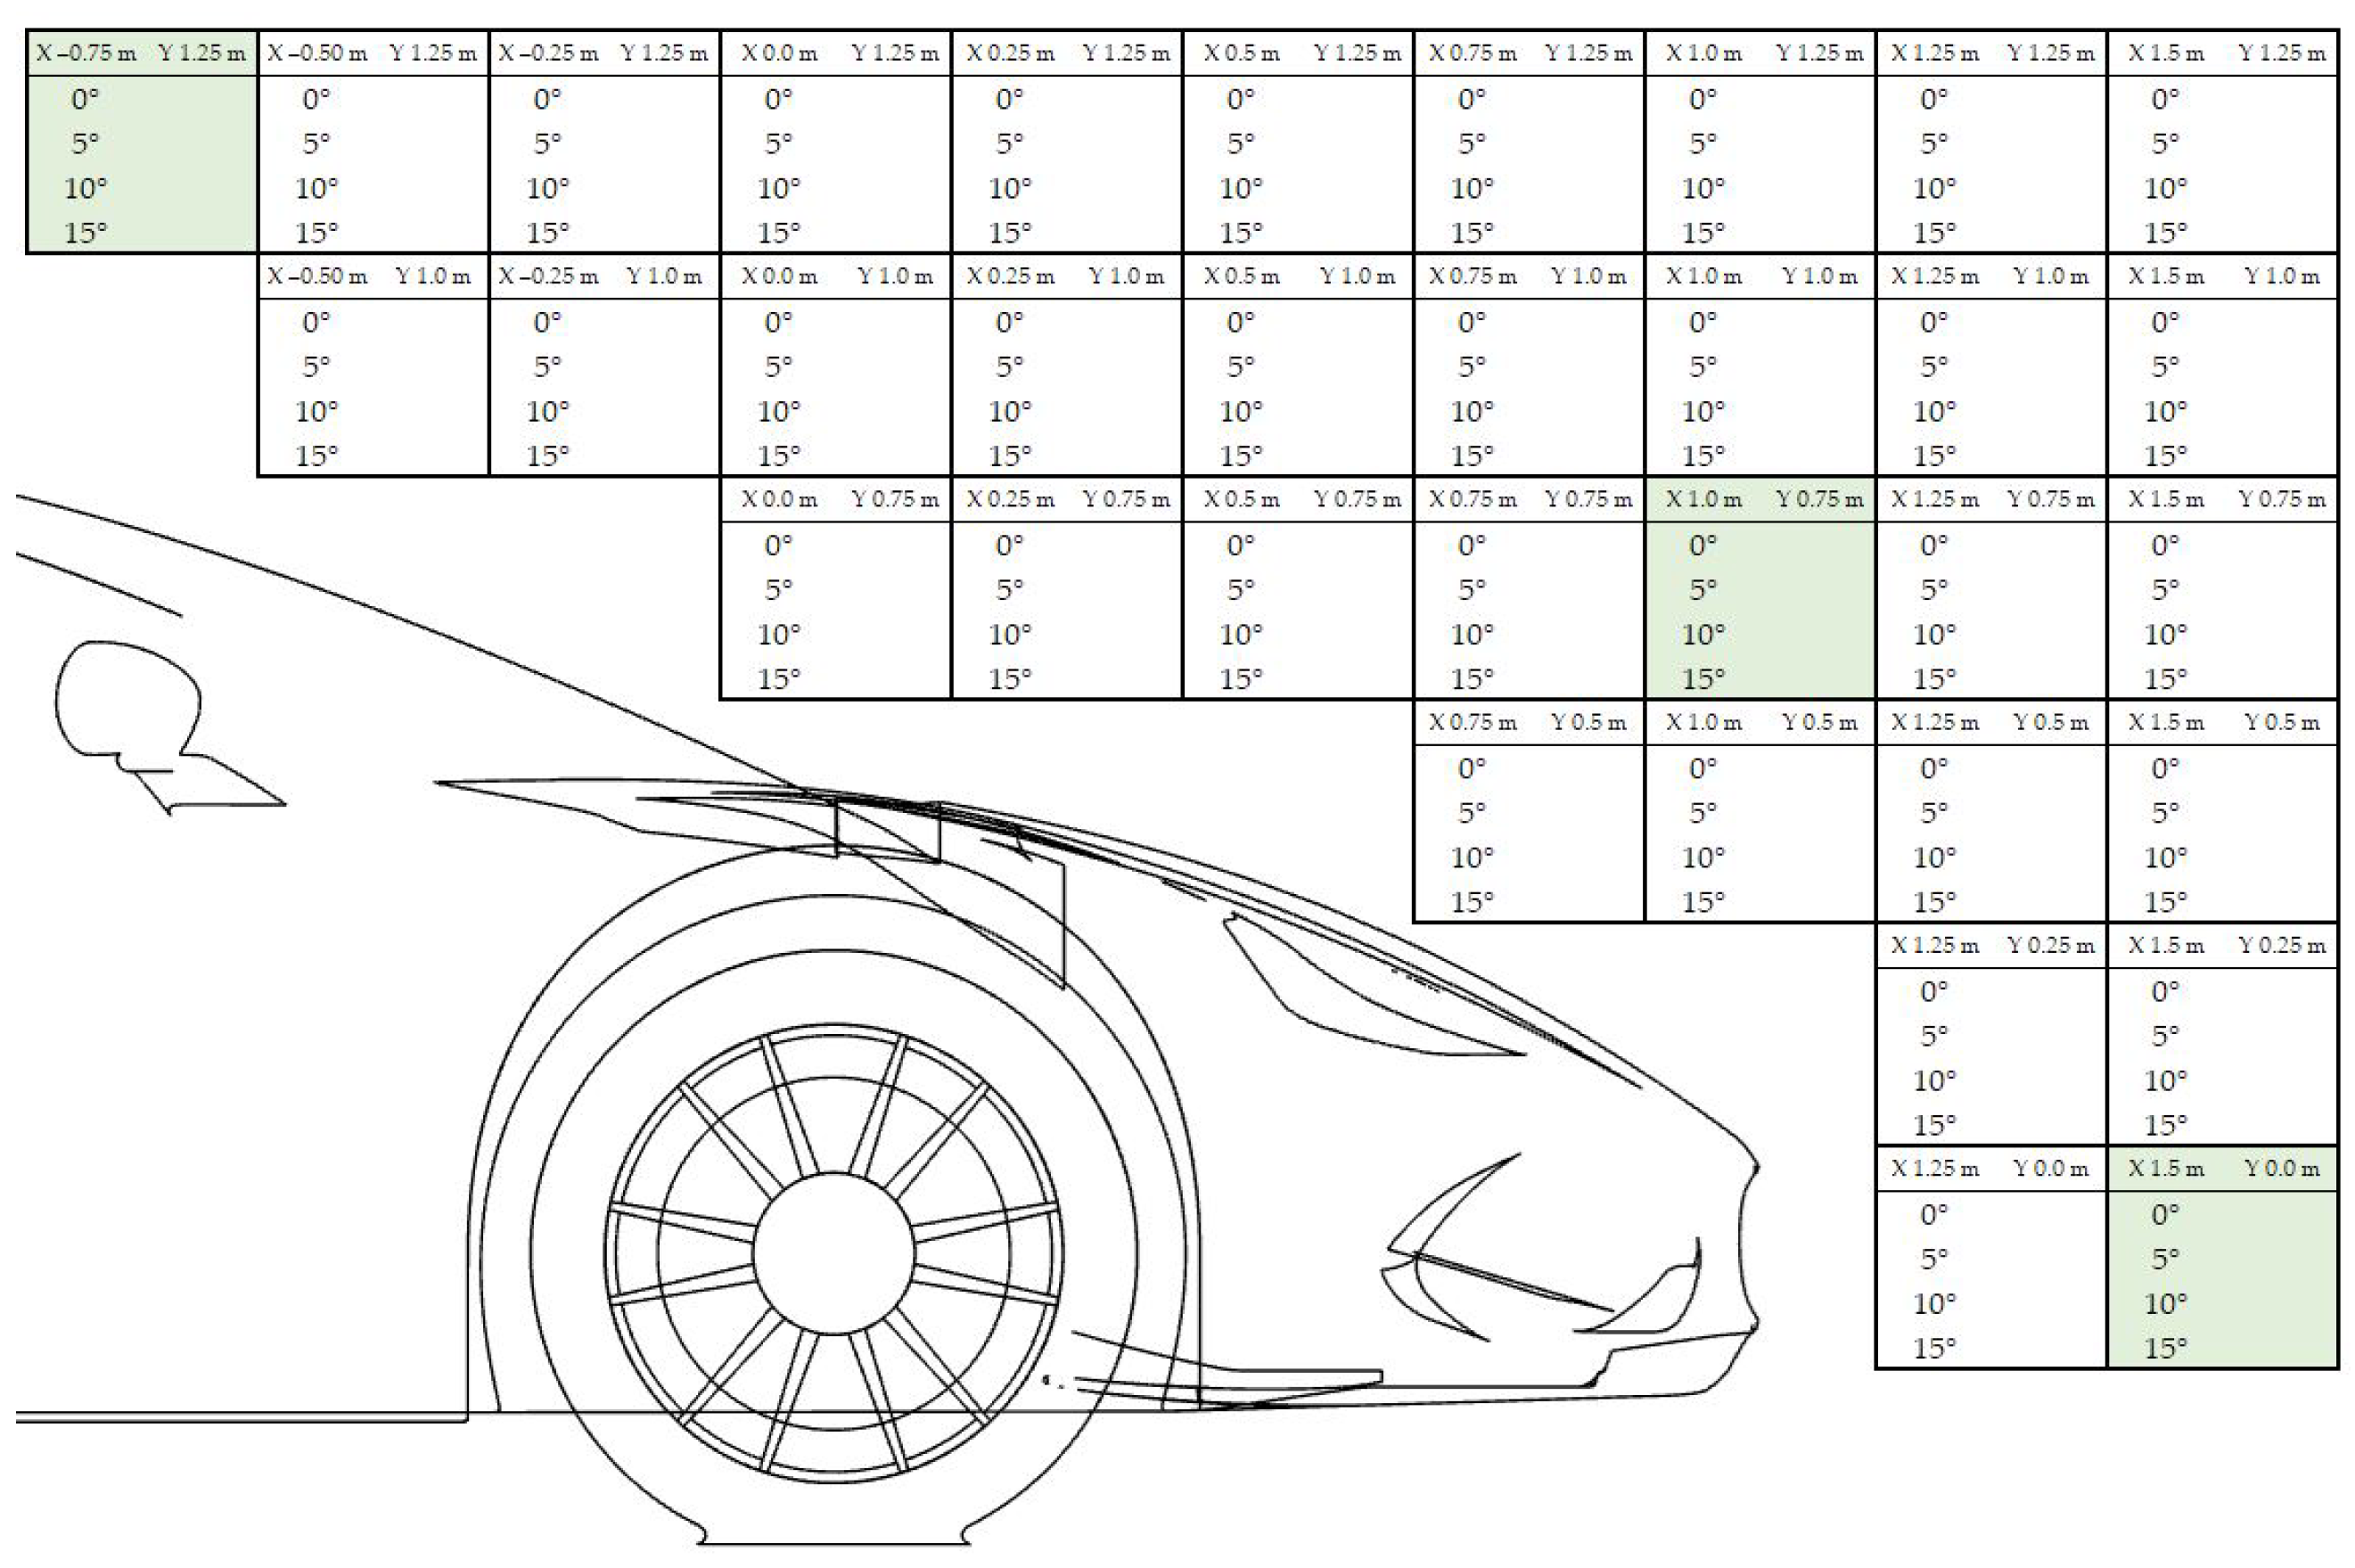
Front wing positions are referenced to the coordinate system anchored at the front axle of the car. The computational domain dimensions are shown in Figure 7 and Figure 8.
Individual meshes for the car body and front wing were generated and later superimposed on each other. The overset mesh interface [33] connected fluid zones by interpolating cell data in the overlapping regions. The advantage of such an approach was that the front wing mesh could be freely translated and rotated in the domain. Because of the significant number of studied wing positions, the overset mesh method significantly reduced the model preparation time.
Meshes were generated in Fluent Meshing 2021R2. A relatively uniform surface mesh was applied to the car body and one box-shaped body of influence (BOI) was added. The poly-hexcore algorithm was chosen for the volume mesh and polyhedral cells were placed between hexcore layers to avoid 1/8 volume transition. The cell size of the front wing mesh was selected to match the size of the background mesh of the car domain.
The boundary layer mesh was designed to fit the wall function approach. The boundary layer mesh consisted of 5 elements, with a growth rate of 1.2 and a constant first layer height of 1.3 mm on the car body to achieve y+ in the range of the logarithmic layer. At ground level, an aspect ratio method was chosen with 5 layers, a growth rate of 1.2, and an aspect ratio for the first element of 10.
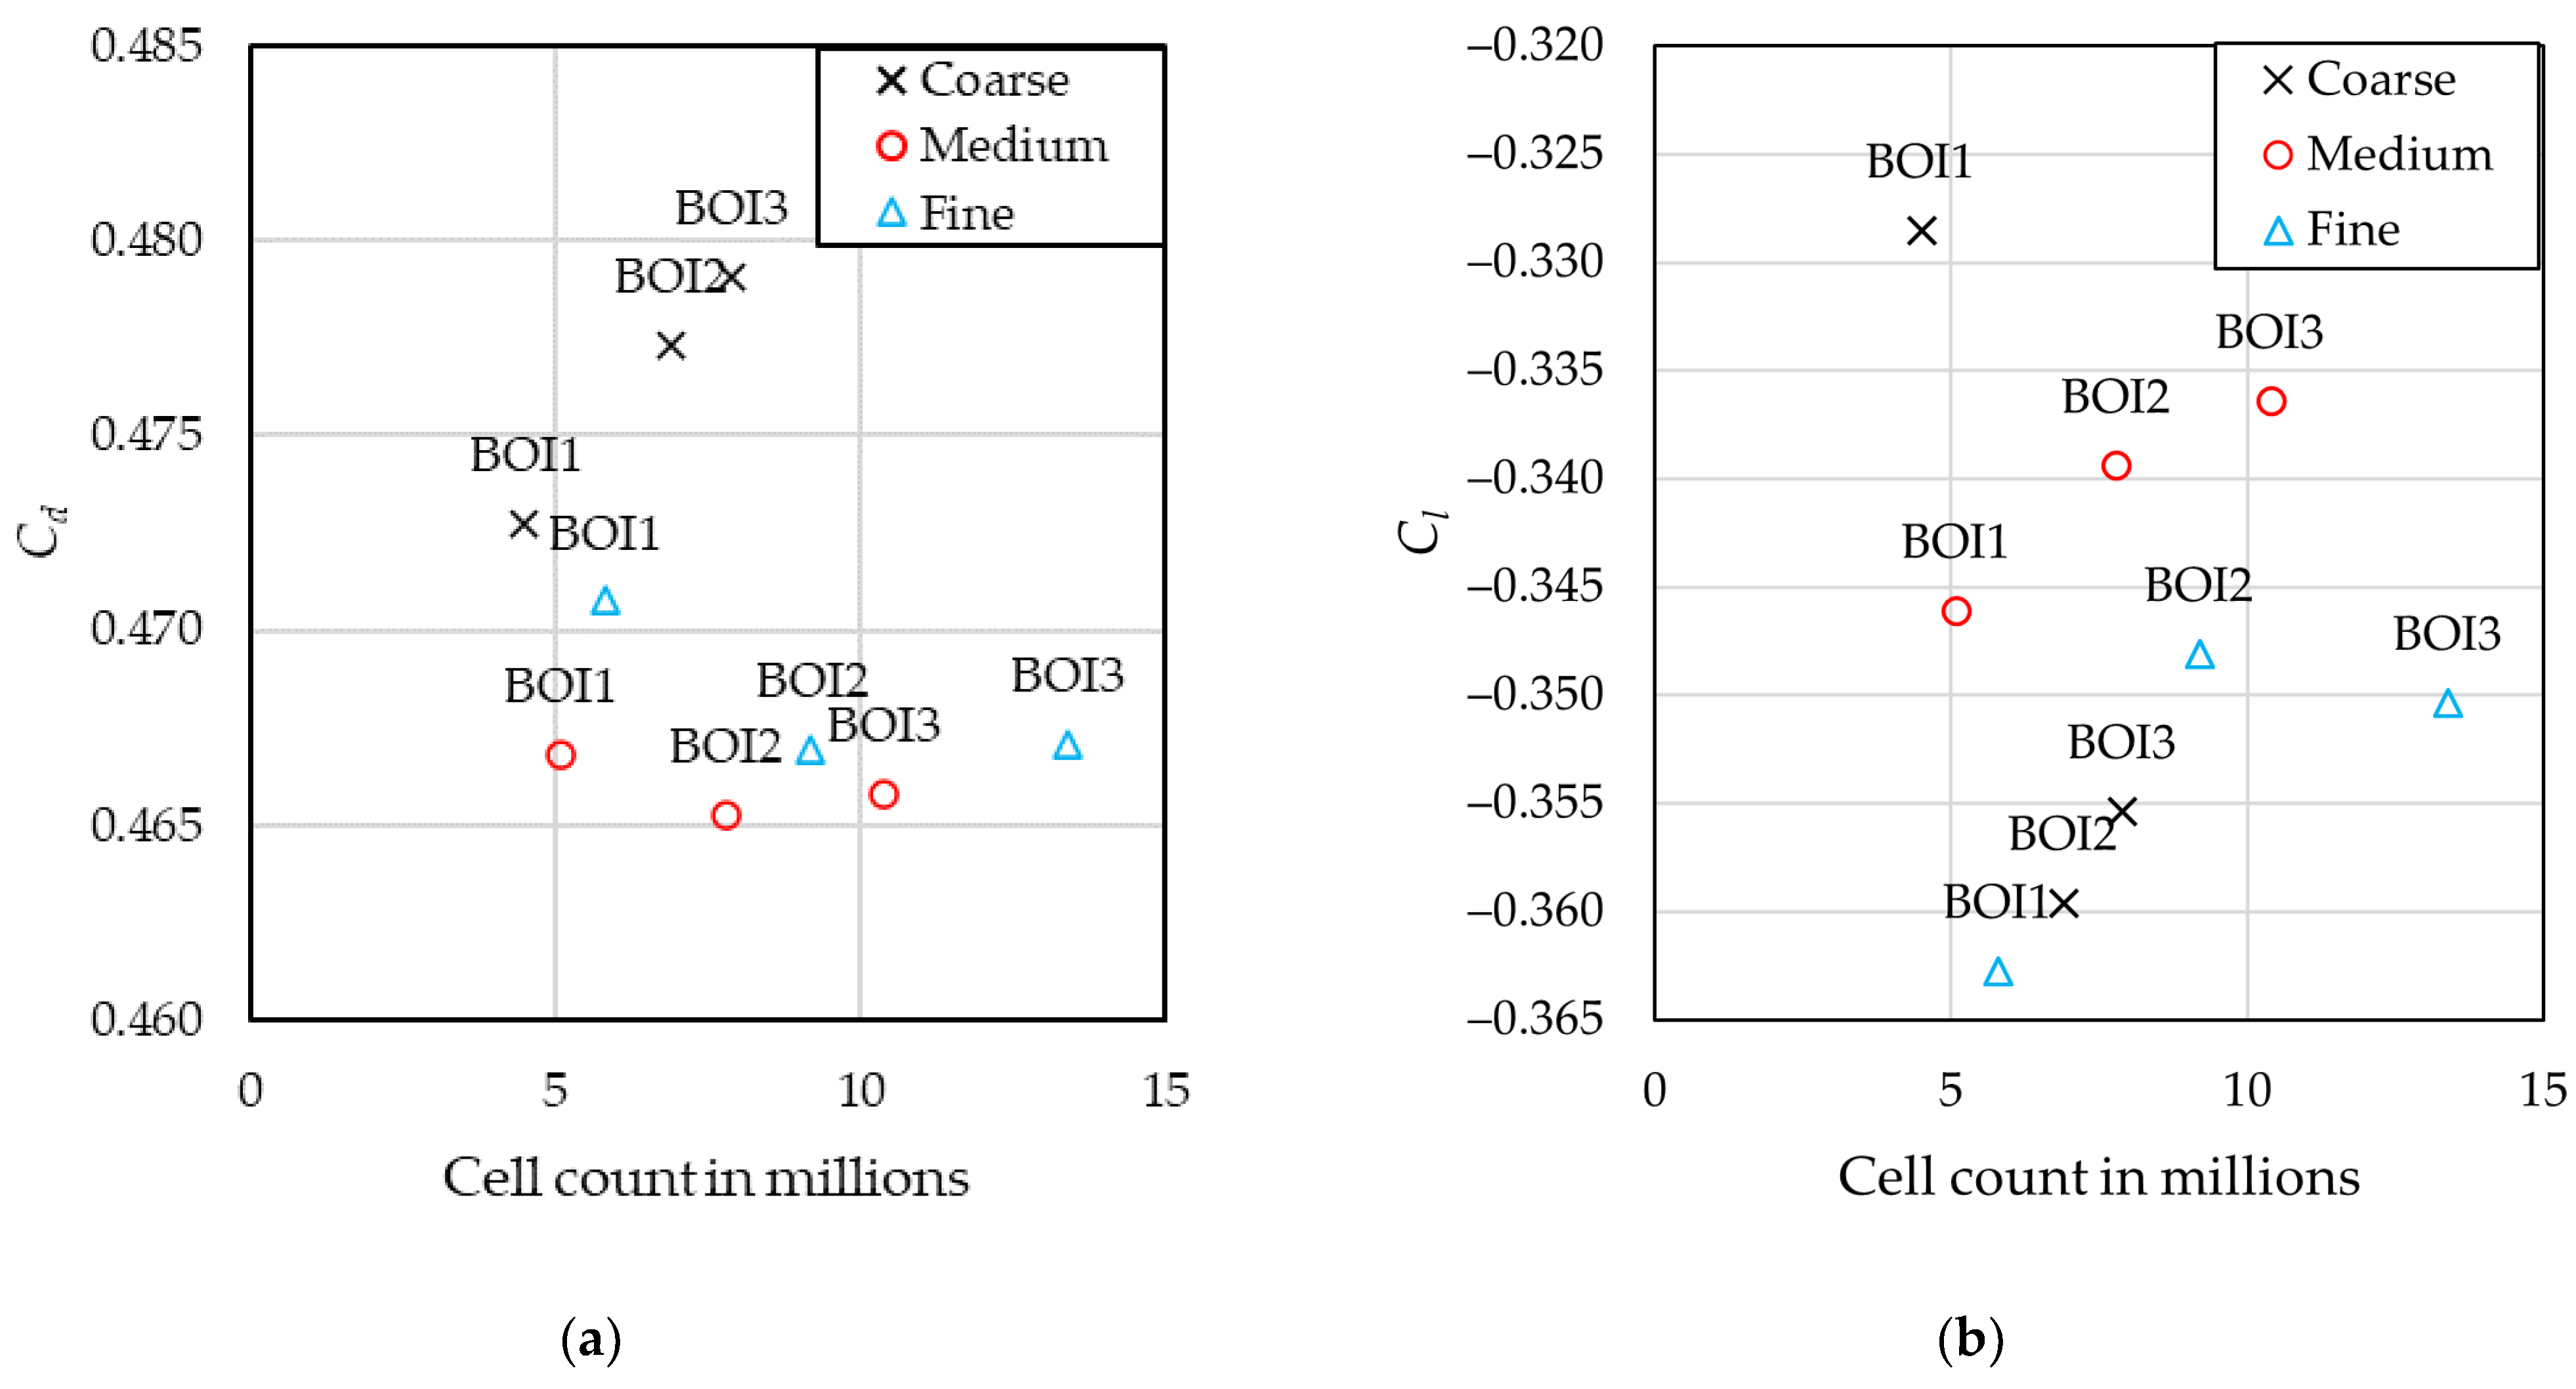
Grid sensitivity was assessed by changing two parameters: the size of the body of influence and the mesh density in this region. 
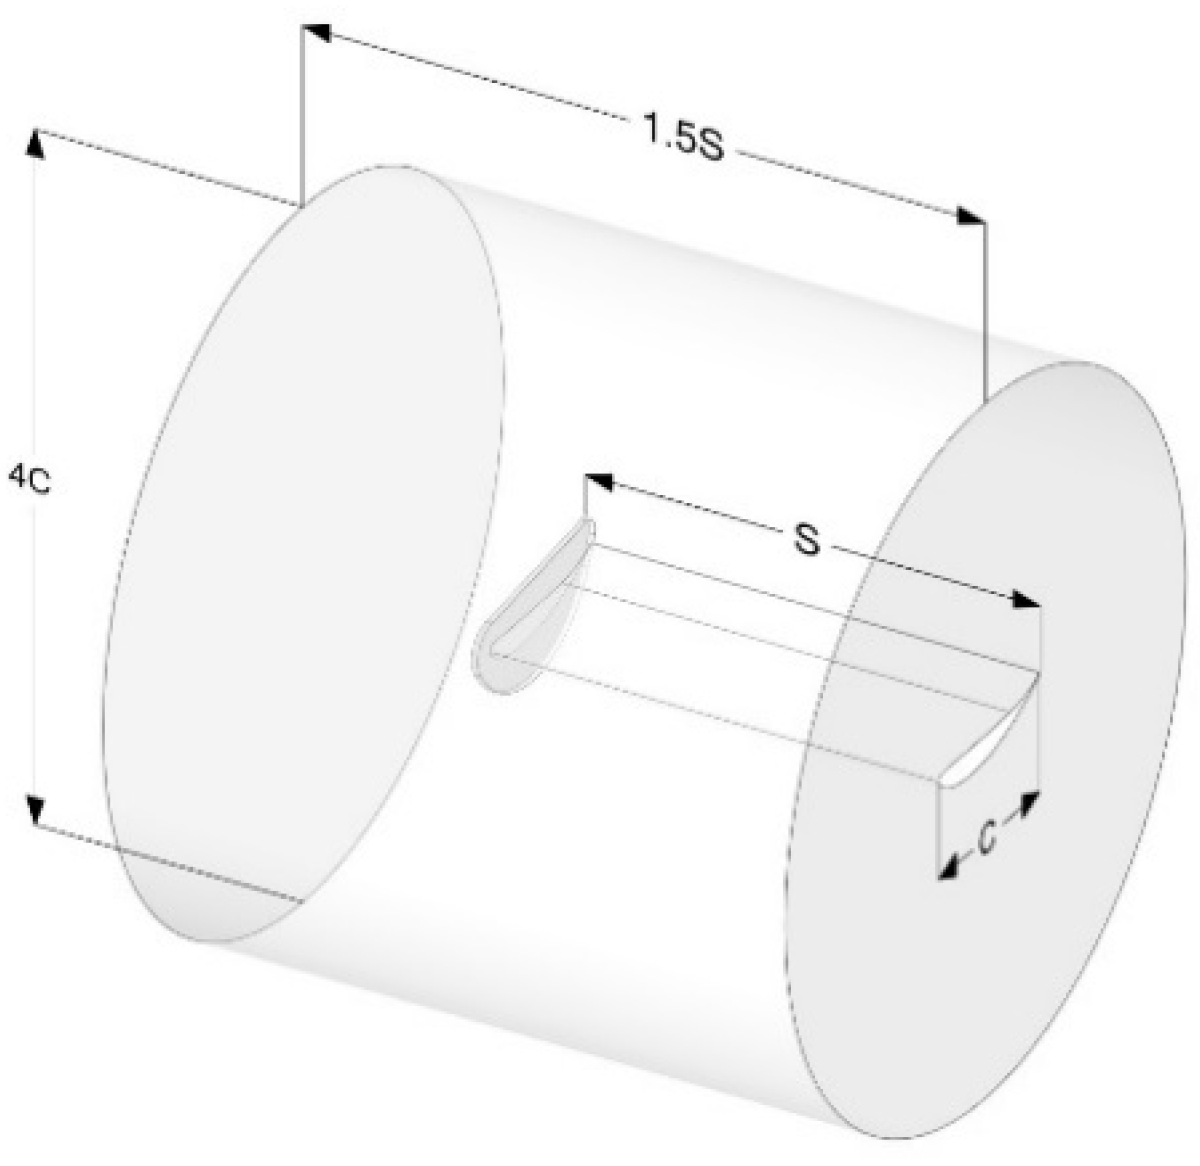
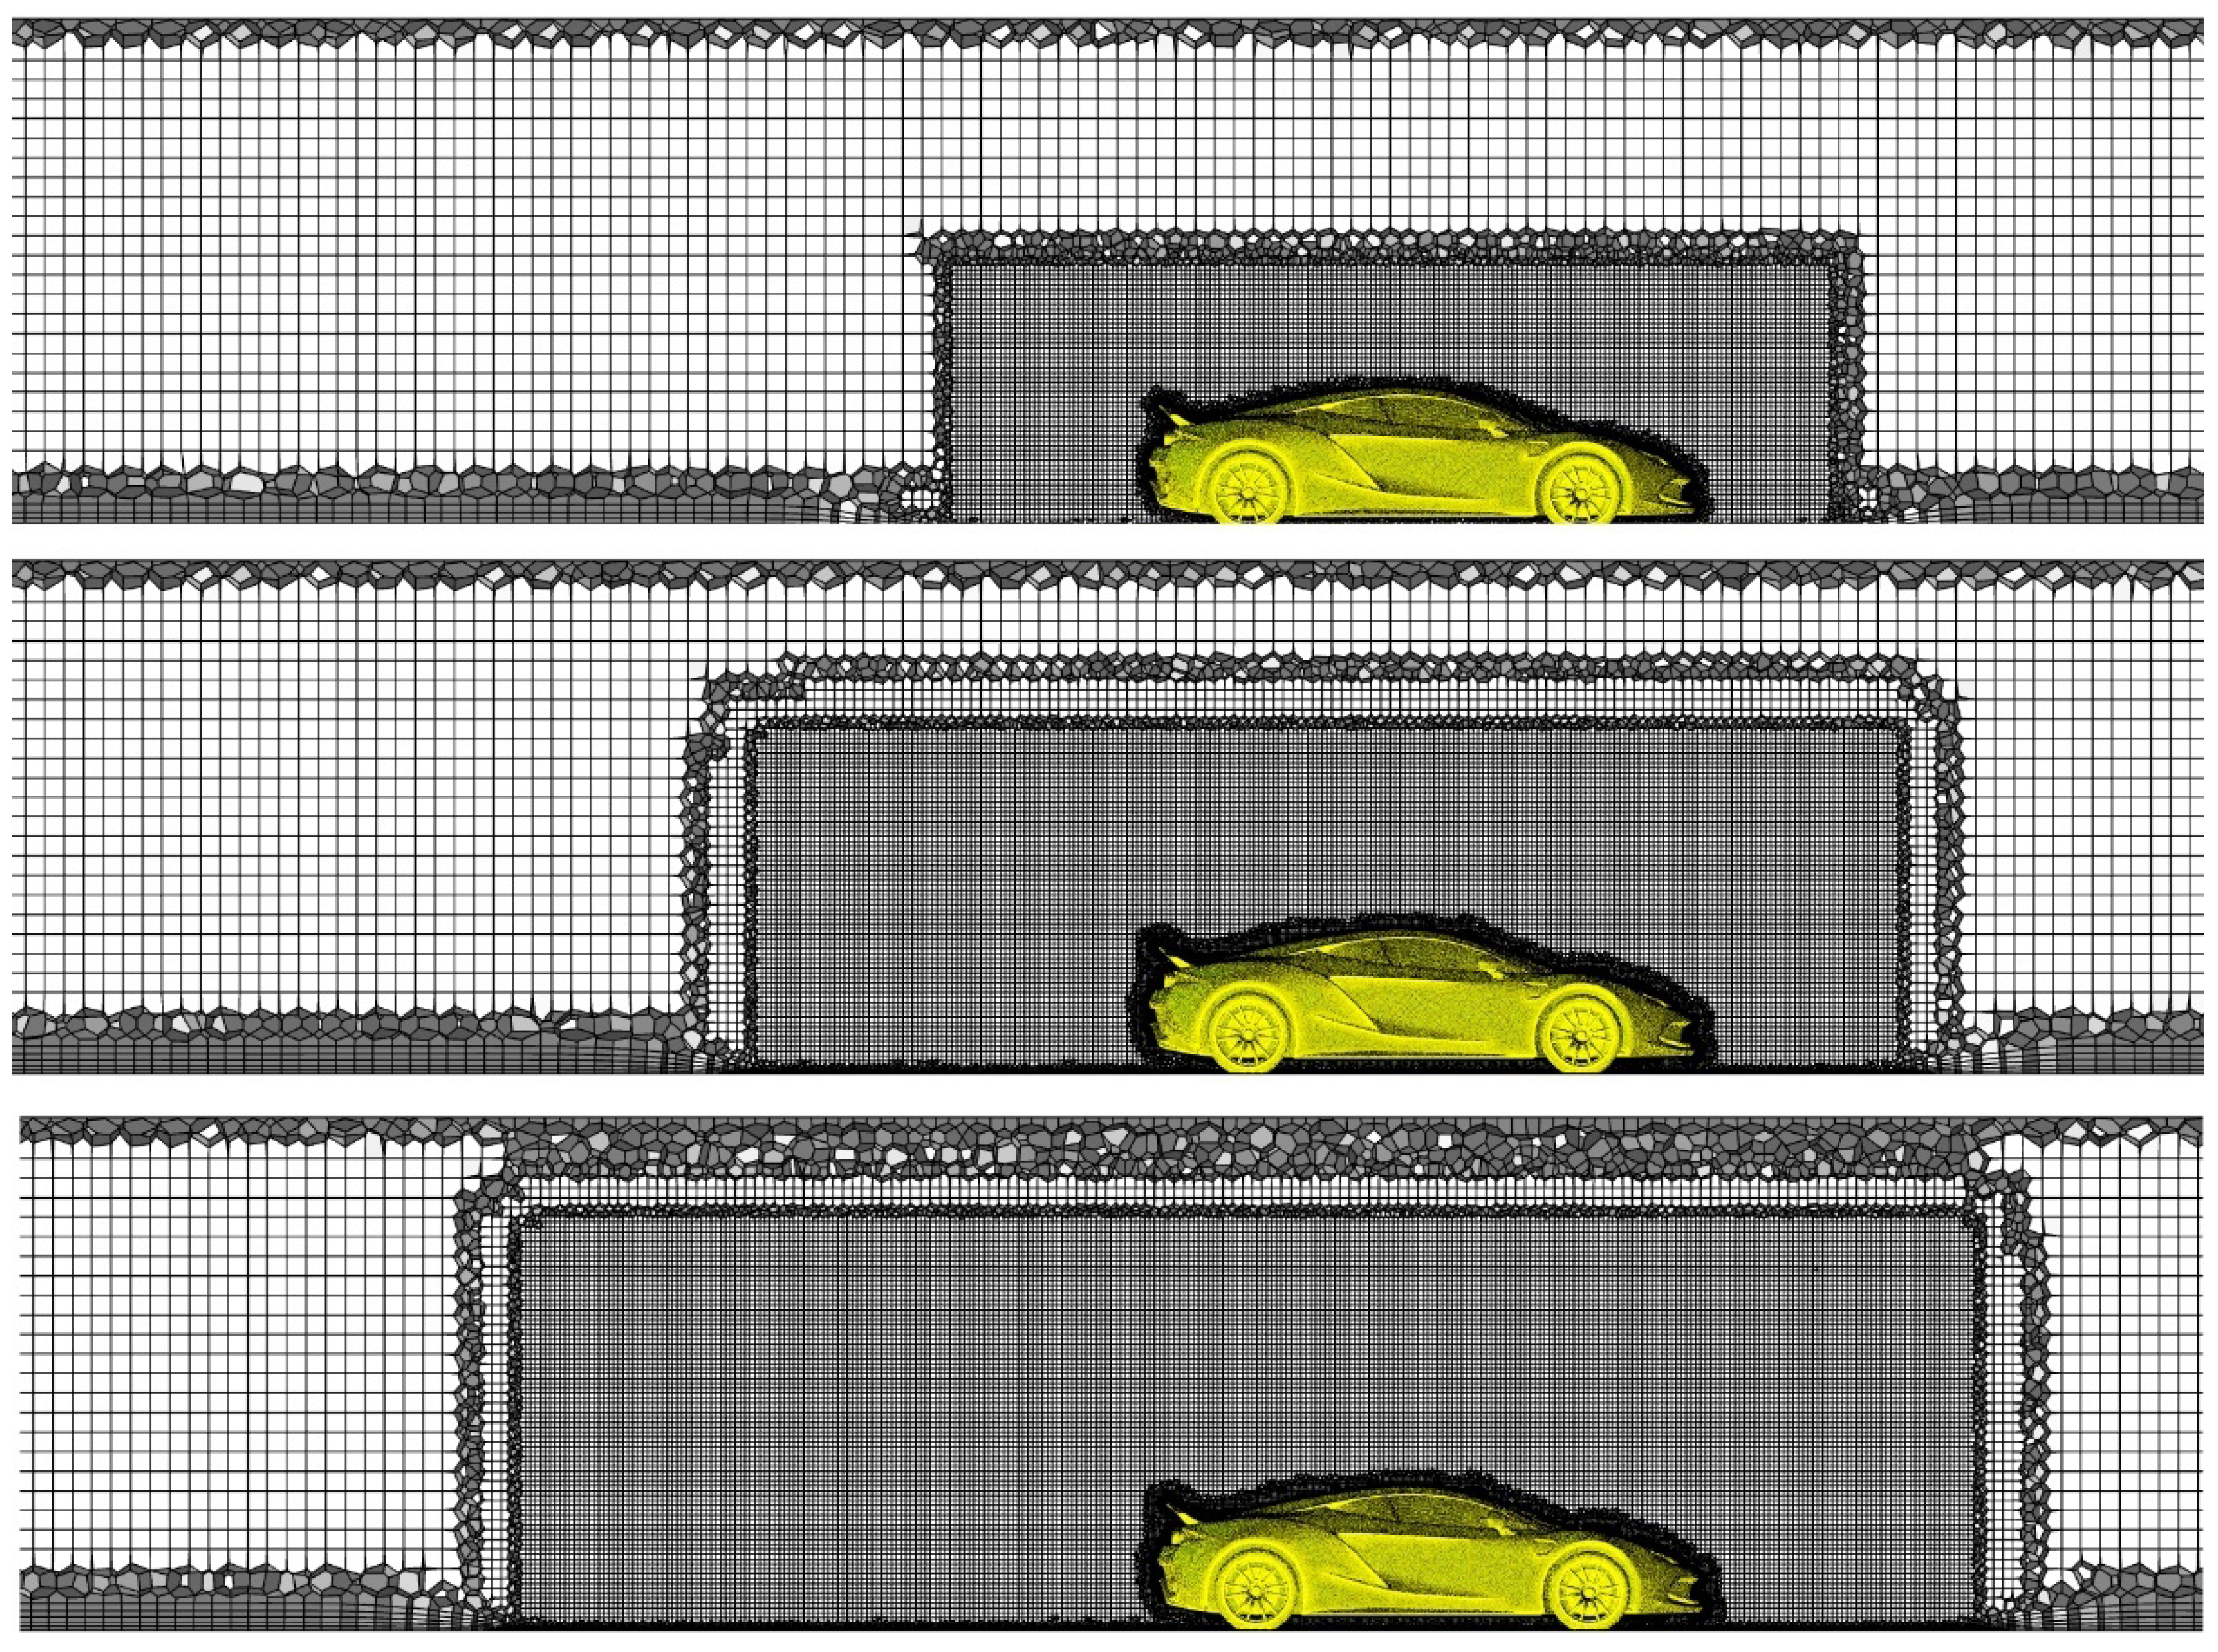
Table 1 lists the selected body of influence dimensions, which are also shown in Figure 9. Three body of influence sizes were prepared and for each of them three gradually refined meshes with a refinement factor of 1.3 and with the same topology were studied. The local cell size in the proximity of the car was defined as the characteristic cell size h. This corresponds to hcoarse = 0.04 m, hmedium = 0.031 m, and hfine = 0.024 m. For each of the nine studied meshes, the maximal inverse orthogonal quality did not exceed 0.9, indicating very good grid quality.
The results of the grid sensitivity test [34] are shown in Figure 10 and Table 2. The sensitivity of the drag coefficient Cd to the grid size was found to be small, with a total spread of 2.6%. The difference between BOI sizes 2 and 3 was smaller than 0.1% for medium and fine grids, which can serve as an argument that a BOI of size 2 is sufficient. The relative difference in the drag coefficient between medium and fine grids was 0.5%. Similar observations can be made when analyzing the results concerning lift coefficient Cl, where the total spread was 6.2% and the relative difference between BOI sizes 2 and 3 was 1% for medium and fine grids. The relative difference in the lift coefficient between medium and fine grids was smaller than 0.5%. Taking all of the results into account, the medium grid with a BOI of size 2 was selected for further study as a compromise between computational effort and accuracy (Figure 11).
The numerical model was prepared with the use of ANSYS Fluent 2021R2 software. A pressure-based solver, implicit formulation, and least squares cell-based option for the calculation of gradients were chosen for all the studied cases. The coupled pseudo-transient scheme was applied for pressure–velocity coupling. Second-order spatial discretization was set for pressure and momentum. A steady-state Reynolds-averaged Navier–Stokes k-epsilon realizable turbulence model with enhanced wall treatment and a production limiter was selected. The achieved Y+ on the vehicle body had an average of 55 and maximum of 190.
The inlet velocity was 40 m/s, with a turbulence intensity 5% and length scale of 5 mm. Moving wall boundary condition was applied to the ground and car wheels. Half of the geometry was modelled with a symmetry boundary condition. The same boundary condition was also applied to the side and top surfaces.
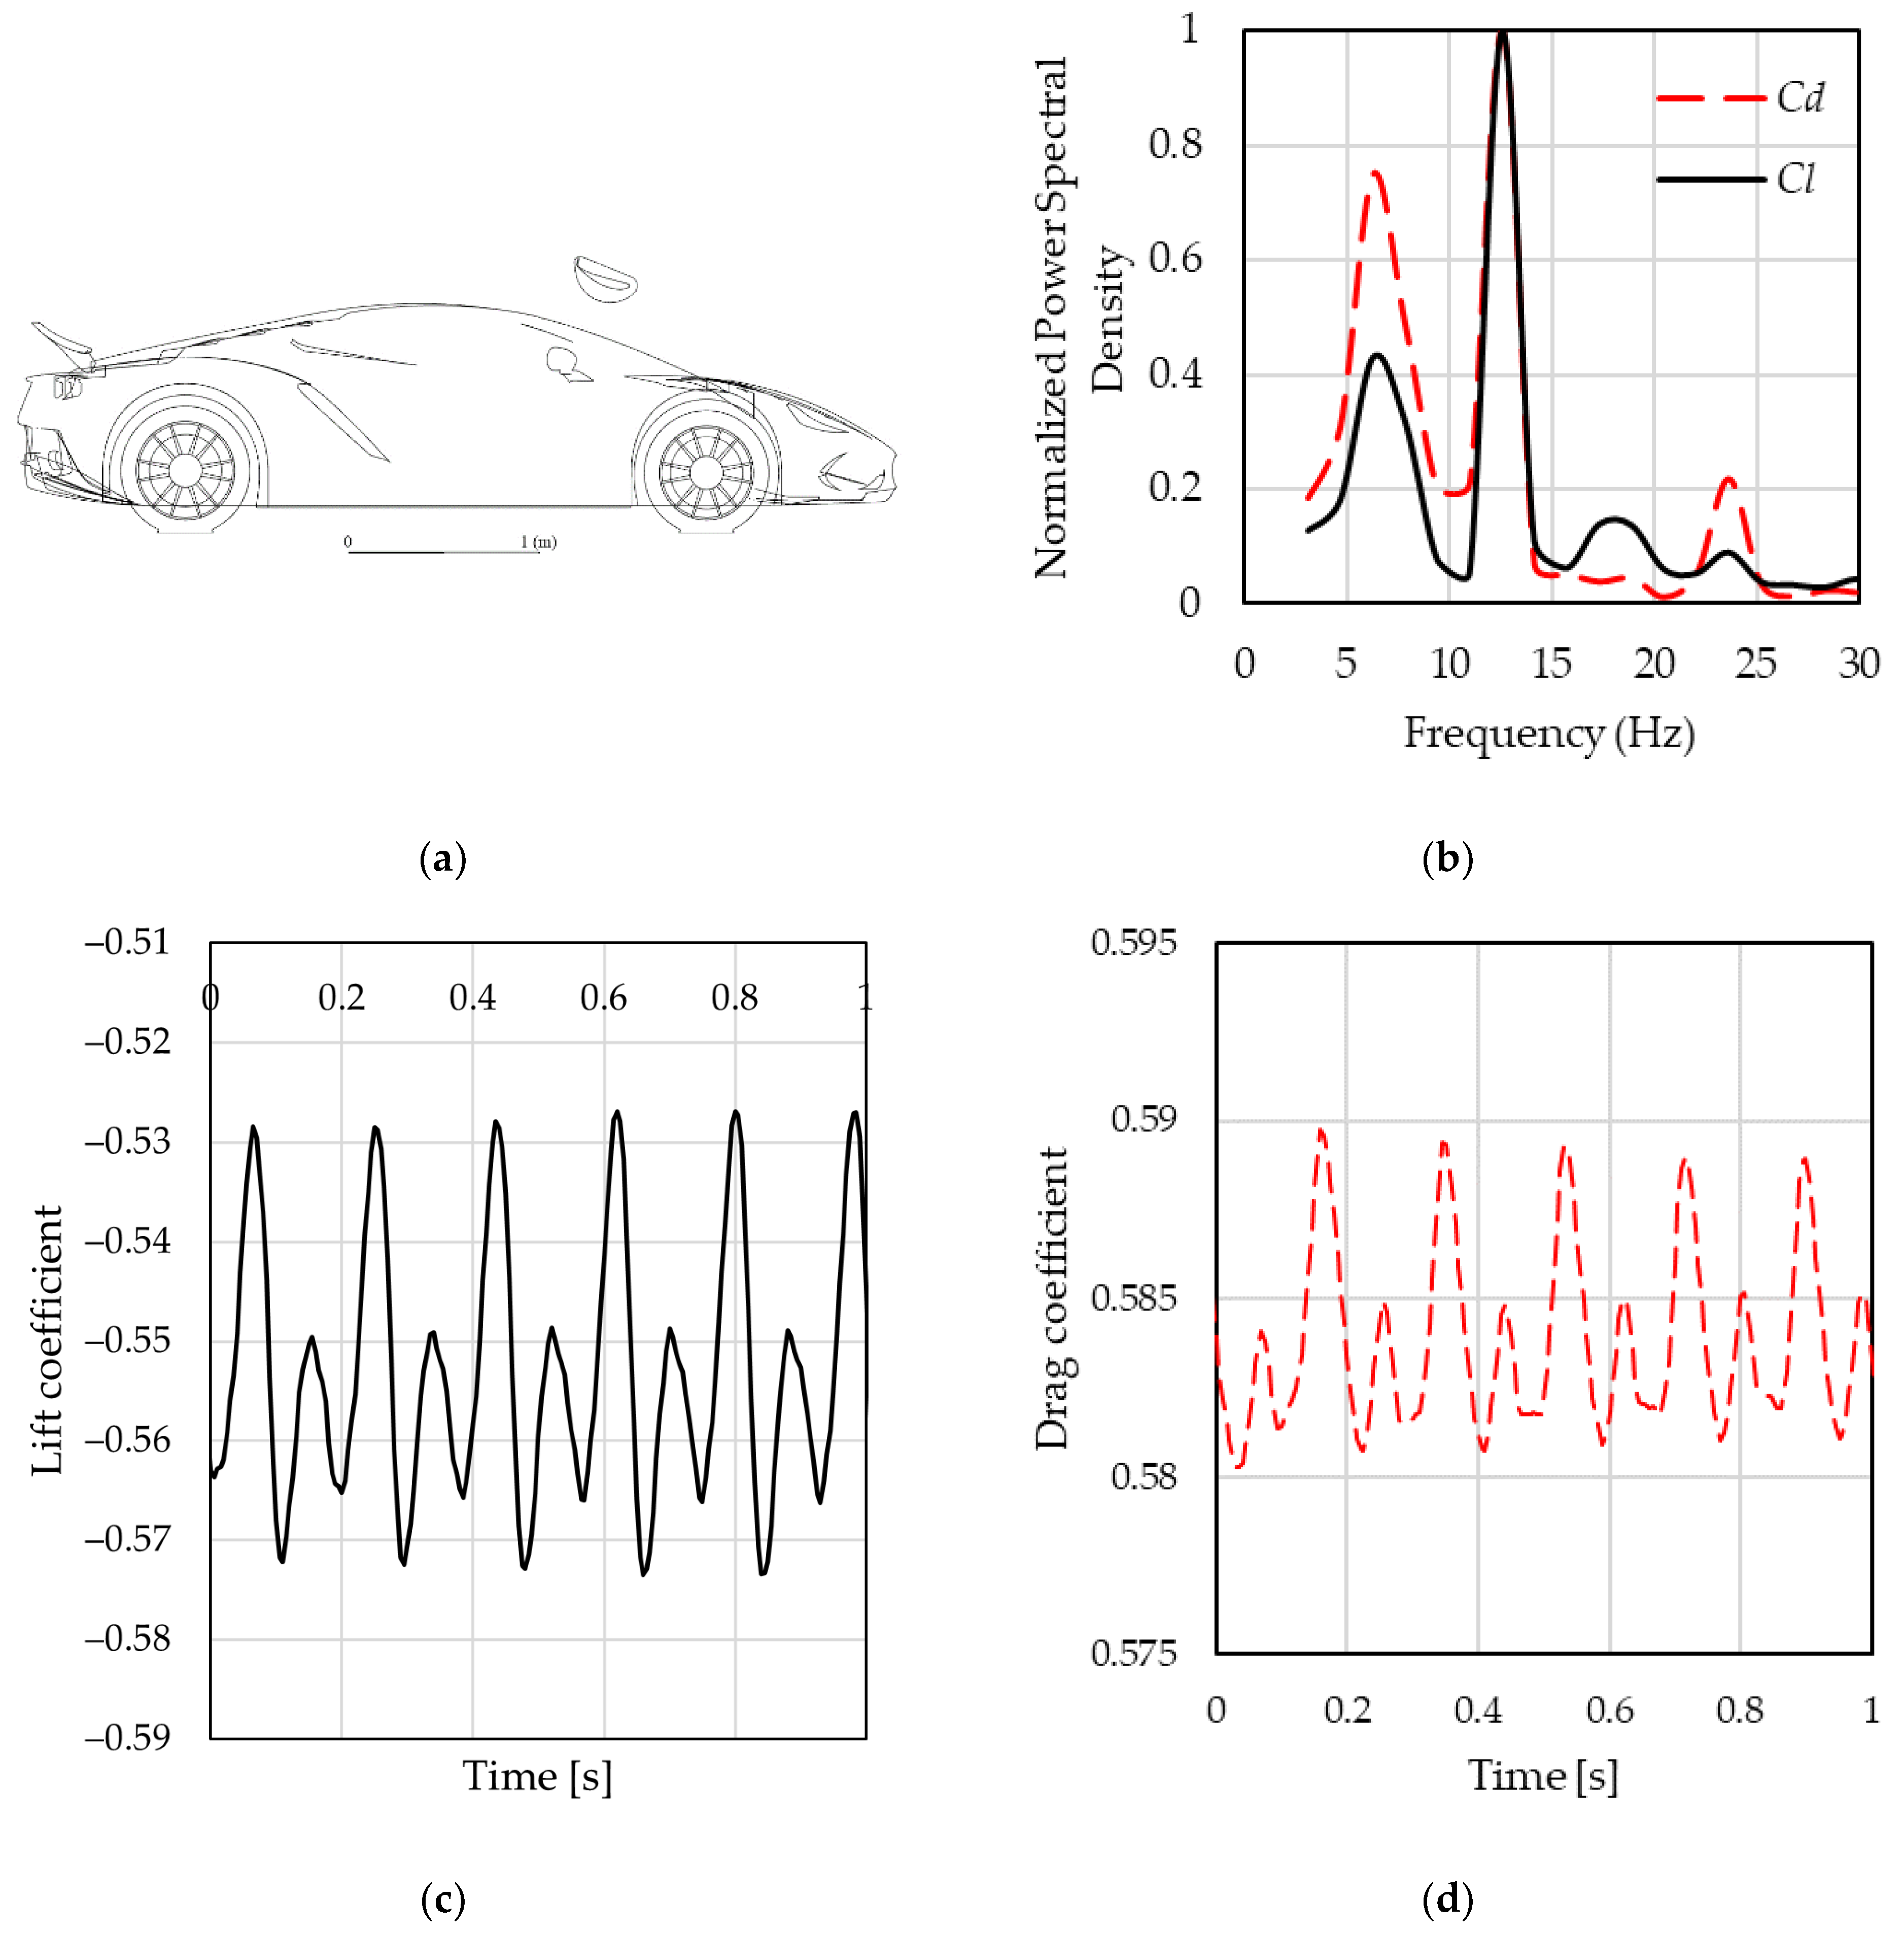
Forces and moments acting on the car were monitored throughout the iterative calculation process. Iterative calculations were run until 8–10 periods of stable oscillations in observed values were captured. It was verified that the convergence error did not exceed the discretization error and that the steady-state results were in line with averaged transient results.

3. Results and Discussion

3.1. Front Wing Influence on Forces and Moments

In the preliminary study, the front wing was positioned in front of the car (Figure 12) and its influence on forces and moments was captured. The results are presented in Table 3.
Without the front wing, the captured drag coefficient was 0.472, which is a reasonable value for a sports car. The lift coefficient distribution was even between the front and rear of the car, meaning the car was aerodynamically balanced.
Figure 13 shows how the drag forces are distributed between the body, front wing, rear wing, front wheels, and rear wheels. Also shown are the drag coefficient totals for the car configurations with no front wing, with a clean front wing, and with the wing with the Gurney flap off and on.
It can be seen that the wing with the Gurney flap increases drag but decreases body drag. The drag of the rear wing and wheels is almost unchanged. A car with the front wing and Gurney flap off generates less aerodynamic drag than a car without the wing.
Figure 14 shows how the lift forces are distributed between the body, front wing, rear wing, front wheels, and rear wheels. Also shown are the total lift coefficient values for the car configurations with no front wing, with a clean front wing, and with the wing with the Gurney flap off and on.
It can be observed that the front wing without and with the Gurney flap generates negative lift and aerodynamic downforce. At the same time, there is a decrease in downforce generated by the body. The wing with the Gurney flap generates significant downforce when it has the Gurney flap in both the inactive and active positions. The lift generated by the rear wing increases slightly, which is caused by the wheels remaining constant. The aerodynamic downforce of a car with the front wing and Gurney flap active is 15% higher than for a car without a front wing.
Figure 15 shows how the pitch moments are distributed between the body, front wing, rear wing, front wheels, and rear wheels. Also shown are the summed values of the pitch moment coefficient for the car configurations with no front wing, with a clean front wing, and with a wing with the Gurney flap off and on.
It can be observed that the wing with the Gurney flap results in an increase in pitch moment which is manifested by an increase in front axle downforce, while at the same time the pitch moment generated by the body and the rear wing decreases. The moments generated by the wheels remain constant. The pitch moment of a car with a front wing and active Gurney flap is significantly higher than a car without a wing, which means a stronger aerodynamic downforce for the front wheels than for the rear wheels (see Table 3). The coefficient of aerodynamic lift on the front axle has almost twice the absolute value for a car with a front wing than without one.
The question of why the total downforce only slightly increases when adding the front wing is answered in Figure 16. The front wing introduces a significant downforce and at the same time changes the flow distribution at the main body of the car and at the rear wing in a way that decreases the total downforce to the previous level.
In Figure 16, an area of reduced pressure coefficient can be observed at the front of the car just behind the front wing, as well as on the surface of the rear wing. Even though the total downforce does not increase, the downforce distribution is shifted to the front due to the distance of the front wing to the car body.

3.2. Parametric Study of Front Wing Setup

The car with balanced aerodynamics (Clr = −0.154 and Clf = −0.146) with the rear spoiler extended after applying the front wing showed dramatically changed characteristics. The goal of the parametric study was to find regions that would provide both increased downforce at the front axle and increased total downforce.
The position of the wing center relative to the origin of the coordinate system (front axle) is expressed by X and Y coordinates. Simulations were performed for front wing positions X in the range −0.75 m to 1.5 m and Y in the range 0 m to 1.25 m with a 0.25 m step. Because it is difficult to determine the actual wing angle of attack, the wing wedge angle was simply called the angle of attack (AOA). For each position of the front wing, its performance was studied for angles between 0° and 15°. All results in this subchapter concern a front wing with an activated Gurney flap.
Figure 17 shows the analyzed positions of the wings in relation to the body. For various reasons, such as obstructing the driver’s field of view or the complex assembly, some of these are not suitable for practical applications but were considered anyway.
Figure 18 shows the variation in lift force acting on the car with the front wing in different positions and different wedge angles. Negative values of lift force indicate aerodynamic downforce.
Figure 19 shows the aerodynamic downforce coefficient increments for car with the front wing in different wing positions and four wing angles relative to the 0, 5, 10, and 15 degree level. Aerodynamic downforce increases in large increments as the distance between the wing and body increases. This means that coupling the wing and body flow structure always leads to reducing the jointly generated (body and front wing) aerodynamic downforce. This is especially noticeable for wings located low in front of the body.
Figure 20 shows the aerodynamic drag coefficient increments of the car with the front wing in different wing positions and four wing angles relative to the horizontal at 0, 5, 10, and 15 degrees. The aerodynamic drag force increases strongly with increasing wing angle of attack and as the distance between the wing and body increases. This means that coupling of the wing and body flow structure, with few exceptions, leads to an increase in the jointly generated (body and front wing) aerodynamic drag force. This is especially noticeable for wings located far from the body.
Figure 21 shows the car’s front wheels aerodynamic downforce coefficient increments of the car with the front wing at different wing positions and four wing angles relative to the horizontal at 0, 5, 10 and 15 degrees. The aerodynamic downforce acting on front reaches the maximum values for wing angle inclination equal 5 degrees for far wing-car fuselage distance. At lower distances, the maximum is at 10 degrees. It means that to obtain better results it is necessary to tune the wing inclination angle to local angle of the car surface.
Figure 19, Figure 20 and Figure 21 are used to visualize and discuss trends. Subsequent figures will be used to discuss the effects of the front wing on aerodynamic forces in more detail; therefore, the dataset was reduced to angles of attack of 0 and 5 degrees to only show the most relevant data.
The global lift coefficient values presented in Figure 22 indicate the low effectiveness of the wings located low in front of the body. The closer the distance, the smaller the overall increase in negative lift or downforce. The reference line corresponds to the lift force value for a car without a wing.
The use of the front wing, except for some positions, causes an increase in the negative lift force, i.e., an increase in aerodynamic downforce.
The presence of the wing as an additional element generates additional aerodynamic drag. Figure 23 shows changes in the coefficient of aerodynamic drag force. Wings located low in front of the body result in a slight drag force increase or decrease. The increase in aerodynamic drag resulting from the presence of the front wing can be quite significant. The increments reach 20% of the value for a vehicle without a front wing.
Figure 24 shows the relationship of the ratio of the aerodynamic downforce increment to the aerodynamic drag increment resulting from the use of the front wing. Much larger aerodynamic downforce gains than drag gains can be seen. The exception to this is when the wings are positioned low in front of the vehicle.
However, the above is only one aspect of front wing use. It is interesting to compare the coefficients of the aerodynamic lifting force distributed on the front (Figure 25) and rear (Figure 26) axles. It turns out that the wings in all tested positions generate aerodynamic downforce on the front wheels at the expense of the downforce on the rear wheels. The downforce on the front wheels increases by 2 to 5 times. The wings placed at the front in this particular case significantly decrease the downforce on the rear axle.
Figure 27 shows the variations in the position of the resultant aerodynamic lift force with respect to the front and rear axle positions. The reference position of this force indicates an aerodynamically balanced vehicle. Adding a front wing shifts its position toward the front axle, and in extreme cases locates it ahead of the front axle. Excessive front axle downforce manifested by vehicle instability (vehicle oversteering) requires decisive action by applying an efficient wing at the rear of the vehicle.
As shown in Figure 28, the aerodynamic forces generated by the front wing at different positions relative to the car body change significantly. By correlating the changes in the lift coefficient of the front wing with its position in relation to the body, one can see that changes in the generated lift are probably due to a change in the direction of airflow under the wing, which causes a change in the angle of attack of the wing.
Visualizations were made for the selected specific positions of the wing marked in green in Figure 29, namely above the windshield, moderately high above the front of the vehicle and in front of the car, and at the axle level.
Velocity contours and streamlines are shown in Figure 30 and Figure 31. The data presented in Figure 30, Figure 31, Figure 32 and Figure 33 confirm the main point of the article—the existence of strong coupling between the flow structures around the front wing and body. Although the additional wing generates aerodynamic downforce, at the same time it reduces the downforce generated by the body by lowering the pressure on the upper surface of the car.
In the displayed symmetry plane in Figure 30, it can be observed that the recirculation zone behind the roof changes in size depending on the front wing position. The differences are not so vast in other cross-sections due to the highly three-dimensional flow in this region.
The streamlines show the interaction of the wake of the front wing with the rest of the car body. The consequences can be seen in Figure 32 and Figure 33, where regions affected by the front wing can be clearly seen, namely the area just below and downstream of the front wing. Pressure changes on the rest of the car body are more subtle, but even small changes in pressure over the relatively large car body area generate significant changes in aerodynamic forces. One exception is the highest considered front wing placement, for which the rear lift coefficient does not increase, but is even slightly reduced (see Figure 26).
The vortex structures generated by the front wing at different positions can be clearly seen in Figure 34 and Figure 35, especially edge vortices separating at the side of the front wing.

3.3. Transient Analysis of a Selected Front Wing Setup

Oscillating values of lift and drag were observed for high front wing positions and large angles of attack. To investigate this in more detail, a transient analysis with a timestep of 5 ms was performed for a selected case of a front wing at a 15 degree angle of attack, located at X = −0.5 m and Y = 1 m from the front axle.
A comparison of forces and moments obtained in steady-state and transient analyses for the same front wing placement is shown in Table 4. The relative differences do not exceed 4%.
In Figure 36, the lift and drag coefficients oscillations can be observed with 3% and 1% amplitudes, respectively. The frequency of oscillations at a car speed of 40 m/s fall in the range of 6–12 Hz, which may interfere with the natural frequencies of sports cars’ stiff suspension.
In the studied case, the front wing is placed high above the car body. Flow unsteadiness comes mainly from the front wing, and as can be seen in Figure 37, while the wake behind the front wing does not interfere strongly with the rest of the car body or with the spoiler.

3.4. An Attempt to Balance the Car with a Larger Spoiler

The car, which was originally aerodynamically balanced, became unbalanced when the front wing was added. The balance may be restored in several ways, one of which is utilizing a larger spoiler. An attempt was made to balance the front and rear lift coefficients for the front wing position X = 0 m, Y = 1 m, and angle of attack of 0 degrees. As shown in Figure 38, the shape used as for the spoiler was the same as that of the front wing, with an angle of attack of 25 degrees.
The results presented in Table 5 show that aerodynamic balance was restored, as the large spoilers Clr and Clf are almost equal. However, this required a drastic setup for the spoiler with a significant angle of attack, resulting in drag coefficient of 0.725 and lift coefficient of −0.928. Better results could have been obtained with a three-element wing. Regardless, the purpose of the study was to show the general idea that counteraction of the imbalance caused by the front wing may introduce additional consequences. Significant oscillations of forces acting on the car body and spoiler were captured (Figure 39). Although no time scale is given, as calculations were performed with a coupled pseudo-transient scheme, one can assess the frequency assuming a Strouhal number of 0.15–0.2. Using a car height H = 1.1 m as the characteristic size and a velocity of 40 m/s, the frequency would be in the range of 5–7 Hz.
It can be noticed that due to low angle of attack of the front wing, no significant oscillations in drag or lift coefficient of the front wing are captured.

4. Conclusions

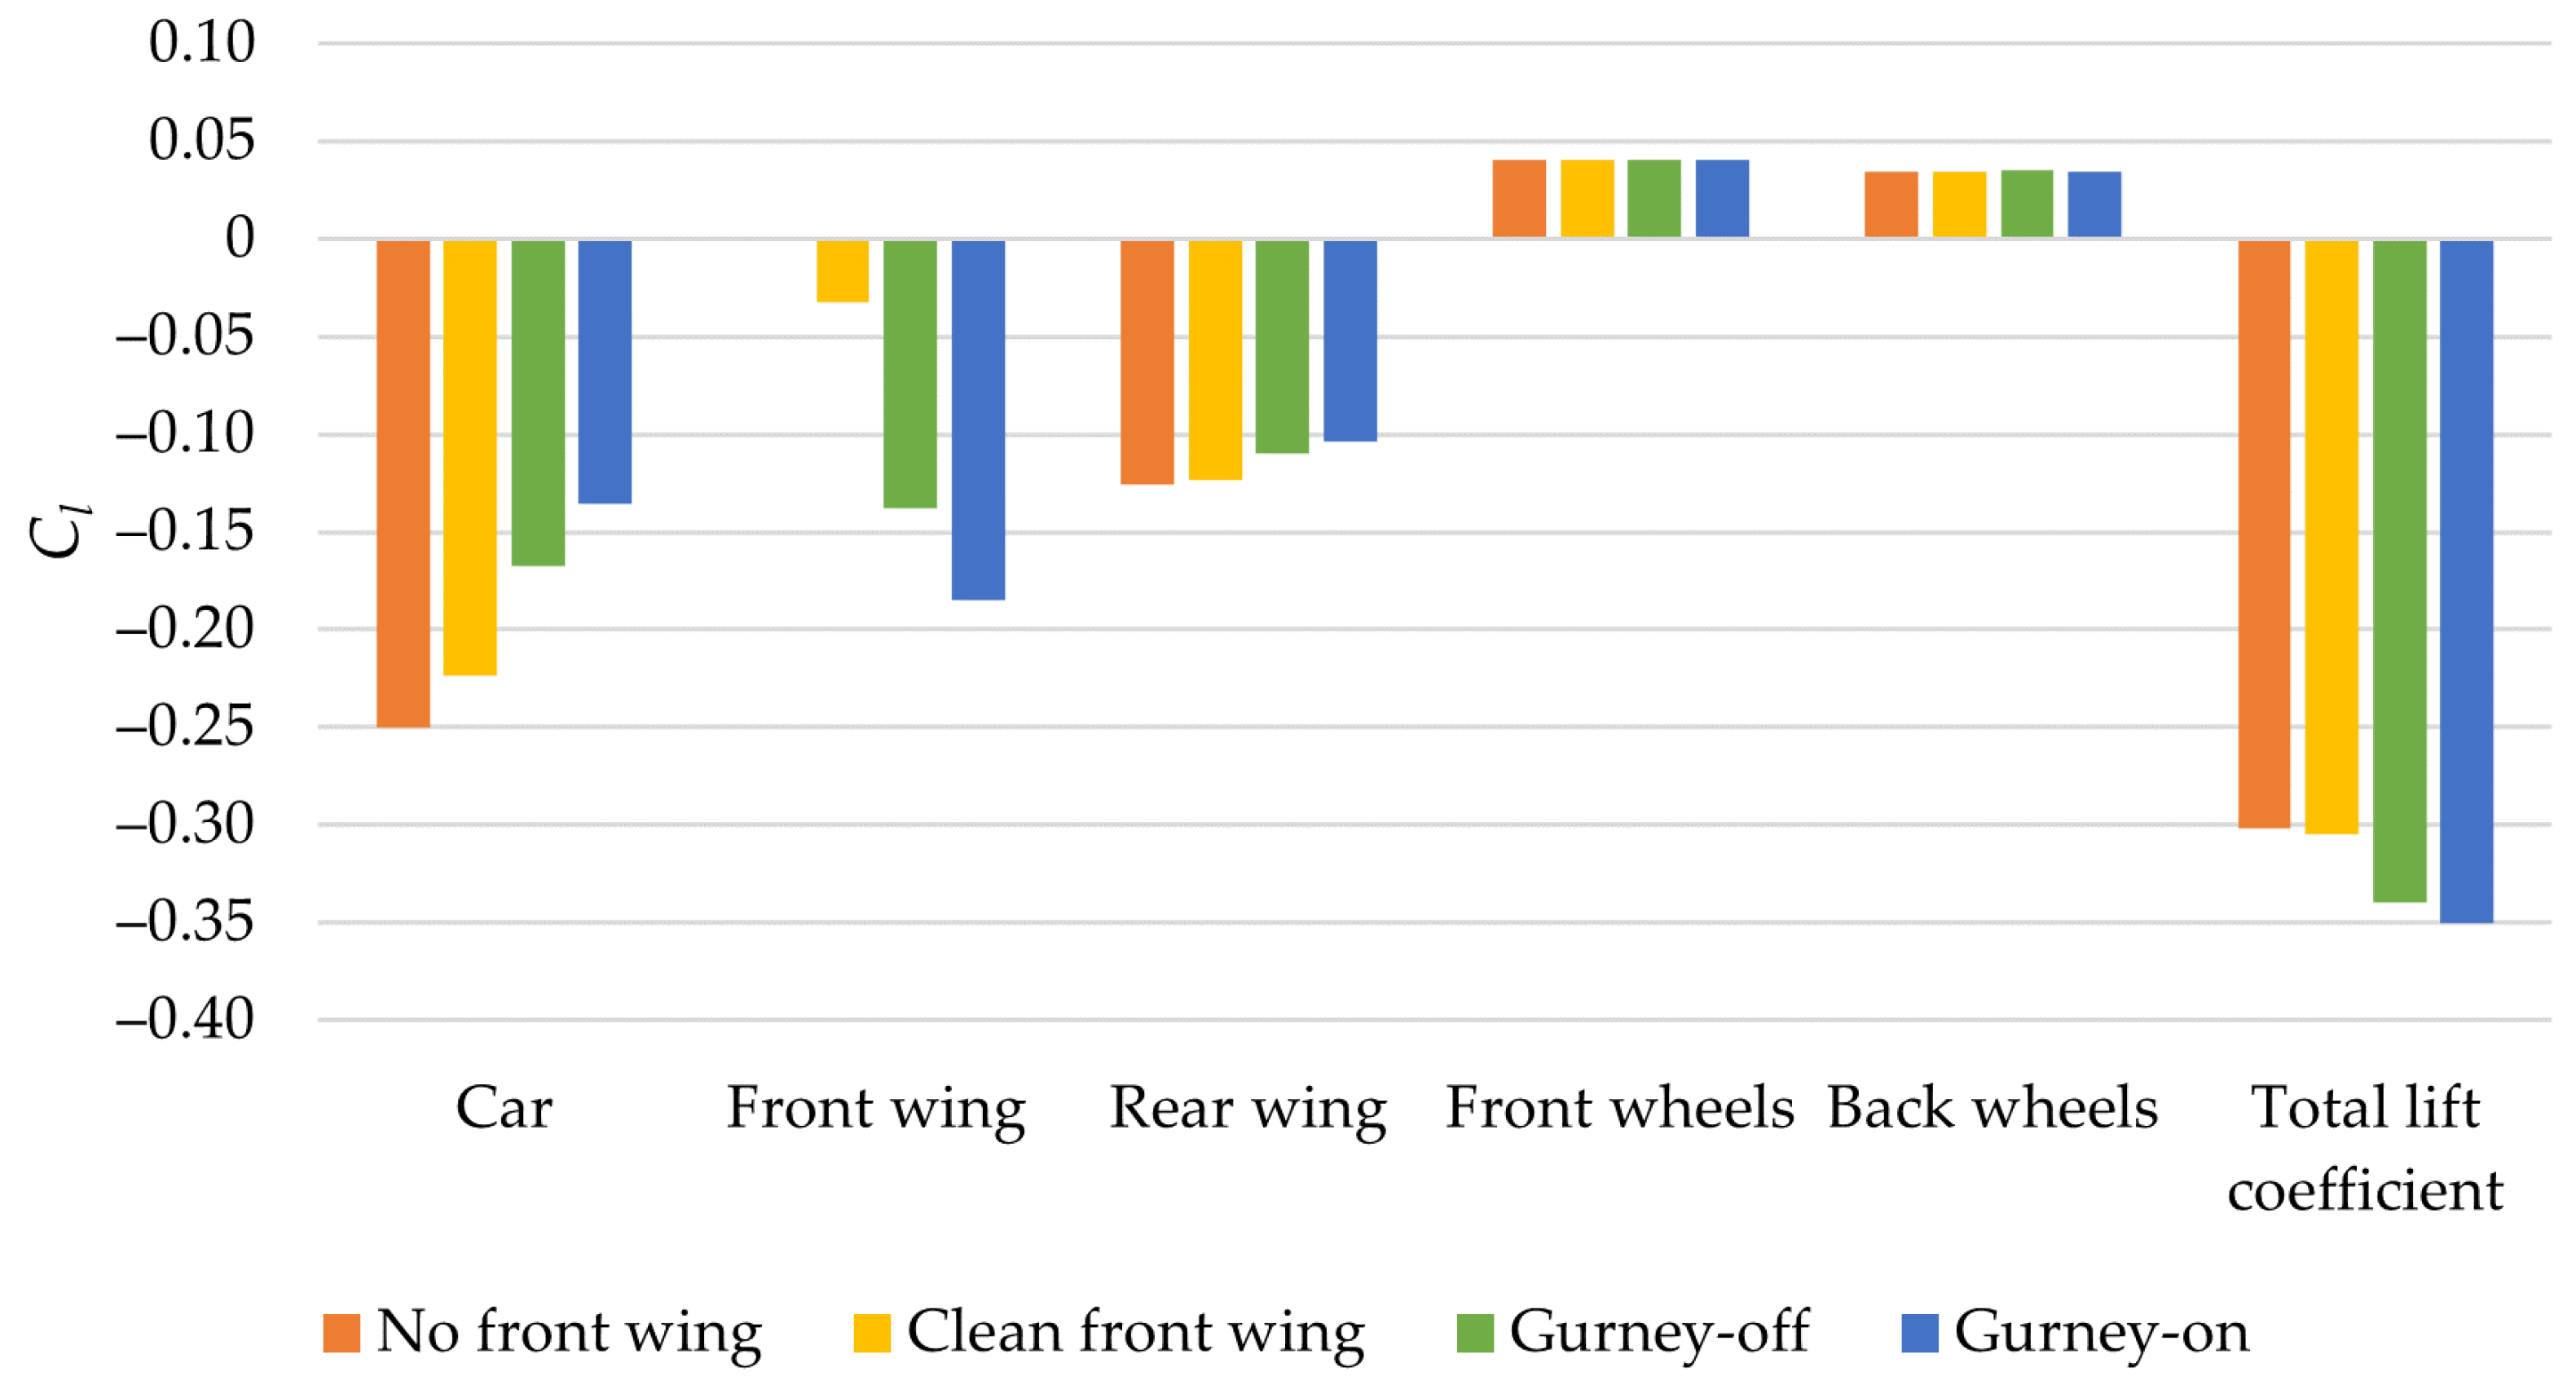
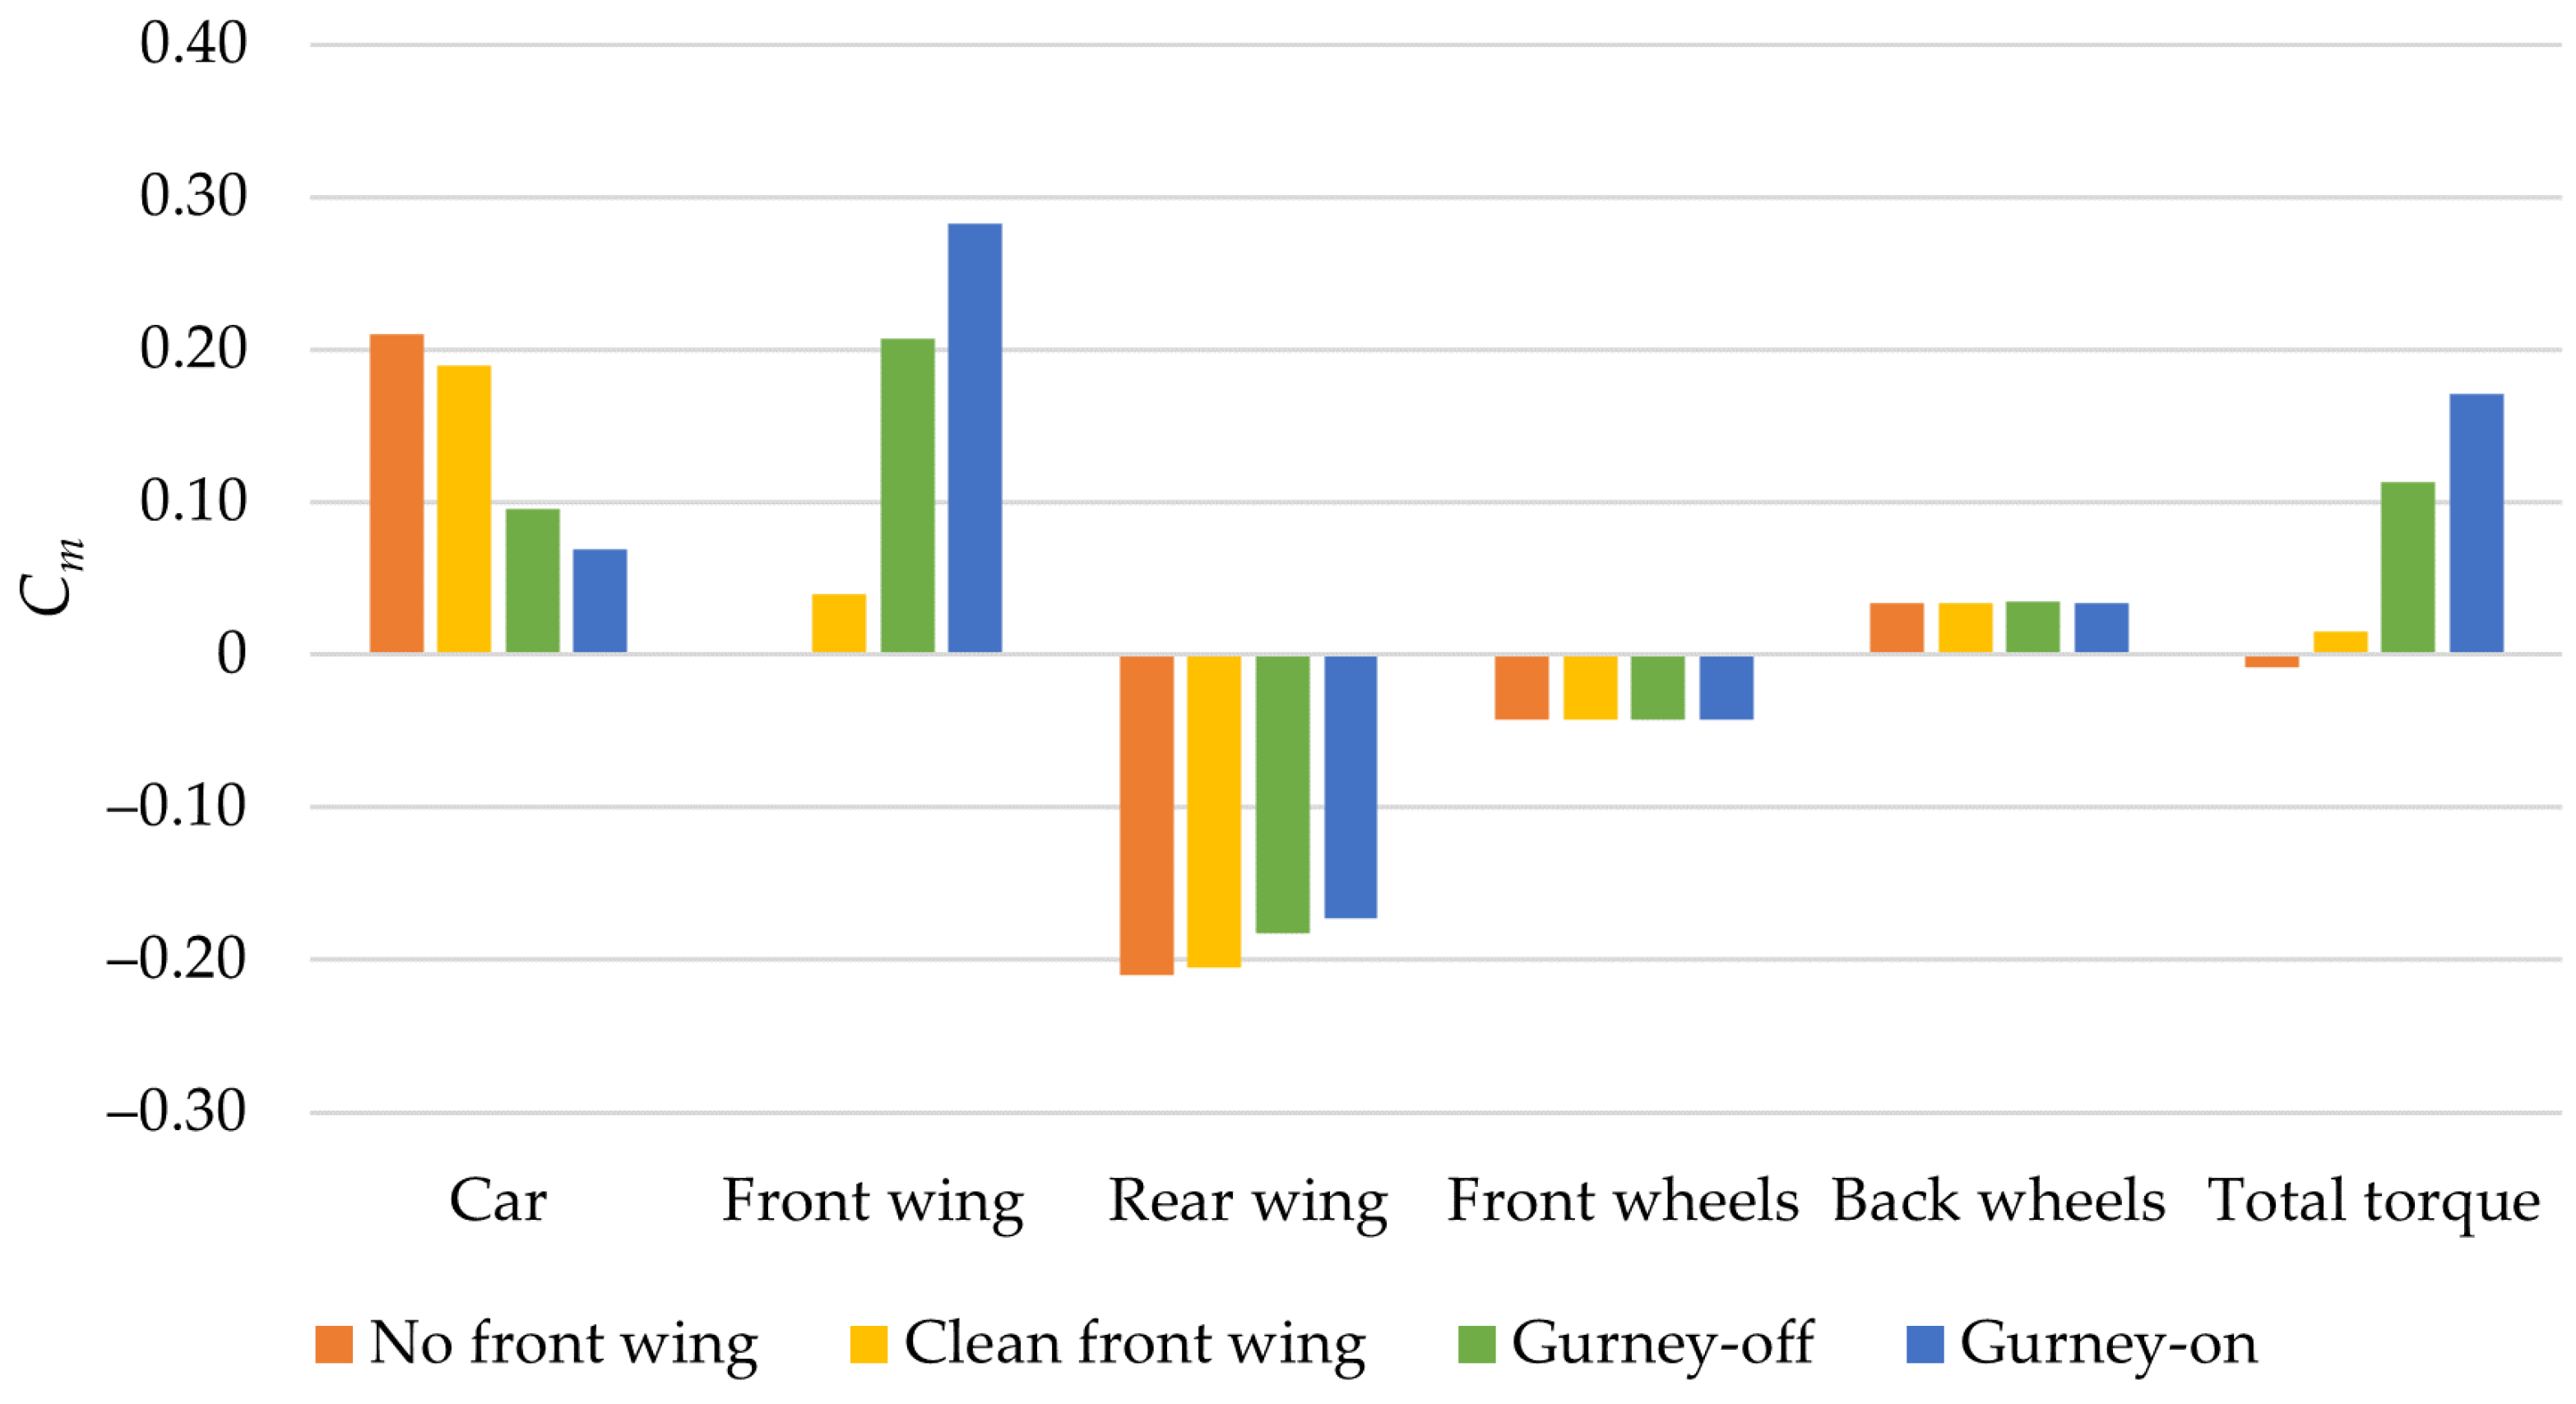
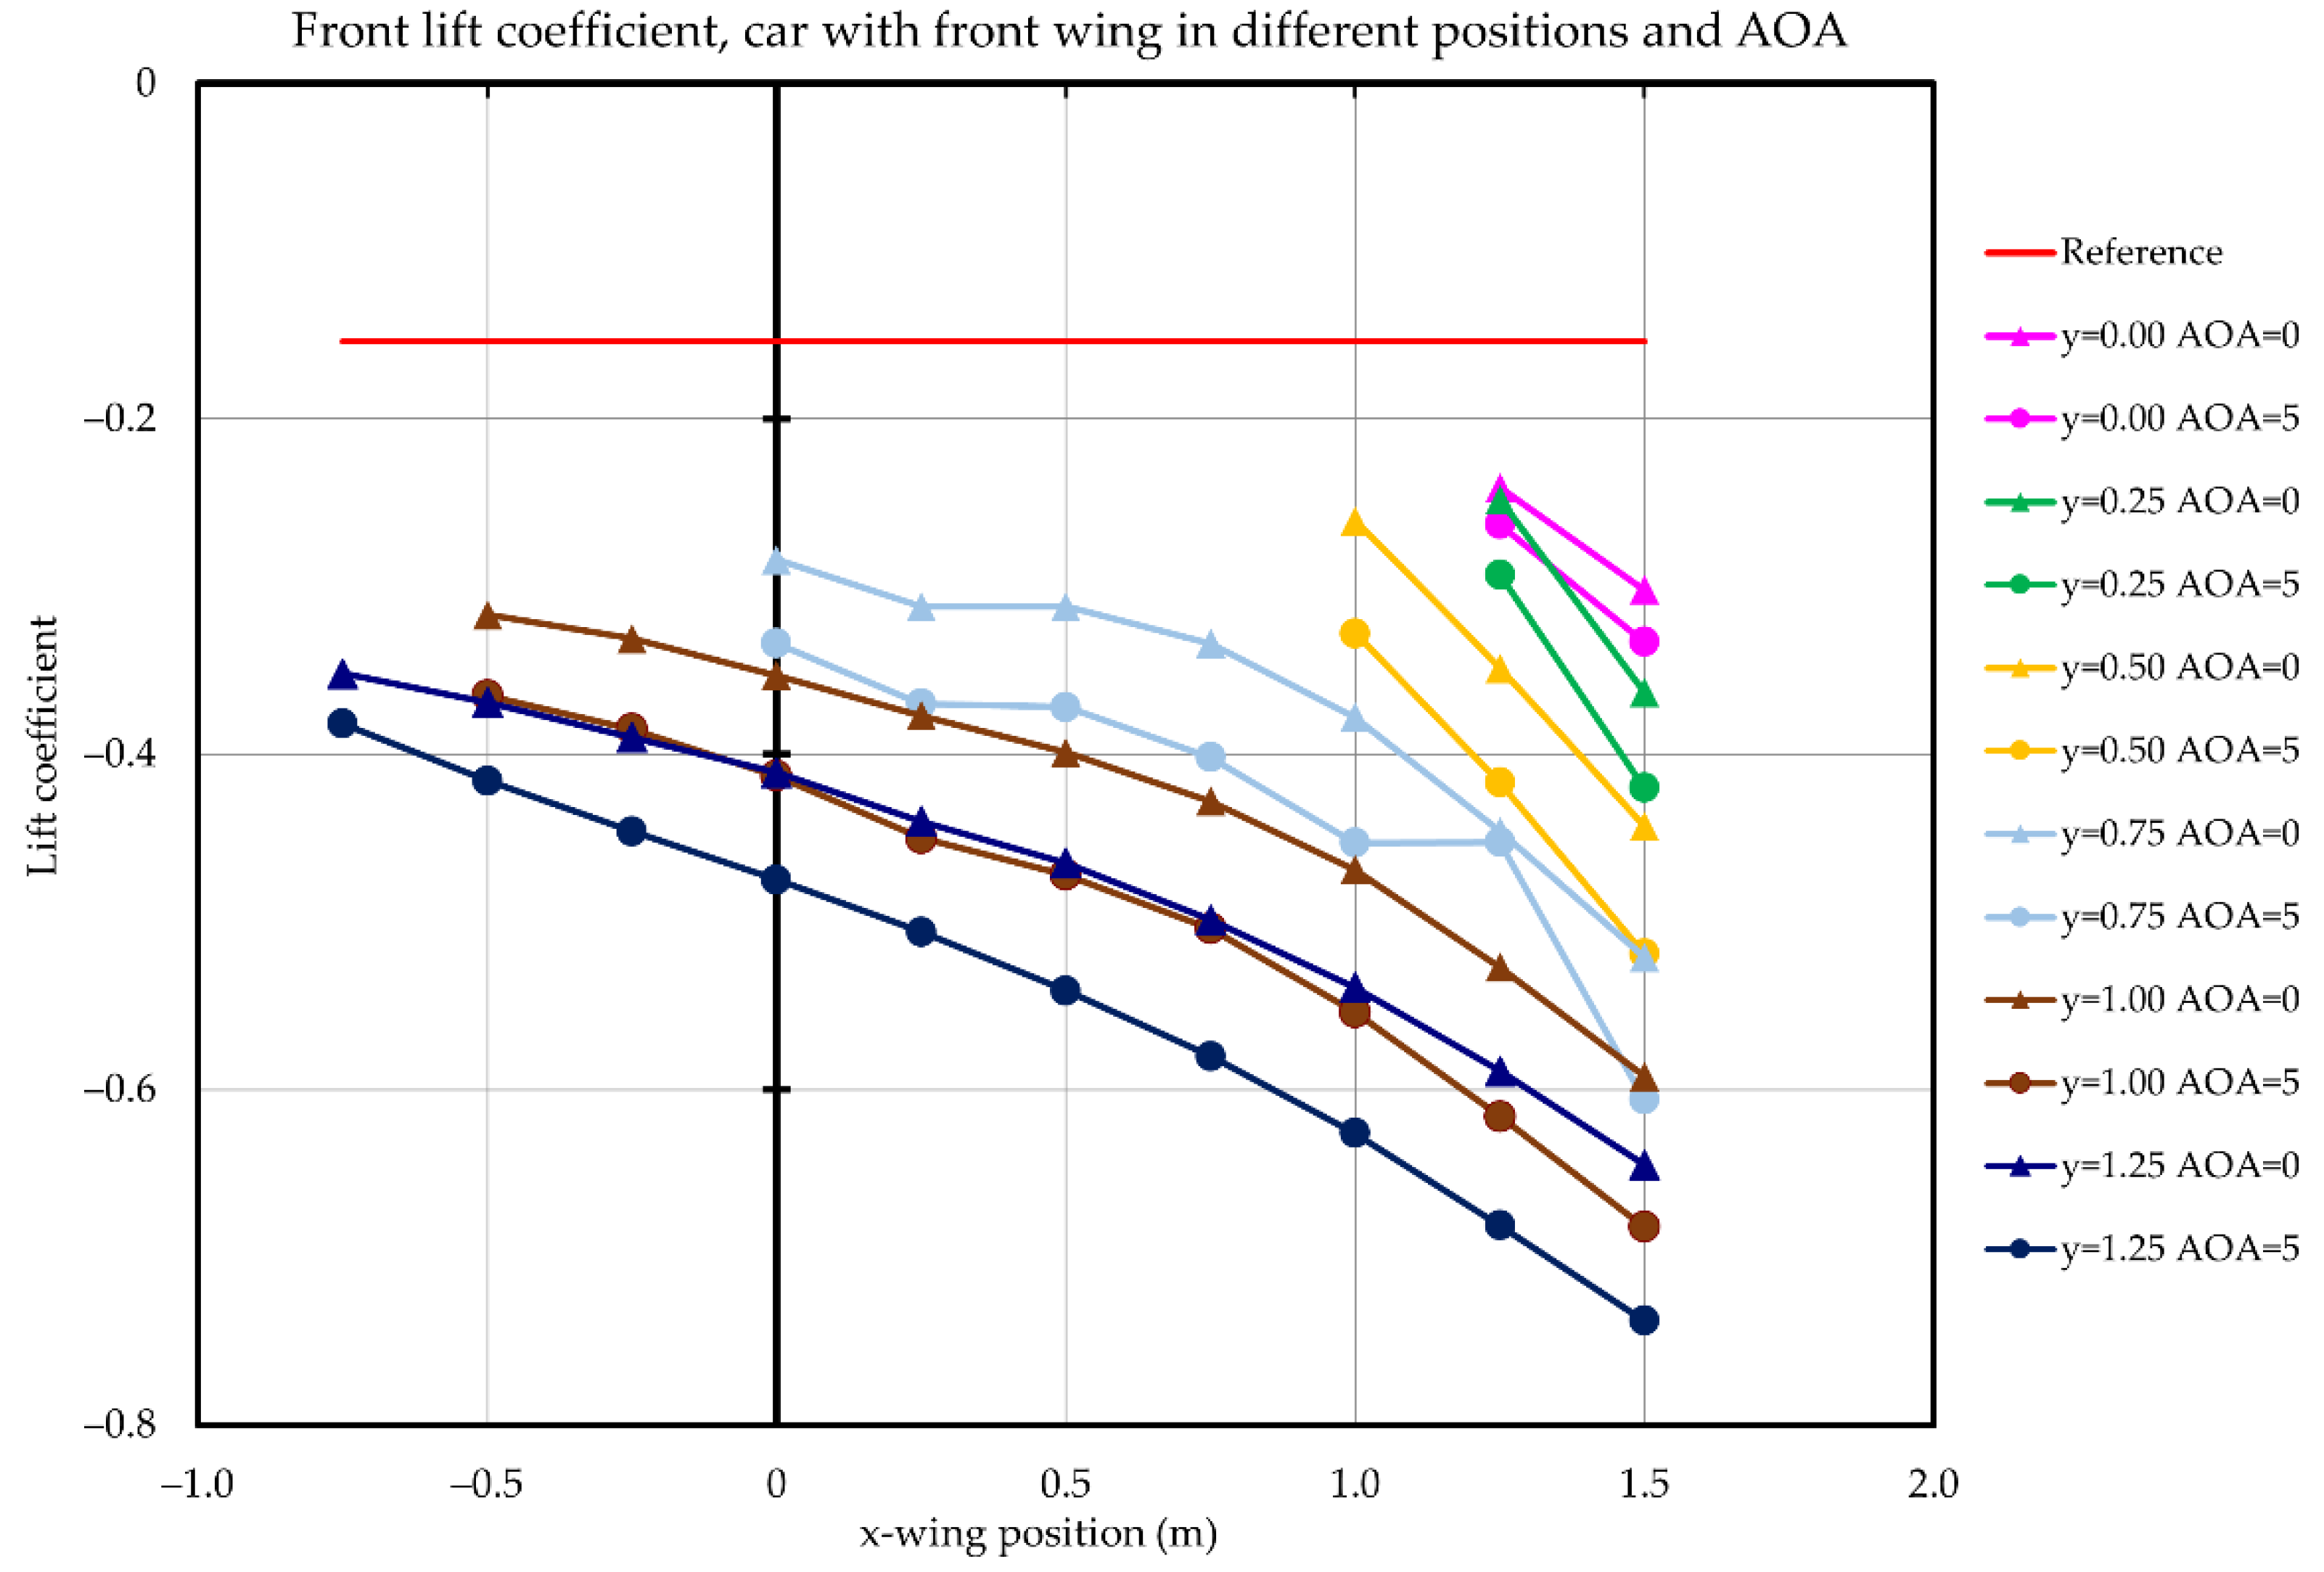
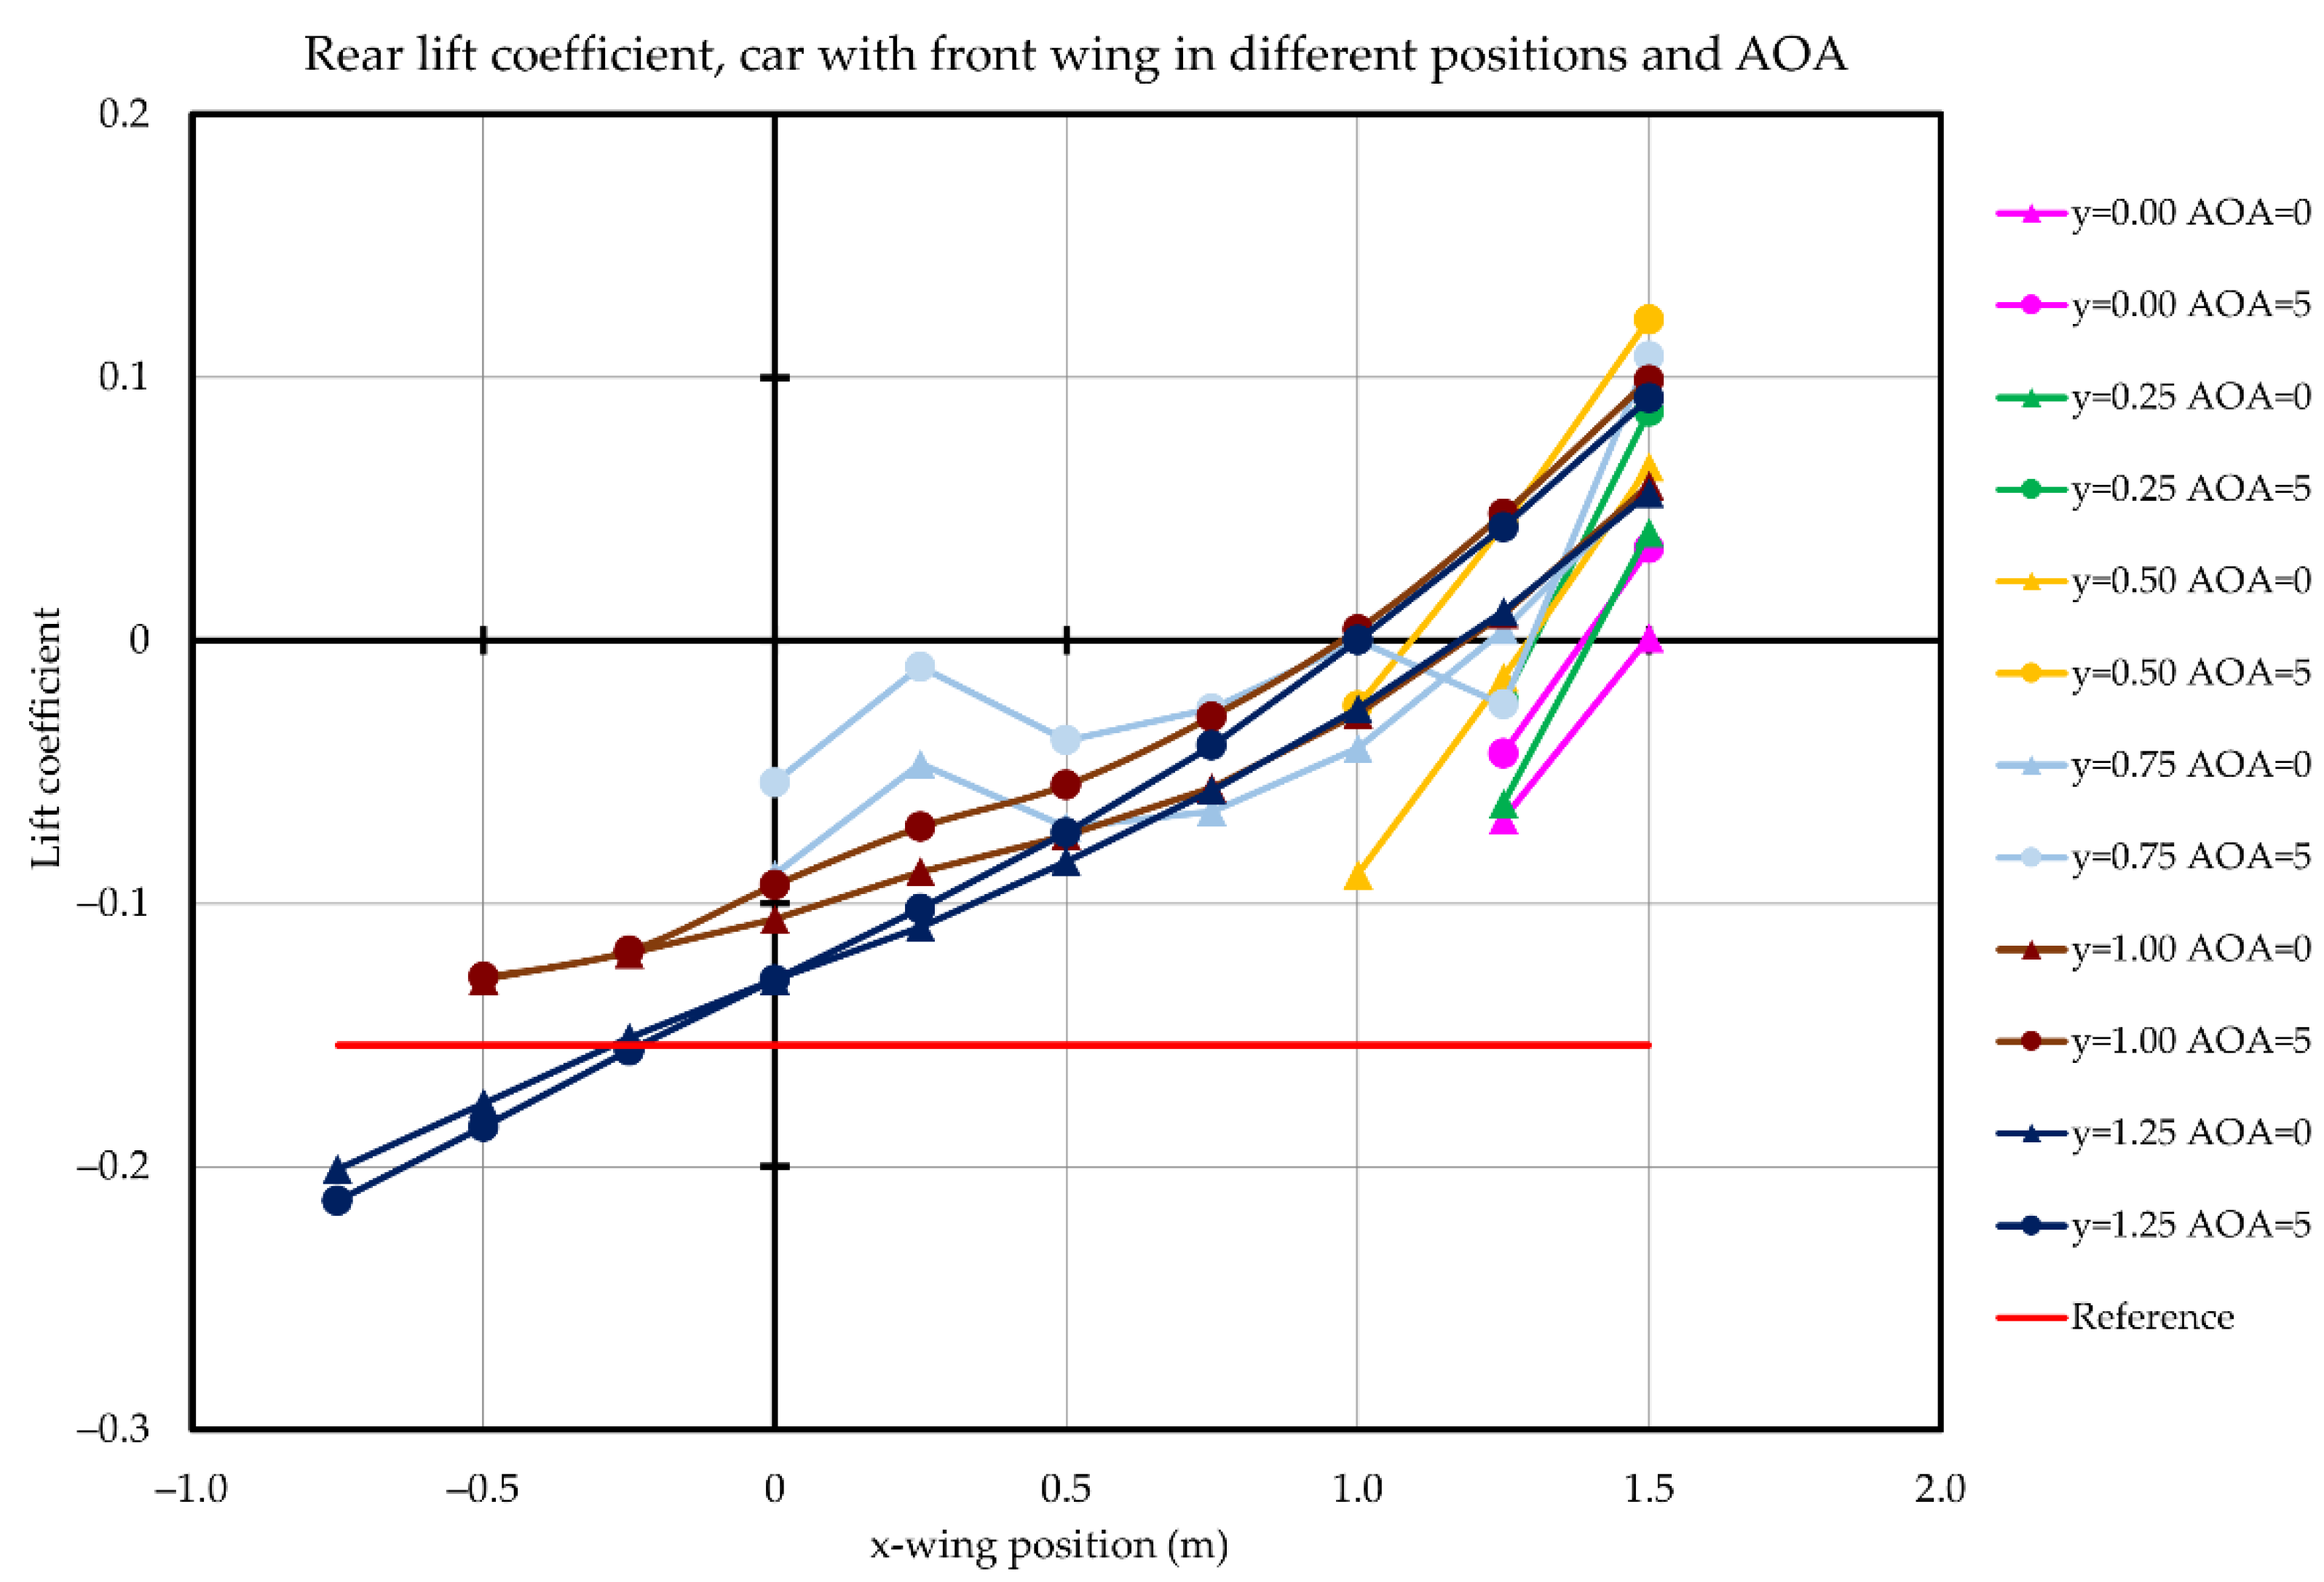
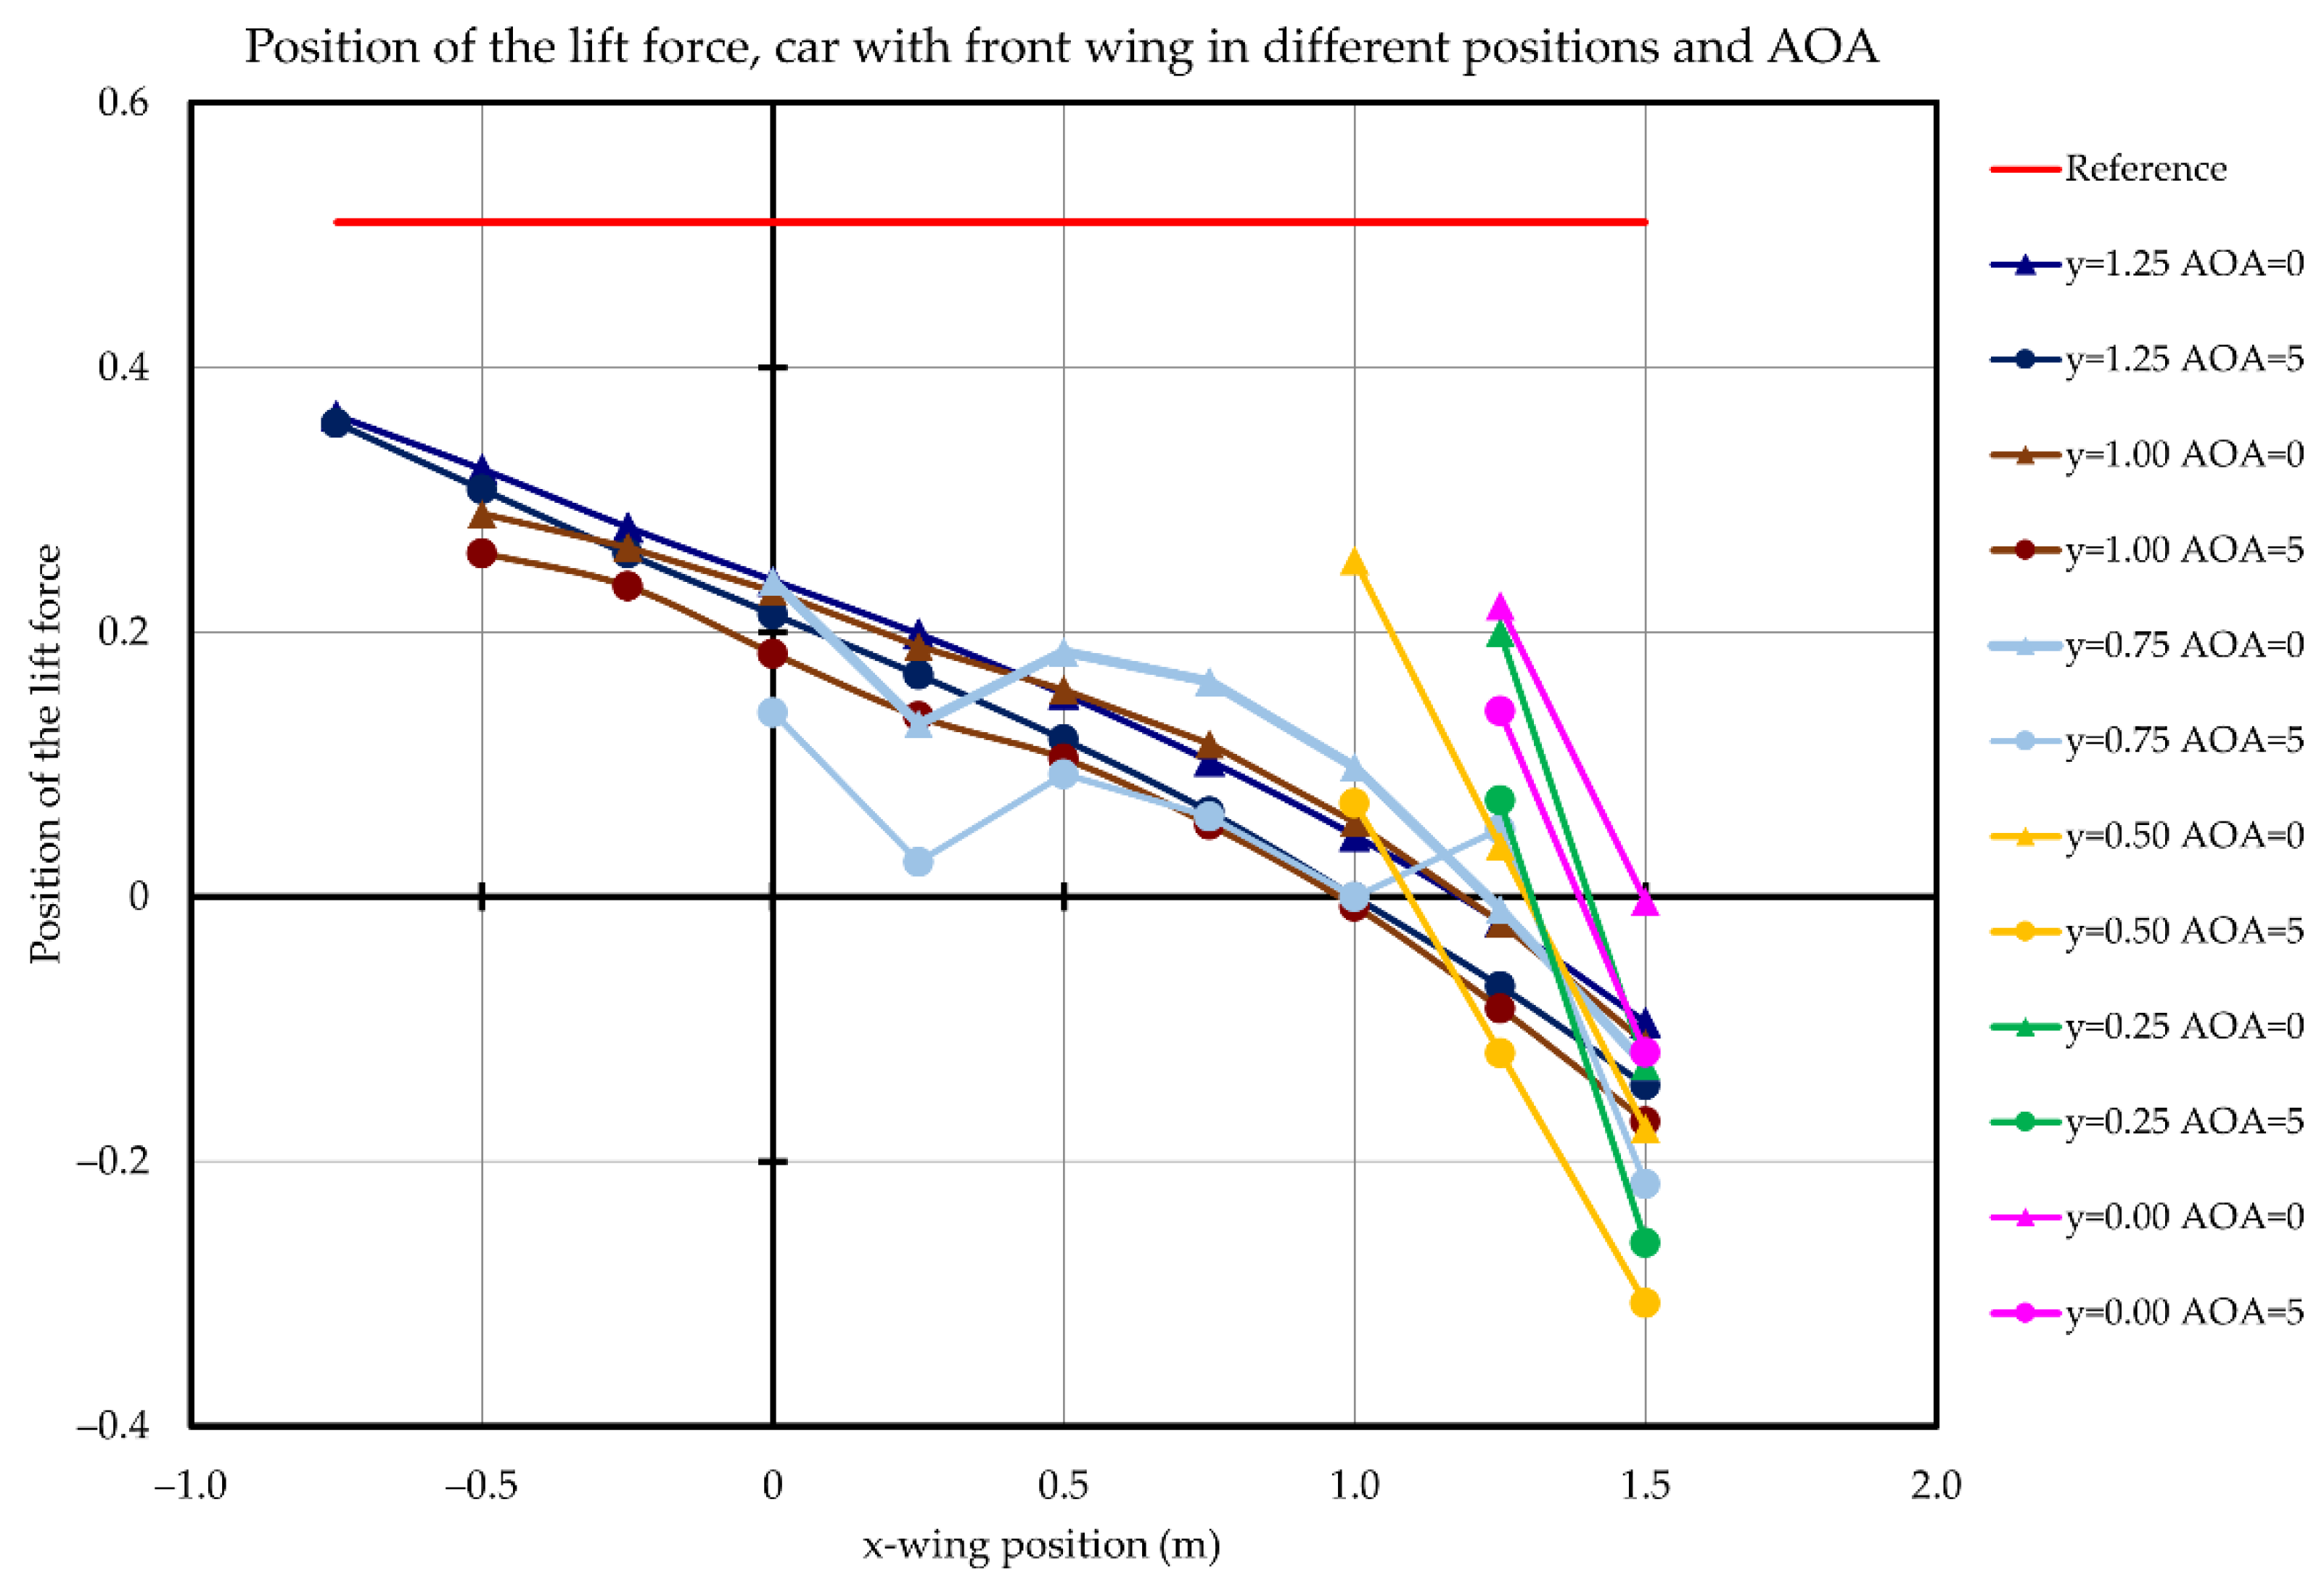
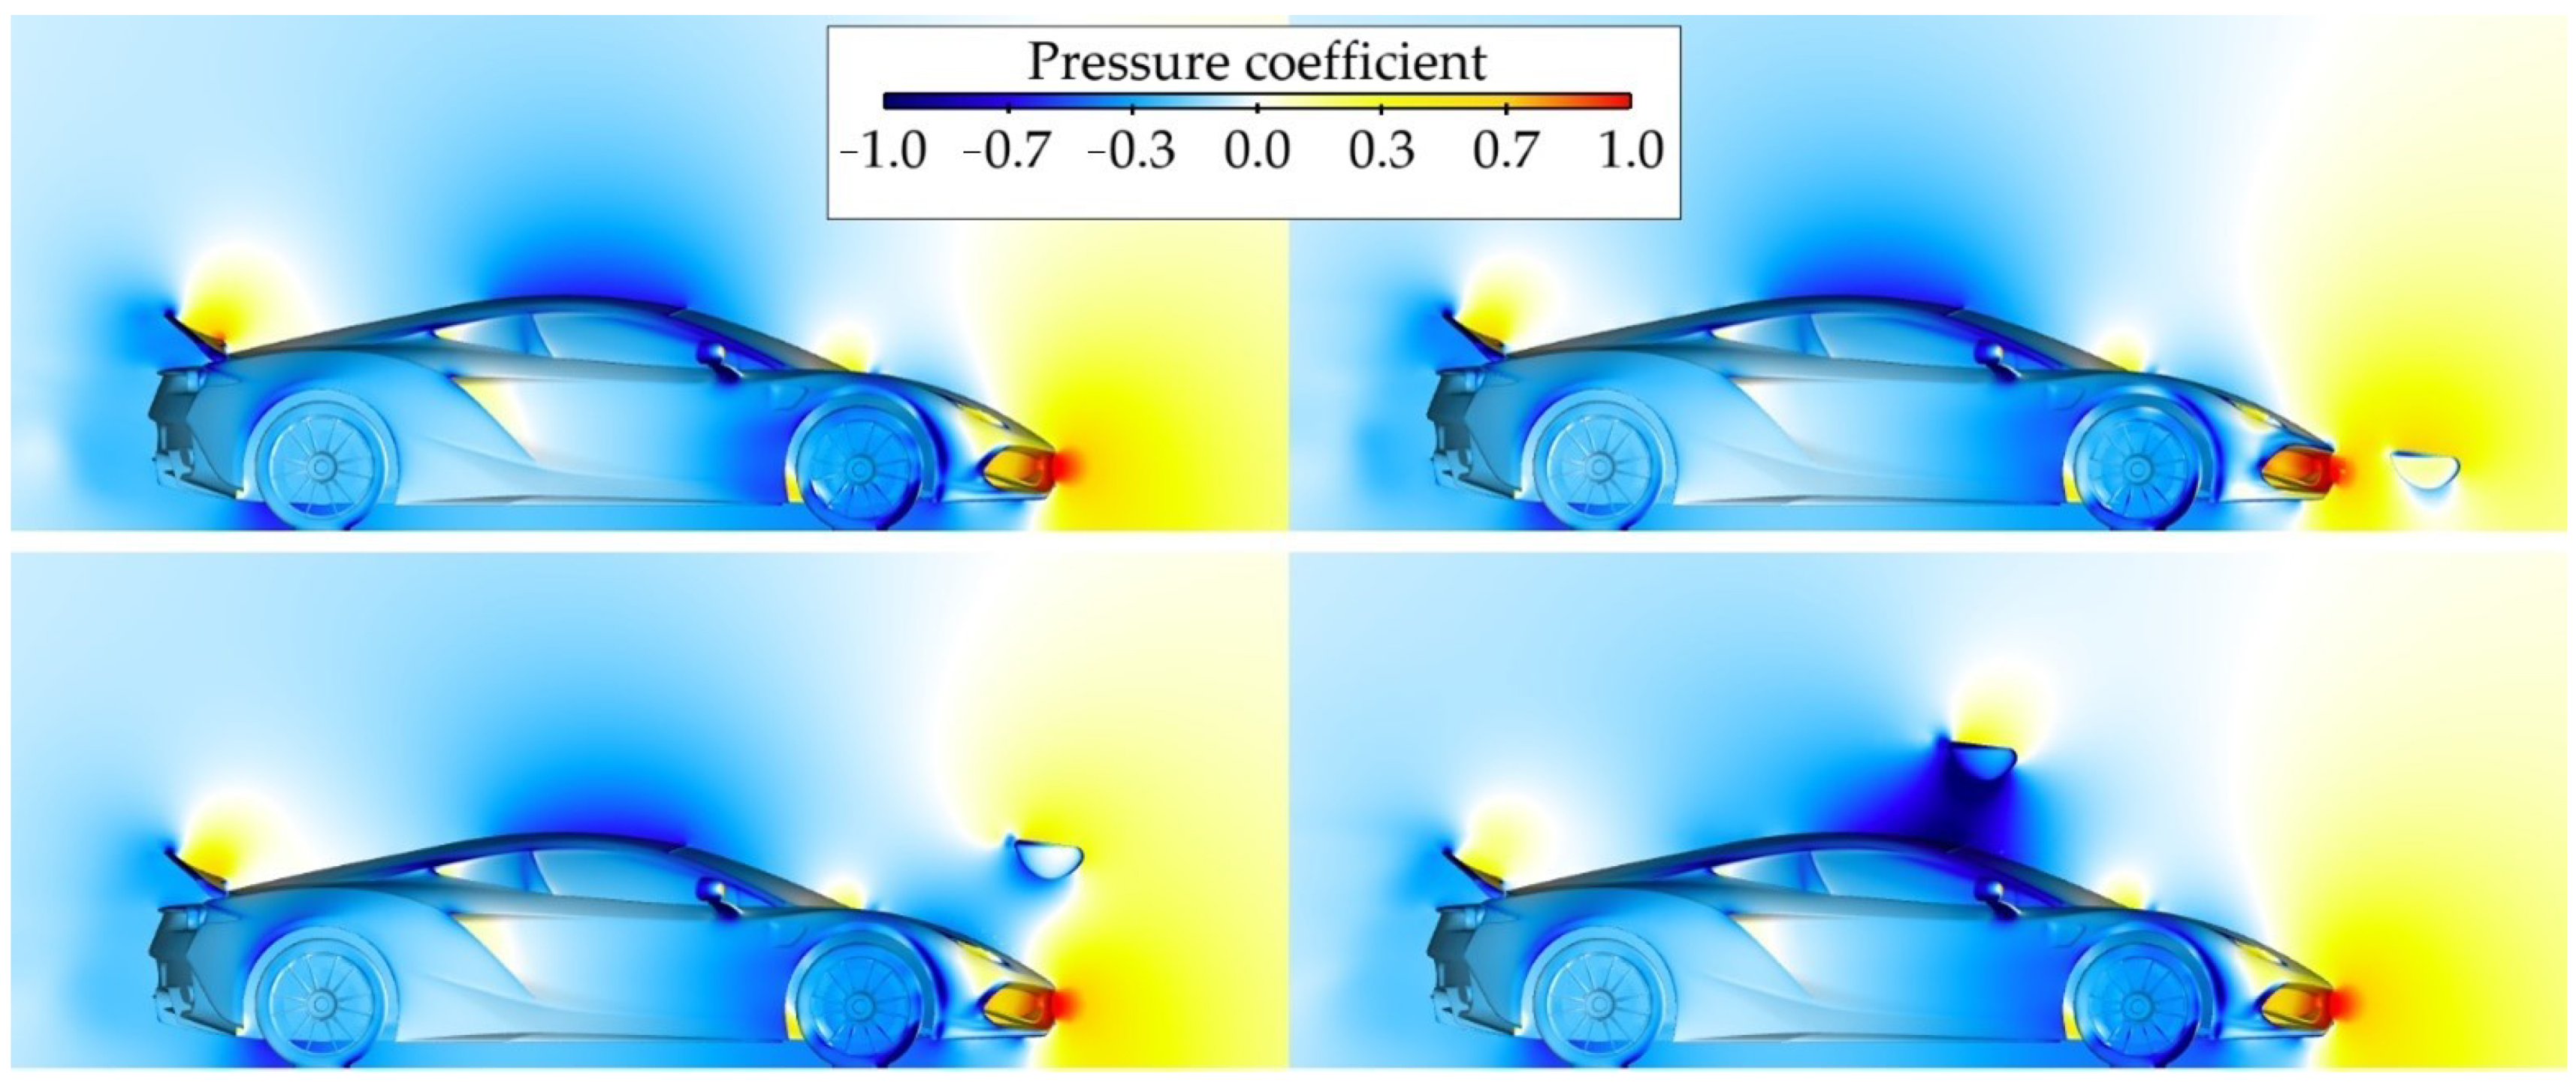
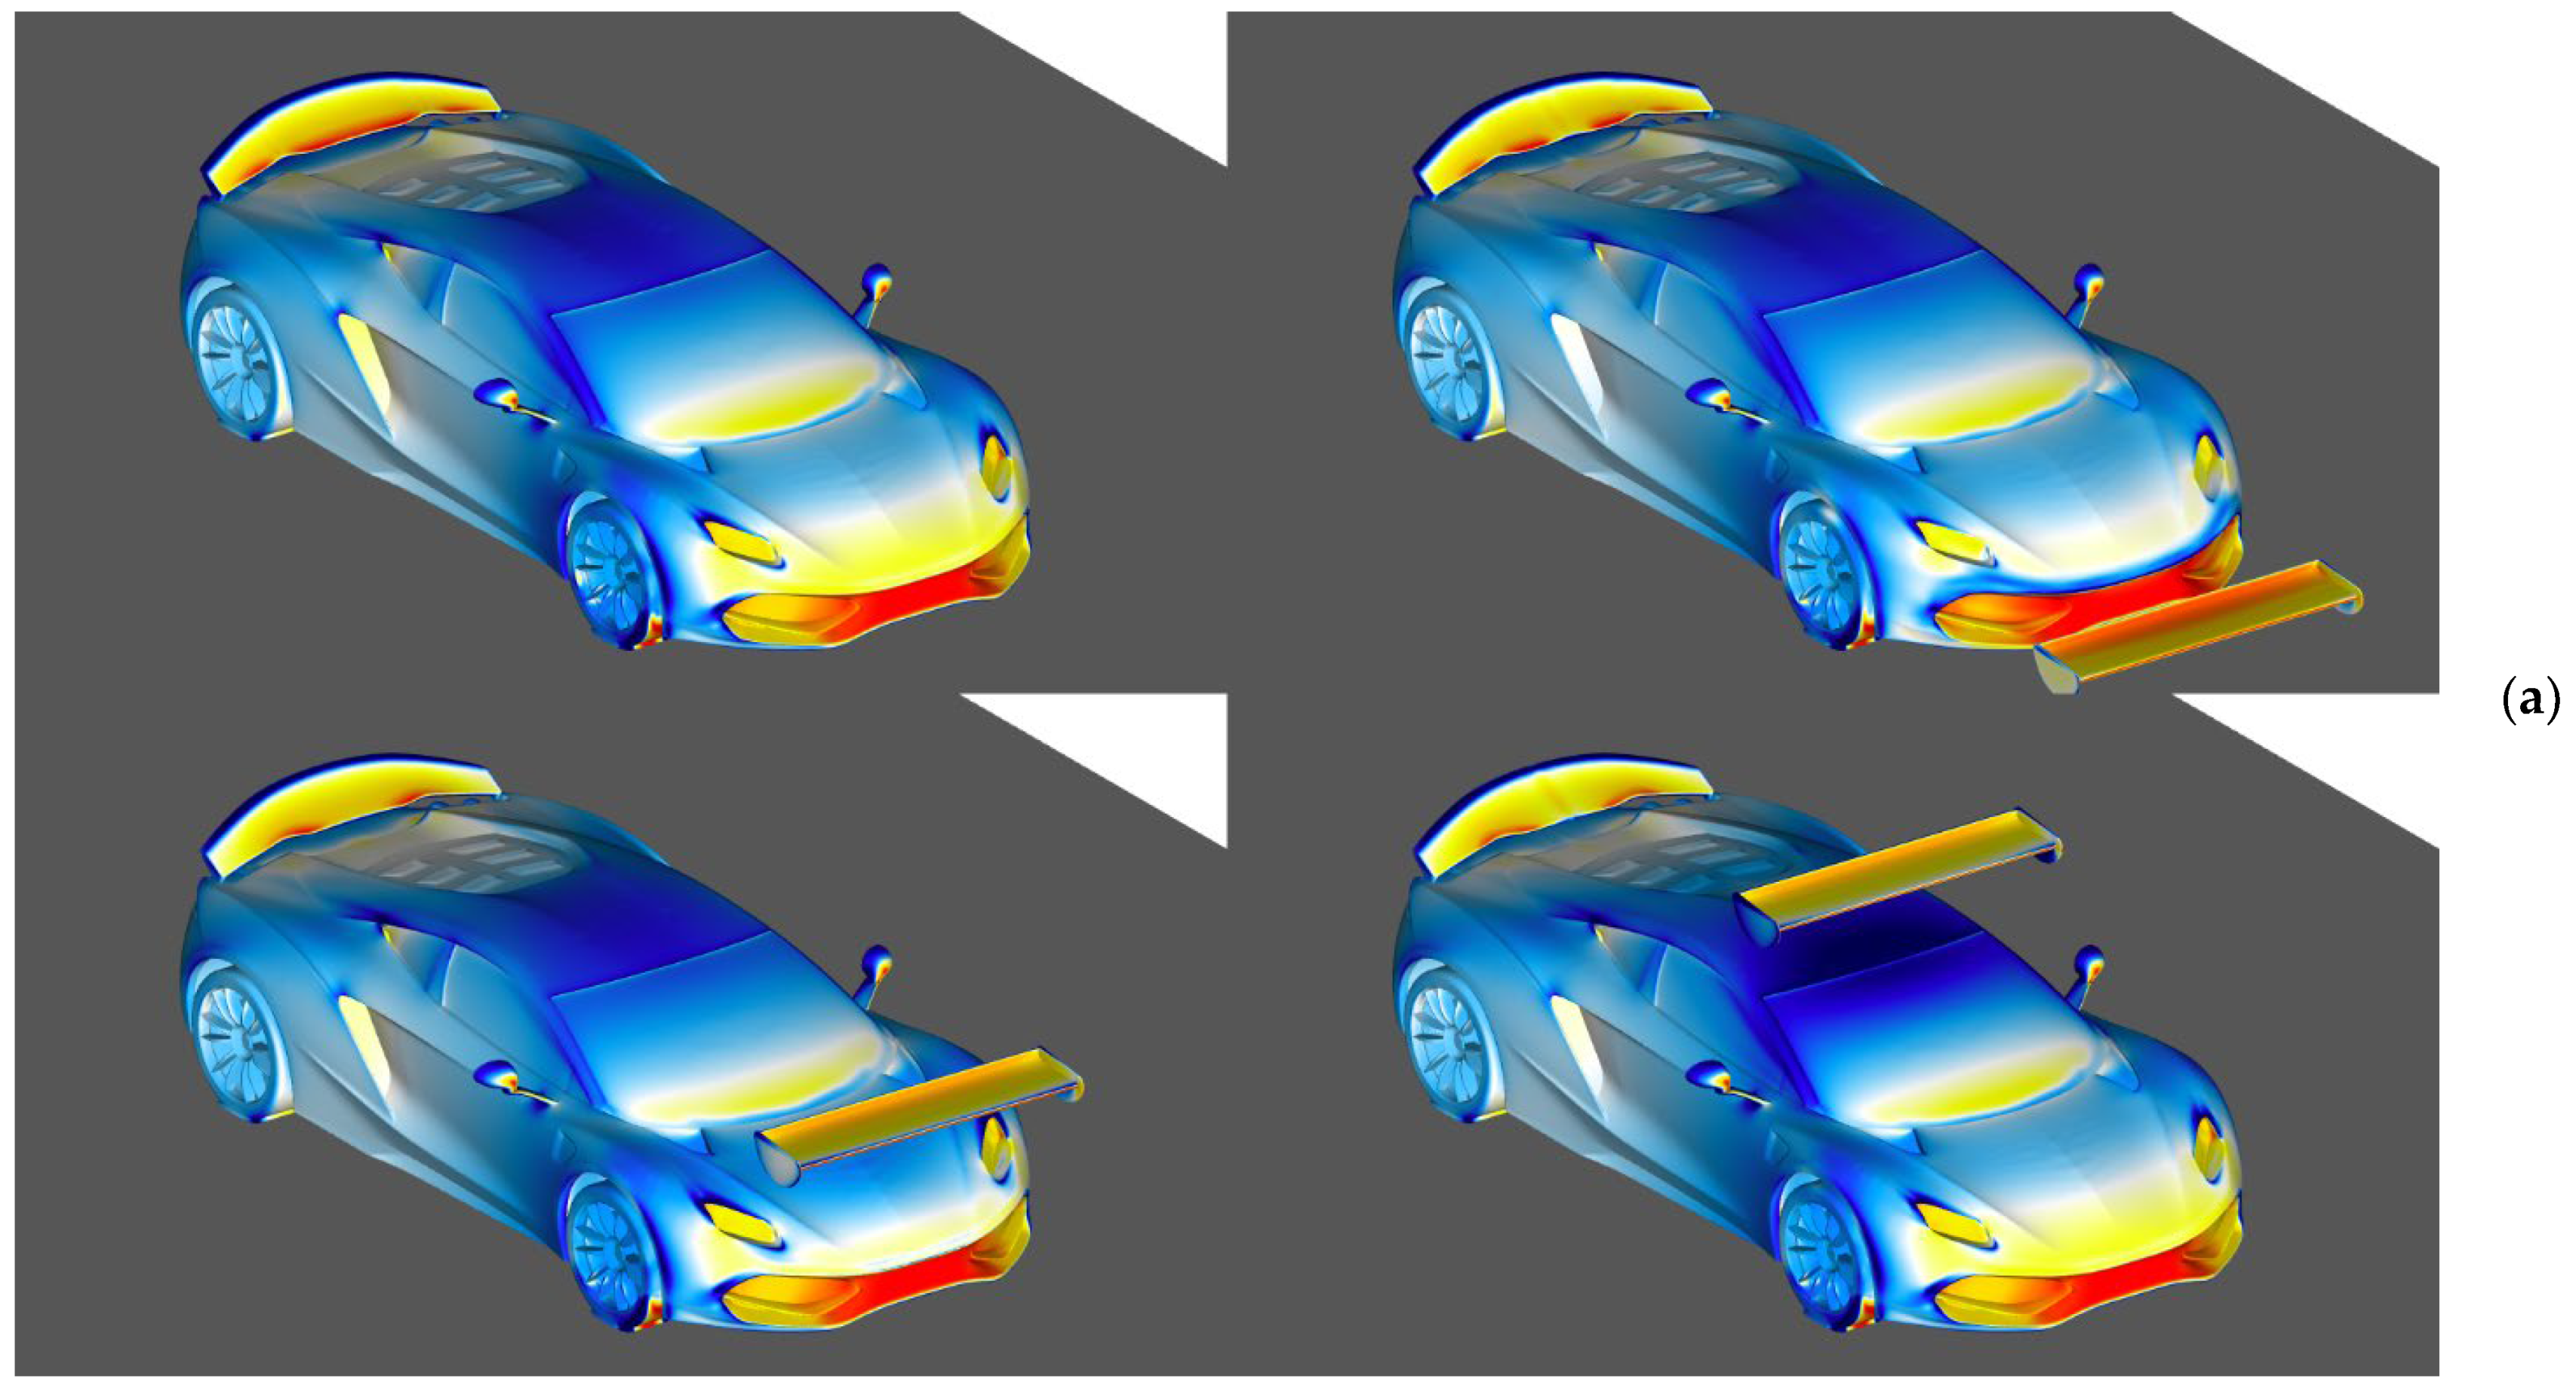
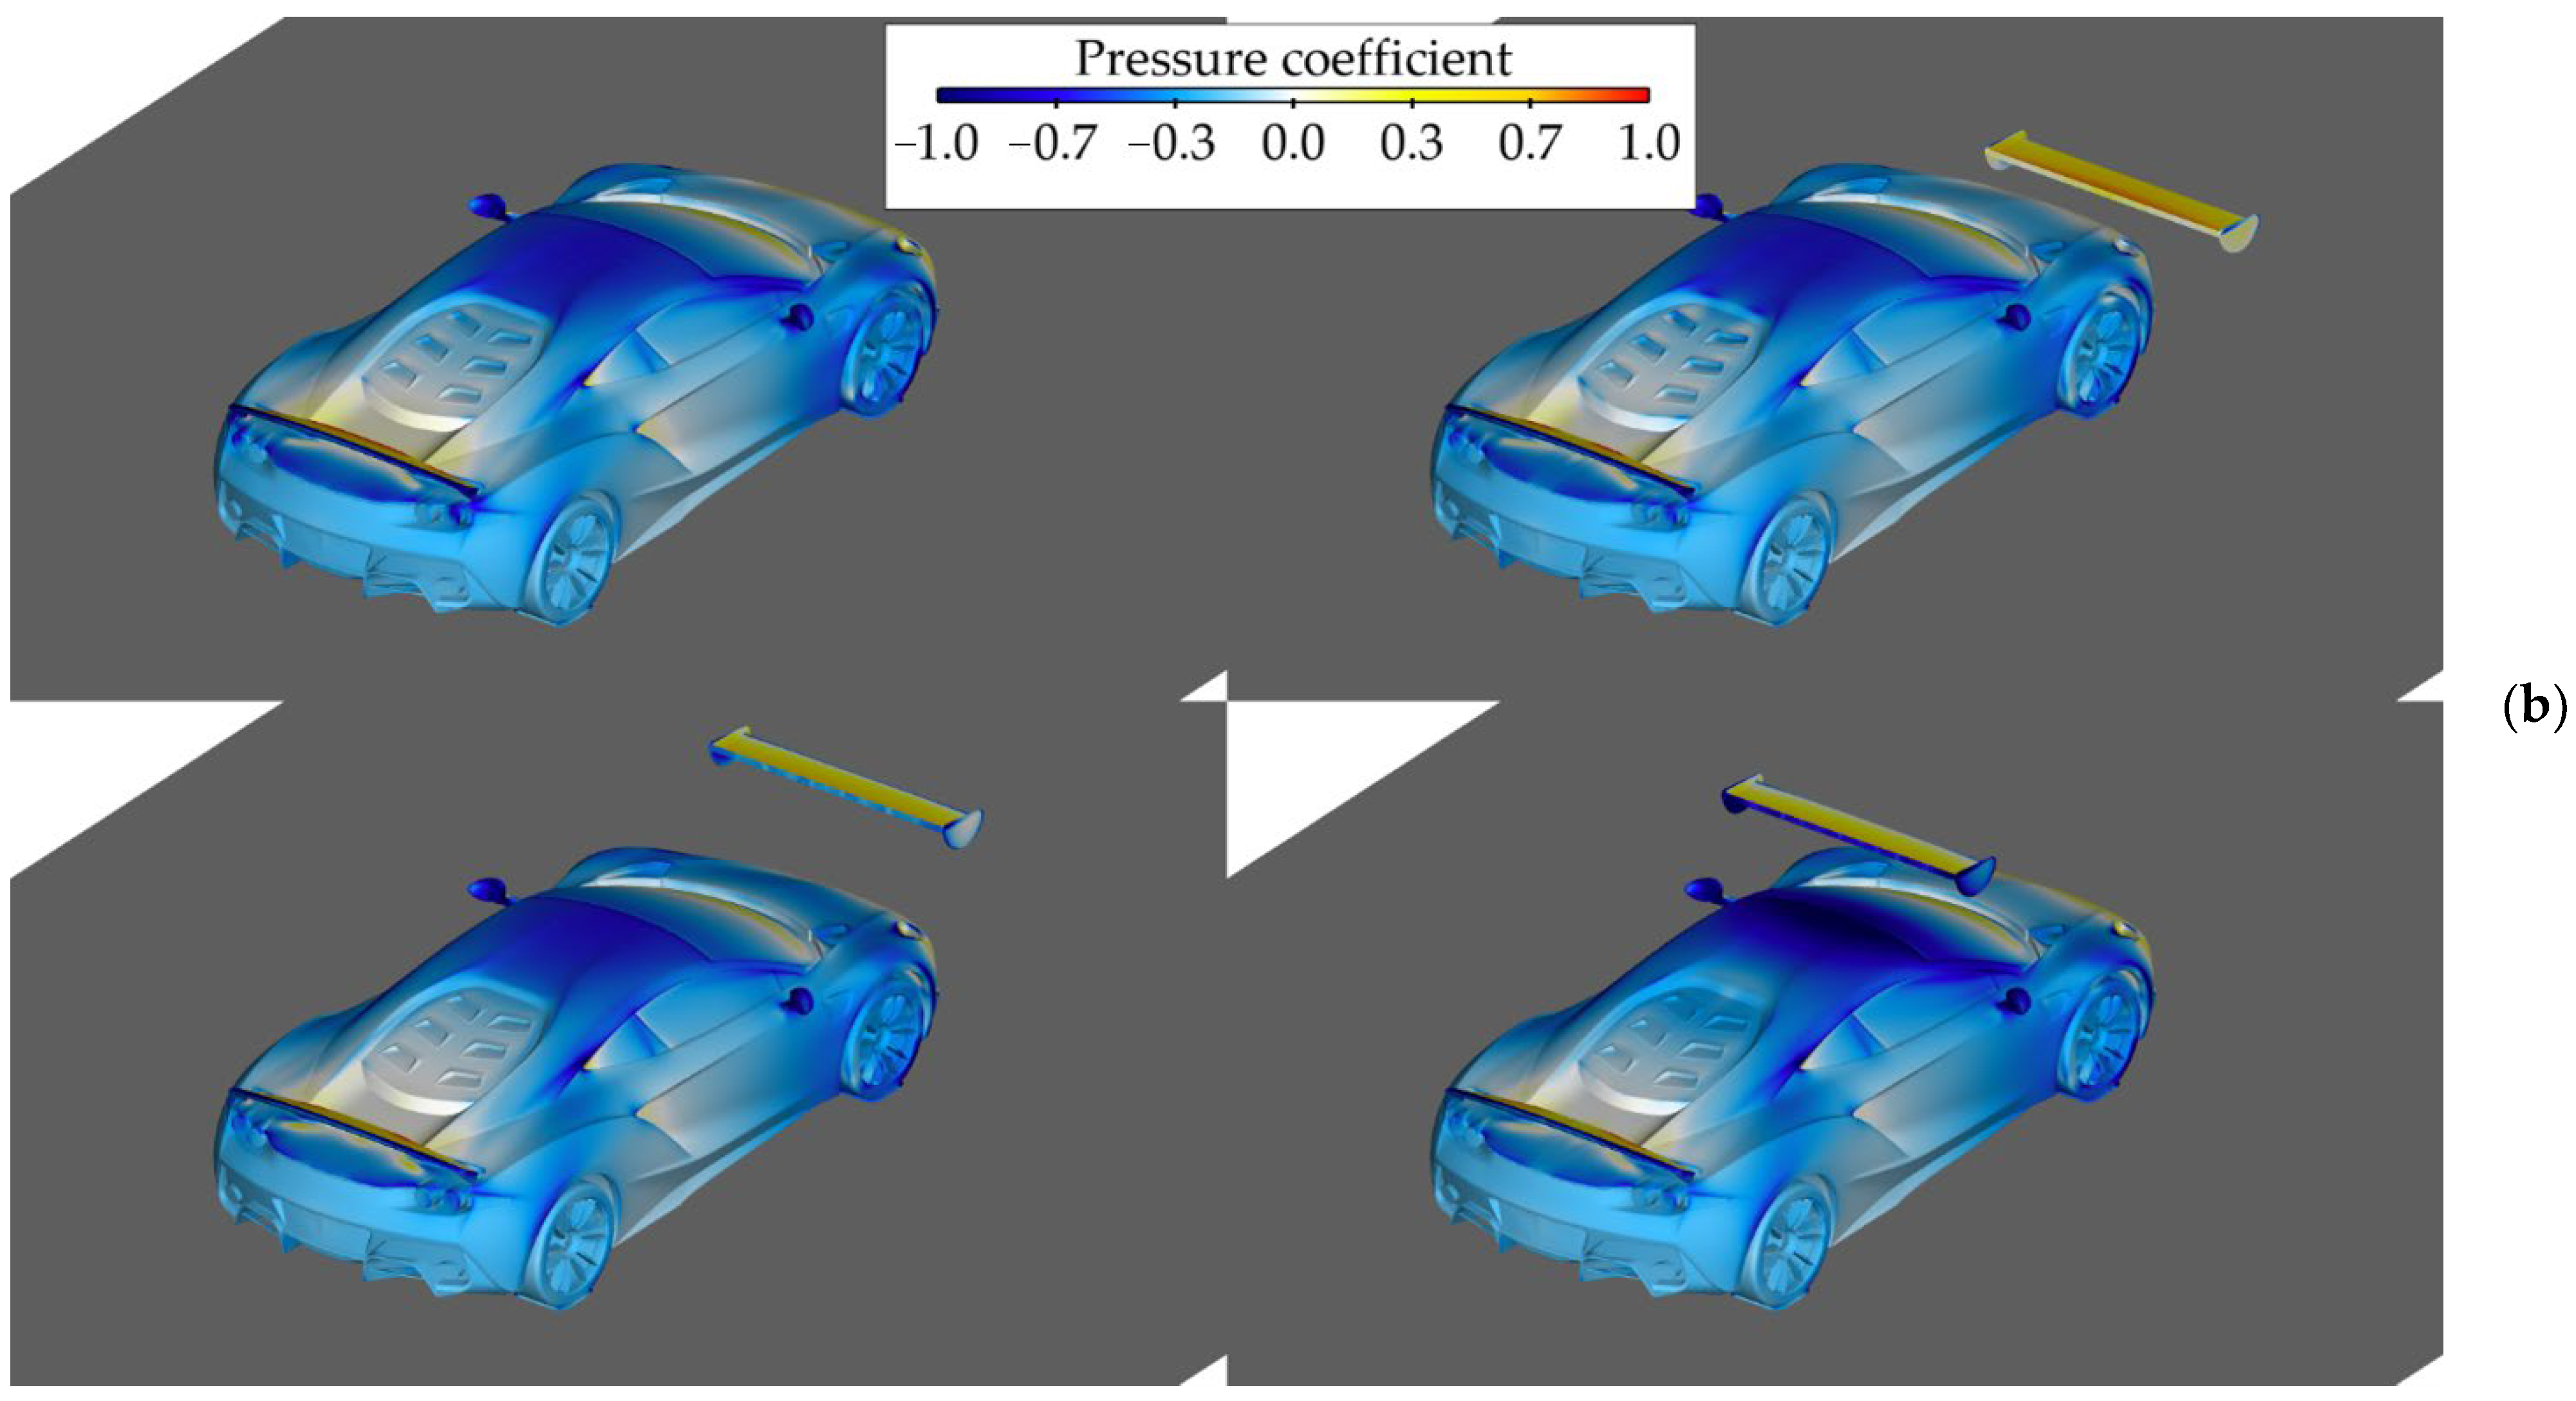
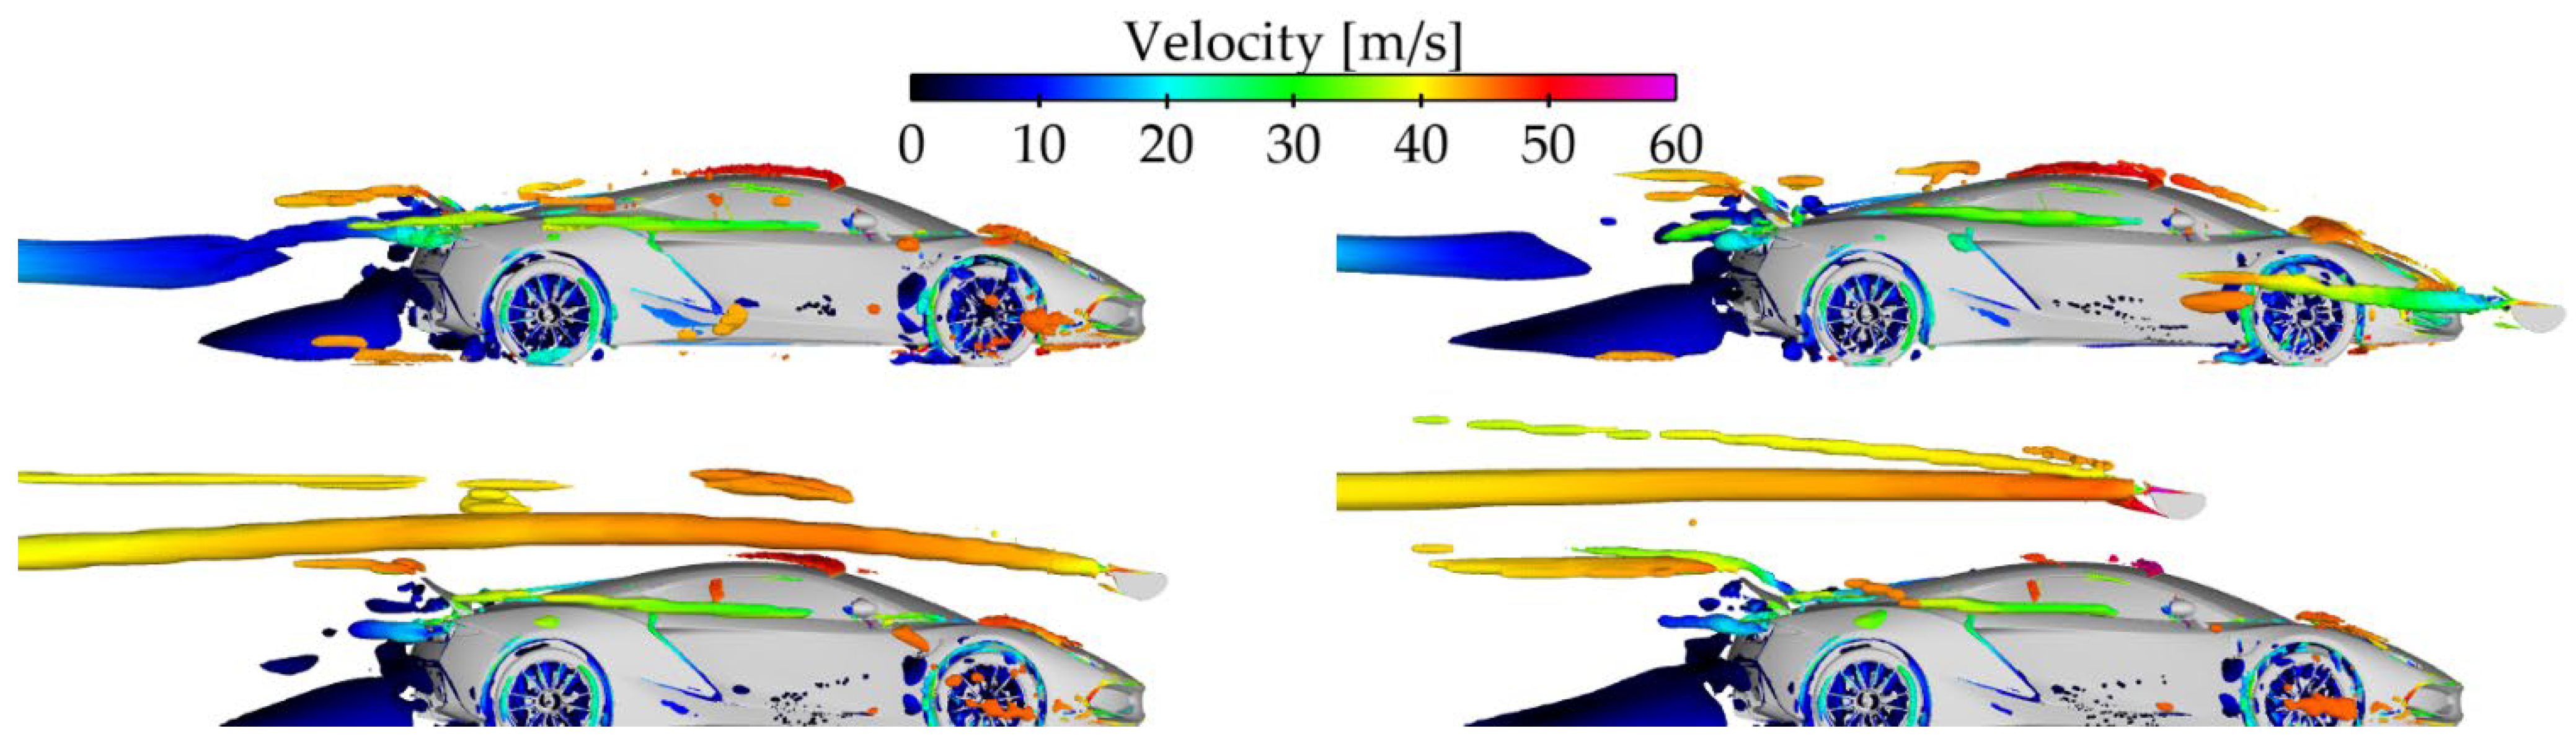
This paper presents an analysis of the effects of the front wing position on the aerodynamic characteristics of a sports car. The initially aerodynamically balanced load distribution of both axes of the vehicle changed tremendously after the front wing was added, depending on its front position and wedge angle. The vehicle began to oversteer as the car in this configuration was unstable. There was a very strong coupling between the flow around the front wing itself and the flow around the vehicle body.
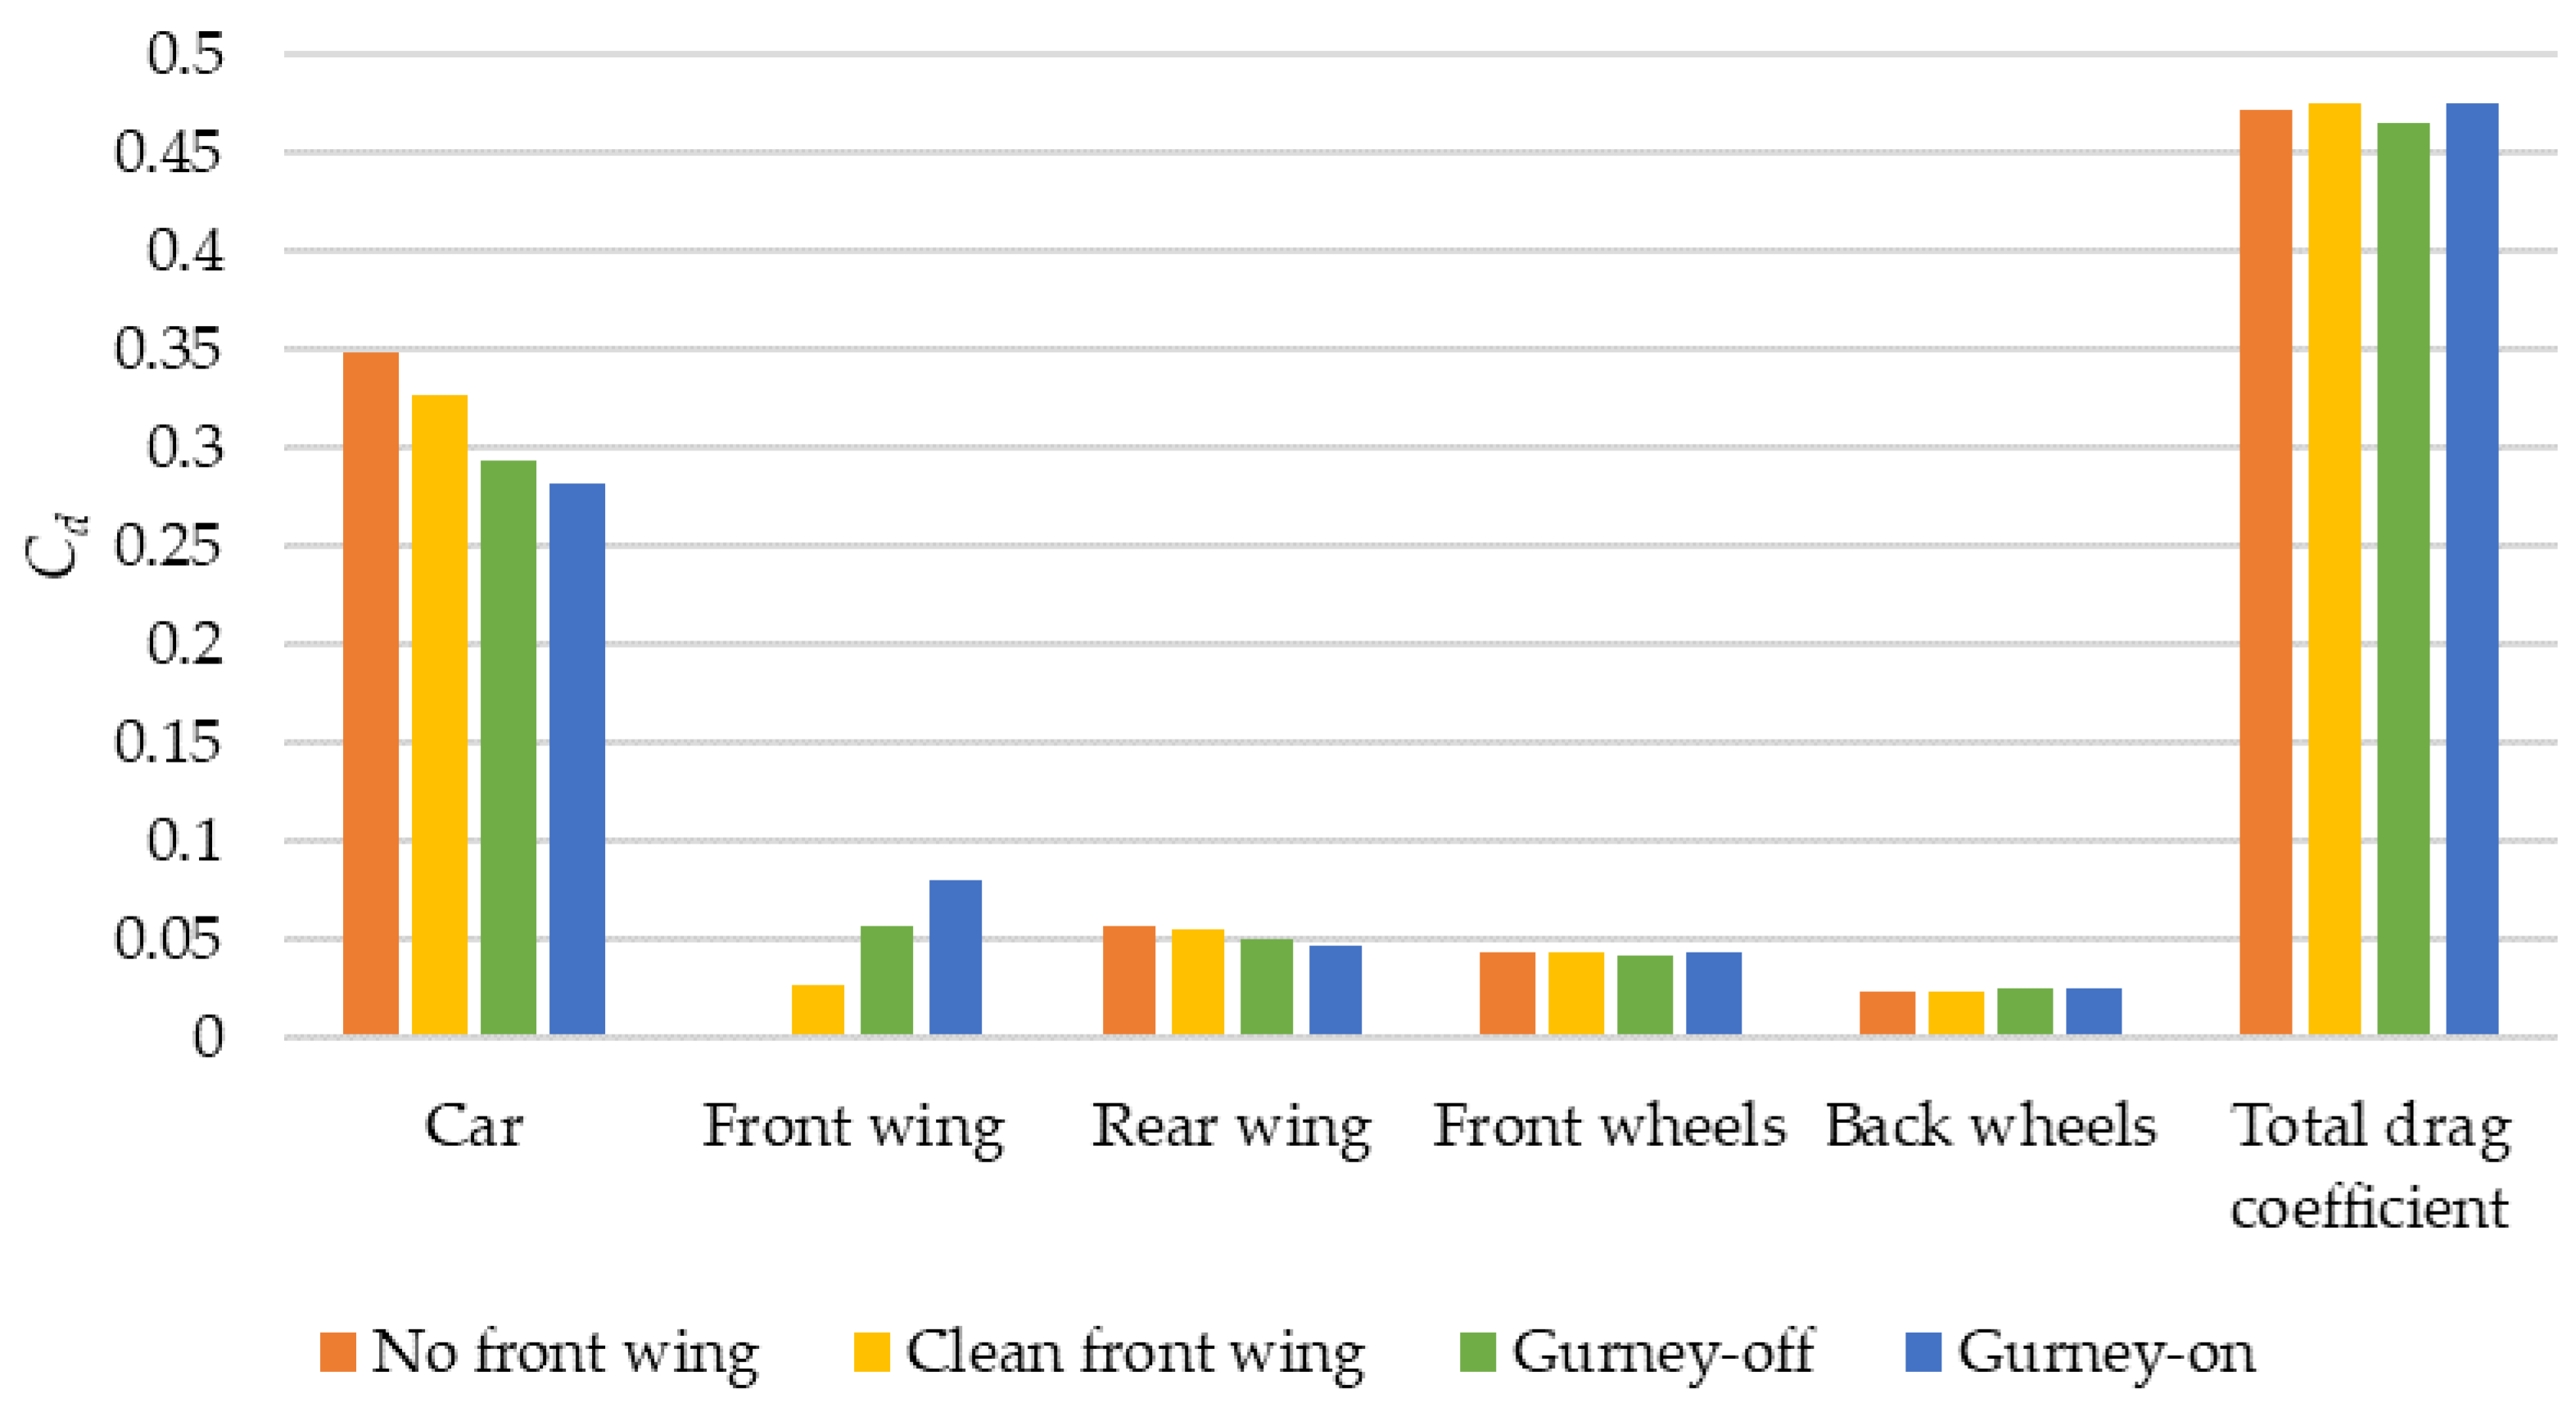
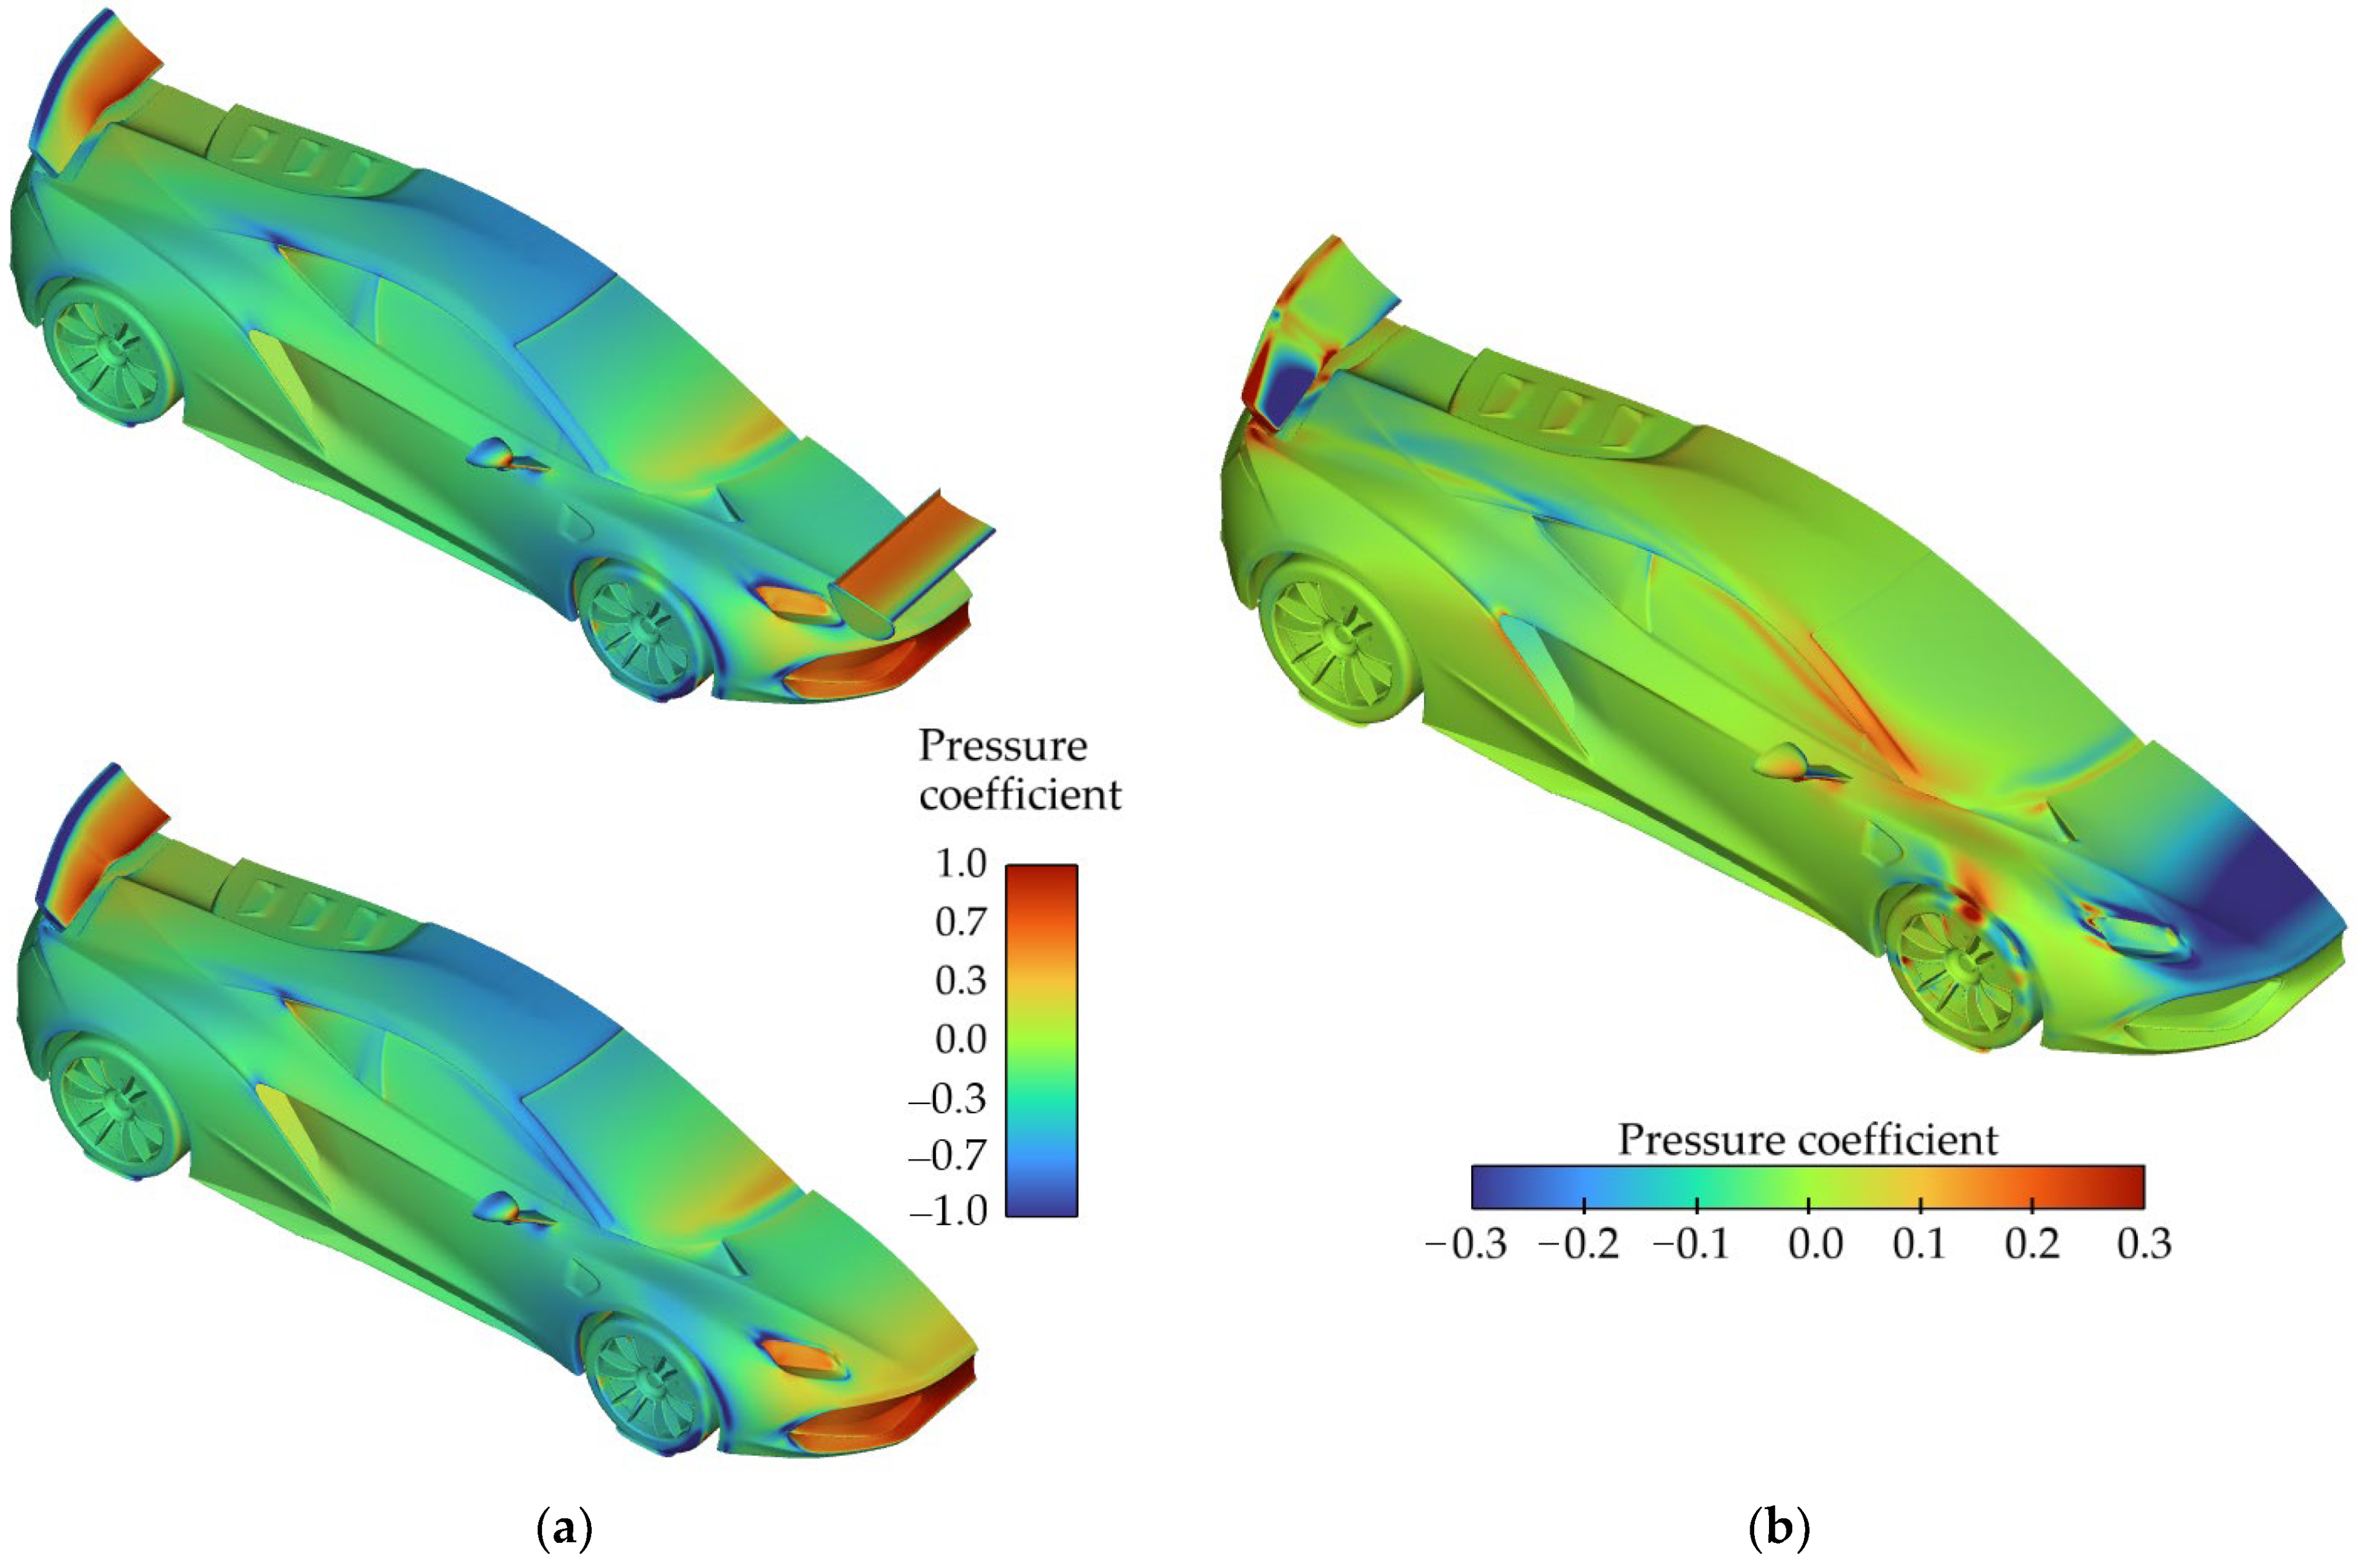
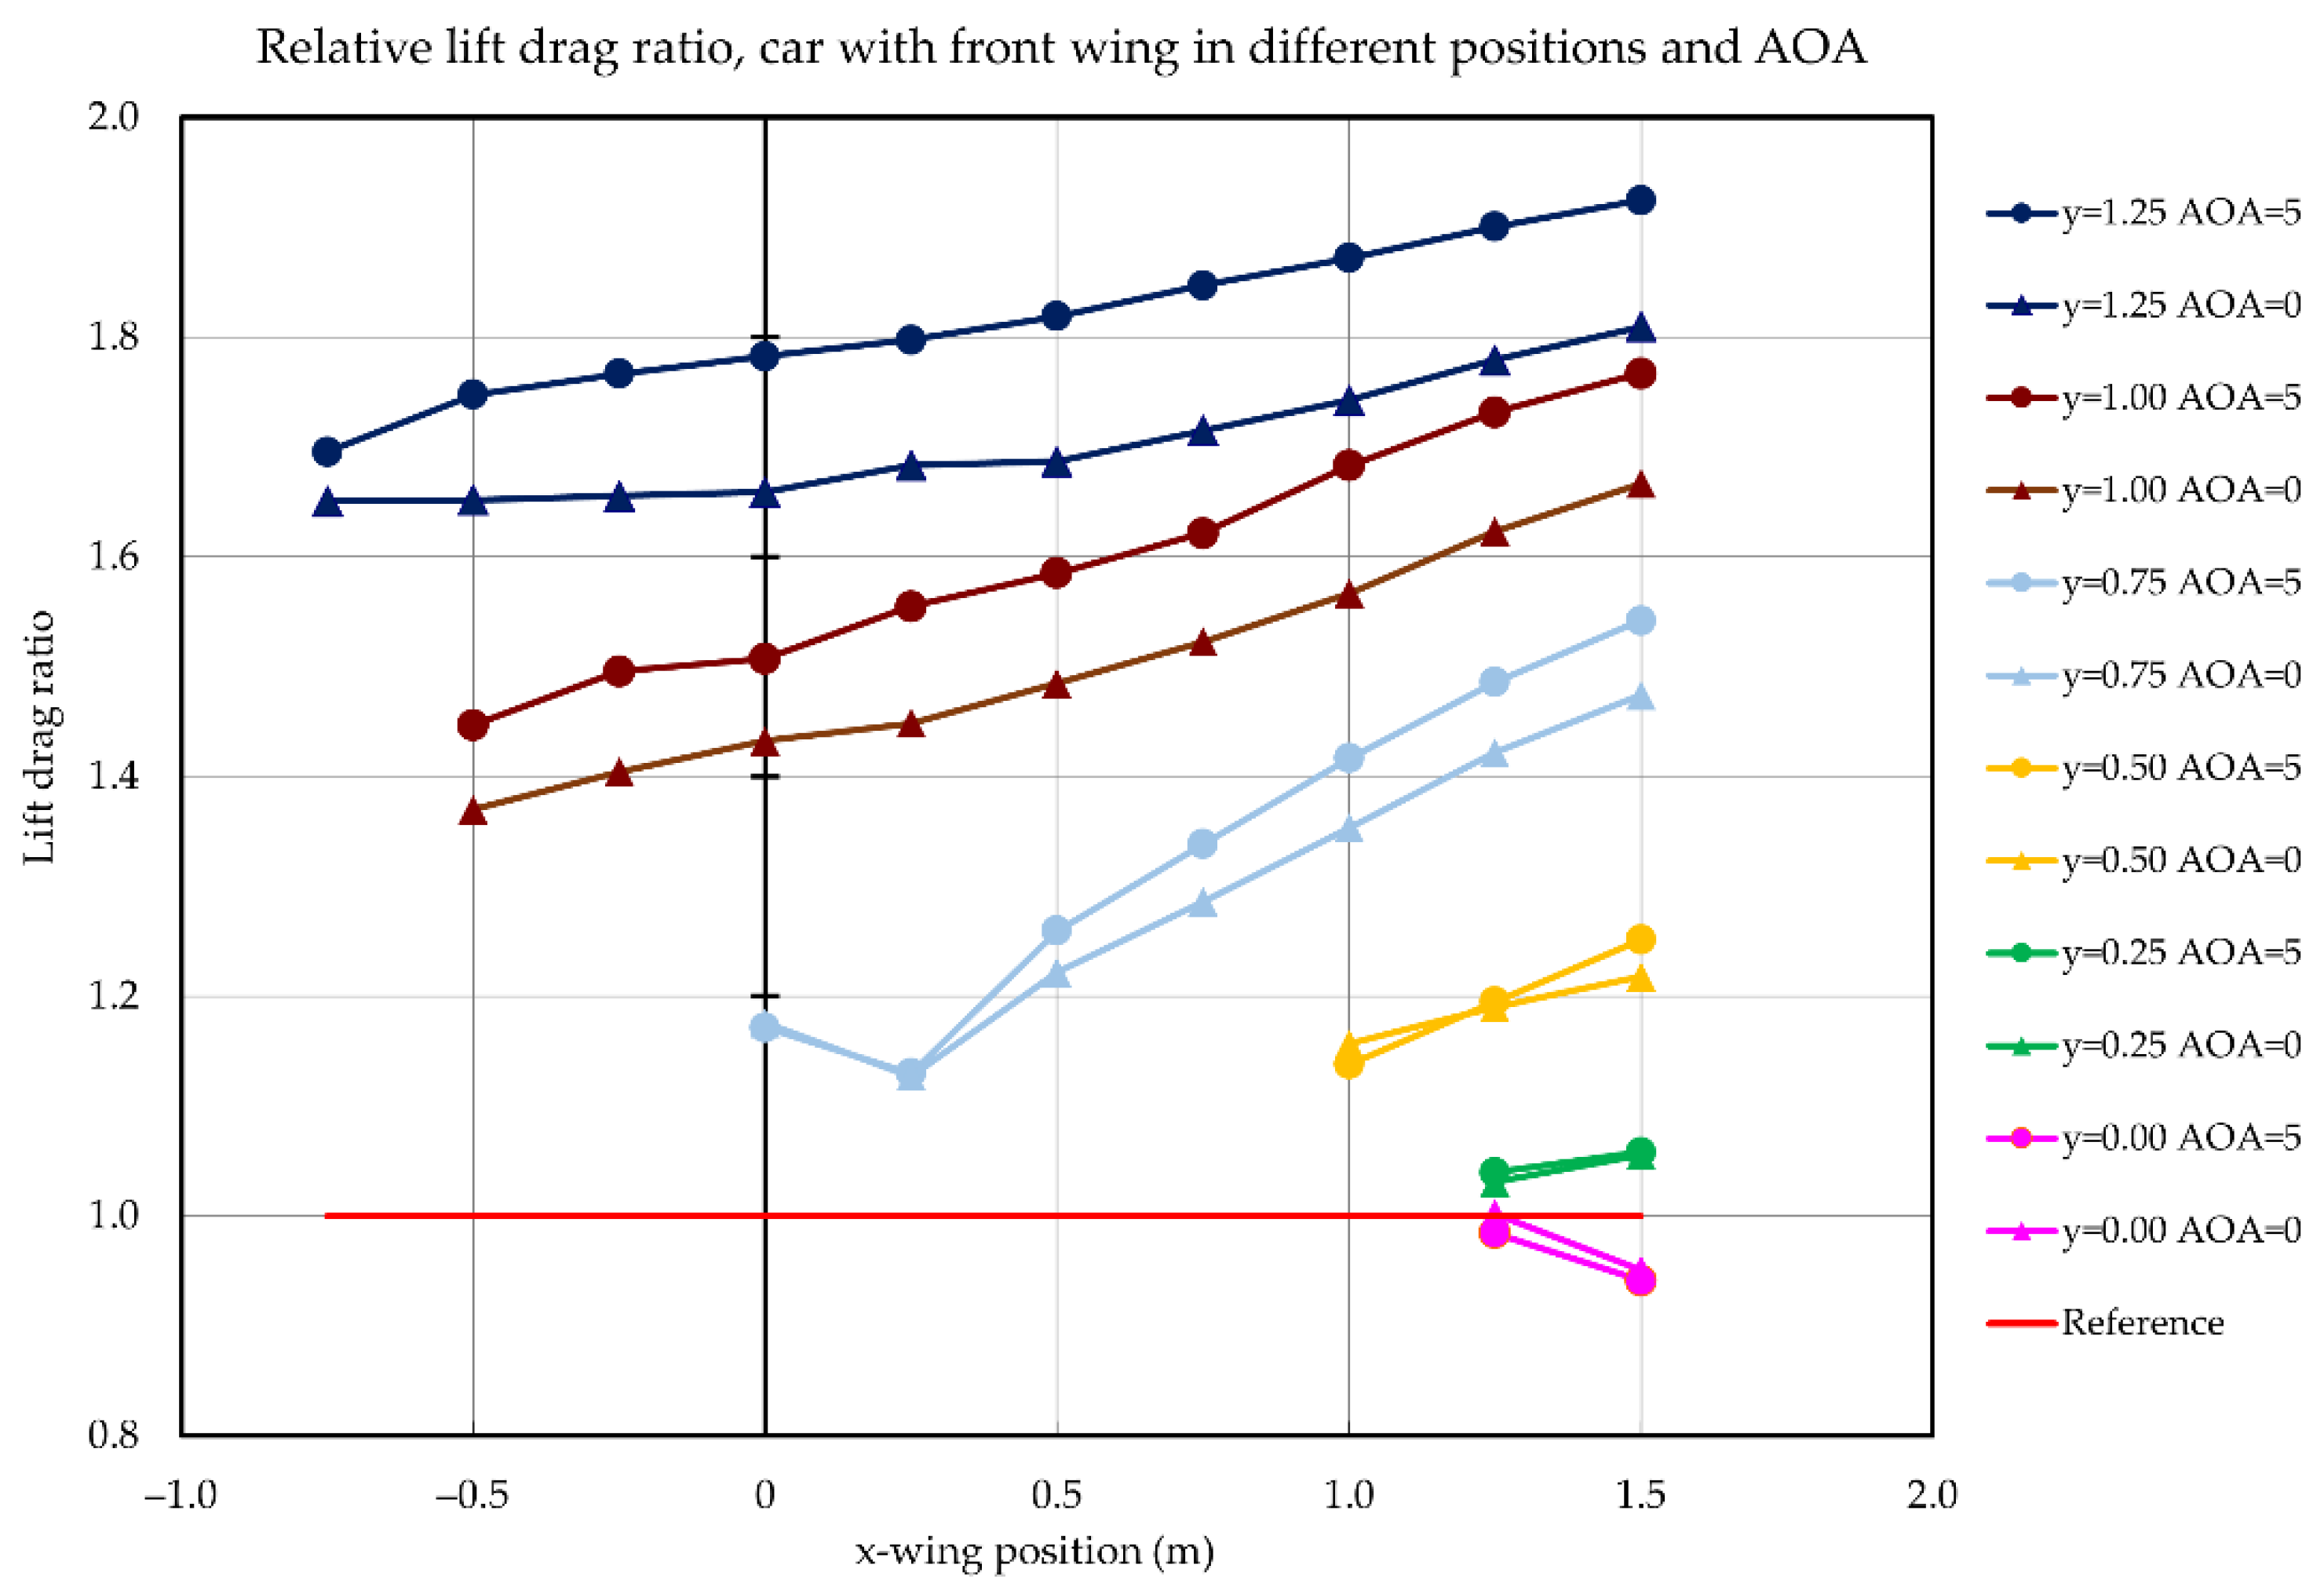
The use of the wing at the front of the vehicle led to a decrease in the aerodynamic downforce of the vehicle itself, which reduced the effectiveness of the wing action. The front wing in any configuration generated aerodynamic downforce, but at the same time modified the body flow structure in such a way that it lowered the downforce generated by the body. The forces on both elements occur partially compensated for each other.
Changing the direction of the airflow under the wing caused by the body flow structure changed the angle of the actual airflow on the wing, causing changes in the angle of attack and aerodynamic downforce in certain positions above the body. It follows that their effects cannot be summed up when tested separately. Thus, by using the front wing we can increase the driving, braking, and lateral forces on the front axle on the one hand, although the vehicle becomes unstable on the other. It becomes obvious that it is necessary to use an effective wing system in the rear part of the vehicle to restore the aerodynamic balance and obtain neutral characteristics of the vehicle.
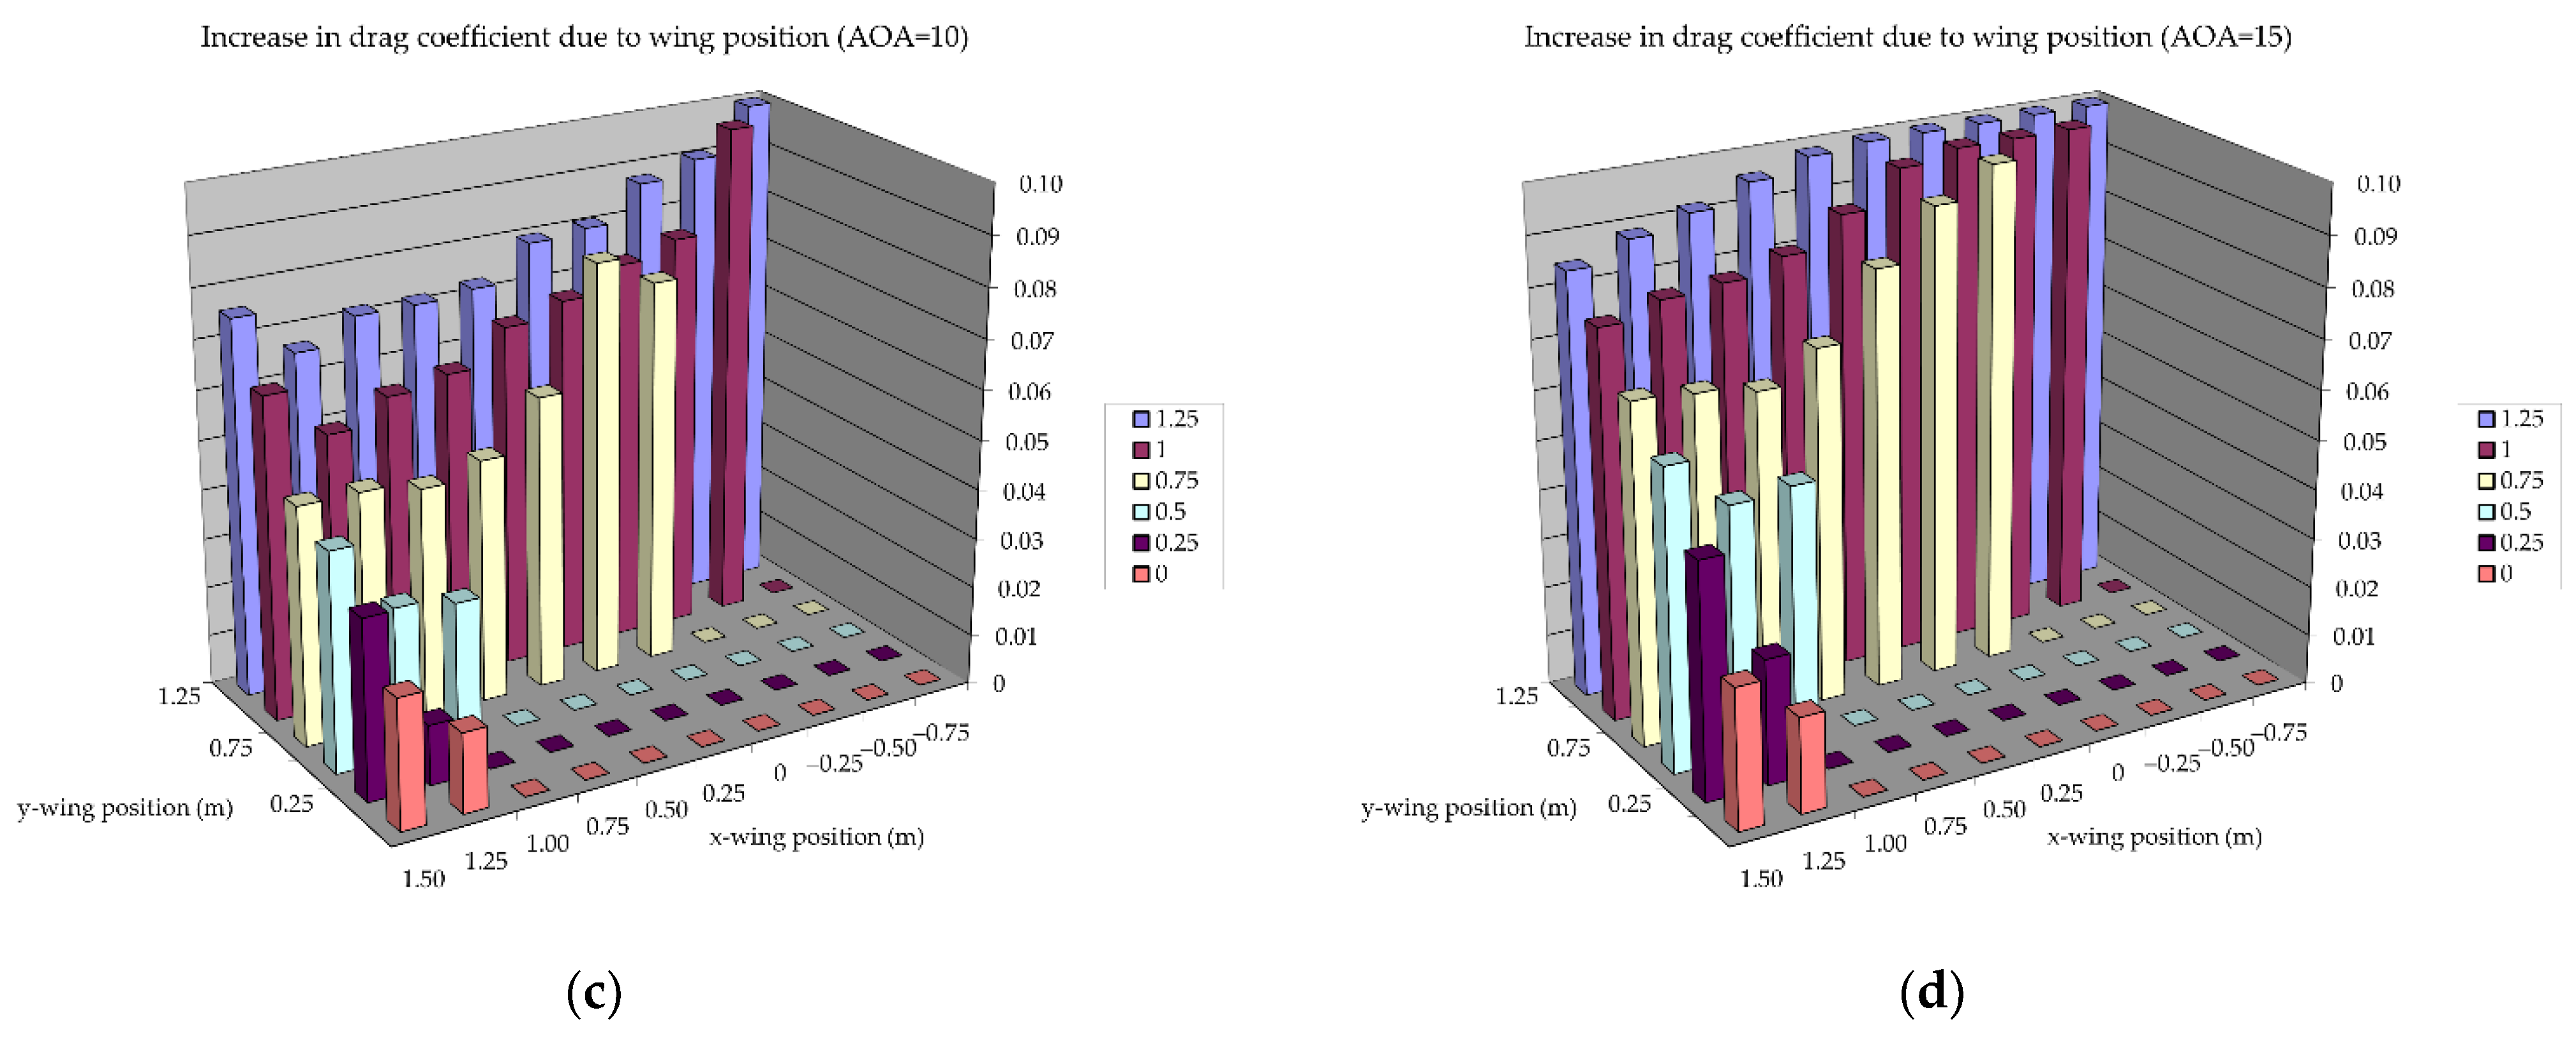
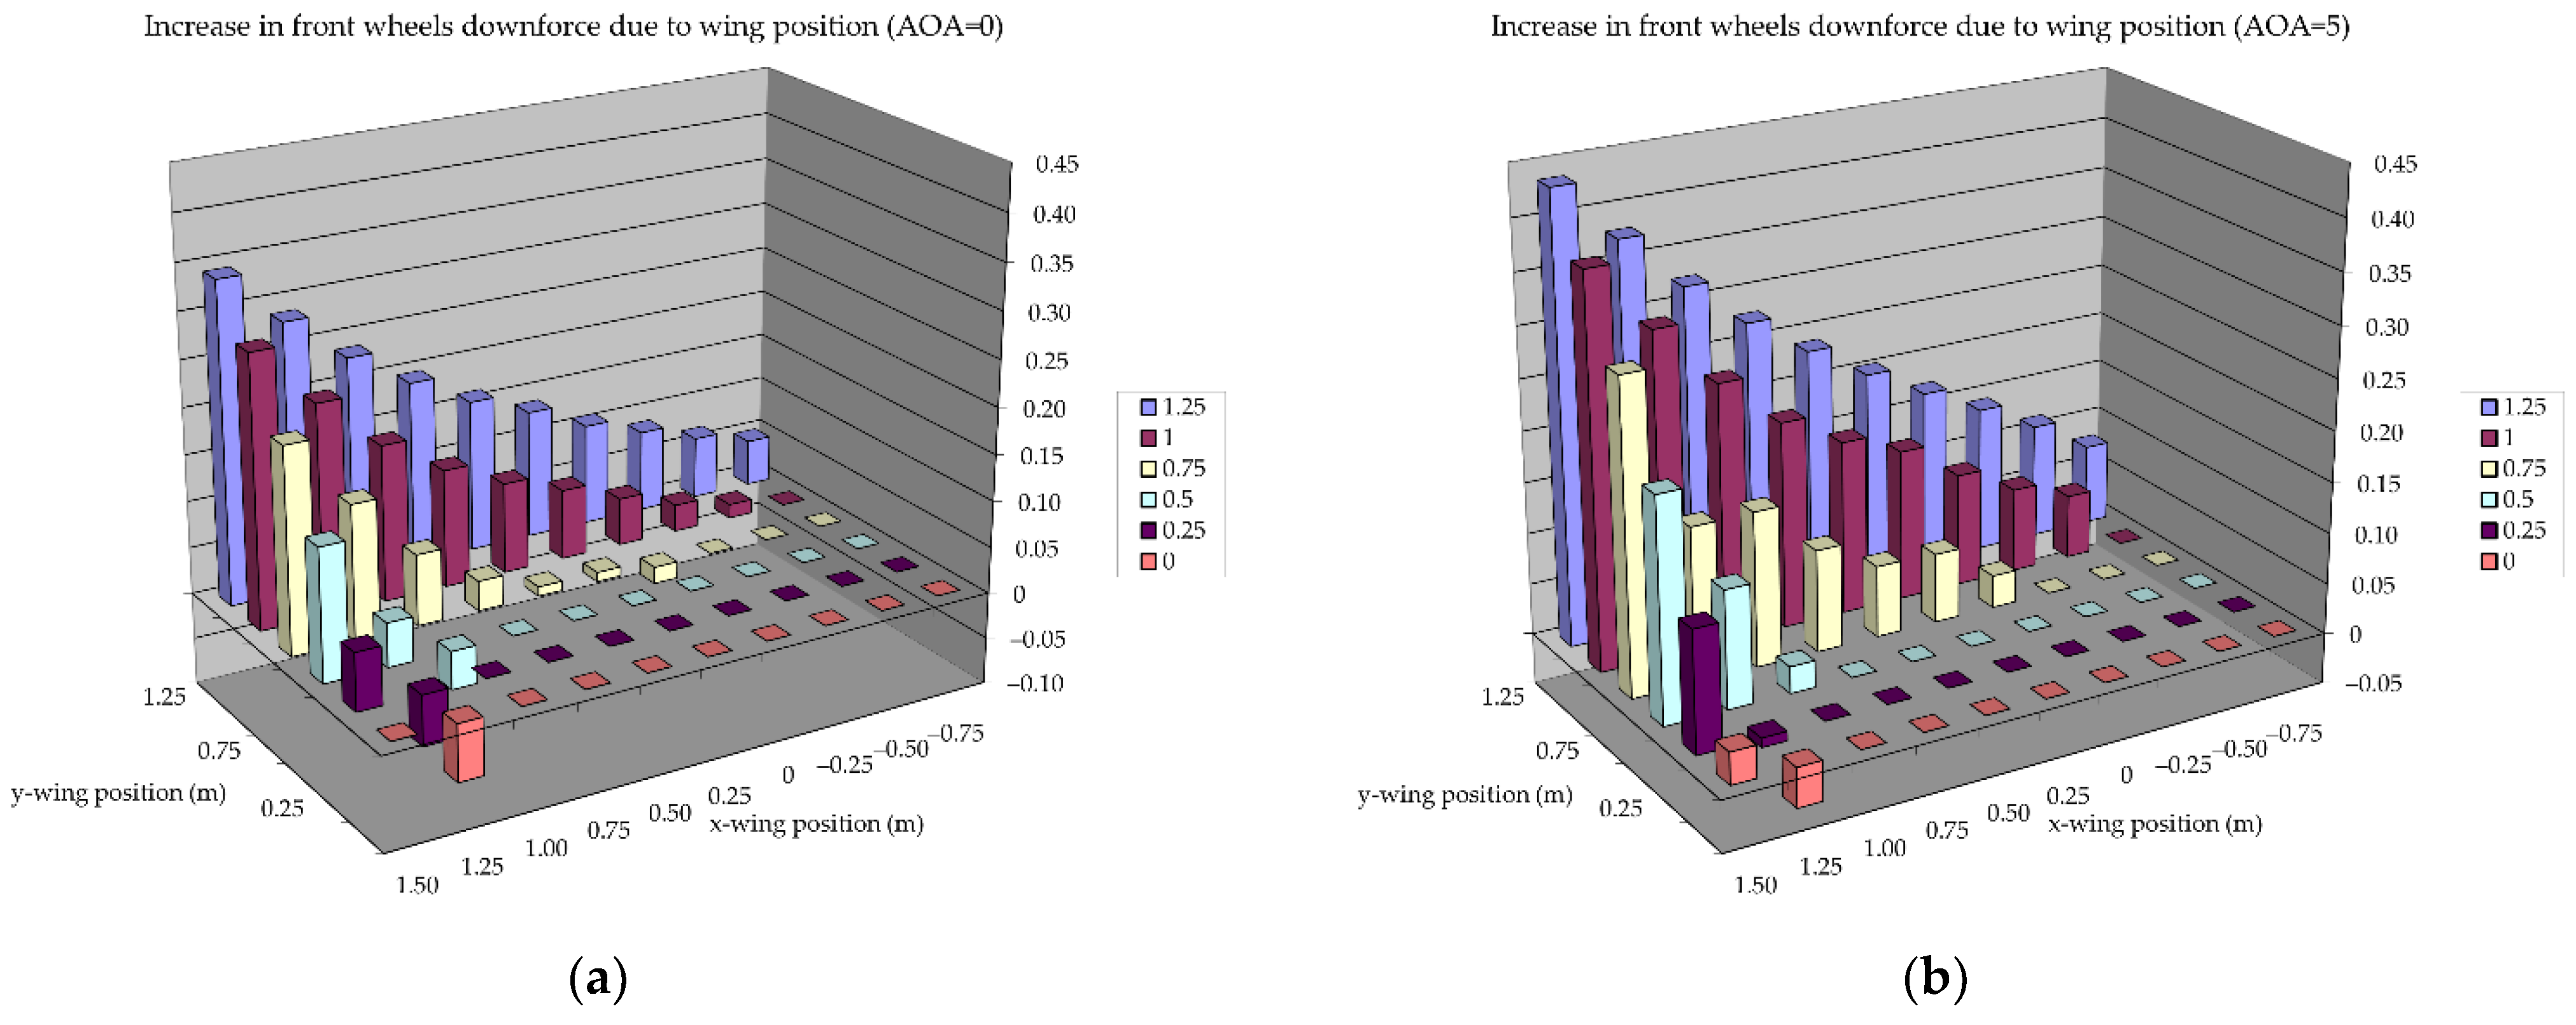
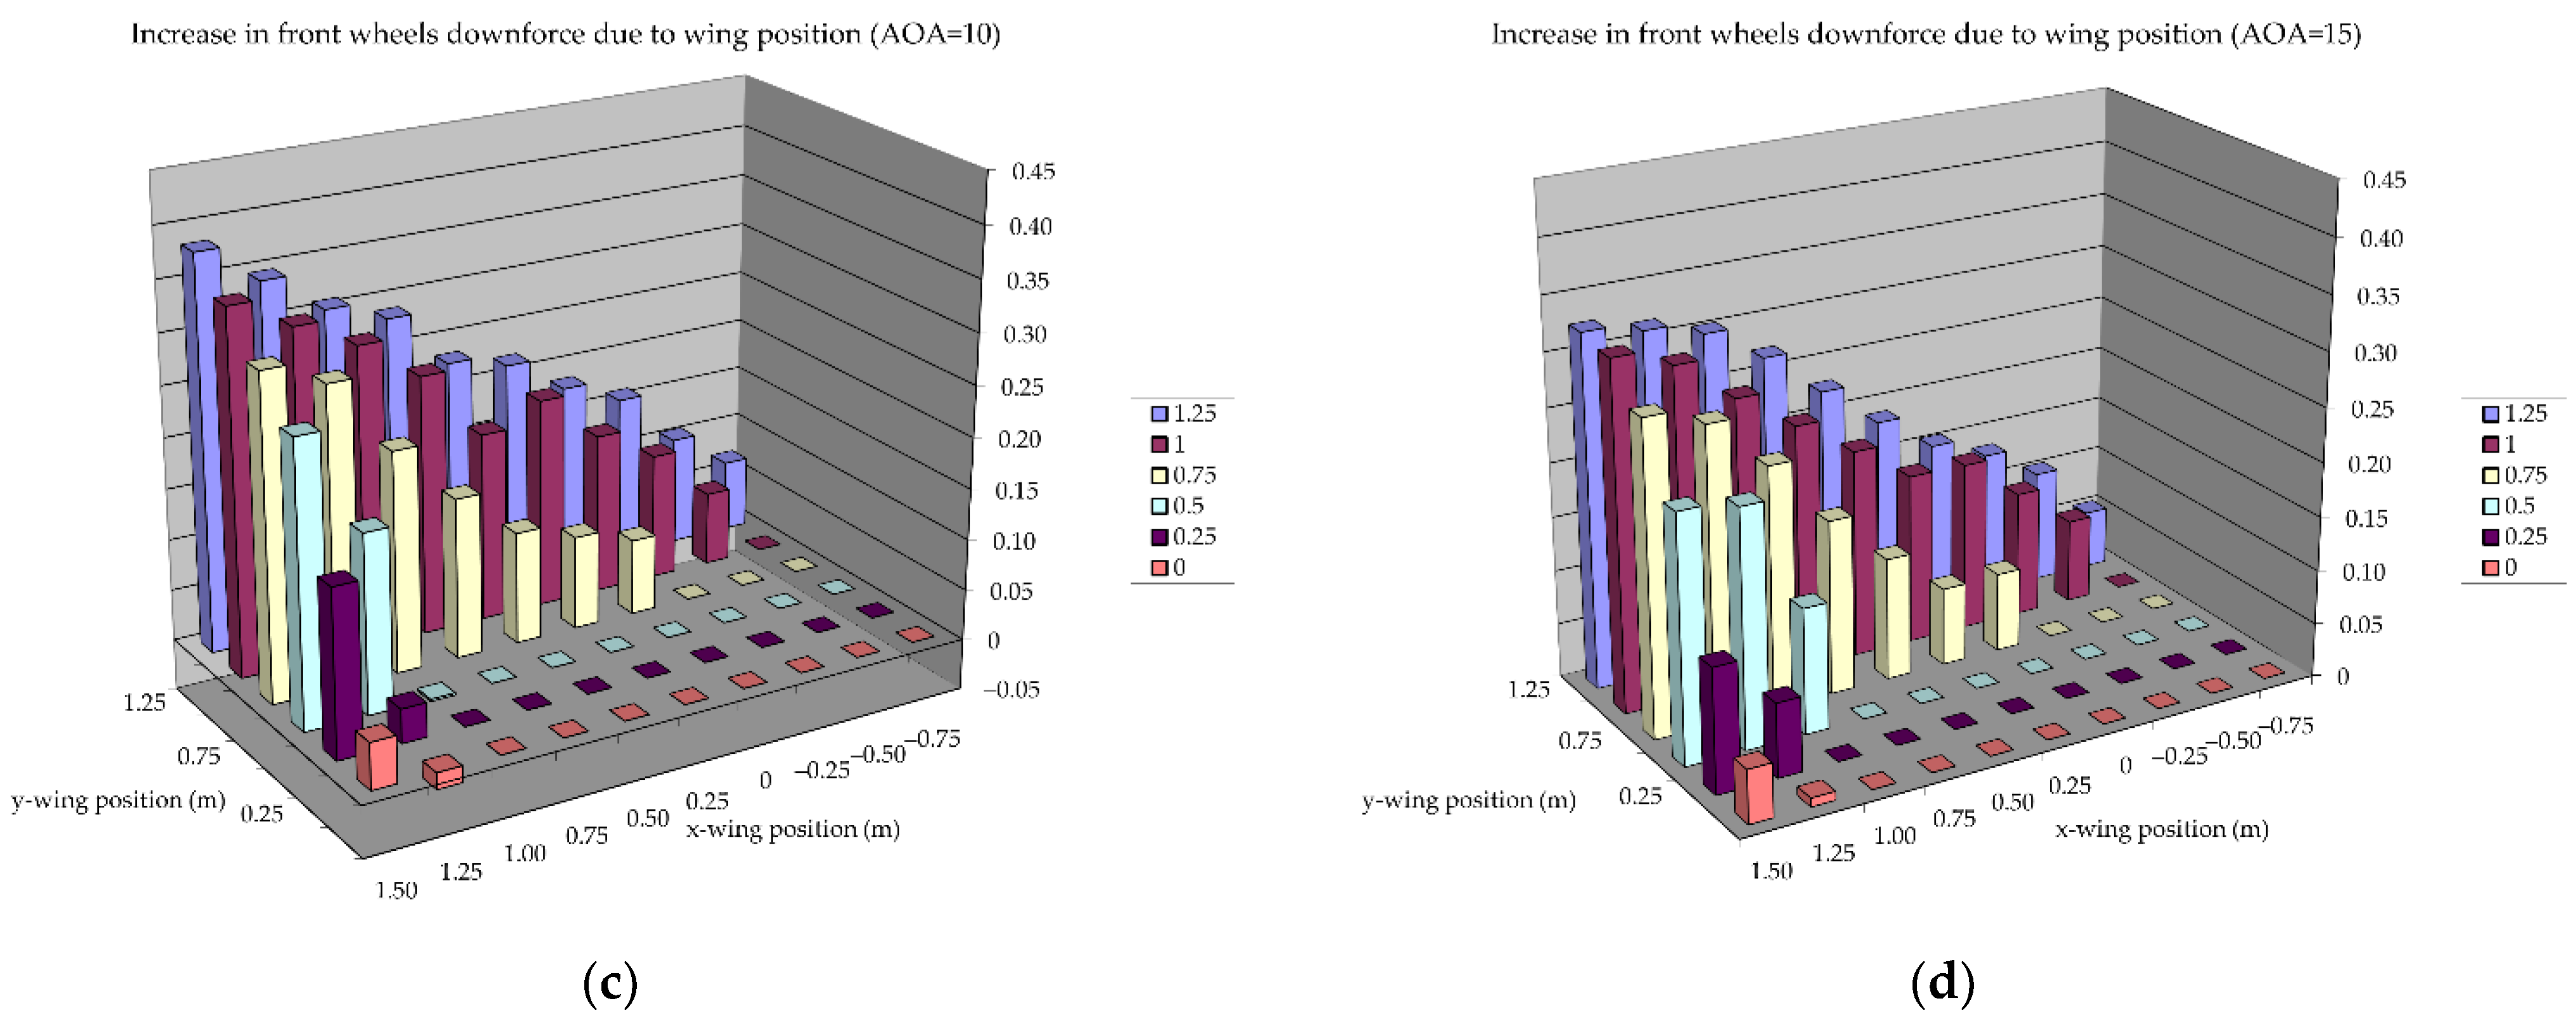
The use of front wings in specific configurations seems to be the orthodox solution, although various aspects of their use must be considered. Changes in aerodynamic drag resulting from the use of a front wing can be up to 20% of the drag of the vehicle itself. The incremental aerodynamic downforce of the front axle is much greater. In any case, the use of a front wing increases the aerodynamic downforce of the front axle of the vehicle but disturbs the balance and must be accompanied by the use of a corresponding rear wing.
Thus, using the information presented in this work, it is necessary to analyze the flow around the entire vehicle, with the front wing and rear wing aerodynamically balancing the vehicle. Because the downforce on the front axle increases rapidly when elevating the front wing position, it may be necessary to use a smaller front wing to achieve aerodynamic balance. This may be the subject of future work.

Author Contributions

Conceptualization, J.P.; methodology, J.P. and M.S.; software, J.P. and M.S.; validation, J.P. and M.S.; formal analysis, J.P. and M.S.; investigation, J.P. and M.S.; resources, M.S.; data curation, J.P. and M.S.; writing—original draft preparation, J.P. and M.S.; writing—review and editing, J.P. and M.S.; visualization, M.S.; supervision, J.P. All authors have read and agreed to the published version of the manuscript.

Funding

This research received no external funding.

Acknowledgments

The authors thank Arrinera for allowing the geometry of the Hussarya vehicle used to perform the aerodynamic analyses presented in this paper.

Conflicts of Interest

The authors declare no conflict of interest.

References

  1. The Basics of Time Attack Aerodynamics—Part 1. Available online: http://timeattackbuilders.com/2016/09/30/the-basics-of-time-attack-aerodynamics-part-1/ (accessed on 10 October 2021).
  2. Ten Reasons Time Attack Needs Your Attention. Available online: https://www.topgear.com/car-news/motorsport/ten-reasons-time-attack-needs-your-attention (accessed on 10 October 2021).
  3. Piechna, J.; Rudniak, L.; Piechna, A. CFD analysis of the central engine generic sports car aerodynamics. In Proceedings of the 4th European Automotive Simulation Conference, Munich, Germany, 6–7 July 2009. [Google Scholar]
  4. Knowles, K.; Donoghue, D.T.; Finnis, M.V. A study of wings in ground effect. In Proceedings of the Royal Aeronautical Society Conference on Vehicle Aerodynamics, Loughborough, UK, 18 July 1994; pp. 22.1–22.13. [Google Scholar]
  5. Mokhtar, W.A. Numerical Parametric Study of High-Lift Low Reynolds Number Airfoils. In Proceedings of the AIAA 43rd Aerospace Science Meeting and Exhibit, Reno, NV, USA, 10–13 January 2005. AIAA Paper No. 2005-1355. [Google Scholar] [CrossRef]
  6. Mokhtar, W.A. Numerical Study of High-Lift Single Element Airfoils with Ground Effect for Racing Cars; SAE Transactions; SAE International: Warrendale, PA, USA, 2005; Volume 114, pp. 682–688. [Google Scholar]
  7. Mokhtar, W.A. Aerodynamics of High-lift Wings with Ground Effect for Racecar; SAE Technical Paper No. 2008-01-0656; SAE International: Warrendale, PA, USA, 2008. [Google Scholar] [CrossRef]
  8. Mokhtar, W.A.; Lane, J. Racecar front wing aerodynamics. SAE Int. J. Passeng. Cars-Mech. Syst. 2008, 1, 1392–1403. [Google Scholar] [CrossRef]
  9. Zerihan, J.; Zhang, X. Aerodynamics of a single element wing in ground effect. J. Aircr. 2000, 37, 1058–1064. [Google Scholar] [CrossRef]
  10. Zhang, X.; Zerihan, J. Aerodynamics of a double-element wing in ground effect. AIAA J. 2003, 41, 1007–1016. [Google Scholar] [CrossRef] [Green Version]
  11. Zerihan, J.; Zhang, X. Aerodynamics of Gurney flaps on a wing in ground effect. AIAA J. 2001, 39, 772–780. [Google Scholar] [CrossRef]
  12. Zhang, X.; Zerihan, J. Edge vortices of a double element wing in ground effect. J. Aircr. 2004, 41, 1127–1137. [Google Scholar] [CrossRef]
  13. Ranzenbach, R.; Barlow, J.; Diaz, R. Multielement airfoil in ground effect—An Experimental and Computational Study. In Proceedings of the AIAA Applied Aerodynamics Conference, 15th, Atlanta, GA, USA, 23–25 June 1997. AIAA No. 1997-2238. [Google Scholar] [CrossRef]
  14. Angle, G.M.; O’Hara, B.M.; Pertl, F.A.; Smith, J.E. Pitch Stability Analysis of an Airfoil in Ground Effect. J. Aircr. 2009, 46, 756–762. [Google Scholar] [CrossRef]
  15. Ahmed, M.R.; Takasaki, T.; Kohama, Y. Aerodynamics of a NACA4412 airfoil in ground effect. AIAA J. 2007, 45, 37–47. [Google Scholar] [CrossRef]
  16. Lee, T.; Majeed, A.; Siddiqui, B.; Tremblay-Dionne, V. Impact of ground proximity on the aerodynamic properties of an unsteady airfoil. Proc. Inst. Mech. Eng. Part G J. Aerosp. Eng. 2018, 232, 1814–1830. [Google Scholar] [CrossRef]
  17. Lee, T.; Tremblay-Dionne, V. Experimental investigation of the aerodynamics and flowfield of a NACA 0015 airfoil over a wavy ground. J. Fluids Eng. 2018, 140, 071202. [Google Scholar] [CrossRef]
  18. McBeath, S. Competition Car Aerodynamics, 3rd ed.; Veloce Publishing: Dorchester, UK, 2017. [Google Scholar]
  19. Basso, M.; Cravero, C.; Marsano, D. Aerodynamic Effect of the Gurney Flap on the Front Wing of a F1 Car and Flow Interactions with Car Components. Energies 2021, 14, 2059. [Google Scholar] [CrossRef]
  20. Roberts, L.S.; Correia, J.; Finnis, M.V.; Knowles, K. Aerodynamic characteristics of a wing-and-flap configuration in ground effect and yaw. Proc. Inst. Mech. Eng. Part D J. Automob. Eng. 2016, 230, 841–854. [Google Scholar] [CrossRef]
  21. Katz, J. Aerodynamic model for wing-generated down force on open-wheel-racing-car configurations. SAE Trans. 1986, 1106–1115. [Google Scholar] [CrossRef]
  22. Katz, J. Aerodynamics of race cars. Annu. Rev. Fluid Mech. 2006, 38, 27–63. [Google Scholar] [CrossRef] [Green Version]
  23. Martins, D.; Correia, J.; Silva, A. The Influence of Front Wing Pressure Distribution on Wheel Wake Aerodynamics of a F1 Car. Energies 2021, 14, 4421. [Google Scholar] [CrossRef]
  24. Diasinos, S.; Barber, T.J.; Doig, G. Influence of wing span on the aerodynamics of wings in ground effect. Proc. Inst. Mech. Eng. Part G J Aerosp. Eng. 2013, 227, 564–568. [Google Scholar] [CrossRef]
  25. Diasinos, S.; Doig, G.; Barber, T.J. On the interaction of a racing car front wing and exposed wheel. Aeronaut. J. 2014, 118, 1385–1407. [Google Scholar] [CrossRef] [Green Version]
  26. Diasinos, S.; Barber, T.; Doig, G. Numerical analysis of the effect of the change in the ride height on the aerodynamic front wing–wheel interactions of a racing car. Proc. Inst. Mech. Eng. Part D J. Automob. Eng. 2017, 231, 900–914. [Google Scholar] [CrossRef]
  27. Ogawa, A.; Mashio, S.; Nakamura, D.; Masumitsu, Y.; Minagawa, M.; Nakai, Y. Aerodynamics Analysis of Formula One Vehicles. Honda R&D Tech. Rev. 2009, 21, 152–162. [Google Scholar]
  28. Correia, J.; Roberts, L.S.; Finnis, M.V.; Knowles, K. Scale effects on a single-element inverted wing in ground effect. Aeronaut J. 2014, 118, 797–809. [Google Scholar] [CrossRef]
  29. Katz, J.; Largman, R. Experimental Study of the Aerodynamic Interaction between an Enclosed-Wheel Racing-Car and its Rear Wing. ASME J. Fluids Eng. 1989, 111, 154–159. [Google Scholar] [CrossRef]
  30. Gogal, D.; Sakurai, H. The Effects of End Plates on Downforce in Yaw, Motorsports Engineering Conference and Exhibition, Dearborn, Michigan; SAE 2006-01-3647; SAE International: Warrendale, PA, USA, 2006. [Google Scholar] [CrossRef]
  31. Kurec, K.; Remer, M.; Piechna, J. The influence of different aerodynamic setups on enhancing a sports car’s braking. Int. J. Mech. Sci. 2019, 164, 105140. [Google Scholar] [CrossRef]
  32. Broniszewski, J.; Piechna, J. A fully coupled analysis of unsteady aerodynamics impact on vehicle dynamics during braking. Eng. Appl. Comput. Fluid Mech. 2019, 13, 623–641. [Google Scholar] [CrossRef]
  33. Steger, J.L.; Dougherty, F.C.; Benek, J.A. A chimera grid scheme. Multiple overset body-conforming mesh system for finite difference adaptation to complex aircraft configurations. Advances in grid generation. In Proceedings of the Applied Mechanics, Bioengineering, and Fluids Engineering Conference, Houston, TX, USA, 20–22 June 1983; American Society of 137 Mechanical Engineers: Houston, TX, USA, 1983; pp. 59–69. [Google Scholar]
  34. Roache, P.J. Perspective: A method for uniform reporting of grid refinement studies. J. Fluids. Eng. 1994, 116, 405–413. [Google Scholar] [CrossRef]
Figure 1. Electric Toyota TMG-EV-P002 with front wing.
Energies 14 07907 g001
Figure 2. Scion with high front wing.
Energies 14 07907 g002
Figure 3. Scion with low front wing.
Energies 14 07907 g003
Figure 4. Lotus Elise with mid-height front wing.
Energies 14 07907 g004
Figure 5. The geometry of the analyzed car and cross-section of the spoiler.
Energies 14 07907 g005
Figure 6. Geometries of the front wing: (a) clean front wing; (b) front wing with a Gurney flap turned off; (c) front wing with a Gurney flap turned on.
Energies 14 07907 g006
Figure 7. Size of the computational domain with length L = 4.6 m, height H = 1.1 m, and width W = 1.1 m.
Energies 14 07907 g007
Figure 8. Size of the front wing computational domain with chord C = 0.3 m and span S = 0.7 m.
Energies 14 07907 g008
Figure 9. Meshes with different body of influence sizes.
Energies 14 07907 g009
Figure 10. Grid convergence test results: (a) drag coefficient; (b) lift coefficient.
Energies 14 07907 g010
Figure 11. Mesh selected in the grid independence study: medium body of influence size and medium mesh density. Overset mesh interface is visible at the front wing.
Energies 14 07907 g011
Figure 12. Front wing positioned at X = 1 m and Y = 0.5 m from the front axle of the car.
Energies 14 07907 g012
Figure 13. Drag coefficient distribution for cases without a front wing and with a front wing.
Energies 14 07907 g013
Figure 14. Lift coefficient distribution for cases without the front wing and with a front wing.
Energies 14 07907 g014
Figure 15. Moment distribution for cases without a front wing and with a front wing.
Energies 14 07907 g015
Figure 16. Pressure coefficient contour map: (a) without (top) and with (bottom) the front wing; (b) difference between cases with and without the front wing.
Energies 14 07907 g016
Figure 17. Visualization of the analyzed positions of the front wing.
Energies 14 07907 g017
Figure 18. Lift coefficient for various positions and angles of attack of the front wing.
Energies 14 07907 g018
Figure 19. Increases in aerodynamic downforce coefficient as a function of the angle of attack and wing position in relation to the car body: (a) AOA 0 degrees; (b) AOA 5 degrees; (c) AOA 10 degrees; (d) AOA 15 degrees.
Energies 14 07907 g019
Figure 20. Increases in aerodynamic drag coefficient as a function of the angle of attack and wing position in relation to the car body: (a) AOA 0 degrees; (b) AOA 5 degrees; (c) AOA 10 degrees; (d) AOA 15 degrees.
Energies 14 07907 g020aEnergies 14 07907 g020b
Figure 21. Increases in front wheel aerodynamic downforce coefficient as a function of the angle of attack and wing position in relation to the car body: (a) AOA 0 degrees; (b) AOA 5 degrees; (c) AOA 10 degrees; (d) AOA 15 degrees.
Energies 14 07907 g021aEnergies 14 07907 g021b
Figure 22. Changes in lift force acting on the vehicle as a function of the wing position relative to the body and depending on the angle of attack (AOA).
Energies 14 07907 g022
Figure 23. Changes in the lift force acting on the vehicle as a function of the wing position relative to the body and depending on the angle of attack (AOA).
Energies 14 07907 g023
Figure 24. Variations in the ratio of the lift force to the aerodynamic drag force compared to the ratio for a car without a wing, as a function of the position of the wing relative to the body and as a function of the angle of attack (AOA).
Energies 14 07907 g024
Figure 25. Variations in lift force acting on the front axle of the vehicle as a function of wing position relative to the body and as a function of the angle of attack (AOA).
Energies 14 07907 g025
Figure 26. Variations in lift force acting on the rear axle of the vehicle as a function of wing position relative to the body and as a function of the angle of attack (AOA).
Energies 14 07907 g026
Figure 27. Position of the resultant aerodynamic lift force relative to the front (value 0) and rear (value 1) axle positions. Negative values indicate that the position is in front of the front axle.
Energies 14 07907 g027
Figure 28. Changes in the coefficient of the aerodynamic lift force generated only by the front wing at different positions relative to the body.
Energies 14 07907 g028
Figure 29. Positions of wings, as visualized in the next figures.
Energies 14 07907 g029
Figure 30. Velocity contours and streamlines around a vehicle without a front wing and for a vehicle with three different wing positions (side view).
Energies 14 07907 g030
Figure 31. Velocity streamlines around a vehicle without a front wing and for a vehicle with three different wing positions: (a) front view; (b) rear view. Visualizations are mirrored along the symmetry plane.
Energies 14 07907 g031aEnergies 14 07907 g031b
Figure 32. Pressure distributions on the symmetry plane for a vehicle without a front wing and a vehicle with three different wing positions (side view).
Energies 14 07907 g032
Figure 33. Pressure distributions for a vehicle without a front wing and n a vehicle with three different wing positions: (a) front view; (b) rear view. Visualizations are mirrored along the symmetry plane.
Energies 14 07907 g033aEnergies 14 07907 g033b
Figure 34. Distributions of the normalized Q = 0.05 parameter around the vehicle without a front wing and for the vehicle with three different wing positions, influenced by the velocity magnitude (side view).
Energies 14 07907 g034
Figure 35. Distributions of the normalized Q = 0.05 parameter around the vehicle without a front wing and for the vehicle with three different wing positions, influenced by velocity magnitude: (a) front view; (b) rear view. Visualizations are mirrored along the symmetry plane.
Energies 14 07907 g035
Figure 36. Transient analysis of a case with the front wing placed high above the car body (X = −0.5 m, Y = 1 m): (a) outline of the geometry, side view; (b) FFT analysis; (c) total lift coefficient as a function of time; (d) total drag coefficient as a function of time.
Energies 14 07907 g036
Figure 37. Velocity magnitude contours on a symmetry plane, showing a sequence of images over an oscillation cycle T: (a) T/4; (b) T/2; (c) 3/4 T; (d) T.
Energies 14 07907 g037
Figure 38. An attempt at balancing the car with a larger spoiler: (a) outline of the geometry, side view; (b) contours of the pressure coefficient on the symmetry plane and car body, side view.
Energies 14 07907 g038
Figure 39. Forces acting on the car body in the case of a larger spoiler: (a) drag coefficient as a function of the iteration number; (b) lift coefficient as a function of the iteration number.
Energies 14 07907 g039
Table 1. Dimensions of the body of influence zone outside the outline of car.
BOI SizeSideTopFrontBack
11W1H0.2L0.4L
21.25W1.5H0.3L0.7L
31.5W2H0.4L1.1L
Table 2. Grid convergence test results for medium-sized body of influence (BOI 2).
BOI SizeCoarse MeshMedium MeshFine MeshFine-Grid Grid
Convergence Index
Characteristic cell size h in m0.040.0310.024-
Drag coefficient Cd0.4770.4650.4670.1%
Lift coefficient Cl−0.36−0.339−0.3482.4%
Table 3. Influence of the front wing on forces and moments.
Front Wing TypeCdClClrClfCm
No front wing0.475−0.302−0.154−0.146−0.01
Clean0.475−0.315−0.147−0.1630.02
Gurney off0.473−0.344−0.113−0.2270.11
Gurney on0.476−0.352−0.089−0.2610.17
Table 4. Comparison of forces and moments obtained in steady-state and transient analyses.
Analysis TypeCdClClrClfCm
Steady-state0.592−0.538−0.158−0.3800.111
Transient0.584−0.553−0.162−0.3910.115
Relative difference in %−1.42.72.52.83.5
Table 5. Comparison of forces and moments obtained for different spoiler sizes, with the front wing located at X = 0 m and Y = 1 m from the front axle, with 0 degrees angle of attack.
SpoilerCdClClrClfCm
Small0.504−0.458−0.106−0.3530.124
Large0.725−0.928−0.453−0.4750.011
Publisher’s Note: MDPI stays neutral with regard to jurisdictional claims in published maps and institutional affiliations.

