Abstract
We examine the energy use impacts of energy efficiency and solar PV projects financed by residential property assessed clean energy (R-PACE) programs in California. We leverage household-level interval meter data to apply normalized metered energy consumption (NMEC) methods at significant scale—more than 25,000 electric meters and more than 15,000 gas meters. We develop a comparison group to account for non-project-related changes in usage. The projects include homes that replaced existing HVAC equipment with higher-efficiency units and homes that installed central heating or air conditioning equipment for the first time. We have limited information on pre-project household equipment stock so we develop a method to infer new installations. We find that projects that installed energy efficiency technologies reduce electricity consumption by approximately 3% and gas consumption by approximately 3.5% on average. When we remove homes that installed new cooling and heating equipment for the first time, savings rise to approximately 5% for electricity and approximately 6% for gas. Given the California climate and the results of an existing study of similar California projects, these results are in line with expectations. Solar PV projects produce electricity that offsets approximately 69% of household electricity consumption on average. We estimate that California R-PACE projects installed through the end of 2019 produce annual reductions in grid-tied electricity consumption of 506 GWh (equivalent to the electricity consumption of approximately 74,000 California households) and gas consumption reductions of 2 million therms (equivalent to the gas consumption of approximately 4700 California households) in a typical weather year.
1. Introduction
Achieving significant improvements in the energy efficiency of existing U.S. residential buildings is a major challenge as service providers (e.g., contractors, architects, and engineers) must often overcome a variety of barriers. Some energy efficiency investments have “higher first costs” compared to conventional measures [1,2]. Examples in the residential market include high-efficiency windows, wall or floor insulation, or a more efficient heating, ventilation, or air conditioning (HVAC) system. These investments deliver energy cost savings and other benefits (e.g., improved comfort and reduced maintenance expenses), although these benefits are realized over long time periods (10–25 years) given the effective useful life of high-efficiency equipment and envelope measures. Solar PV systems are also expensive up front and yield energy cost savings over similarly long time frames. Financing offers an opportunity to better align the timeline of customer costs with energy cost savings for energy efficiency and solar PV projects, enhancing the affordability and attractiveness of these projects.
Many state policy makers and utility regulators have established aggressive energy efficiency savings goals that will necessitate investing billions of dollars in existing buildings over the next decade or two [3]. There is increasing interest among policy makers in promoting financing programs as a way to supplement or develop alternatives to incentives (rebates) that have traditionally been offered in utility energy efficiency programs [4]. These funds are limited, necessitating significant levels of private investment as savings goals increase over time. Policy makers are also interested in approaches that leverage public–private partnerships to support energy efficiency.
Property assessed clean energy (PACE) programs are operating in 22 states for commercial customers and in three states (California, Florida and Missouri) for residential customers [5]. Residential PACE (R-PACE) programs allow owners of single-family and small multifamily (4 units or fewer) residential buildings to finance certain energy- and water-related home improvement measures and repay project costs through a special assessment charge on the property tax bill. (In California, the vast majority of R-PACE customers are single-family building owners). While commercial PACE programs operate in many more states, R-PACE programs have deployed more capital in total, as Florida and especially California R-PACE programs have achieved significant scale relative to other residential energy efficiency financing programs. Per Deason et al. (2016), in 2014, R-PACE programs accounted for nearly half the capital that flowed through energy efficiency financing programs nationwide, despite operating in only two states at the time [6]. R-PACE volumes grew significantly after that time through 2017, though they have declined somewhat in recent years.
Most R-PACE programs are administered as public–private partnerships, with the involvement of state and local governments (who have the authority to place and collect the assessments) and private companies (who source capital for the programs and help administer them). Cumulative investments in residential PACE projects nationwide through 2019 exceeded $6 billion [5].
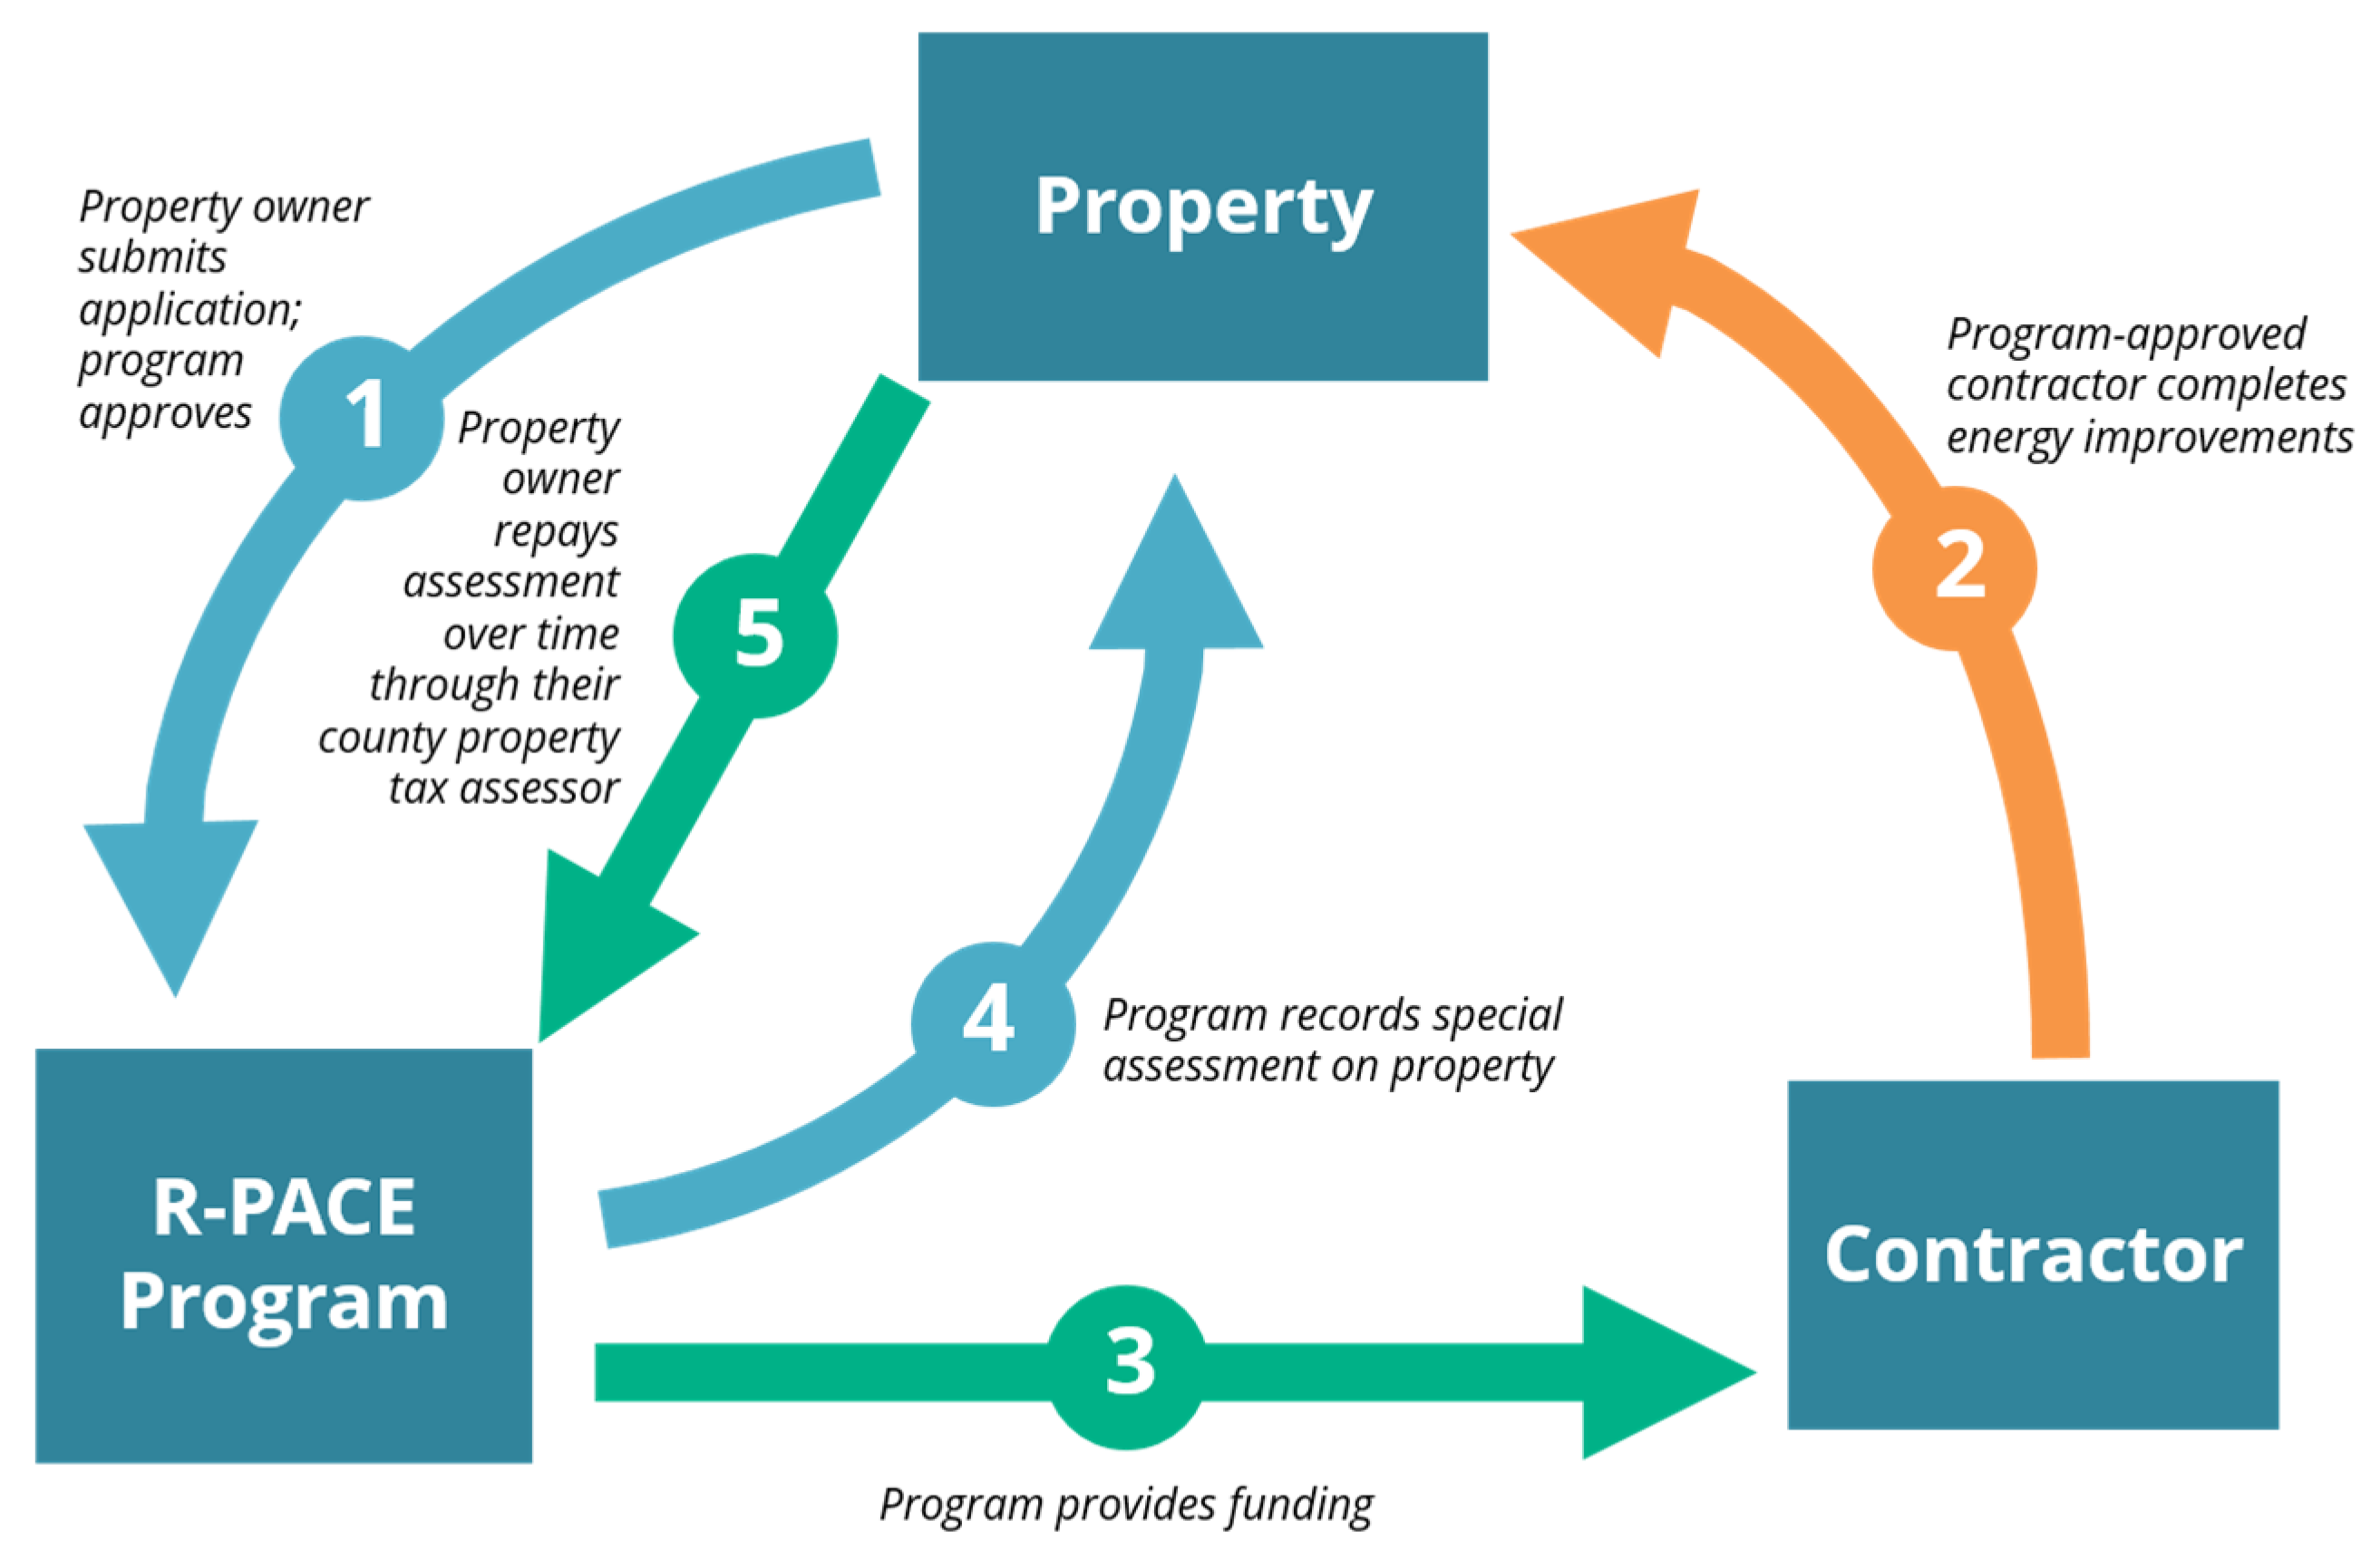
Figure 1 presents a high-level overview of the R-PACE process and actors. Typically, public partners with the authority to place special assessments issue short-term bonds to fund projects. Private partners then purchases these bonds, and often later sell securities backed by R-PACE payments to the capital markets to replenish their capital.
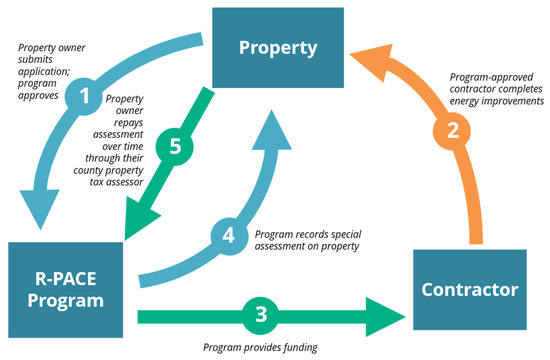
Figure 1.
Overview of the R-PACE project process.
Several studies estimate the impact of R-PACE program availability in encouraging the deployment of residential solar PV and generally find that the presence of R-PACE programs is associated with increased PV deployment [7,8,9] and increased PV self-generation [10] in jurisdictions that adopt the program while controlling for other relevant factors. Goodman and Zhu (2016) finds that R-PACE participation has a net positive impact on home sale value: the sale value of an R-PACE home, on average, increases by more than the amount of the outstanding assessment [11]. Rose and Wei (2019) and Oliphant et al. (2020) evaluate economy-wide impacts of residential and commercial PACE programs in California and Florida co-administered by Ygrene (a private program administrator and capital provider), finding positive macroeconomic impacts in the hundreds of million dollars in each state over the lifetime of the currently funded projects [12,13].
Our study is the first to conduct an ex post analysis of the energy impacts of R-PACE projects. In contrast to utility-administered energy efficiency programs, financing programs such as R-PACE do not have measurement and verification requirements. This paper also contributes to the limited literature on the impact of financing programs. Financing programs funded by utility customers have generally been treated as non-resource programs, meaning that savings attributable to these programs are rarely calculated [4]. Horkitz et al. (2016) and Stewart et al. (2016) evaluate the HERO R-PACE program, but these studies are akin to process evaluations of utility programs—they explain how well the programs are functioning from a process standpoint, but do not attempt to quantify energy impacts [14,15].
In this paper, we estimate typical California R-PACE household electricity and gas savings as well as aggregate savings for all R-PACE projects in the state through 2018. Our study leverages normalized metered energy consumption (NMEC) methods (see Section 2) to generate building-level energy impacts at a significant scale—more than 25,000 electric meters and more than 15,000 gas meters. We show how the energy impacts vary by investor-owned utility, measure category, and climate zone. Finally, we compare R-PACE energy impacts to those of similar multi-measure energy efficiency programs.
2. Materials and Methods
In this section, we describe the data on energy usage, measures installed, and project costs that we compiled on participating R-PACE households in California.
2.1. R-PACE Projects and Measures
The California Alternative Energy and Advanced Transportation Financing Authority (CAEATFA) administers a loss reserve supporting most R-PACE assessments in the state. CAEATFA collects data on these individual assessments, including financing dates and assessment amounts. We gathered all available data from R-PACE projects submitted to CAEATFA through June 2017. These projects cover all of the major R-PACE programs (Table 1) and include over 80% of all California R-PACE projects through that same date.

Table 1.
California R-PACE program coverage.
We obtained data on measures financed from each of these programs. Our data on project measures varied by provider; some providers provided a detailed list of installed measures (e.g., floor insulation and duct sealing) while other providers reported installed measures at a much higher level (e.g., “HVAC”). Most of the studied R-PACE programs set minimum efficiency standards for allowable measures that exceeded the minimums required by codes and standards, but in almost all cases, we do not have data on the specific efficiency level of installed measures (e.g., an energy efficiency rating for an air conditioner or an R-value for insulation). In order to harmonize across projects and providers, we developed a standard set of measure categories to which we mapped each project (see Table 2).
Table 2.
Sample size by measure category.
In the case of solar PV projects, we cross-checked the providers’ classification with Berkeley Lab’s Tracking the Sun dataset, which includes all residential grid-connected solar PV systems in the service territories of the utilities in this study [16]. In general, the data on PV installations from PACE providers matched well with the Tracking the Sun data.
Collectively, these measure categories account for all R-PACE projects in our data. Some projects included multiple measure categories (e.g., HVAC, new windows, doors and skylights) with varying combinations of measures. We also observe the distribution of projects by high-level measure category (e.g., energy efficiency, solar PV, energy efficiency measures and solar PV). Approximately 25% of households installed only solar PV, while approximately 65% installed only energy efficiency measures, and less than 5% installed both energy efficiency measures and solar PV.
We summarize the number of projects assigned to each category for our electricity and gas analysis in Table 2. The distribution of projects by measure category is similar between the full set of projects provided to us by PACE providers and the sub-samples of households for which we were able to match utility accounts and estimate reductions in grid electricity and gas use. When estimating total impacts across all R-PACE projects in the Results section, we weight the observed reductions in grid electricity and gas use in our samples to account for differences between the full dataset and the sub-samples of households included in the grid electricity and gas use analysis.
2.2. Utility Electricity and Gas Usage Data for R-PACE Households
We received data on electricity and gas usage for R-PACE households from the four large California investor-owned utilities (IOU): Pacific Gas & Electric Company (PG&E), San Diego Gas & Electric (SDG&E), Southern California Edison (SCE), and Southern California Gas Company (SCG). PG&E and SDG&E are dual-fuel utilities from which we received both electric and gas data; SCE is electric only; and SCG is gas only.
In each case, we gathered all data that the utility in question was able to provide on the list of R-PACE households that were submitted. We were not able to obtain usage data for one or more fuels for some R-PACE households. See Appendix A for more detail on data availability and data cleaning procedures.
2.3. Temperature Data
To adjust for the potential impact of weather, we associated each of our households with a weather station that had sufficient temperature data for both actual and typical weather years. For each R-PACE household, we identified the closest station within 200 km that was in the same climate zone as the household and met our data sufficiency screen. Our screen excluded any station for which 10% or more of the hourly readings in a month were missing for either the historical or typical weather year datasets. If the chosen station’s temperature data fails those sufficiency screens, we move on to the next closest station. If there was no station within 200 km of the R-PACE household that has sufficient data, we discarded the household.
Hourly temperature data for each weather station are from the National Oceanic and Atmospheric Administration (NOAA) [17]. As noted above, we use TMY3 for typical weather year data [18].
2.4. Modeling of Energy Usage Impacts
We estimate the energy impacts of R-PACE projects using normalized metered energy consumption (NMEC) methods. NMEC methods leverage household-level energy usage data, comparing energy usage before and after projects were implemented. They adjust usage to remove the effects of actual weather on energy consumption, and then project post-project usage into a “typical” weather year. Both models used for our calculations—the Princeton Scorekeeping Method (PRISM) and the Time-of-Week and Temperature (TOWT) model—are NMEC models [19,20]. Both models follow the same general procedure for calculating energy savings; they differ in the approach used for weather adjustment, as described in more detail below.
The CalTRACK working group (see https://www.caltrack.org/ (accessed on 1 September 2021)) has been developing standardized methods and software for using NMEC methods in California, driven largely by the usage of these models to estimate savings for pay-for-performance energy efficiency programs. CalTRACK software (see https://github.com/openeemeter/eemeter for Python code implementing the models (accessed on 1 September 2021)) implements both PRISM (using monthly or daily usage data) and TOWT (using hourly data) models in a manner consistent with CalTRACK recommendations. Our approach facilitates comparison with NMEC-based project impacts calculated for other California efficiency programs (see Discussion section for details).
To estimate gas usage impacts, we employ the PRISM model [19]. The model leverages temperature and gas usage data in the year prior to the beginning of the project (the “baseline period”) and the year following completion of the project (the “reporting period”).
Estimation of the PRISM model proceeds at the household level in four steps:
- First, we fit a regression of gas usage on historical heating degree days in the baseline period to estimate the pre-project temperature dependency of the household’s gas usage.
- Second, we fit a regression of observed gas usage on historical heating degree days in the reporting period to estimate the post-project temperature dependency of the household’s gas usage.
- Third, we use the reporting period normal-year heating degree days as inputs into the models produced in the first two steps. The model then estimates post-project usage in a normal weather year and estimates what usage would have been had the project not occurred, using heating degree days in a normal year.
- Fourth, we subtract weather-normalized gas usage during the reporting period from the baseline period to estimate changes in gas usage because of the R-PACE project.
We use a floating balance point method at the household level for choosing the base temperature for defining heating degree days, in keeping with PRISM model best practices [19]. Consistent with CalTRACK methodology, we also fit intercept-only weather models for each period and use whichever model has the higher adjusted r2 for each household. (Since the adjusted r2 of an intercept-only model is zero, this model is only chosen if the adjusted r2 of the HDD model is negative. This might be the case for non-gas-heated households.)
Our method for estimating electricity usage changes employs a different statistical model, but follows a similar process of generating and differencing weather-adjusted baseline and reporting period usage. To estimate electricity impacts, we employ the time-of-week-and-temperature (TOWT) model [20]. TOWT leverages hourly (or more disaggregated) usage data to enrich the PRISM approach to weather-normalization in two principal ways. First, TOWT uses baseline usage patterns to infer whether each hour of the week is generally “occupied” or “unoccupied” and employs this occupancy variable as an additional explanatory variable in its weather regressions. Second, TOWT removes weather effects via a piecewise linear regression model, allowing the relationship between weather and temperature to be somewhat non-linear. Following the CalTRACK implementation of TOWT, we estimate weather dependency separately for each calendar month, rather than for the entire period. (Specifically, we model weather dependence using data from the month in question as well as the month immediately preceding and following that month, again per CalTRACK methods. Data from both shoulder months receive a weight of 0.5 in the regressions, while data from the month in question receive a full weight of 1). The electricity weather fits consider four models: intercept only, HDD only, CDD only and both HDD and CDD. Again, we choose the model with the highest adjusted r2 in each month for each household.
We use the TOWT model to analyze electricity usage over time because we have hourly electricity usage data from the three California electric IOUs (see Data and Methodology section for details). We have hourly gas data for SCG, daily for PG&E, and monthly for SDG&E. Due to the lack of hourly data for two of the three gas IOUs, we use the PRISM model to analyze changes in gas usage over time. In order to test whether results between the two models are consistent and comparable, we also ran the PRISM model on a sub-sample of our electricity meters. Results were similar and are available upon request from the authors.
2.5. Defining Project Installation Dates
To estimate pre- and post-retrofit energy usage in our models, we must define project start and end dates. Some energy efficiency projects might take a number of days or weeks to complete, and their impacts might begin to take effect before project completion. We assume that the impact of solar projects on household electricity usage takes effect on the date of system interconnection.
Through discussion of the project implementation, completion, and funding process with each provider, we defined program-specific time windows that we believe encompass and reflect the vast majority of project installations. For energy efficiency projects, these project installation time windows are generally two to four weeks in duration, meaning that we defined the project start date to be two to four weeks prior to the best project completion end date that we received. We do not consider the dates within these project installation time windows when estimating energy usage impacts: the baseline period is the year prior to the start date of the time window and the reporting period is the year following the end date of the time window.
We assume that the impact of solar projects on household electricity usage takes effect on the date of system interconnection. Some solar projects in California were subject to interconnection delays during the time period studied. To address this issue, we used project interconnection dates from Berkeley Lab’s Tracking the Sun dataset [16]. If these interconnection dates were too distant from our R-PACE project dates (more than 60 days before or 120 days after), we discarded the household due to this date inconsistency.
2.6. Selection of Comparison Households
To account for non-weather factors that might influence energy usage over time, we select a comparison group of households. As our usage dataset contains only R-PACE households, we use a prior and future participants method to select our comparison households [21]. Our selection algorithm for comparison households proceeds at the meter level as follows:
- For each R-PACE household, we identify other R-PACE households that meet all of the following criteria:
- Their project start and end dates are outside the baseline and reporting periods of the household being matched (such that their usage was not affected by projects installed during the time period of comparison);
- They are in the same zip code and utility jurisdiction at the household being matched (and therefore may be subject to similar factors affecting energy usage, including prices and economic factors);
- Their usage (for the fuel in question) and weather data pass our data quality and sufficiency checks (see Appendix A for details); and
- They did not have solar PV installed before or during the baseline and reporting periods of the household being matched (because the presence of PV significantly alters the level and pattern of electricity usage in households).
- Of these potential candidates, we selected the household that had the most similar usage (electricity or gas, as appropriate) during the matched project’s baseline period as measured by the minimum sum of absolute differences in monthly consumption of that fuel over the R-PACE household’s baseline period. This prioritizes comparison households with similar monthly consumption to the matched household.
We ran the selected comparison meters through the appropriate model (i.e., TOWT for electricity, PRISM for gas) using the project dates of the matched household. For some meters, no candidate comparison meters meet all the criteria in step 1 above. We exclude these unmatched meters from our results. We are able to identify comparison meters for approximately two-thirds of our electric accounts and more than 80% of our gas accounts. Appendix A details how this and other exclusions affect our sample size. The change in grid electricity or gas use calculated for these comparison meters represents how consumption in the comparison household changed over the same time period due to non-project factors. Subtracting the comparison household’s change in usage from the R-PACE household’s change in usage yields an estimate of the reduction in grid electricity or gas use attributable to the R-PACE project.
3. Results
The energy use impacts presented here reflect the difference in usage changes between the matched R-PACE and comparison group. In aggregate, the average change in electricity usage for comparison group households was less than 1.5% for each measure category. Separate estimates of energy impacts for R-PACE and comparison households are available upon request.
3.1. Usage Impacts by Utility
Table 3 shows our estimates of the average reduction in grid electricity and gas use for R-PACE households in each measure category for each California IOU. (We use the term “reduction in grid electricity use” here because it includes both electricity savings from energy efficiency measures and avoided grid electricity consumption due to on-site PV generation. We study the change in household load net of PV generation, and (for PV homes) cannot separate avoided grid consumption from efficiency savings, since both reduce net load.) We also present confidence intervals in Table 3. To generate confidence intervals by utility and measure category, we first calculate the confidence interval for each R-PACE household using the method specified in ASHRAE Guideline 14 [22]. Next, we calculate a confidence interval for the difference in savings between the R-PACE and comparison household, assuming independence in the errors from each household [23]. Finally, we aggregate the confidence intervals for these differences to the desired level (e.g., energy efficiency projects in PG&E households) again assuming independence of errors.
Table 3.
Average R-PACE project impacts by California IOU.
For R-PACE households that only installed efficiency measures, electricity savings ranged between 3 and 5% for households located in SCE and PG&E service territory while average electricity usage increased slightly for SDG&E R-PACE customers (0.4%). In analyzing savings for households that installed energy efficiency measures, it is important to note that the vast majority of R-PACE energy efficiency projects affect only space conditioning energy usage, and that the majority of California households are heated by natural gas. (86% of California single-family homes used natural gas as the main source of space heating and only 2% used electricity, 8% used other fuels, and 4% were not heated in 2009, the most recent data available [24].) Moreover, many homes in coastal areas of California enjoy very mild summers and do not have air conditioning. (In 2009 43% of California households were not air-conditioned [25]. Air conditioning saturation varied dramatically by climate zone, from less than 20% in the San Francisco Bay Area, to around 50% in coastal urban areas in southern California, to over 90% in many inland areas [24]. In particular, SDG&E’s service territory is largely coastal, making it difficult to save electricity via upgrades to space conditioning equipment. The negative electricity savings in SDG&E territory may also reflect installation of air conditioning equipment in some households that previously did not have air conditioning.
Average gas usage declined by 2%, 3% and 7% in R-PACE households that are located in SoCal Gas, SDG&E and PG&E territories, respectively. PG&E’s service territory is in northern and central California, where winters—while still mild by national standards—are cooler. Consistent with this, R-PACE energy efficiency projects save more gas usage on average in PG&E territory.
Our metered data analysis shows much larger reductions in grid electricity use from solar PV than from energy efficiency projects. For R-PACE households that installed solar PV, reductions in grid electricity use ranged between 66 and 83% of electricity usage across the three IOUs. Not surprisingly, average reductions in grid electricity use were quite high for these households (7300–8800 kWh per year). SDG&E solar projects generate more electricity on a household percentage basis than those in the other utilities, likely due to a combination of high insolation and lower average pre-project household usage due to low cooling loads. For these homes that installed solar PV, gas usage increased modestly (3%) for homes located in SoCal Gas and SDG&E service territory after installation and declined modestly (2%) for homes located in PG&E service territory. In general, solar projects have little impact on gas consumption, though the impacts vary across utilities in a manner for which we have no immediate explanation.
In PG&E and SDG&E service territories, R-PACE households that installed both solar PV and energy efficiency measures saw average reductions in grid electricity use of similar magnitude to homes that just installed solar PV. However, in SCE territory, reductions in grid electricity use were approximately 10% lower in homes that installed solar PV and efficiency measures compared to PV-only households (57% vs. 66% savings). This result is counter-intuitive and surprising. Given that we find this result only in SCE territory, it may be explained by particular characteristics of these projects. All the joint EE/PV projects in SCE territory were installed by a single R-PACE program. While we cannot test this given our data, it is possible that many of these 368 projects were done by a single R-PACE contractor that may have installed smaller-than-typical PV systems. For this group of homes that installed both solar PV and efficiency measures, we observe reductions in gas use at households in all three service territories, ranging from 2.6% at PG&E to 3% at SDG&E and 5.3% at SoCal Gas.
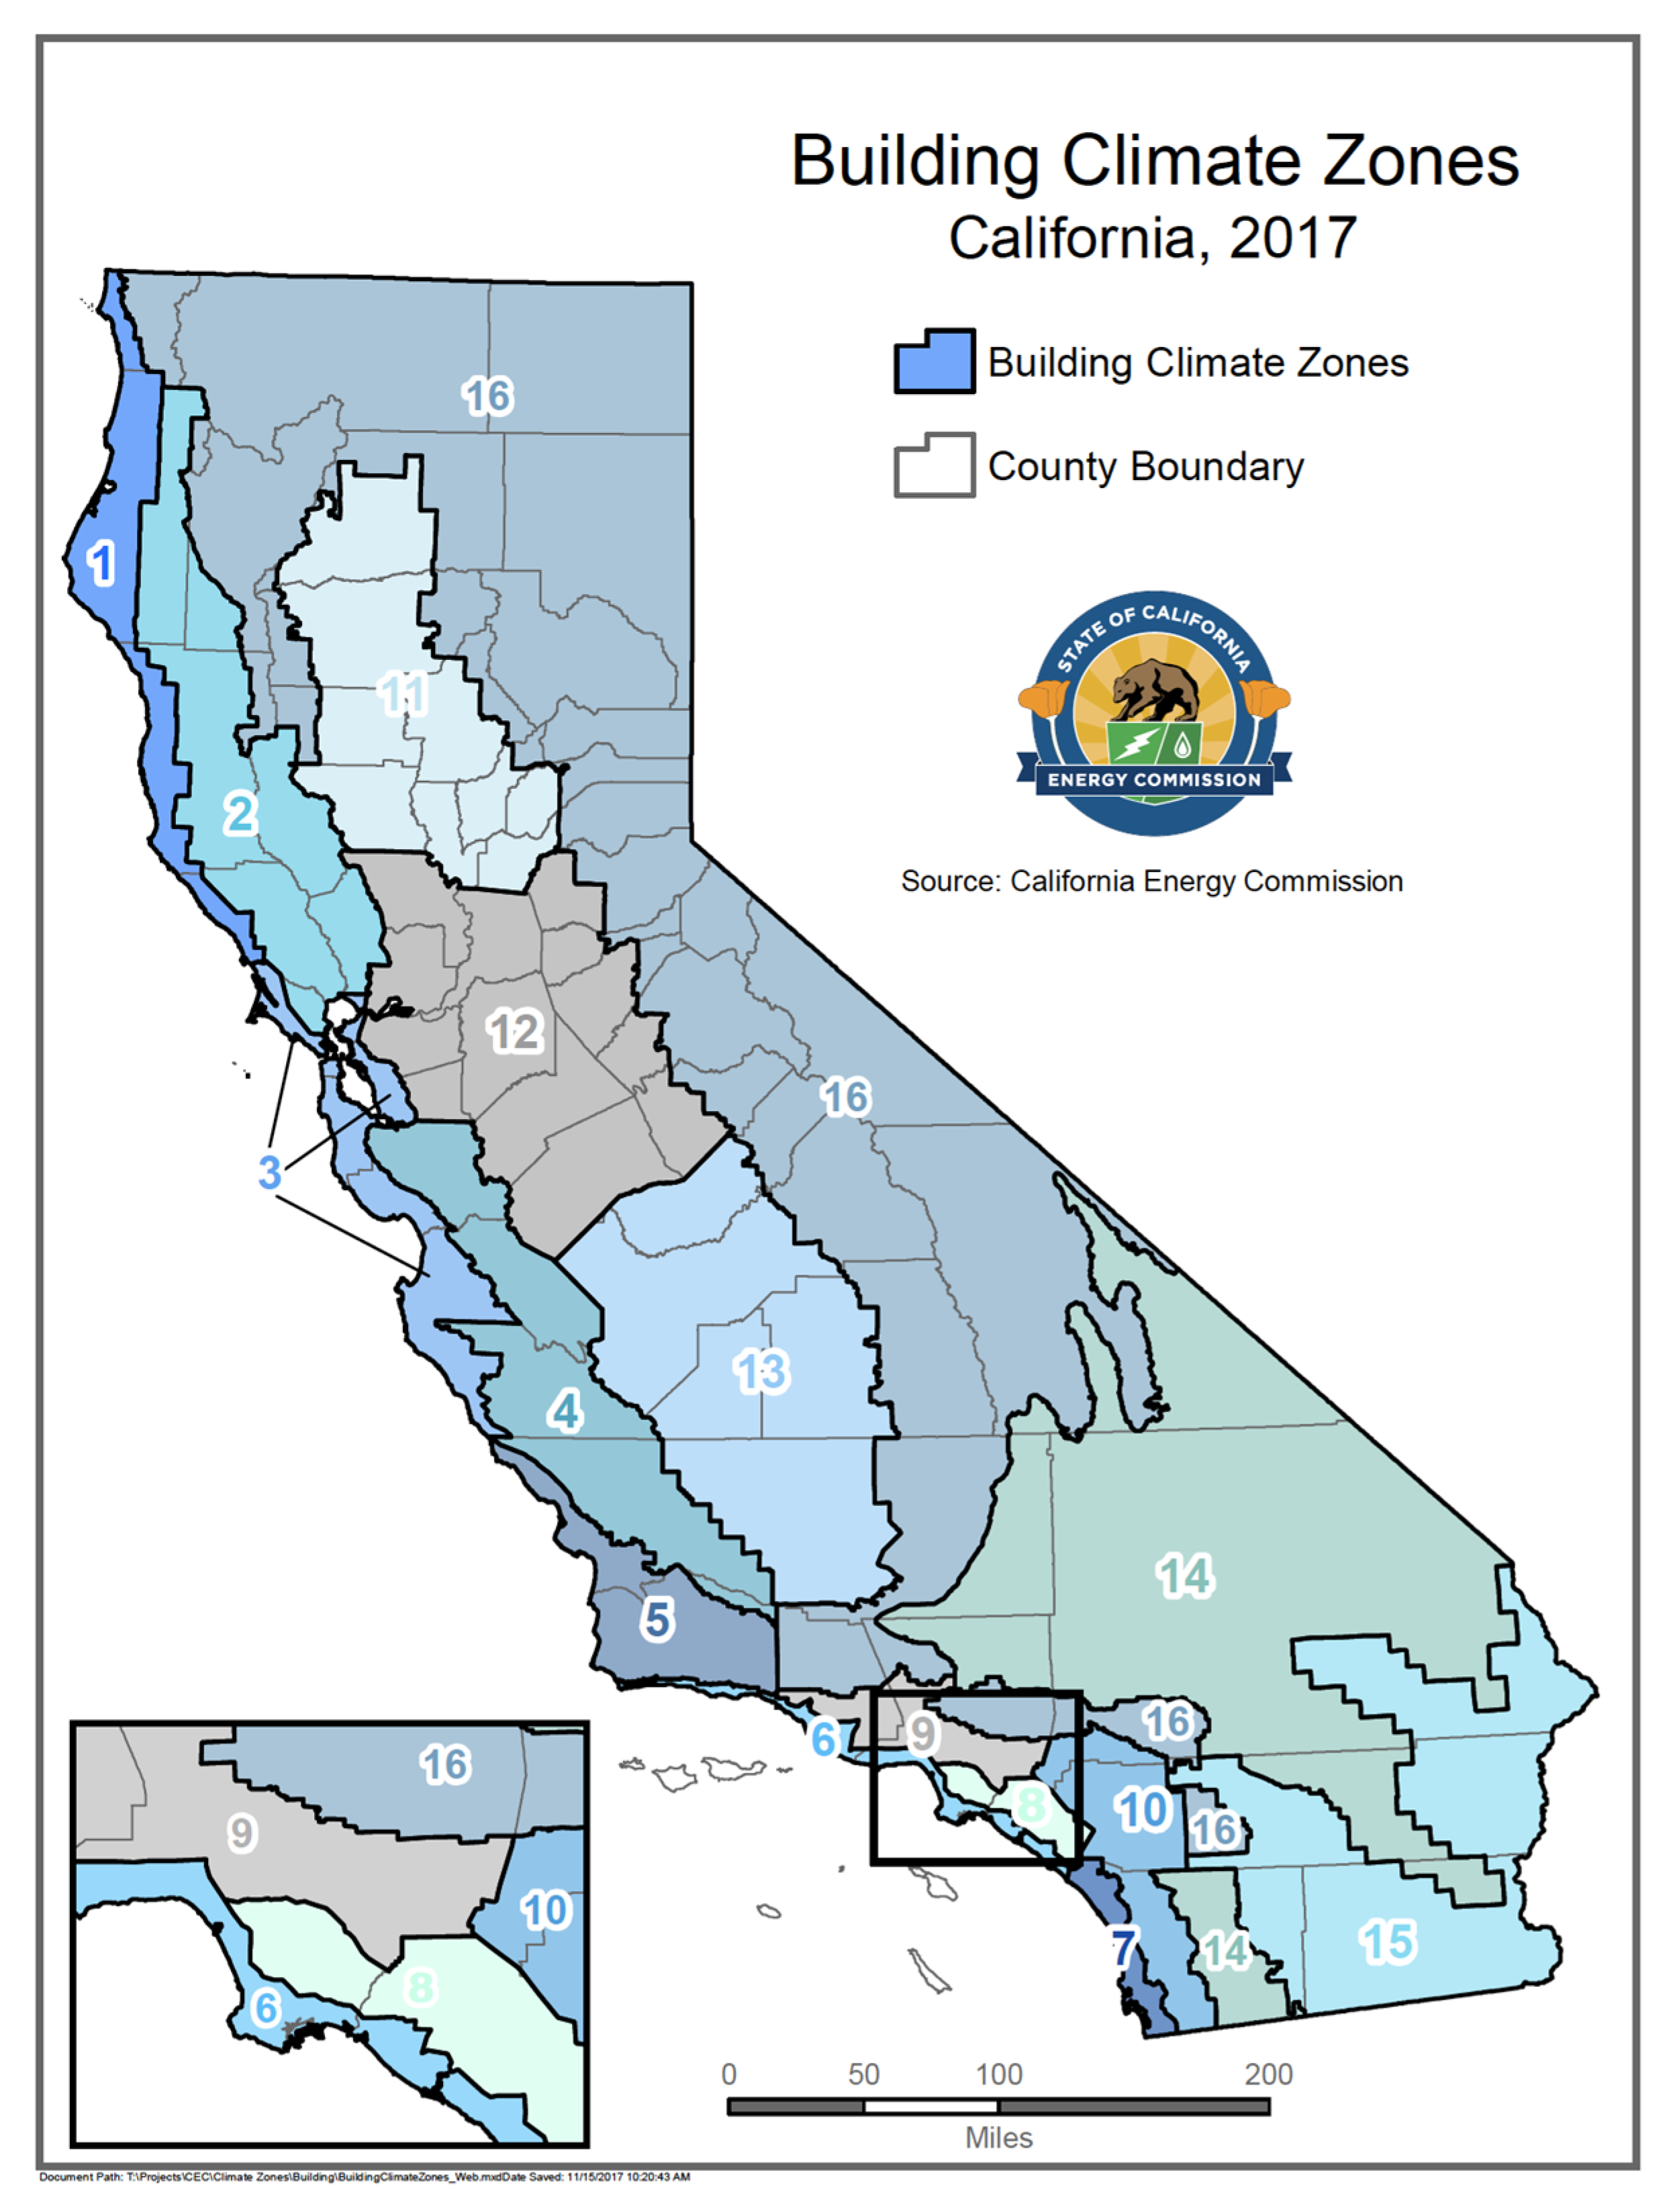
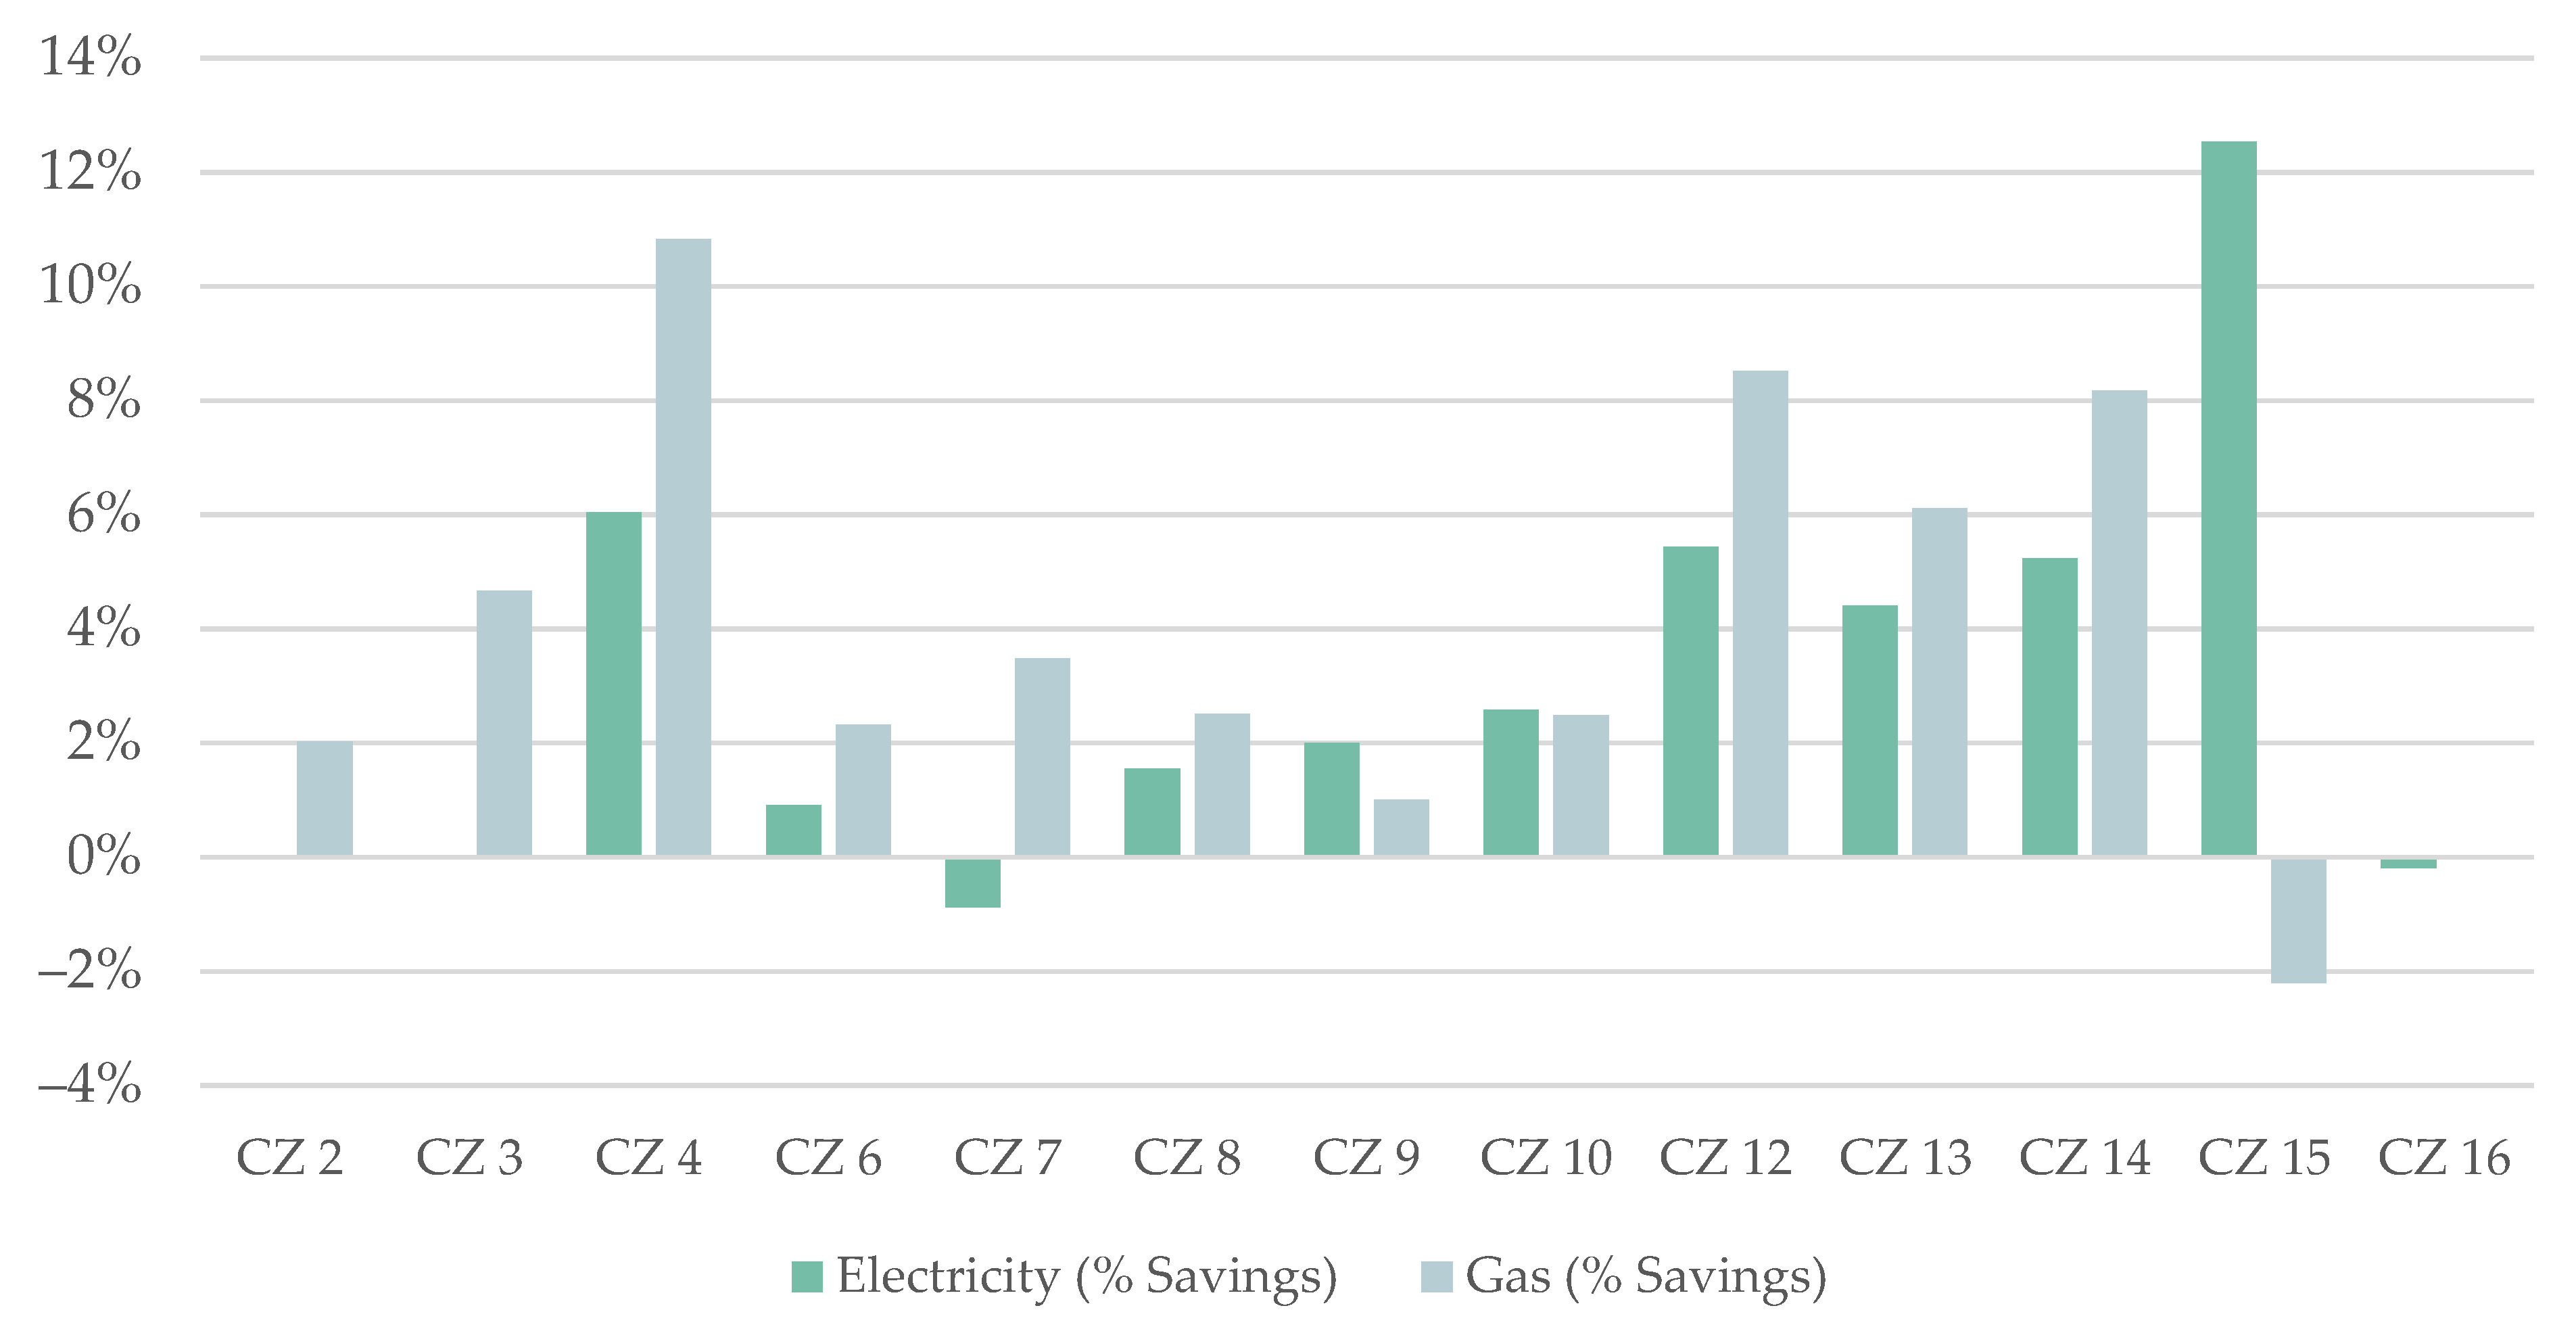
Figure 2 presents California’s climate zones, and Figure 3 shows our estimates of the average R-PACE project impacts by California climate zone for households that installed various types of energy efficiency measures. Percentage electric savings from energy efficiency projects are highest (4 to 13%) in non-coastal climate zones (4, 12, 13, 14, and 15–Central Valley, Sierra Nevada region, and inland desert areas) which experience warmer summers and therefore higher cooling loads.

Figure 2.
California climate zones.
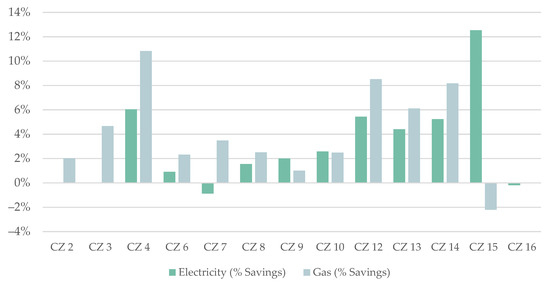
Figure 3.
Energy efficiency project impacts by California climate zone. Note: We do not include results in climate zones where we had results for less than 100 households for a given fuel. This includes climate zones 2 and 3 for electricity, and climate zone 16 for gas. Climate zone 1 did not have enough households with results for either fuel.
Note that the savings for projects in various climate zones include some projects that installed new central AC in households that had previously lacked such units, or installed a gas furnace in a home that had previously used an electric space heater or wood stove. We might expect that a greater share of R-PACE projects would include installation of new HVAC technologies, rather than replacement of existing units, in climates where heating or cooling demand is low and therefore many homes would not have previously had these technologies. Such effects likely explain the negative savings for electricity in climate zone 7 (a temperate coastal Southern California climate zone where air conditioning penetration is low) and for gas in climate zone 15 (a hot desert climate where minimal heating is necessary).
Gas savings are highest in more northern or more inland zones (3, 4, 12, 13, and 14—the greater Bay Area, northern Central Valley, and Sierras). Zone 3 is coastal but far enough north to require more significant space heating in the winter (4% savings); zones 4, 12, 13, and 14 are far enough inland that they also have significant heating demand (6 to 11% average gas savings). Zone 15 is essentially a desert environment, warm enough to not require much space heating despite being inland.
3.2. Usage Impacts by Energy Efficiency Measure Category
Figure 4 shows average energy usage impacts by energy efficiency measure. The results align well with the expected fuel impacts of each technology. For example, building shell measures (other envelope, windows and doors) save on both gas (3–6%) and electricity (3–5%). Average gas usage declined by approximately 12% for customers that installed more efficient water heaters or other related measures. (88% of California single-family households had gas water heaters in 2009 and only 5% had electric water heaters [23]. The increase in electricity usage from water heater projects that we estimate might reflect some switching from gas to electric water heaters, which we cannot directly observe in the data.) In general, multi-category projects have higher savings, especially for gas. For example, households that installed HVAC, envelope measures, and new windows/doors reduced electricity usage by 6% and average gas usage by 10%.
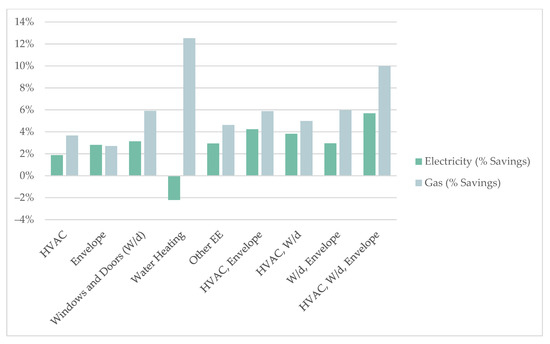
Figure 4.
Energy efficiency project impacts by measure category.
3.3. HVAC Project Savings
The measure data we received from PACE providers generally do not establish whether the HVAC projects in our data installed new heating or air conditioning equipment, both, or neither (e.g., household installed new duct sealing or new whole house fans). Moreover, an unknown fraction of projects that installed HVAC equipment represent households that did not have space cooling equipment (A/C) or central heating systems prior to installation. This may be a larger issue in California’s mild climate than in most parts of the U.S. (As of 2009, approximately 40% of California single-family households did not have air conditioning and approximately 14% did not have heating systems, leaving room for penetration of new systems. Nationwide, only 4% of households are not heated and only 17% lack air conditioning [24,25]. In the case of heating, some R-PACE households may be installing new gas- or electric- heating equipment that is replacing or supplementing wood or propane heating.)
As such, the average result for each fuel is based on an agglomeration of projects expected to reduce usage of that fuel (e.g., a furnace replacement’s impact on gas usage); projects expected to have little impact on that fuel (e.g., an air conditioning project’s impact on gas usage); and projects expected to increase usage of that fuel (e.g., a new gas-fired furnace installed in a house that did not have gas heating equipment). Thus, our HVAC results should not be interpreted to mean that the average air conditioning replacement reduced electricity use by only 4%, or that the average gas furnace replacement reduced gas usage by only 2% (see Figure 4).
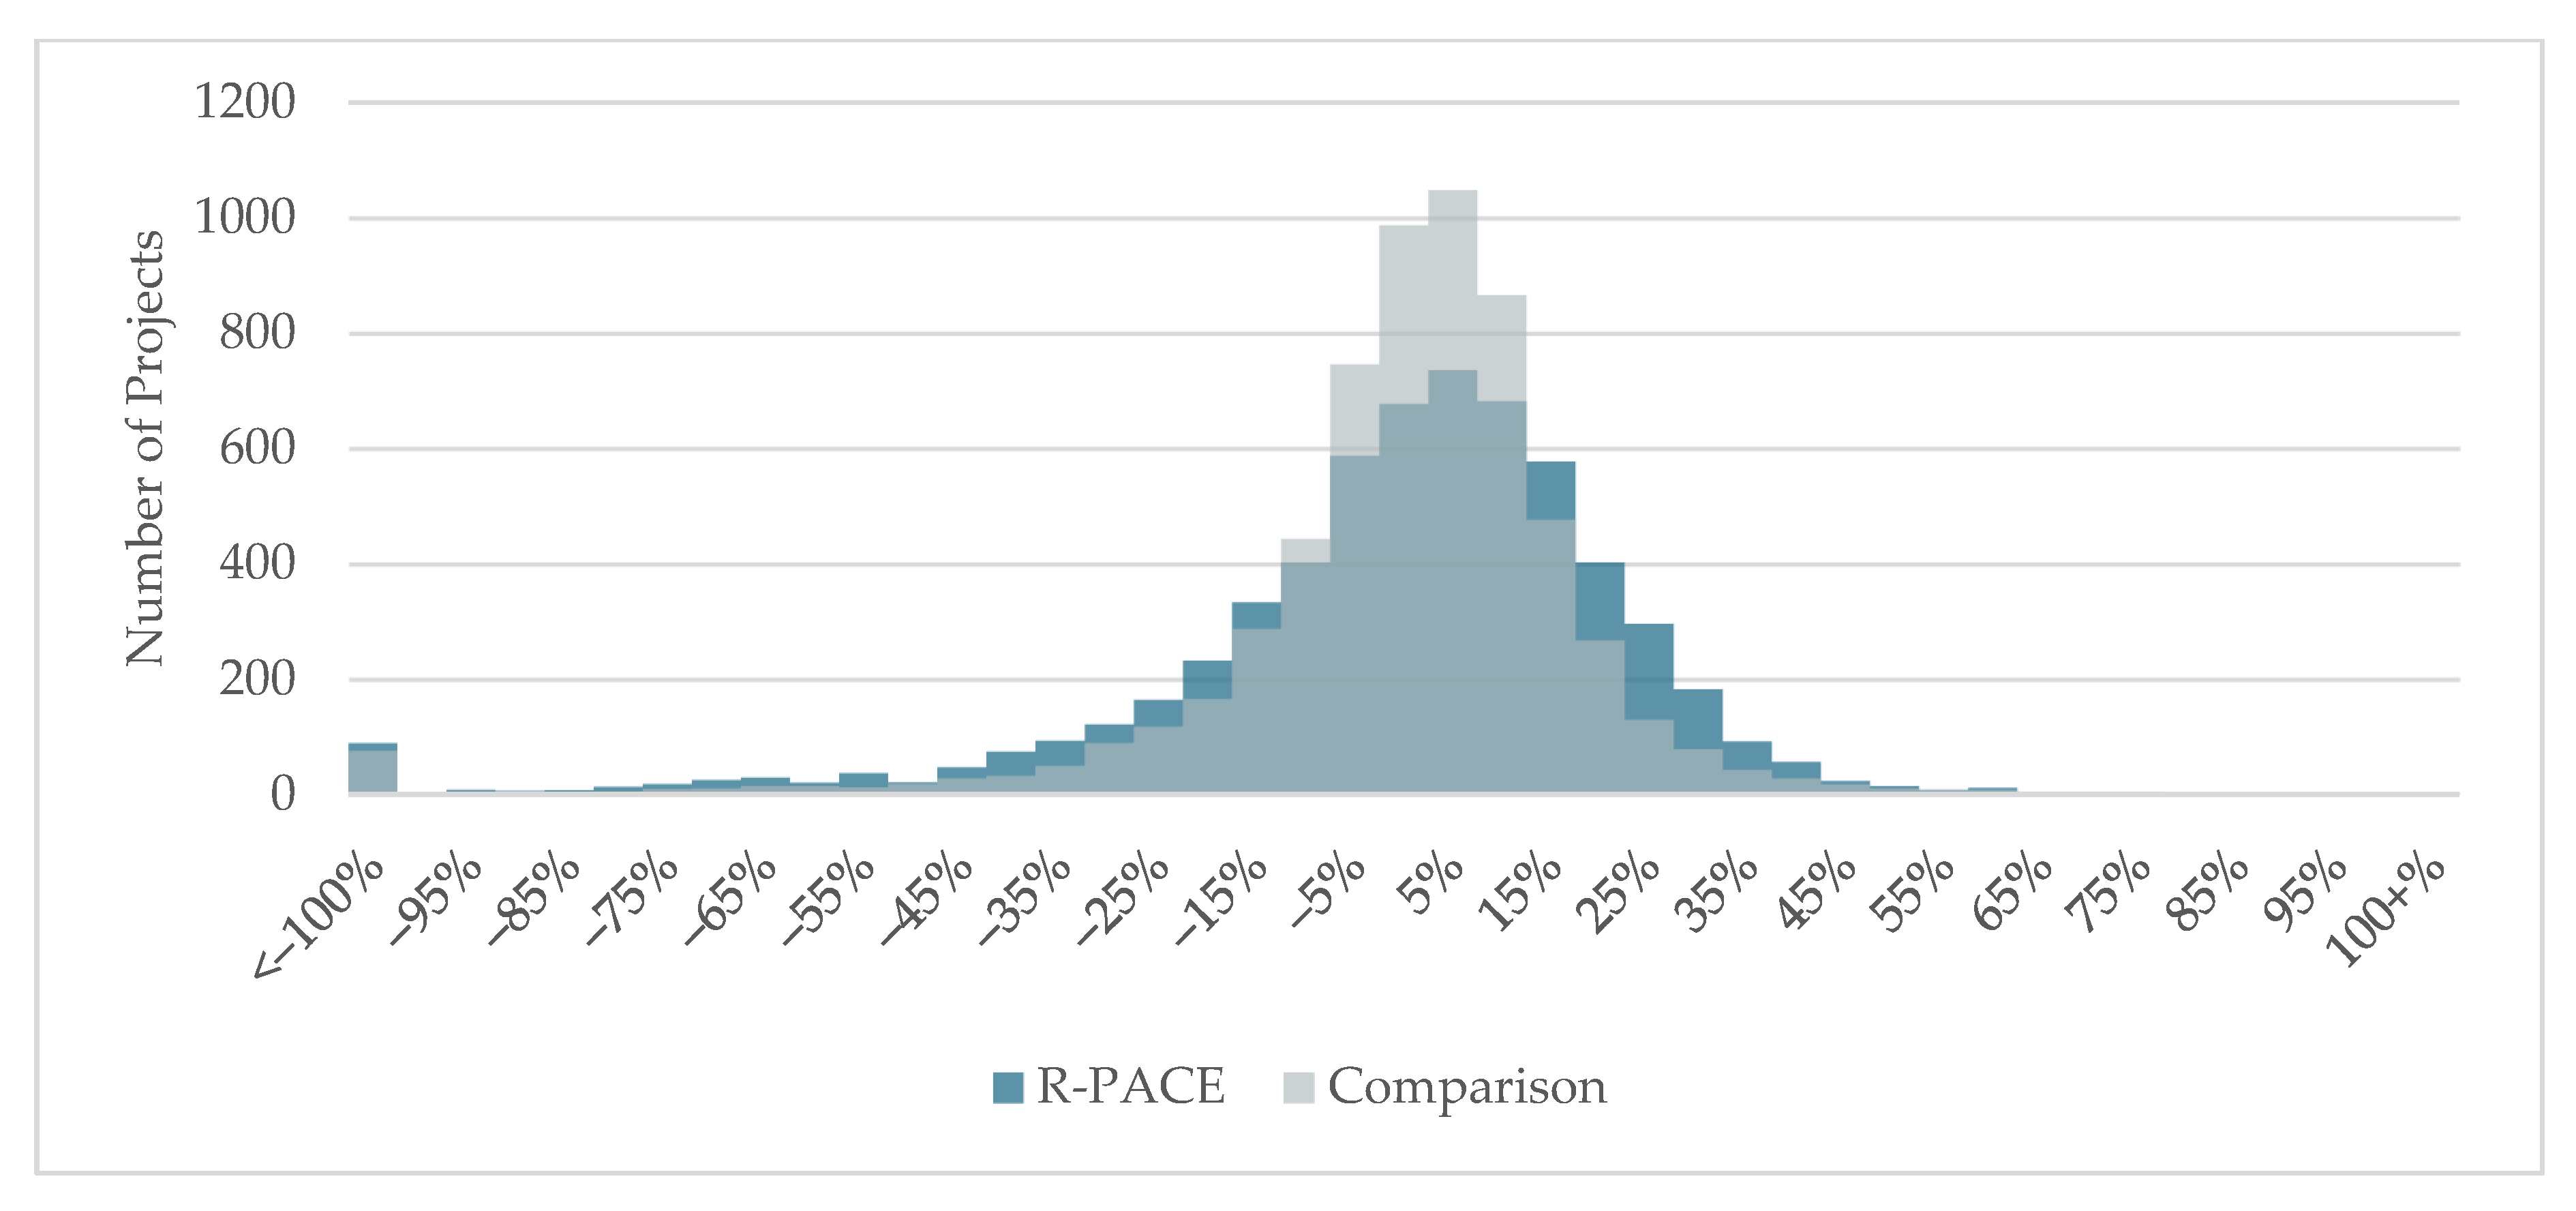
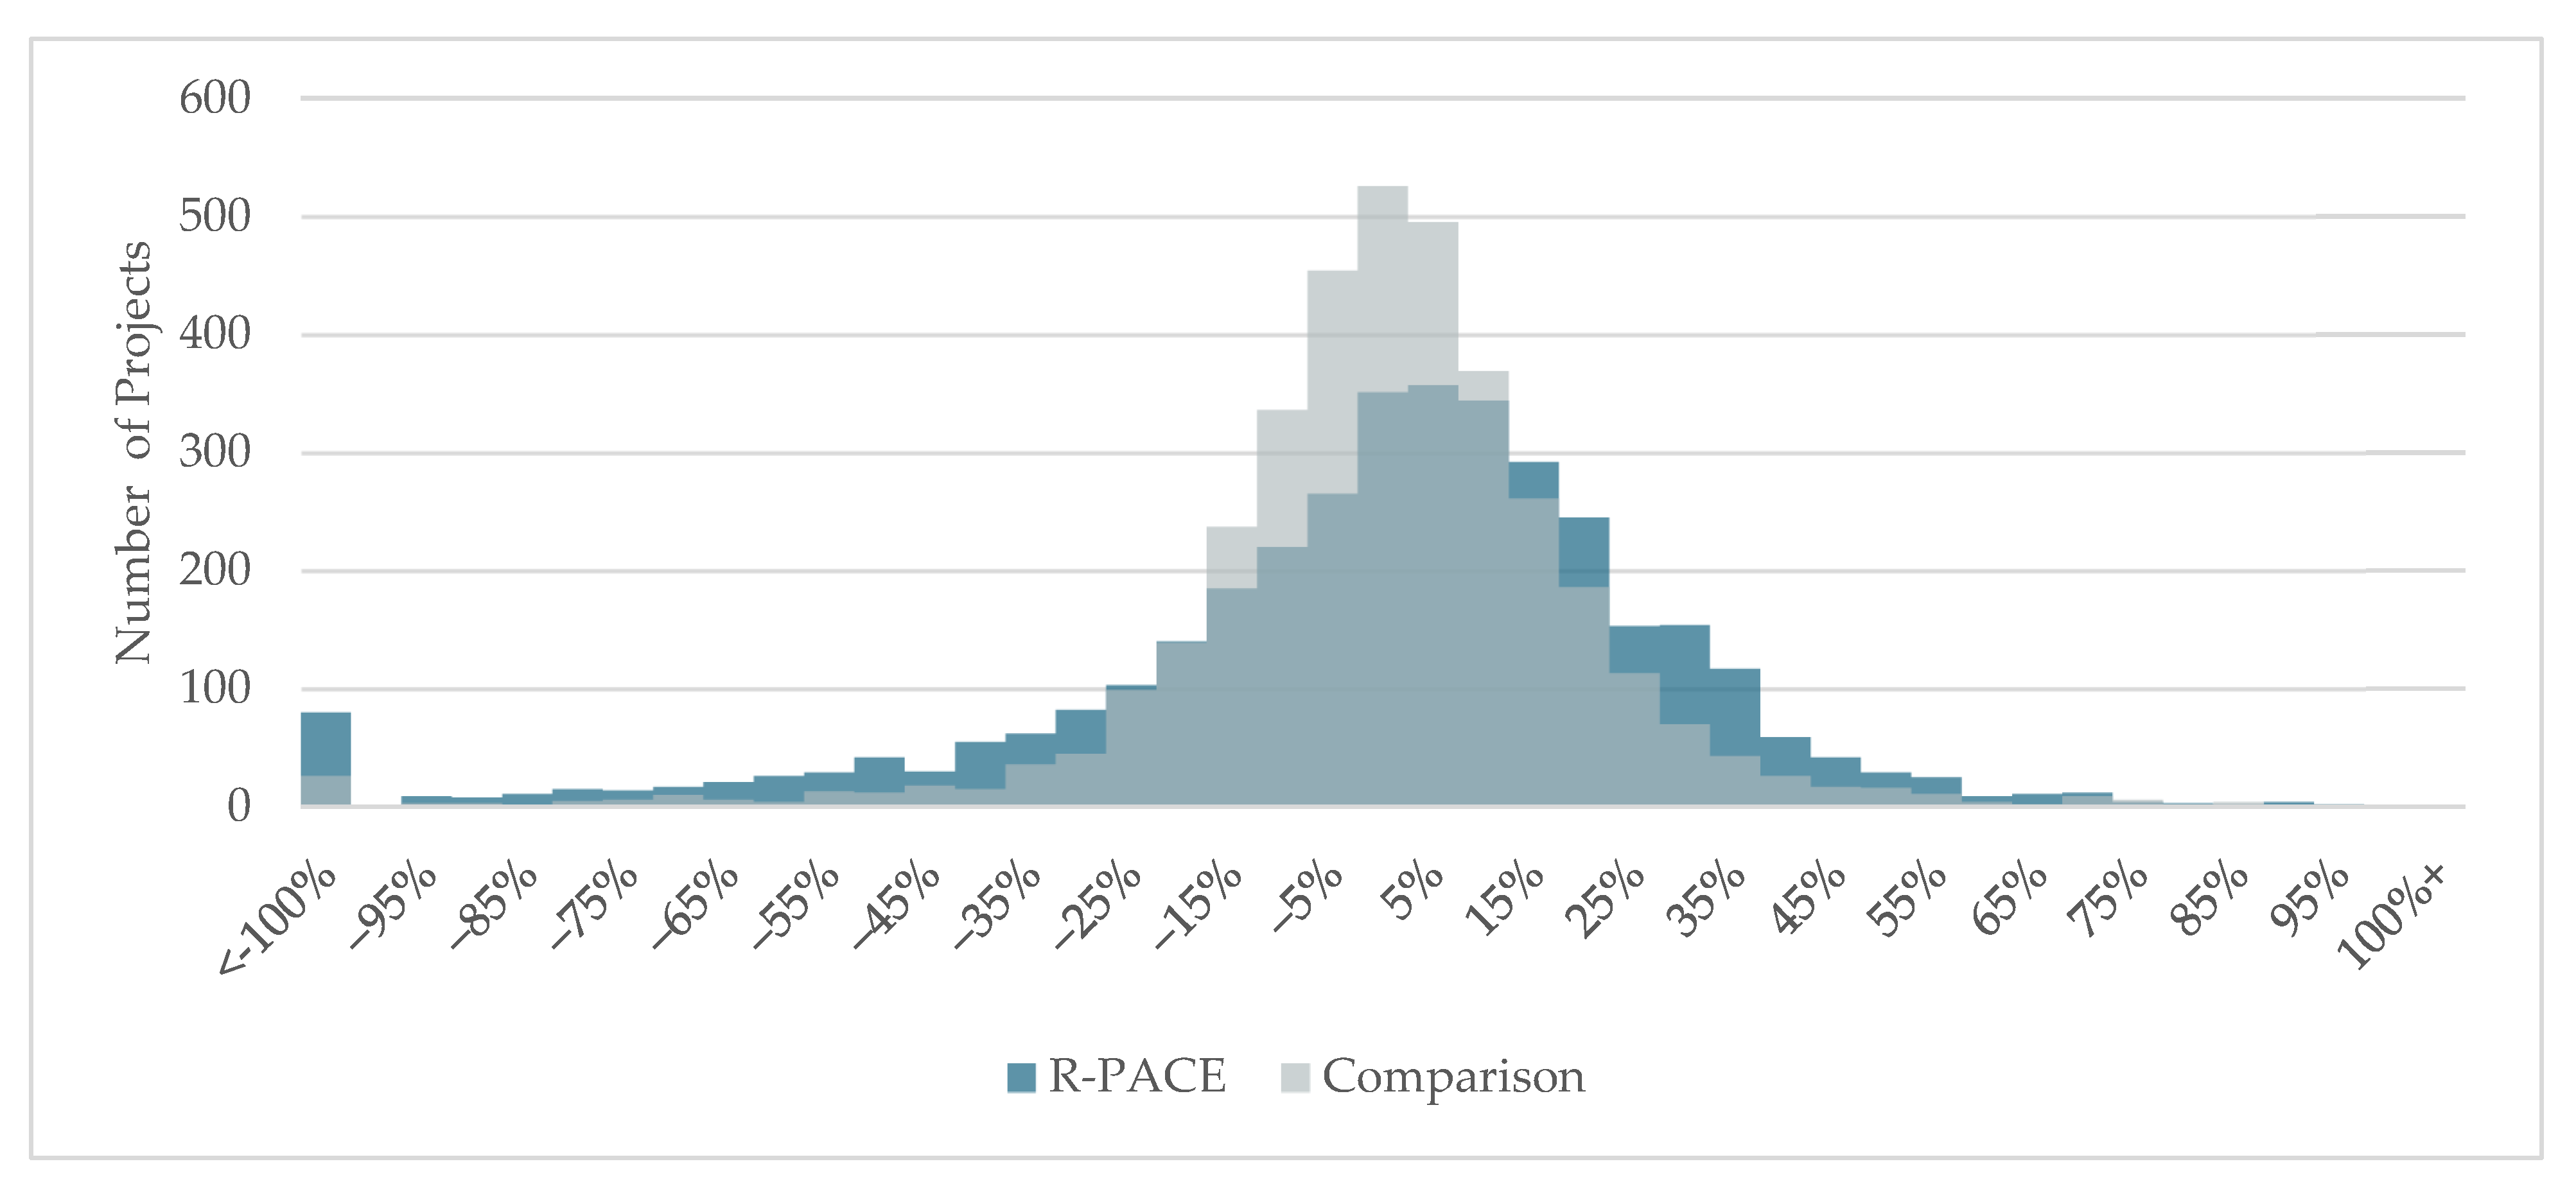
Figure 5 and Figure 6 show distributions of impact estimates for electricity and gas usage for R-PACE project and comparison households that installed HVAC only measures. Note that households with negative savings in Figure 5 or Figure 6 increased electricity or gas usage, respectively, after the R-PACE project was installed. Households with positive savings decreased their electricity or gas usage. The distribution of “impacts” for comparison households (shown in gray shading)—which did not implement projects in the time window analyzed—gives a sense of the natural variability of year-on-year household energy usage due to non-project factors, even after we have normalized for the effects of weather.
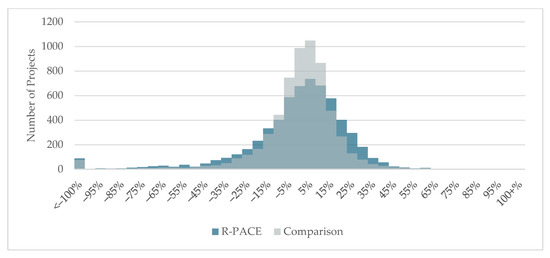
Figure 5.
Distribution of household electricity savings from HVAC projects. Note that positive numbers represent savings (reductions in electricity use); negative numbers are negative savings (increases in electricity use).

Figure 6.
Distribution of household gas savings from HVAC projects. Note that positive numbers represent savings (reductions in gas use); negative numbers are negative savings (increases in gas use).
Figure 5 and Figure 6 show that a greater share of comparison HVAC households than R-PACE HVAC households had energy impacts within 10% of baseline usage than project households. A total of 67% of comparison households had changes in usage between 𢄬10% and 10% of baseline usage, whereas only 50% of R-PACE households had usage changes in that range. A greater share of R-PACE HVAC households than comparison households decreased their consumption. A total of 27% of R-PACE households saved more than 10% of baseline electricity usage as compared to 18% of comparison households. However, a higher percentage of R-PACE households also increased usage after the R-PACE project. A total of 22% of R-PACE households increased electricity usage by 15% or more relative to their baseline usage (“negative savings”) compared to only 15% of comparison households. We find similar patterns among HVAC-only households in our gas analysis.
The greater share of R-PACE households on the far left side of the distributions suggests that these projects installed a new furnace or air conditioning equipment and did not have this type of equipment prior to the project. We do not find higher shares of project households on the left-hand side of the distribution for other measure categories. This finding is consistent with R-PACE program rules in California, which allow for installations of new HVAC equipment irrespective of prior HVAC equipment practices.
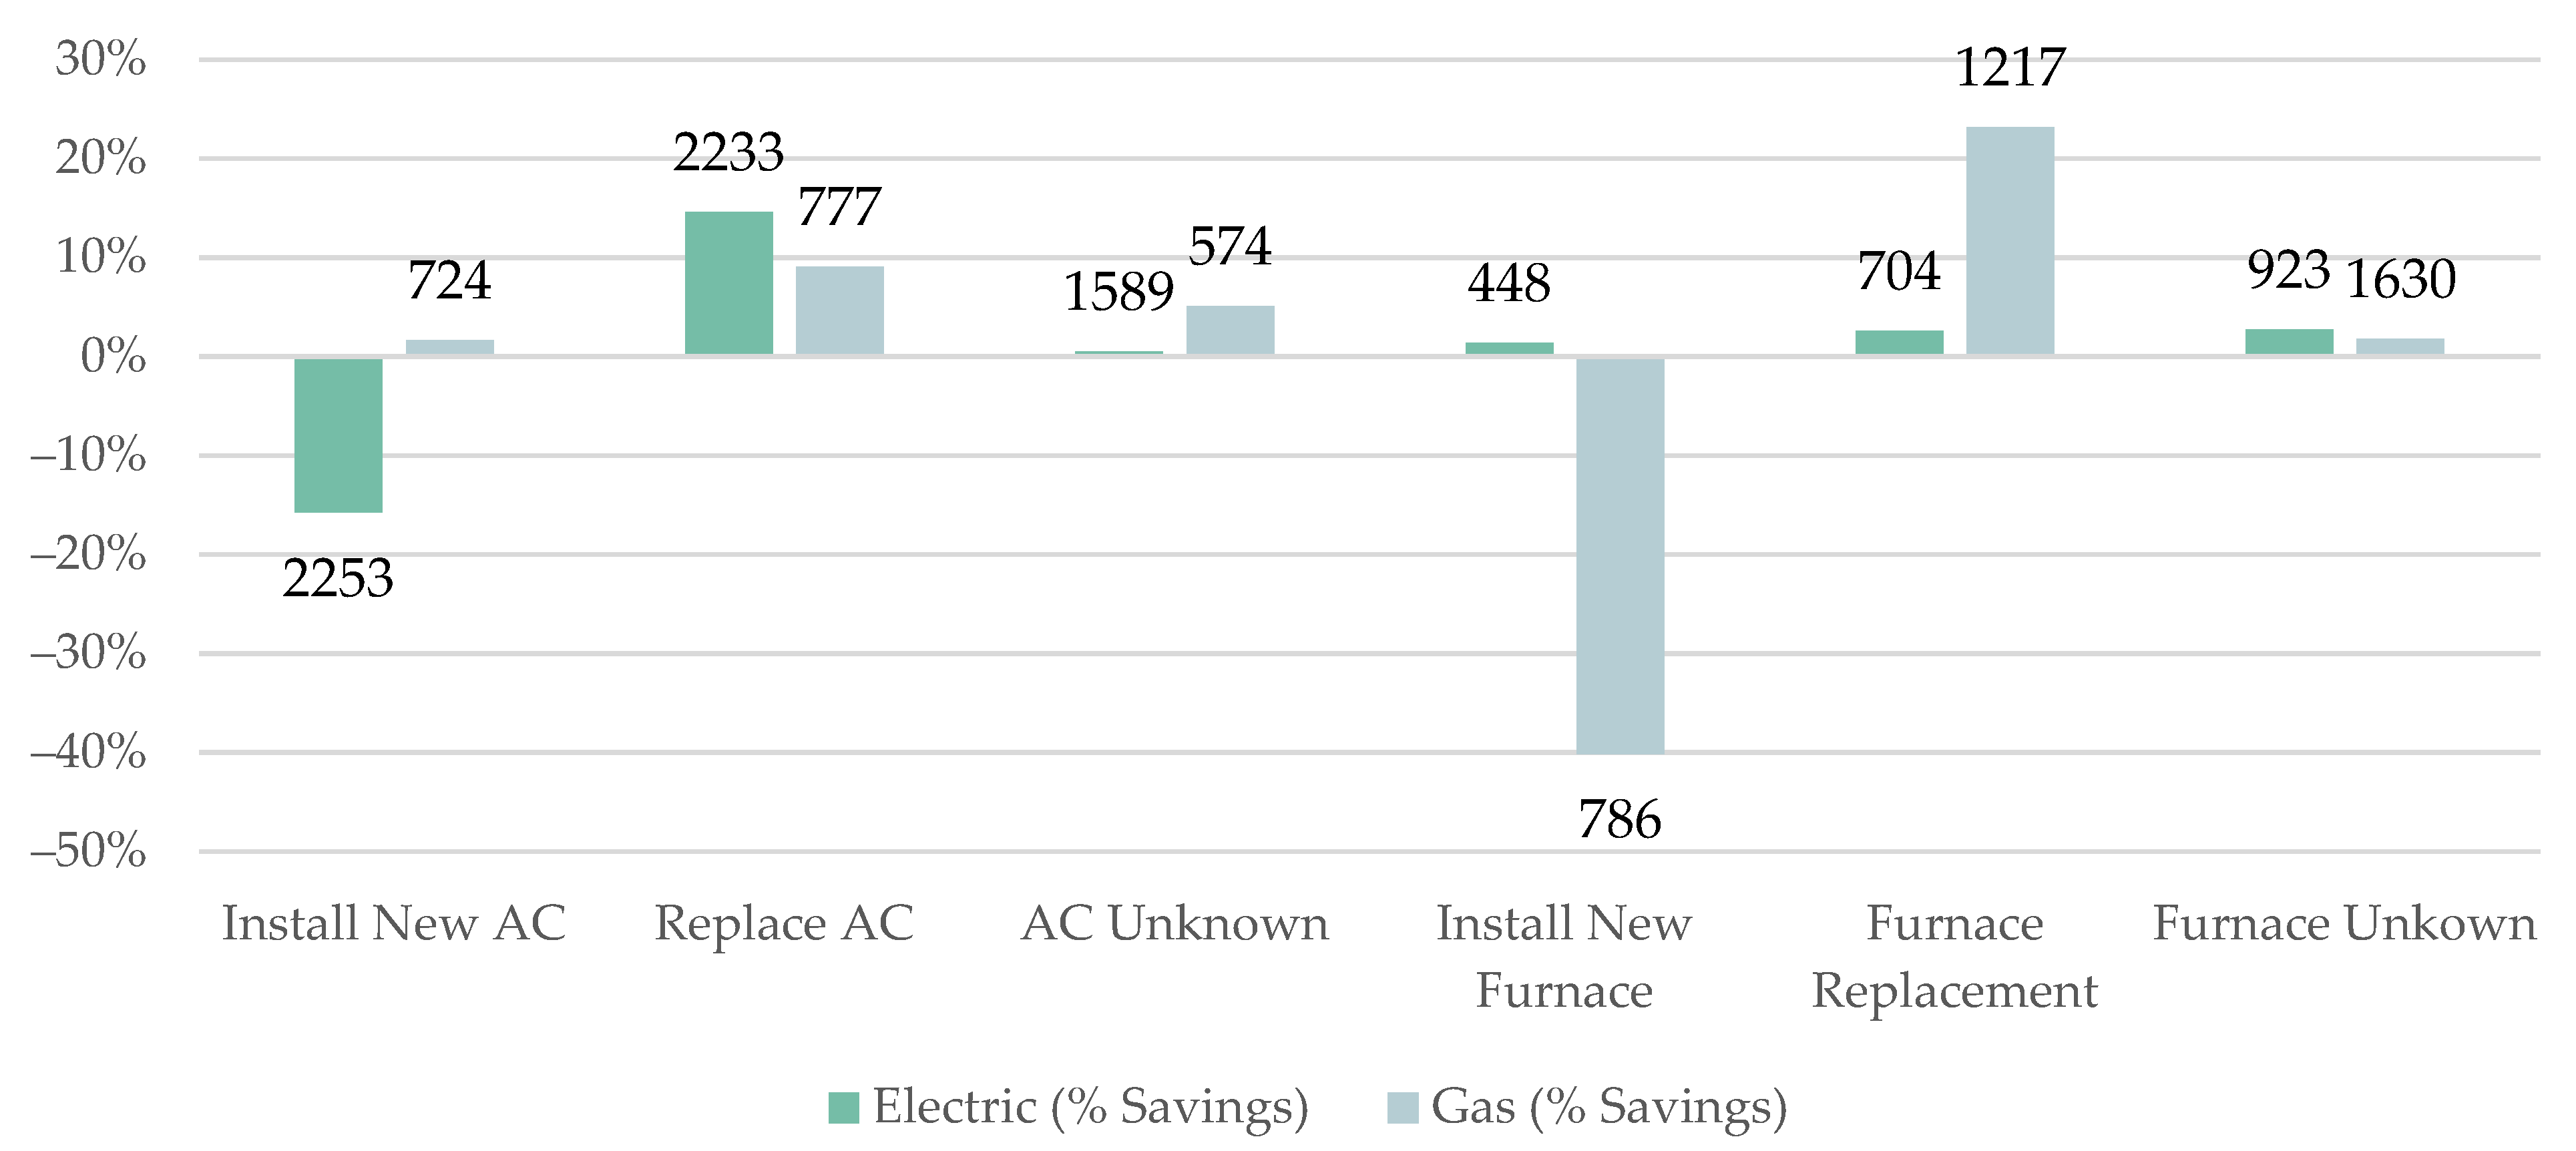
To gain greater clarity on HVAC impacts, we use an algorithmic method to infer which projects may be installing new HVAC equipment and did not have such equipment prior to the project. We focus on seasons and times of day that are most likely to reveal the actual context and baseline conditions underlying projects that installed HVAC equipment. Specifically, we examine each HVAC-only project’s electricity usage impact from noon to midnight in the summer months of July through September (where we would expect air conditioning to be used). If weather-normalized electricity use increases by more than 15% during these hours, we infer that the project includes a new air conditioning installation. If weather-normalized electricity use decreases by more than 10% during these hours, we infer that the project includes a replacement of existing air conditioning equipment. Projects with usage changes that fall between these values are ambiguous or may not have included a cooling-related efficiency measure at all (e.g., only measures affecting gas usage were installed). For natural gas, we apply similar logic to all usage during the winter months of December to February. An increase in gas consumption of 25% after the R-PACE project was completed is our threshold for inferring installation of a new gas furnace in a household that previously did not have gas central heating equipment. If gas usage for HVAC-only projects decreased by at least 10%, then we assume that a new gas furnace replaced existing gas-fired equipment. We define these cut-off points from the data underlying Figure 3 and Figure 4. We choose cut-off points near the parts of the savings distributions where the share of project households begins to be greater than the share of comparison households, suggesting that values at and beyond these cut-off points are more likely to reflect project effects than other factors. Figure 3 and Figure 4 show full-year results. By focusing on seasonal time periods where HVAC effects ought to be more pronounced, we are more confident that the observed effects are related to installed measures in projects. For example, we guard against mis-identifying electric heat impacts as air conditioning impacts. Note that we restrict our inquiry to air conditioning and gas heat, so are not considering electric heat (such as via an air-source heat pump).
Figure 7 shows annual savings estimates for HVAC-only projects categorized in this manner, along with the sample sizes of each inferred category. The data suggest that many R-PACE HVAC-only projects may be installations of new equipment rather than one-for-one replacement of existing types of HVAC equipment. Among projects we classify as A/C equipment replacement, average annual electric savings are 15%. Among projects we classify as heating equipment replacement (e.g., furnaces), average annual gas savings are 23%. For the projects that we classify as having installed new equipment in households that did not previously have that equipment, usage increased significantly—by 16% on average for inferred cooling equipment installs and by 40% on average for inferred heating equipment installs (e.g., furnaces). In general, the impact of inferred new cooling equipment projects on gas use and of inferred gas heating projects on electricity use are small (1–2%), as would be expected.
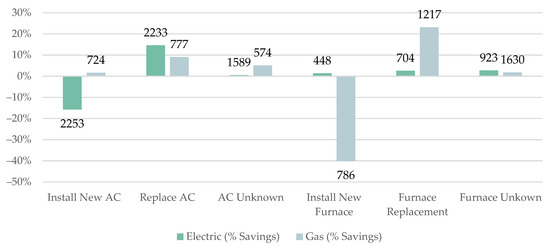
Figure 7.
Distribution of percent household gas savings from HVAC-only projects. Note: Numbers above or below each bar show the sample of households inferred to be in that category. Sample sizes for the “other fuel”—gas in the case of the cooling classifications and electricity in the case of the heating classifications—are smaller because some “other fuel” meters failed one of our checks or were missing data altogether.
We view this effort to characterize the underlying baseline condition of HVAC projects as exploratory, yielding approximate distributions, because our algorithm likely mischaracterizes some projects.
3.4. Usage Impacts across the R-PACE Portfolio
In order to estimate average usage impacts from all R-PACE projects, we calculate a weighted average of the estimated impacts by utility. We weight by the sample size of R-PACE projects installed in each utility service territory to account for variation in sample size attrition from data sufficiency checks by utility (see Appendix A for details). Table 4 summarizes the average energy impacts by type of project.
Table 4.
Average reductions in grid electricity and gas use by type of project in California R-PACE programs.
Our results suggest that, on average, an R-PACE-financed energy efficiency project reduces a household’s electricity usage by approximately 3% and gas usage by approximately 4%. If we exclude those energy efficiency projects that we infer to be installations of new HVAC equipment (rather than replacement upgrades of existing equipment), then average household savings increase slightly to 5% for electricity and 6% for gas. For those projects that installed solar PV only, the reduction in grid electricity usage averaged 69% across households while average gas usage increased slightly (1.7%).
4. Discussion
4.1. The California Context
Much of California, especially the heavily-populated coastal part of the state where most R-PACE projects are located, has a much milder climate than most other parts of the U.S. As a result, space conditioning accounts for a relatively small share of California’s energy use. According to the U.S. Energy Information Administration (EIA), in 2009, gas space heating accounted for 39% of California’s household gas use, while space cooling accounted for 10% of household electricity use [26]. For comparison, these values are 63% and 15%, respectively, for the U.S. as a whole [27]. Per Table 2, the vast majority of R-PACE energy efficiency projects affect space conditioning energy use only. Therefore, potential savings from space conditioning-related energy efficiency measures are lower in California, both in absolute and percentage terms, than they would be in the country as a whole.
Per EIA, 15% of California households were not heated and over 40% did not use air conditioning in 2009 [25]. Air conditioning penetration in particular has been increasing in California [24]. Unlike some other energy efficiency programs, R-PACE programs can finance air conditioner and heating unit installations. Our data suggest substantial installation of both new air conditioning and heating units in California households that may not have had this type of equipment previously. Installation of these measures tends to result in increased energy use, but would not likely be as common for R-PACE programs implemented in parts of the country where heating and cooling units are more ubiquitous.
Due to the combination of these two factors, similar R-PACE programs in other parts of the country might be expected to achieve greater energy efficiency savings, both in percentage and absolute terms.
4.2. Comparison to Home Upgrade Program and Advanced Home Upgrade Program Impacts
To put our results in context, we compare them to a recent evaluation of California’s Home Upgrade Program (HUP) and Advanced Home Upgrade Program (AHUP). DNV GL (2019) evaluated electricity and gas savings in households participating in HUP and AHUP from mid-2016 through mid-2017 and used similar energy analysis methods [28]. HUP and AHUP are whole home retrofit programs that provide incentives for the installation of multiple measures. The programs focus on similar efficiency end uses to R-PACE and are available statewide in IOU service territories. HUP projects consist of at least three measures, including at least one of the following measures: air sealing (other envelope in our rubric), attic insulation (other envelope in our rubric), or duct sealing (an HVAC measure). Other potential measures are envelope, HVAC, and water heating related. AHUP projects consist of at least four (in some places at least five) measures, and also includes window replacements.
These programs address similar end uses to R-PACE, although HUP and especially AHUP projects are likely to be more comprehensive than R-PACE projects on average. Unlike AHUP projects, R-PACE projects do not have a minimum number of measures. As shown in Table 2, most R-PACE energy efficiency projects’ measures fall into a single measure category (though they may include multiple measures within that measure category—our data are not granular enough to reveal this). Moreover, HUP and AHUP do not allow installation of new HVAC equipment in homes that do not have air conditioning; they only target households that replace an existing HVAC unit with higher-efficiency equipment. Table 5 shows HUP, AHUP, and our R-PACE energy efficiency results by utility.
Table 5.
Average electricity and gas savings of HUP, AHUP, and R-PACE projects.
On average, per-household electric savings were slightly higher for HUP and AHUP participants compared to R-PACE households that implemented efficiency measures. Average gas savings were significantly higher for HUP and AHUP participants. When considering our R-PACE estimates with inferred installations removed, both gaps close somewhat, with average R-PACE electric savings in particular appearing to be comparable to average savings in the HUP/AHUP program. Given the likely differences in the mix and frequency of measures installed in typical projects for each program, our energy impact results for R-PACE appear to be reasonable.
During this time period, R-PACE participation rates were considerably higher than HUP and AHUP. A total of 5700 households participated in HUP in these 12 months and 3500 in AHUP. In contrast, R-PACE programs had approximately 60,000 participants, of which we estimate that approximately 43,000 installed energy efficiency measures. Therefore, in aggregate, total savings from energy efficiency measures in R-PACE households in California during this time are higher than from HUP and AHUP programs.
4.3. Program-Level Impacts
Table 6 summarizes our estimates of total California R-PACE program impacts through 2019. We estimate normal year savings of 35 GWh and 2.3 million therms for projects that installed energy efficiency measures, and total savings of 0.7 TWh and 44 million therms over the full lifetimes of these efficiency projects. Savings are greater for projects with measures in multiple measure categories and in areas of the state with high space conditioning demand. We estimate the projects installing solar PV (including those with EE measures as well) reduce grid electricity consumption by 473 GWh annually and 9 TWh over the full project lifetimes, with very small impacts on gas consumption. Across all R-PACE projects implemented through the end of 2019, we estimate first year reductions of 506 GWh of grid electricity consumption and 2 million therms of gas consumption, and lifetime reductions of 9.6 TWh and 37 million therms, respectively. The reduction in grid-tied electricity consumption is electricity equivalent to the electricity consumption of approximately 74,000 California households, and the gas savings are equivalent to the gas consumption of approximately 4700 California households.
Table 6.
Estimated R-PACE program first-year and lifetime savings.
4.4. Adoption of Energy Efficiency Equipment and Solar PV in Financing Programs
Our study also provides some insight on customer choices and contractor preferences regarding combinations of higher-efficiency equipment, envelope measures and solar PV in California residences. R-PACE provides opportunities for service providers to bundle various demand-side strategies as part of a comprehensive service offering to customers. However, only approximately 5% of the households in our study chose to combine energy efficiency measures and solar PV. It appears that most contractors focus on providing various types of energy efficiency services distinctly from installing solar PV systems rather than bundling higher-efficiency technologies and solar PV. Homeowner decisions to replace existing HVAC and water heating equipment are often driven by equipment failure or the end of useful service lifetime while decisions to install new windows, doors, and envelope measures may be more linked to home remodeling projects; this may account for the challenges of scaling up a home performance contractor market in the U.S. that offers comprehensive efficiency and solar PV packages.
4.5. NMEC at Scale
Our analysis demonstrates the power of NMEC methods at scale. These methods have the immediate virtue that they are ex post—based on actual consumption rather than ex ante engineering estimates. The building-level estimates we generate allow thorough parsing of the impacts—by measure category, climate zone, and utility jurisdiction. Results generated by this parsing in our dataset are quite reasonable. Moreover, while household-level NMEC results can be uncertain, aggregating results across large numbers of households yields precise estimates of collective energy impacts. NMEC methods are being increasingly used for program impact evaluation, and we believe this analysis demonstrates their power for these applications.
NMEC methods do have limitations. They generally do not account for other changes in the household that occur in the baseline or reporting periods. For example, we cannot observe changes in occupancy; if one or more people move into or out of the household during the period of observation, this may influence estimates of electricity and/or gas savings. Control groups can account for both of these issues to some extent by differencing out any factors that would be expected to equally affect R-PACE and similar non-program households. We have no reason to believe that occupancy changes would vary systematically between R-PACE and comparison households, thus our comparison groups likely resolves any issues with occupancy changes. In another case, if a homeowner adds floor area as part of an addition at the same time as a small R-PACE energy efficiency project, we will likely estimate an increase in usage even if the project reduced usage on its own. Such impacts—those that specifically tend to be associated with undertaking the energy project—are harder to handle with control groups, and we do not attempt to do so here.
The lack of detailed project data can limit the interpretation of energy impacts. We do not have data on the existing building and equipment stock or the condition of existing equipment in R-PACE households prior to the R-PACE projects. The likely presence of many installations of new equipment (rather than replacement of existing equipment) is one clear case where the baseline HVAC equipment prior to the project makes a critical difference in our interpretation of the savings results. Ultimately, these issues could be addressed in more data-rich environment.
Finally, NMEC methods cannot address the attribution of energy impacts to programmatic interventions. We estimate the energy impacts from R-PACE projects, but cannot determine whether the presence of R-PACE financing caused the projects to happen. Presumably, some households would have pursued similar projects absent R-PACE. These projects could have been more or less energy efficient than the ones we analyze. However, several analyses of R-PACE and solar PV have shown that the presence of R-PACE has been associated with greater PV deployment. Deason and Murphy (2018) [9] discuss this issue further, including considerations for extending this result to energy efficiency.
5. Conclusions
We implement NMEC methods at significant scale to provide the first energy impact estimates for an R-PACE program. Despite the considerable variation in non-project drivers of residential energy use, NMEC in this application is capable of delivering detailed information about project performance. We find moderate electricity and gas savings from R-PACE energy efficiency projects in California. Our results are sensible when broken down by type of measure, utility jurisdiction, and climate zone (see, e.g., Figure 1 and Figure 2). In the context of California’s mild climate and R-PACE’s focus on space-conditioning projects, the savings are reasonable. California’s mild climate limits the savings attainable by R-PACE energy efficiency projects—which mostly affect space conditioning and not other end uses—in both absolute and percentage terms. In other parts of the country, savings from projects that installed similar types of efficiency measures would likely be larger in both absolute and percentage terms. R-PACE programs in Florida have achieved significant scale, and a study of these programs using similar methods would help understand impacts in a different climate.
Given our sensible results, the increased prevalence of NMEC methods in program evaluation and performance appraisal seems warranted. Further work on assessing energy efficiency and other demand-side programs using similar methods could enrich understanding of program impacts. For example, Murphy and Deason (2021) [29] use NMEC methods on the same dataset studied here to estimate time-of-day impacts of R-PACE energy efficiency projects. These projects provide extra value to the grid due to the timing of their impacts, largely because the savings they provide are concentrated in peak hours.
R-PACE programs finance installation of new HVAC units as well as replacement of existing units with higher-efficiency equipment. We develop an approximate algorithmic method for identifying these projects, and our analysis suggests that savings are higher if these projects are set aside. These types of data gaps on measures—particularly on pre-project measures—are common in programmatic data. Our simple algorithm is a first step towards addressing these issues, but we could imagine considerable additional work on this front.
While we neither consider the cost-effectiveness of R-PACE projects from a societal or participant perspective nor assess the consumer protection issues associated with R-PACE, our analysis demonstrates the significant scale of R-PACE program impacts on energy usage in California.
Author Contributions
Conceptualization, J.D., S.M. and C.A.G.; Methodology, J.D., S.M. and C.A.G.; Software, S.M.; Validation, S.M. and J.D.; Formal Analysis, S.M.; Investigation, J.D. and S.M.; Resources, J.D.; Data Curation, S.M.; Writing—Original Draft Preparation, J.D., S.M. and C.A.G.; Writing—Review and Editing, J.D., S.M. and C.A.G.; Visualization, S.M.; Supervision, J.D.; Project Administration, J.D.; Funding Acquisition, J.D. All authors have read and agreed to the published version of the manuscript.
Funding
This work described in this study was funded by the U.S. Department of Energy’s Building Technologies Office under Lawrence Berkeley National Laboratory Contract No. DE-AC02-05CH11231.
Institutional Review Board Statement
The study was conducted according to the guidelines of the Declaration of Helsinki, and approved by the Institutional Review Board of Lawrence Berkeley National Laboratory (protocol code 369H001, approved on 7 October 2017).
Informed Consent Statement
Consent was waived as only pre-collected data were used for this study.
Data Availability Statement
Project and electricity usage data were acquired under non-disclosure agreements with program providers and California electric utilities and are not available for request.
Acknowledgments
The authors thank Joan Glickman (DOE), Steve Dunn (DOE), and Commissioner Andrew McAlister (California Energy Commission) for their support of this project, as well as the R-PACE program administrators and California investor-owned utilities for furnishing data. All opinions, errors, and omissions remain the responsibility of the authors. All reference URLs were accurate as of the date of publication.
Conflicts of Interest
The authors declare no conflict of interest.
Appendix A. Data Quality Screening and Sample Size Attrition
In this appendix, we provide additional detail on the electricity and gas usage data we received from Pacific Gas and Electric (PG&E), Southern California Edison (SCE), and Southern California Gas (SCG) and the steps we took to clean those data. We also document how the size of our sample changes through different stages of our analysis.
Electricity and gas usage data format
The energy usage data that we received differed in a number of respects across utilities and fuels:
- The temporal resolution of the data ranged from every 15 min (SCE) to hourly (PG&E electric, SDG&E electric, SCG) to daily (PG&E gas) to monthly (SDG&E gas).
- We received account-level data from some utilities and premise-level data from others. Whereas accounts identify the customer paying for a given fuel at a given premise, the premise identifies the location where accounts exist. We chose to conduct a premise-level analysis. As houses change occupancy, so do utility accounts, so an account-level analysis would have introduced breaks in metering time series and further restricted the number of households in our analysis. Moreover, the installed measures may influence energy usage even after a change in occupancy. Our use of a comparison group also helps guard against misinterpreting occupancy effects as project effects: comparison households may also have experienced occupancy-related impacts, and we would expect such occupancy-related impacts in the R-PACE group to be offset by similar impacts in the comparison group.
- Daily gas data collected from PG&E strongly suggest that their meters only log usage in increments of approximately one therm (e.g., 1.03 therm). During periods of limited gas use—for example, in the summer for many households—it was common to observe several days of zero consumption in the daily gas usage data, followed by a day of, for example, 1.03 therms, followed by several days with more zeros, followed by another 1.03 therms. This surely reflects the utility’s data collection process rather than actual customer usage. This pattern in PG&E gas usage has implications for the quality of our weather model fits. We did not observe this pattern in any of the electric data, nor in the hourly SCG or monthly SDG&E gas data.
- All utilities’ data contained occasional data gaps, where no usage was recorded for a given time period. In some cases, consecutive days or weeks of the metering time series were missing entirely. These gaps occur at differing frequency across utilities, meaning that the proportion of accounts failing our data sufficiency checks varied by utility.
- Some premises, particularly those at the beginning or end of our study period, did not have the full year of pre-project or post-project energy usage data from utilities necessary to estimate savings. This led us to drop those premises from the analysis (see the following section on Data cleaning for details). The share of premises affected by this issue varied across utilities. In particular, we could not estimate impacts for many of the earliest R-PACE assessments, which were concentrated in PG&E service territory. However, as project volumes were much lower in the early years, this represents only a small fraction of all R-PACE projects.
- The electric IOUs provided solar generation in different formats. PG&E provided hourly customer load, net of PV generation, whereas SCE and SDG&E provided hourly solar generation and customer consumption as separate readings. We collapsed these generation and delivery readings into a net consumption value that mirrored the PG&E structure and met the data requirements of our energy usage analysis model.
Data cleaning
We took steps to ensure that we had a robust time series of energy usage data to use in model estimation. We followed energy data cleaning recommendations made by CalTRACK, and also consulted Uniform Methods Project recommendations (Agnew and Goldberg 2017). We applied the following screens to the electricity and gas metering data:
- Checking for energy data sufficiency. We excluded from the analysis any meter that was missing 10% or more of the meter data in any month of the analysis period. We also removed meters whose metering data did not span the baseline and reporting periods. For most utilities and fuels, relatively few meters failed this check. However, in two cases (PG&E electric and SCG gas), we lost substantial shares of our meters.
- Removing projects with multiple reads. We removed any household that had meter reads with the same time stamp but different usage readings. This affected fewer than 500 m (0.3% of the full dataset), almost all of them electric.
- Removing duplicated data. Some meter data contained duplicated readings—the same usage and time stamp appearing multiple times in the usage time series. We removed the duplicated readings so that a premise only had one reading per time stamp (e.g., each hour or day, depending on the dataset).
Sample size attrition
Figure A1 and Figure A2 present the change in R-PACE household sample size through the various stages of dataset merges and data quality screens for electric and gas meters, respectively. We began with assessment information on more than 120,000 PACE projects obtained from CAEATFA. Of those, we were able to connect 66% to project measures provided to us by PACE program administrators and to addresses accessed through a dataset from Zillow (see second column in Figure A1 and Figure A2: CAEATFA, addresses and measures). Our sample of projects was then reduced by approximately 10% (see third column in Figure A1 and Figure A2: Date Assignment and Screen) because some solar PV installations had no interconnection dates in Tracking the Sun, a database of PV installations developed by Berkeley Lab [16]. We dropped these solar PV projects out of concern that their measure mix may have been mischaracterized.
Our electric and gas samples then diverged as we connected the project data to utility account datasets, leaving us with approximately 52,000 electric meters and 59,000 gas meters for analysis (see fourth column in Figure A1 and Figure A2: Sample for Analysis). We lose more electric meters than gas meters because a number of R-PACE project households are served by municipal electric utilities whose energy usage data we could not access. Data quality screens on temperature (see Section 2.4) and meter data sufficiency caused us to remove more than one-quarter of remaining electric meters and more than 60% of remaining gas meters (see columns 5 through 7 in Figure A1 and Figure A2).
Our assignment of meters for comparison households reduced the sample size for R-PACE households further, as some R-PACE households lacked a suitable comparison household that passed these same data screens (see column 9 in Figure A1 and Figure A2: No Matching Comparison Household). Of these matched pairs, we then excluded any meter from a household that had pre-existing solar or baseline period CVRMSE less than 0 or greater than 1 (see column 10 in Figure A1 and Figure A2: Baseline CVRMSE or Pre-existing Solar). We exclude households with pre-existing solar because the presence of solar greatly distorts the relationship of electricity usage with temperature.
Given that weather adjustment is core to the PRISM and TOWT modeling methodology, we implement a screen for the quality of that fit. We base that screen on the coefficient of variation of the root mean squared error (CVRMSE) of the baseline model weather fit for each household. We follow the CalTRACK recommendation for a CVRMSE value between 0 and 1 in a portfolio setting. In our reported results, we exclude all meters whose baseline CVRMSE is outside this range. This restriction excludes approximately 1% of households, relative to the full dataset. It has very little impact on our electricity estimates, but has a somewhat larger effect on our gas estimates. Details on the sensitivity of the results to this CVRMSE screen and statistics on the CVRMSE and other goodness of fit measurements (R2 and normalized mean bias error) are available upon request.
Our final sample includes approximately 25,500 electric meters and nearly 16,000 gas meters.
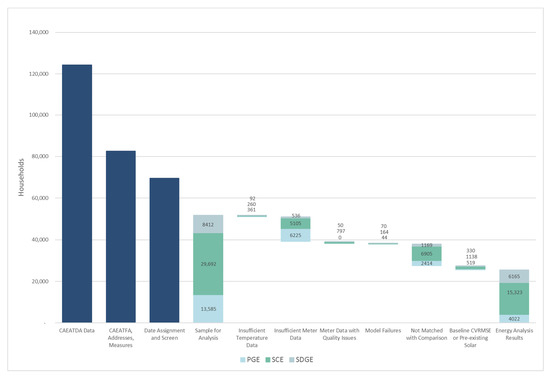
Figure A1.
Electric sample attrition.
Figure A1.
Electric sample attrition.

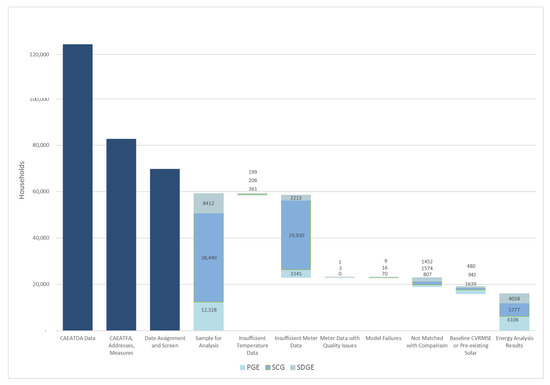
Figure A2.
Gas sample attrition.
Figure A2.
Gas sample attrition.
References
- International Energy Agency. Promoting Energy Efficiency Investments: Case Studies in the Residential Sector. 2008. Available online: https://globalabc.org/sites/default/files/2020-05/PROMOTING%20ENERGY%20EFFICIENCY%20INVESTMENTS-%20CASE%20STUDIES%20IN%20THE%20RESIDENTIAL%20SECTOR.pdf (accessed on 21 September 2021).
- Jaffe, A.B.; Stavins, R.N. The Energy Paradox and the Diffusion of Conservation Technology. Resour. Energy Econ. 1994, 16, 91–122. [Google Scholar] [CrossRef]
- Goldman, C.; Murphy, S.; Hoffman, I.; Mims-Frick, N.; Leventis, G.; Schwartz, L. What does the future hold for utility electricity efficiency programs. Electr. J. 2020, 33, 106728. [Google Scholar] [CrossRef]
- Kramer, C.; Fadrhonc, E.M.; Goldman, C.A.; Schiller, S.R.; Schwartz, L.C. Making It Count: Understanding the Value of Energy Efficiency Financing Programs Funded by Utility Customers. State and Local Energy Efficiency Action Network (SEE Action). 2015. Available online: https://emp.lbl.gov/publications/making-it-count-understanding-value (accessed on 1 September 2021).
- PACENation. PACE Facts. 2020. Available online: https://pacenation.org/wp-content/uploads/2020/04/PACE-Facts-4-24-20.pdf (accessed on 1 September 2021).
- Deason, J.; Leventis, G.; Goldman, C.A.; Carvallo, J.P. Energy Efficiency Program Financing: Where It Comes from, Where It Goes, and How It Gets There (LBNL-1005754). Lawrence Berkeley National Laboratory. 2016. Available online: https://emp.lbl.gov/publications/energy-efficiency-program-financing (accessed on 1 September 2021).
- Kirkpatrick, A.J.; Bennear, L.S. Promoting clean energy investment: An empirical analysis of property assessed clean energy. J. Environ. Econ. Manag. 2014, 68, 357–375. [Google Scholar] [CrossRef]
- Ameli, N.; Pisu, M.; Kammen, D.M. Can the US keep the PACE? A natural experiment in accelerating the growth of solar electricity. Appl. Energy 2017, 191, 163–169. [Google Scholar] [CrossRef] [Green Version]
- Deason, J.; Murphy, S. Assessing the PACE of California Residential Solar Deployment: Impacts of Property Assessed Clean Energy Programs on Residential Solar Photovoltaic Deployment in California, 2010–2015 (LBNL-2001143). Lawrence Berkeley National Laboratory. 2018. Available online: https://emp.lbl.gov/publications/assessing-pace-california-residential (accessed on 1 September 2021).
- Winecroff, R.; Graff, M. Innovation in Financing Energy-Efficient and Renewable Energy Upgrades: An Evaluation of Property-Assessed Clean Energy for California Residences. Soc. Sci. Q. 2021, 101, 2555–2573. [Google Scholar] [CrossRef]
- Goodman, L.S.; Zhu, J. PACE Loans: Does Sale Value Reflect Improvements? JSF 2016, 21, 6–14. Available online: https://www.pacenation.org/wp-content/uploads/2016/10/JSF_Winter_2016_PACENation.pdf (accessed on 1 September 2021). [CrossRef]
- Rose, A.; Wei, D. Impact of the Property Assessed Clean Energy (PACE) program on the economy of California. Energy Policy 2020, 137, 111087. [Google Scholar] [CrossRef]
- Oliphant, Z.; Culhane, T.; Haldar, P. Public Impacts of Florida’s Property Assessed Clean Energy (PACE) Program. Patel College of Global Sustainability, University of South Florida. 2020. Available online: https://www.usf.edu/pcgs/documents/pace.pdf (accessed on 1 September 2021).
- Horkitz, K.; McGuckin, P.; James, L.; Frye, C.; Ratcliffe, H. HERO Program Profile (CALMAC ID: PGE0388.01). The Cadmus Group, Inc. 2016. Available online: http://www.calmac.org/publications/HERO_Program_Study_Final_Report.pdf (accessed on 1 September 2021).
- Stewart, J.; Bernath, A.; Frye, C.; McGuckin, P.; James, L. HERO Program Savings Allocation Methodology Study (CALMAC ID: PGE0388.02). The Cadmus Group, Inc. 2016. Available online: http://www.calmac.org/publications/HERO_Allocation_Method_Study_Final_Report.pdf (accessed on 1 September 2021).
- Barbose, G.L.; Darghouth, N.R.; LaCommare, K.H.; Millstein, D.; Rand, J. Tracking the Sun: Installed Price Trends for Distributed Photovoltaic Systems in the United States—2018 Edition. Lawrence Berkeley National Laboratory. 2018. Available online: https://emp.lbl.gov/publications/tracking-sun-installed-price-trends (accessed on 1 September 2021).
- NCDC. Integrated Surface Database (ISD). Accessed through Eeweather 2019. Available online: https://github.com/openeemeter/eeweather (accessed on 1 September 2021).
- NREL. Typical Meteorological Year 3. Accessed through Eeweather 2019. Available online: https://github.com/openeemeter/eeweather (accessed on 1 September 2021).
- Fels, M.F. PRISM: An introduction. Energy Build. 1986, 9, 5–18. [Google Scholar] [CrossRef]
- Price, P.N.; Mathieu, J.L.; Kiliccote, S.; Piette, M.A. Using Whole-Building Electric Load Data in Continuous or Retro-Commissioning (LBNL-5057E). Lawrence Berkeley National Laboratory. 2011. Available online: https://eta-publications.lbl.gov/sites/default/files/lbnl-5057e.pdf (accessed on 1 September 2021).
- Agnew, K.; Goldberg, M. Chapter 8: Whole-Building Retrofit with Consumption Data Analysis Evaluation Protocol (NREL/SR-7A40-68564). National Renewable Energy Laboratory. 2017. Available online: https://www.nrel.gov/docs/fy17osti/68564.pdf (accessed on 1 September 2021).
- Reddy, T.A.; Claridge, D.E. Uncertainty of ‘measured’ energy savings from statistical baseline models. ASHRAE Trans. 2000, 106, 3–20. Available online: https://asu.pure.elsevier.com/en/publications/uncertainty-of-measured-energy-savings-from-statistical-baseline--2 (accessed on 1 September 2021). [CrossRef]
- Granderson, J.; Gruendling, P.; Torok, C.; Jacobs, P.C.; Gandhi, N. Site-Level NMEC Technical Guidance: Program M&V Plans Utilizing Normalized Metered Energy Consumption Savings Estimation. Lawrence Berkeley National Laboratory. 2019. Available online: https://www.cpuc.ca.gov/-/media/cpuc-website/files/legacyfiles/l/6442463695-lbnl-nmec-techguidance-01072020.pdf (accessed on 1 September 2021).
- Palmgren, C.; Stevens, N.; Goldberg, M.; Barnes, R.; Rothkin, K. 2009 California Residential Appliance Saturation Study [CEC-200-2010-004-ES]. California Energy Commission. 2010. Available online: https://planning.lacity.org/eir/CrossroadsHwd/deir/files/references/C18.pdf (accessed on 1 September 2021).
- Energy Information Administration (EIA). Residential Energy Consumption Survey. Table HC1.11 Fuels Used and End Uses in Homes in West Region, Divisions, and States, 2009. Energy Information Administration (EIA). 2013. Available online: https://www.eia.gov/consumption/residential/data/2009/hc/hc1.11.xls (accessed on 1 September 2021).
- Energy Information Administration (EIA). Residential Energy Consumption Survey. Table CE 4.5 Household Site End-Use Consumption by Fuel in West Region, Totals 2009. 2013. Available online: https://www.eia.gov/consumption/residential/data/2009/c&e/ce4.5.xlsx (accessed on 1 September 2021).
- Energy Information Administration (EIA). Residential Energy Consumption Survey. Table CE4.1 Household Site End-Use Consumption by Fuel in the U.S, Totals 2009. Energy Information Administration (EIA). 2013. Available online: https://www.eia.gov/consumption/residential/data/2009/c&e/ce4.1.xlsx (accessed on 1 September 2021).
- DNV GL. Impact Evaluation Report Home Upgrade Program—Residential Program Year 2017 (CALMAC ID: CPU0191.01). 2019. Available online: http://www.calmac.org/publications/CPUC_GroupA_Res_PY2017_HUP_toCALMAC.pdf (accessed on 1 September 2021).
- Murphy, S.; Deason, J. Timed to Save: The Added Value of Accounting for Hourly Incidence of Electricity Savings from Residential Space Conditioning Measures. Energy Effic. 2021, 14, 82. [Google Scholar] [CrossRef]

Publisher’s Note: MDPI stays neutral with regard to jurisdictional claims in published maps and institutional affiliations. |
© 2021 by the authors. Licensee MDPI, Basel, Switzerland. This article is an open access article distributed under the terms and conditions of the Creative Commons Attribution (CC BY) license (https://creativecommons.org/licenses/by/4.0/).