Article

Development of an Integrated Performance Design Platform for Residential Buildings Based on Climate Adaptability

1
School of Design and Architecture, Zhejiang University of Technology, Hangzhou 310023, China
2
Solearth Architecture Research Center, Building Information Technology Innovation Laboratory (BITI Lab), Hong Kong 999077, China
3
Faculty of Design, Architecture and Building, University of Technology Sydney, Sydney 2007, Australia
*
Author to whom correspondence should be addressed.
Energies 2021, 14(24), 8223; https://doi.org/10.3390/en14248223
Submission received: 18 November 2021 / Revised: 28 November 2021 / Accepted: 2 December 2021 / Published: 7 December 2021

Abstract

:
Building energy waste has become one of the major challenges confronting the world today, so specifications and targets for building energy efficiency have been put forward in countries around the world in recent years. The schematic design stage matters a lot for building energy efficiency, while most architects nowadays are less likely to make energy efficiency design decisions in this stage due to the lack of necessary means and methods for analysis. An integrated multi-objective multivariate framework for optimization analysis is proposed for the schematic design stage in the paper. Here, the design parameters of the building morphology and the design parameters of the building envelope are integrated for analysis, and an integrated performance prediction model is established for low-rise and medium-rise residential buildings. Then, a comparison of the performance indicators of low-rise and medium-rise residential buildings under five typical urban climatic conditions is carried out, and the change patterns of the lighting environment, thermal environment, building energy demand, and life cycle cost of residential buildings in each city under different morphological parameters and design parameters of the building envelope are summarized. Specific analysis methods and practical tools are provided in the study for architectural design to ensure thermal comfort, lighting comfort, low energy consumption, and low life-cycle cost requirement, and this design method can inspire and guide the climate adaptation analysis and design process of low-rise and medium-rise residential buildings in China, improve architects’ perception of energy-saving design principles of low-rise and medium-rise residential buildings on the ontological level, as well as provide them with a method to follow and a case to follow in the actual design process.

1. Introduction

1.1. Global Context

With the development of industrialization in various countries in the world, environmental problems have become increasingly prominent. Since the mid to late 20th century, countries in the world have successively proposed to reduce their dependence on fossil fuels in the process of economic development in order to alleviate climate change. In the field of construction, various countries have successively established green building associations and proposed evaluation standard systems for green buildings, such as Leadership in Energy and Environmental Design (LEED), Building Research Establishment Environmental Assessment Method (BREEAM), and National Australian Building Environmental Rating System (NABERS), etc.
As China’s economy advances quickly and urban population becomes highly concentrated, the number of urban residential buildings has seen a rise, increasing energy consumption. According to statistics, China’s urbanization rate increased from 37.7% in 2001 to 59.6%, and the urban population increased from 155 million to 299 million in 2001 [1]. Rapid urbanization facilitates the advancement of construction industry and drives the growth of energy demand, especially the electricity demand. Since 2001, a construction area of over 1.5 billion square meters has been newly added each year, and 75% of these new buildings are residential buildings, which are used to accommodate the growing urban population [2]. Energy-efficient building design decisions in the schematic design stage largely determine the direction of the subsequent design process. However, most architects now, due to their failure to find analysis methods for building performance and lack of software exercising, are less likely to make design decisions from an energy-efficiency perspective in the schematic design process. Energy-efficiency design is still a concept under the framework of traditional architecture, and most design methods are adopted without quantitative and scientific judging criteria for energy efficiency buildings, thus gradually marginalizing the function of architects in the field of low-energy building design.

1.2. Literature Review

Currently, quite a lot of studies have been conducted on energy-efficient building design study using multi-objective building performance simulation and optimization. Alsousi et al. [3], who conducted a similar study of the area of Gaza, investigated 12 high-rise dwellings in terms of thermal comfort and energy consumption. The researchers finally found that most air-conditioning energy consumption of buildings in summer is caused by the huge heat generated from walls, windows, and roofs. In addition, residents, daily living facilities, and air infiltration will also increase the energy consumption of the building, but it has a relatively small impact on the thermal performance of the environment and the comfort of the residents. Enedri et al. [4] examined the thermal performance of multi-storey residential buildings in southern Brazil. They recorded the thermal performance of eight bedrooms on two floors and in four directions. Different variables were used in the study to check various factors, such as the surface color, window shadows, and the thermal properties of walls and windows. Finally, it was concluded that the heat transfer coefficient of the envelope structure and the area of the building facade have the greatest impact on the maximum temperature, which need to be minimized to improve the indoor thermal environment in summer. Separately, the two variables, heat capacity and heat lag, have the strongest correlation with the lowest temperature, so they should be maximized to improve the thermal environment comfort in winter. Karyono et al. [5] investigated the energy consumption and thermal comfort of buildings in Jakarta, Indonesia. Seven multi-storey buildings with different cooling systems were surveyed, and different variables that may affect human comfort, such as age, gender, and health status, were collected in this study, but the final results showed that thermal comfort is less likely to be affected by age, background, and other population differences. He also concluded that windows without protection measures are more likely to cause excessive energy consumption in buildings, and higher building energy consumption is also needed in thin walls to maintain a certain degree of indoor thermal comfort. Meanwhile, the study emphasizes the importance of the design phase for building energy efficiency due to its major role in reducing solar heat gain. In order to minimize energy consumption, buildings must be designed according to the local climate.
The impact of climate change on the building sector has also attracted mounting attention of many scholars in related fields. A number of studies have investigated the energy demand trends of buildings in different locations throughout the world. Jürgen schnieders et al. [6] adopted the same typical analysis model to analyze and compare the design strategies of passive housing, including envelope design, air tightness, operation of cooling coil, heat recovery equipment, and supply air temperature, etc. Citing examples of Yeka-Tlinburg, Tokyo, Shanghai, Las Vegas, Abu Dhabi, and Singapore, they proposed the corresponding design guidelines for passive buildings. Fabrizio Ascione et al. [7] used Matlab, EnergyPlus, and genetic algorithm to compare the multi-objective optimization of residential buildings in typical cities in different climates in Italy, and obtained the envelope design strategy for each climate zone. Letizia Martinelli et al. [8] selected six Italian cities as representatives, including Aosta, Milan, Campobasso, Florence, Lecce, and Catania, based on the climate data of each city in the past 30 years. The influence of courtyard-type parameters, such as the ratio of height to width, on the humidity and thermal comfort of the courtyards of various cities in different climate zones was analyzed.
Some studies have also focused on the influence of climate change on building performance in different time periods. Additionally, Guan [9] summarized several different methods for future climate data generation, including extrapolation statistical methods, mandatory compensation methods, stochastic weather models, and climate models [10,11,12,13]. However, since the dry bulb temperature is the only consideration and other important factors, such as solar radiation and humidity, are ignored, this method has been criticized because of its inaccuracy [11,14]. In the UK, Belcher et al. [15] used the “morph” method to predict future meteorological data and assess to what extent the future climate will affect the energy consumption of buildings. Jentsch et al. [16,17] developed a climate file generation tool in Microsoft Excel called CCWorldWeatherGen. This tool also facilitates the climate prediction based on the “morph” method, but it can only predict future weather data in specific time periods, i.e., 2020s, 2050s, and 2080s. Sabunas and Kanapickas [18] used CCWorldWeatherGen tools and HEED software to study the impact of climate change on the performance of residential buildings in Lithuania, and concluded that the total energy consumption of buildings in the region will drop by 29.6% in 2080. Asimakopoulos [19] studied the heating and cooling demand of residential, office, and educational buildings under future climatic condition, reaching the conclusion that by 2100, under the IPCC A2 scenario, heating demand may drop by about 50%, while the cooling demand may increase by 248%.

1.3. Research Gap

From the literature review, it is crystal clear that current building climate-responsive design studies shows a trend of gradual deepening and refinement over time, transforming from traditional qualitative analysis to quantitative calculation based on building performance simulation. Moreover, the coupling research between factors has gradually increased, making the dimensions of analysis more diversified. The performance analysis based on building energy consumption as a single evaluation index has gradually changed to a multi-dimensional evaluation standard that considers the light environment, thermal environment, and wind environment comfort. In addition, thanks to the continuous development of computer technology, the amount of data for building performance simulation is also increasing. Based on performance simulation tools, some scholars have carried out building energy efficiency analysis under the conditions of climate data in different regions and different ages in order to evaluating building design parameters from multiple perspectives.
However, it can be found from the literature review that the existing studies have not referred to detailed analysis and comparison of performance evaluation indicators of multiple dimensions specifically for urban low-rise and medium-rise residential buildings based on different climate zones in China, as well as the establishment of a real-time feedback platform that can be used by laypersons to facilitate the design decision process on the basis of the simulation results of building performance under different climate conditions. In real projects, most of the architects, real estate developers, and decision makers of government consulting agencies who make design decisions have not received special training in building energy efficiency design. It is very difficult for them to master building performance simulation tools in a short period of time and make energy-efficient, comfortable, and appropriate design decisions based on local climatic conditions. Therefore, it is necessary to provide a friendly and easy-to-use building climate-responsive design platform for design decision makers who have not experienced building energy efficiency training. In this platform, design decision makers can obtain performance evaluation indicators in real time only by inputting corresponding design parameters, which can facilitate building climate-responsive design decisions.
As a result, form parameters and design parameters of the building envelope are integrated in this study for low-rise and medium-rise residential buildings under the climatic conditions of five Chinese cities. A performance analysis framework is established for lighting environmental comfort, thermal environmental comfort, building life cycle cost, and total building energy demand, and accordingly, a building performance analysis platform with real-time feedback is set up, thus ordinary users and designers, who are not trained in how to use software of professional building physics and environmental performance, have access to this platform, which facilitates the formation of energy design decisions for residential buildings.

2. Methods

Meteorological documents of five typical cities in China (as shown in Figure 1) are used in this study to compare the design parameters of building forms and building envelope of low-rise and medium-rise residential buildings according to the performance indicators of the objective function. A backward search is conducted to figure out the design parameter laws of the building form and envelope in five typical cities. The design parameters and objective functions, i.e., lighting environmental comfort, thermal environmental comfort, building energy demand, and building life cycle cost, are integrated in the study. A framework and a prediction model are established for multivariate multi-objective optimization.
This study is conducted mainly to construct an integrated analytical framework, as well as develop a prediction model. The multi-objective optimization method integrating different parts of the design parameters is shown in Figure 2, where an integrated optimization process can be divided into the following steps: (1) in the design project, the architect decomposes and screens the design elements of the project through the control over the site and the design specification, thus excluding the judged design constraints; (2) then, the basic design elements are divided on the basis of the spatial form design and the building envelope design. The screening of these sub-elements is launched based on the sensitivity analysis of a single design variable, and the screened design parameters are selected to play a part in the next level; (3) on the basis of the well-determined design parameters, the objective function is determined for the design objectives to ensure the rationality of the mathematical model, and the parameterization platforms (e.g., Grasshopper, Ladybug/Honeybee, and Colibri/Octopus) are adopted to build an integrated simulation and optimization process for building performance. When a large number of parameters are involved in the integrated simulation, the Monte Carlo method is adopted to extract random simulation sample data and build a prediction model, which is used to integrate multi-objective optimization algorithms, thus realizing the backward search of design parameters.

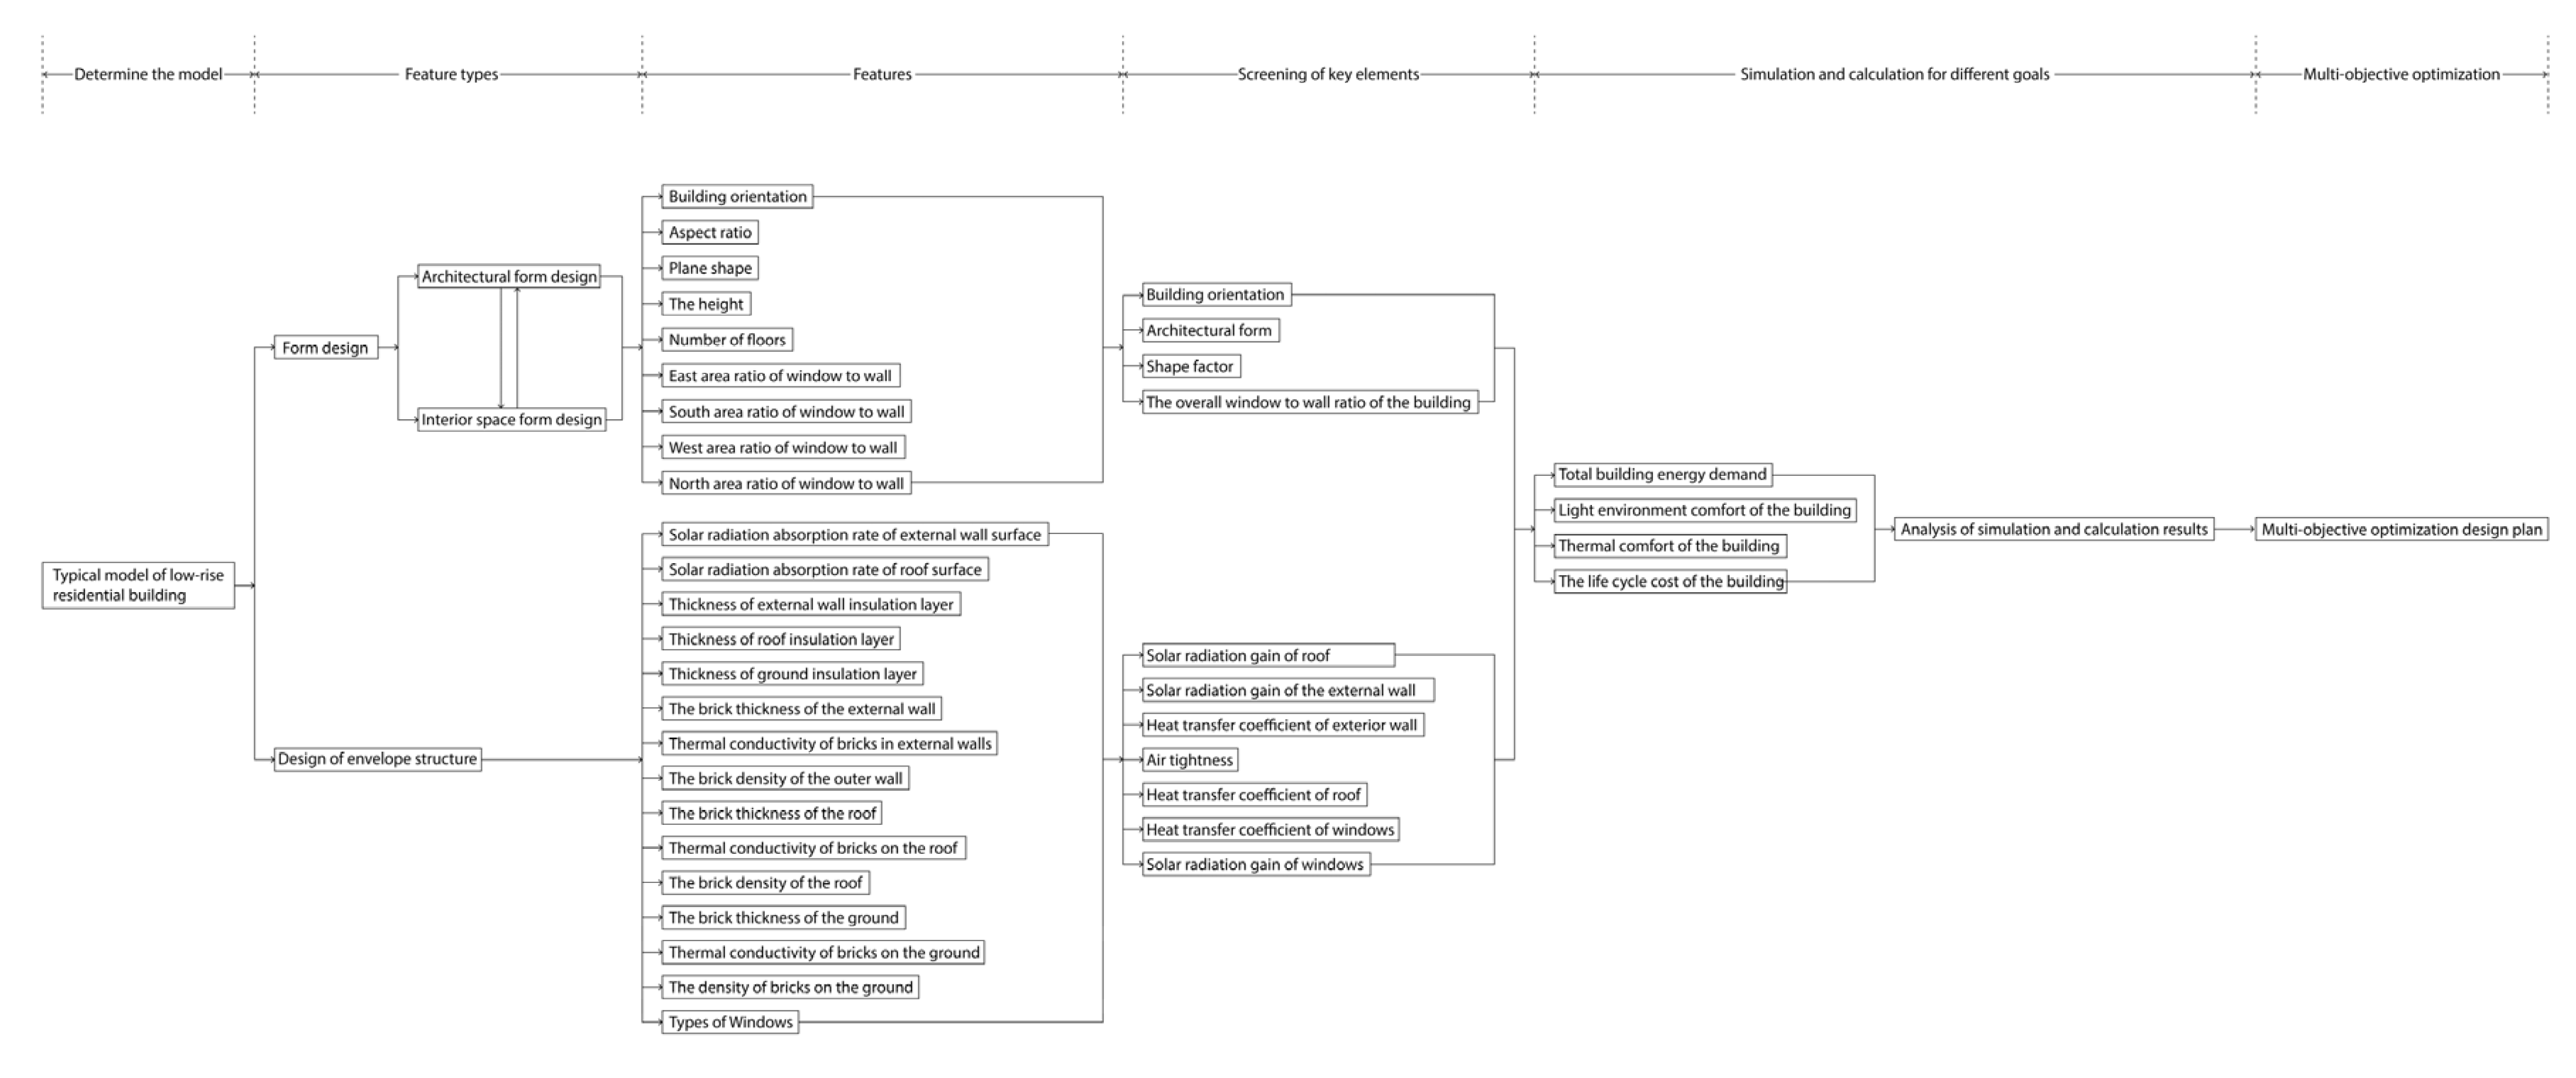
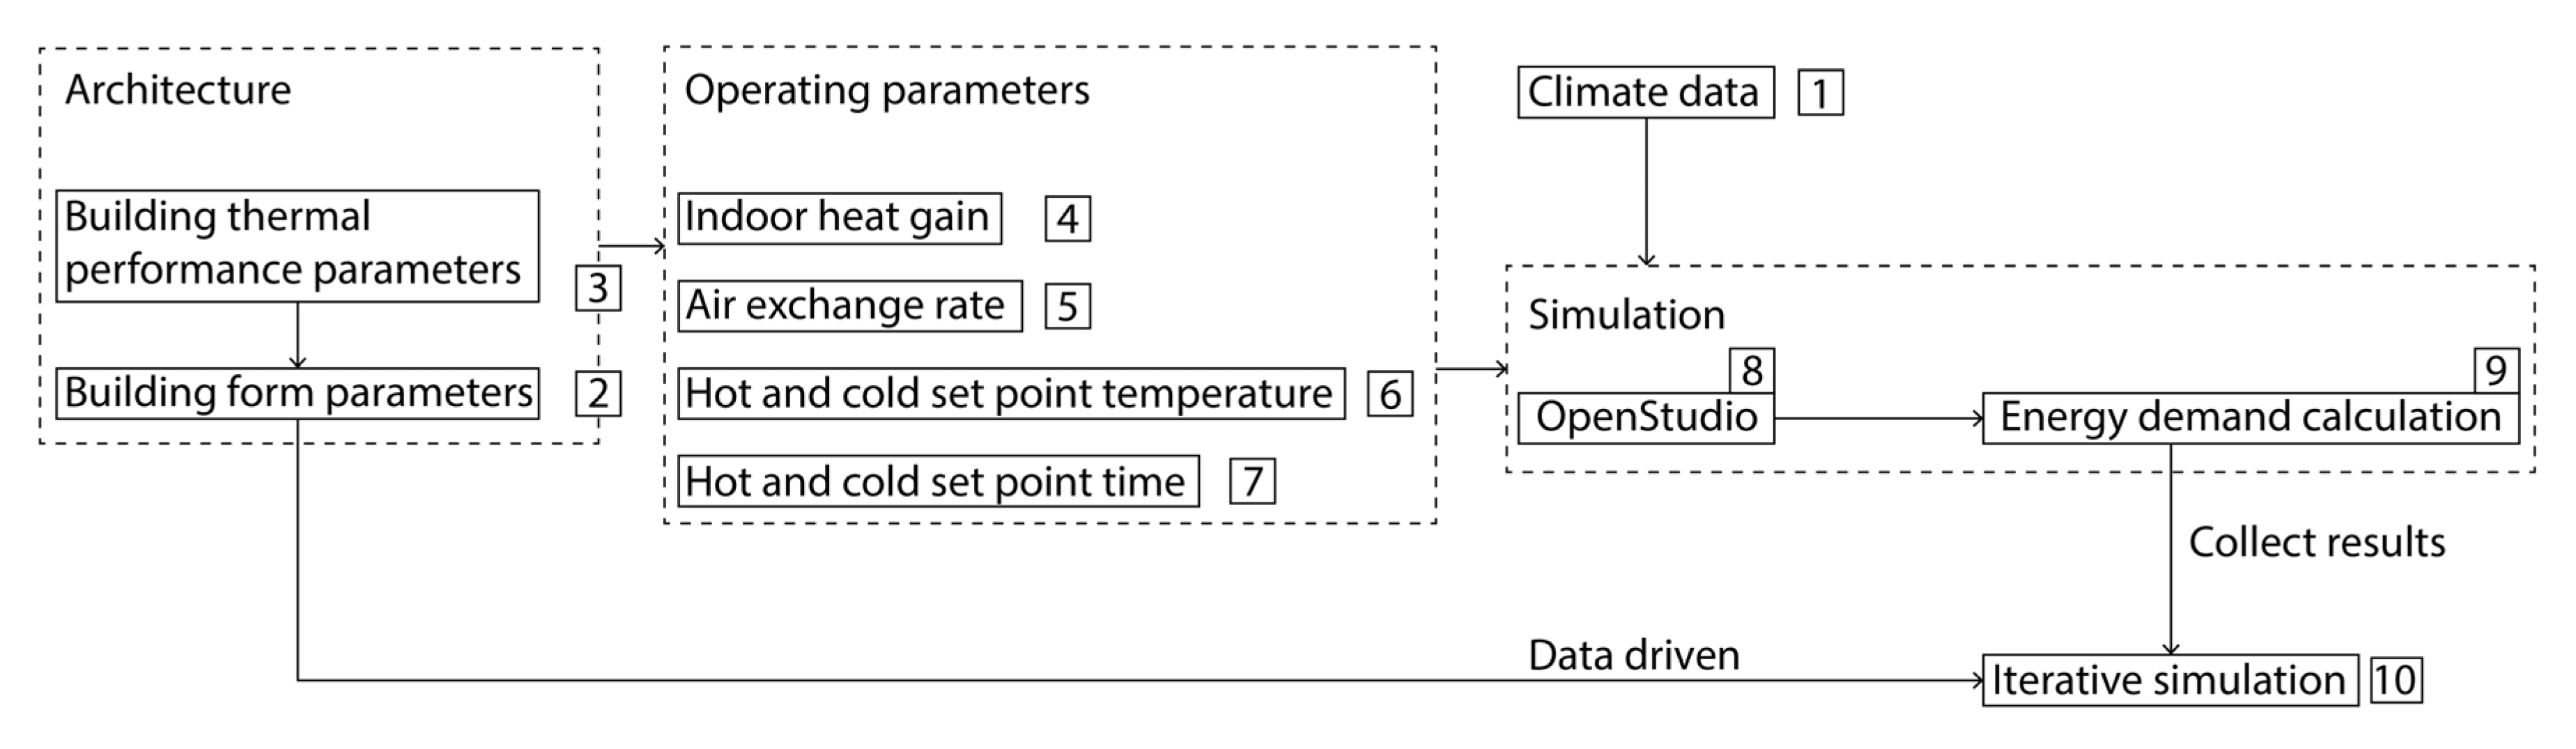
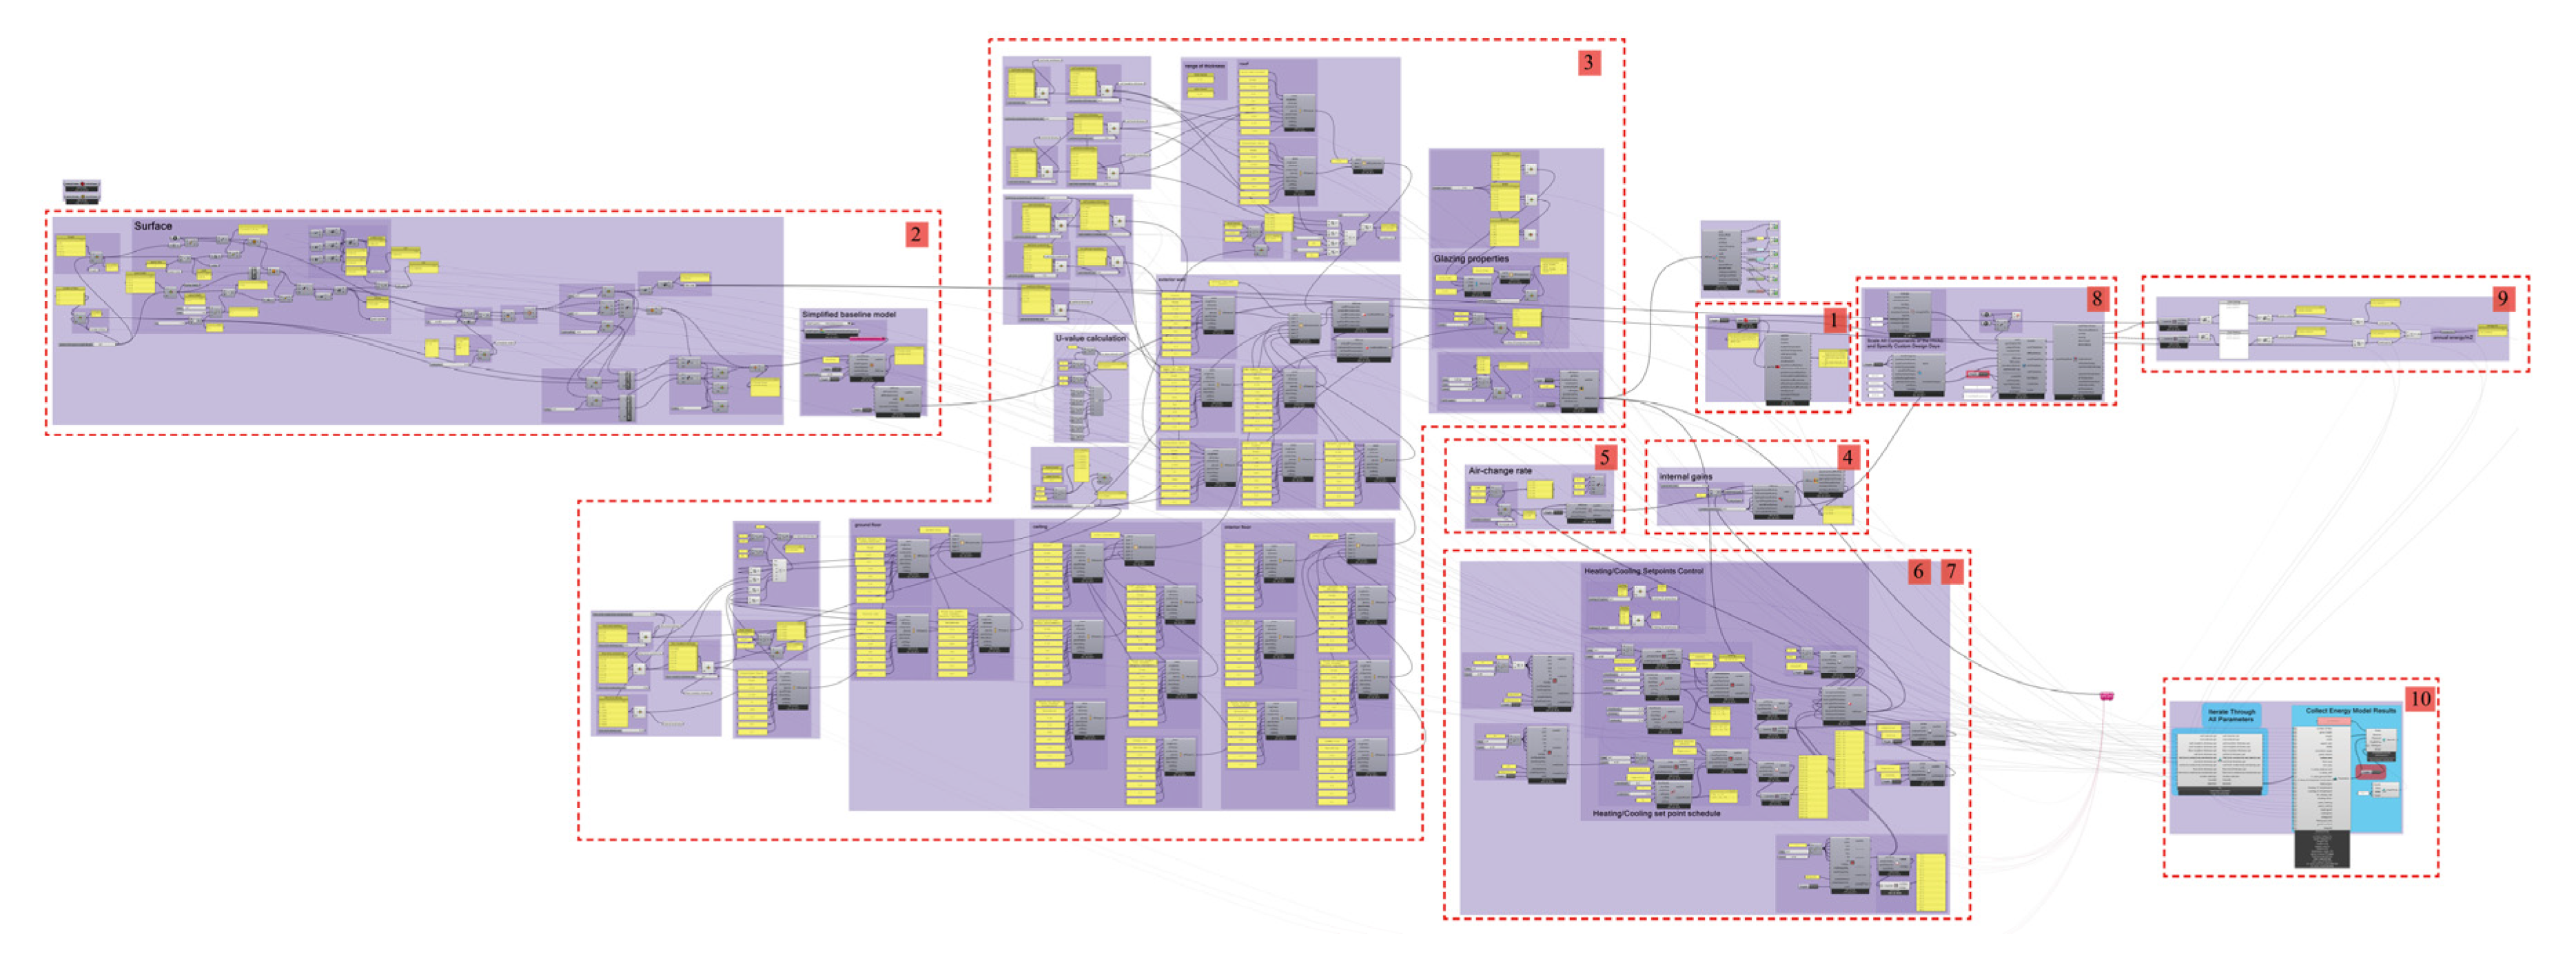
2.1. Parametric Performance Analysis

An analysis of the building environment and energy consumption modeling is conducted based on parametric platforms like Rhino/Grasshopper, with Ladybug and honeybee as plug-ins for environment analysis, as shown in Figure 3.
In Grasshopper, a parametric plug-in for the modeling software Rhinoceros 3D, a program, is created by simple dragging and dropping of the parametric command components onto the canvas, as well as the connection of the inputs and outputs of the different logical order components. Grasshopper, as a graphical algorithm editor, offers new ways to extend and control the process of 3D design and modeling. For example, in Grasshopper, a complex geometry is generated through mathematical functions, and a complex model is driven and rapidly changed based on environmental performance algorithms under predefined modeling logic [20,21].
Ladybug and Honeybee, as Grasshopper plug-ins, are free computer applications that support environmental design by connecting 3D computer-aided design (CAD) interfaces to software Daysim and Radiance used for the lighting environmental analysis, as well as to the validated simulation engine EnergyPlus. Daysim and Radiance [22] are widely used in the analysis and evaluation of the lighting environment of buildings to predict the lighting environment via simulation of the real physical environment. It is also used to comprehensively calculate the influence of direct light, diffused light, and reflected light on the ground on the natural lighting of the room in all weather including a sunny one, overcast one, cloudy one, and more in the whole year.
EnergyPlus, a building dynamic energy simulation software developed by the U.S. Department of Energy and Lawrence Berkeley National Laboratory based on the features and functions of BLAST and DOE-2.1E, is designed to provide integrated (load and system) simulations for accurate prediction of energy, temperature, and comfort. EnergyPlus, a tool widely used in most current building energy analysis studies, can be used to simulate heating, cooling, lighting, ventilation, and other energy flows and humidity in buildings, and it is particularly suitable for simulating dynamic behavior strongly influenced by thermal inertia [23]. EnergyPlus acts as a main simulation engine because it has an irreplaceable advantage over some other simulation software.

2.2. Setting of Performance Evaluation Objectives

The evaluation indicators for climate adaptability design of buildings include lighting environmental comfort and thermal environmental comfort, building energy consumption, and building life cycle cost. To facilitate the parametric modeling and analysis later, the theoretical basis of these four evaluation indicators is described and the relevant design influences are specified in this subsection.
(1)
lighting environment evaluation index
The lighting conditions inside buildings have become even more important due to COVID-19 restrictions, which led to online working and education becoming more popular. Some studies have considered lighting conditions in residential housing in different climate zones [24,25].
Table 1 and Table 2 summarize the pros and cons of static and dynamic building lighting environment analysis indicators. The static indicators include illumination, uniformity of illumination (U0), daylight factor (DF), Unified Glare Rating (UGR), and Scope of View. The static lighting environment evaluation index is simple, intuitive, and easy to calculate. It is suitable for index control under general conditions, but it cannot distinguish the differences in a lighting environment’s performance under the influence of different climatic factors, and it cannot distinguish the different types of buildings. Moreover, it is impossible to evaluate various technical measures, such as the auxiliary lighting system. The dynamic daylighting evaluation indicators including Daylight Autonomy (DA), Continuous Daylight Autonomy (DAcon), and Useful Daylight Illuminance (UDI), which take into account the characteristics of different climate zones. It takes one hour as the step length to reflect the annual illuminance level, which is close to the actual situation. The practicability of dynamic daylighting evaluation indicators is significantly better than that of static indicators. Such indicators not only consider the role of daylighting auxiliary systems, but also evaluate their advantages and disadvantages, thereby providing support for low-energy design [26].
This study uses the lighting environment evaluation index as one of the optimization objectives, and conducts a coupling analysis with the building’s annual cooling and heating demand. The dynamic daylighting evaluation index is more convenient to evaluate the design parameters from the time scale of the whole year, which is in line with the purpose of this study. Therefore, this study uses the Useful Daylight Illuminance (UDI) as the index of lighting environment optimization. The UDI indicator is mainly used to evaluate the dynamic lighting quality of indoor spaces, and takes into account the part where the actual illuminance of the indoor working surface exceeds the design illuminance at a certain time and may cause glare. This indicator expresses a range value. Within this range, the surface illumination level meets the requirements of indoor work. Nabil and Mardaljevic [27] proposed the effective illuminance range value in 2005: 100 lx < UDI < 2000 lx, below 100 lx indicates that the indoor working surface illuminance is seriously insufficient, and 2000 lx or more may cause glare, which will adversely affect the indoor light and heat environment. Therefore, the UDI of residential buildings should be divided into three intervals, namely, the annual percentage of 100 lx and below, 100–2000 lx, and 2000 lx and above to evaluate the indoor light environment quality.
(2)
The indicator of thermal environmental comfort
In the building, a system for heat exchange and heat transfer includes the forms of conduction, radiation, and convection upon the interaction of internal and external factors. It mainly includes indoor-outdoor heat exchange through the external building envelope, heat generated by sunlight coming in through windows, inner heat gain of building, and convection heat transfer generated due to air flow in various openings of the building [28,29,30,31,32].
It is found from a large number of studies that a significant regression correlation exists between the indoor thermal neutral temperature and the monthly average outdoor temperature. This phenomenon is described by the “black box” theory of automatic control. The input signal of the “black box” is the amount of physical stimulus that affects human thermal comfort, and the output signal of the “black box” is the thermal sensation of human comfort. The invisible elements in the “black box” involve variables influencing architectural design and human heat exchange, etc.
When people are exposed to a thermal environment, the body will respond under the effect of physiological adaptation. A thermal equilibrium will be established by the body’s thermoregulatory system within a certain range of environmental variables, and meanwhile, it can be expressed in thermal sensation. Fanger created a thermal comfort model based on this theory. When feeling uncomfortable in an environment, the user will adopt adaptive behaviors to gain thermal comfort. In this study, the adaptive model is used to assess the thermal comfort of the building.
(3)
The indicator of building energy demand
Heating, air conditioning and cooling, lighting and ventilation, and household appliances serve as sources of building energy consumption, which is generated through heat conduction, heat convection, and heat radiation between buildings and the environment. Building heating and air conditioning and cooling are the largest contributors to building energy consumption [33,34,35].
This study is optimized with a focus on the net building energy demand, which mainly refers to the energy required by indoor thermal environment control in line with the building specifications. The calculation of the net energy demand is determined by indoor and outdoor climatic conditions, and meanwhile, indoor heat gain, solar heat gain, and natural lighting, as well as heat loss due to the thermal properties of the building envelope (e.g., heat transfer and air infiltration), need to be taken into account.
The annual building energy demand is defined as the sum of the cooling and heating loads of all apartments. The energy demand generated by domestic hot water and electrical equipment is not calculated here. In this study, the HVAC system performance coefficient is assumed to be 1, so the energy demand can be extracted directly from the simulation result of EnergyPlus.
(4)
The indicator of the building life cycle cost
In the design for building climate adaptability, the thermal comfort and building energy consumption need to be taken into account on the one hand, and the investment and benefits within the building life cycle need to be considered on the other hand, thus evaluating design decisions on a longer time scale. There are many ways to evaluate the building life cycle cost, such as the net present value, annuity, internal rate of return, rate of return on investment, etc. The concept of global cost is introduced by Energy Performance of Building Directive recast, EPBD2010 as a measure of the economic efficiency of a building life cycle. In this study, the life cycle cost is calculated with reference to the Energy Performance of Building Directives.
The concept of global cost and the calculation method defined by EPBD can be referred to in CEN technical reports TR 15615 [36] and EN 15459 [37]. The global cost calculation is based on a net present value approach to assess the long-term economic status of the project, so the investment cost is not the only consideration for cost assessment, and all other energy-related life cycle costs need to be considered. It is worth noting that only energy-related costs are considered as part of the global cost, while costs brought by environmental impacts, like construction, material transportation, and more, are excluded here, so the global cost is not in line with the assessment method of the whole life cycle.
The global cost equation can be written as Equations (1)–(3) [37]:
G C = C I + i = 1 30 [ C e , i R d ( i ) ] A f l o o r
R d ( i ) = 1 ( 1 + R r ) i R r
R r = R i R e 1 + R e
In the equation, GC represents the global cost of the building life cycle; C I is the initial investment cost (yuan); C e , i is the energy cost (yuan) in the year of i; R d ( i ) is the discount rate in the year of i; A f l o o r is the total floor area (m2); R r is the effective interest rate set at 3%; R e is the price increase rate of energy set at 1.2%; R i is the market interest rate set at 4.25%; and the life cycle used should be 30 years in length in cost analysis. In addition, the building energy demand is assumed to remain unchanged during the calculation period.

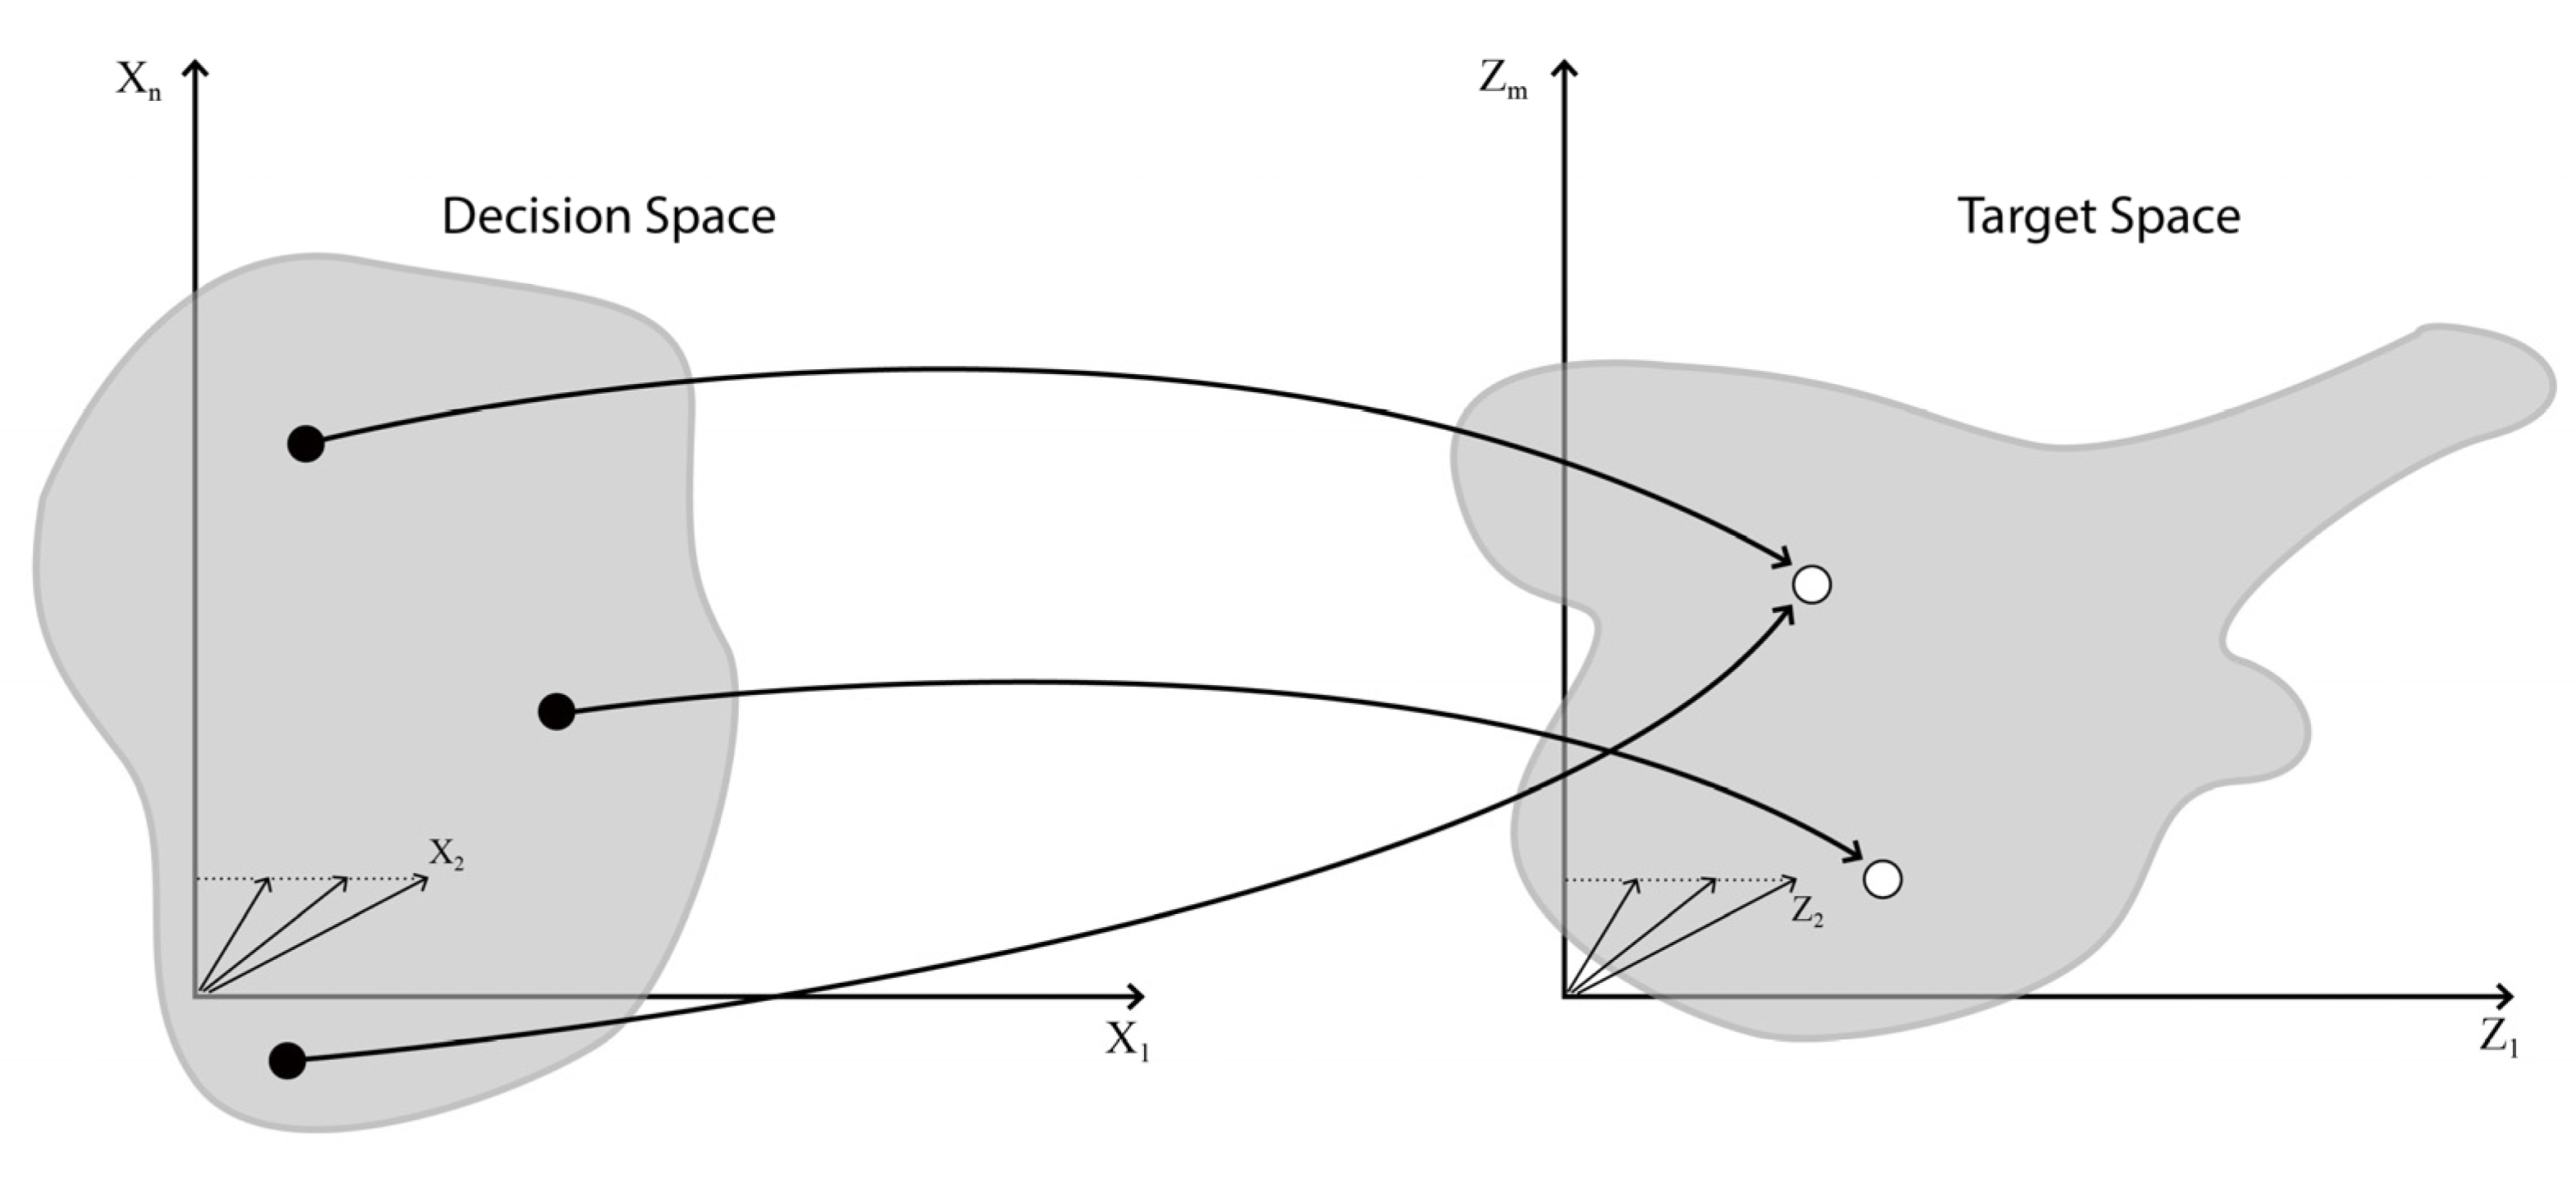
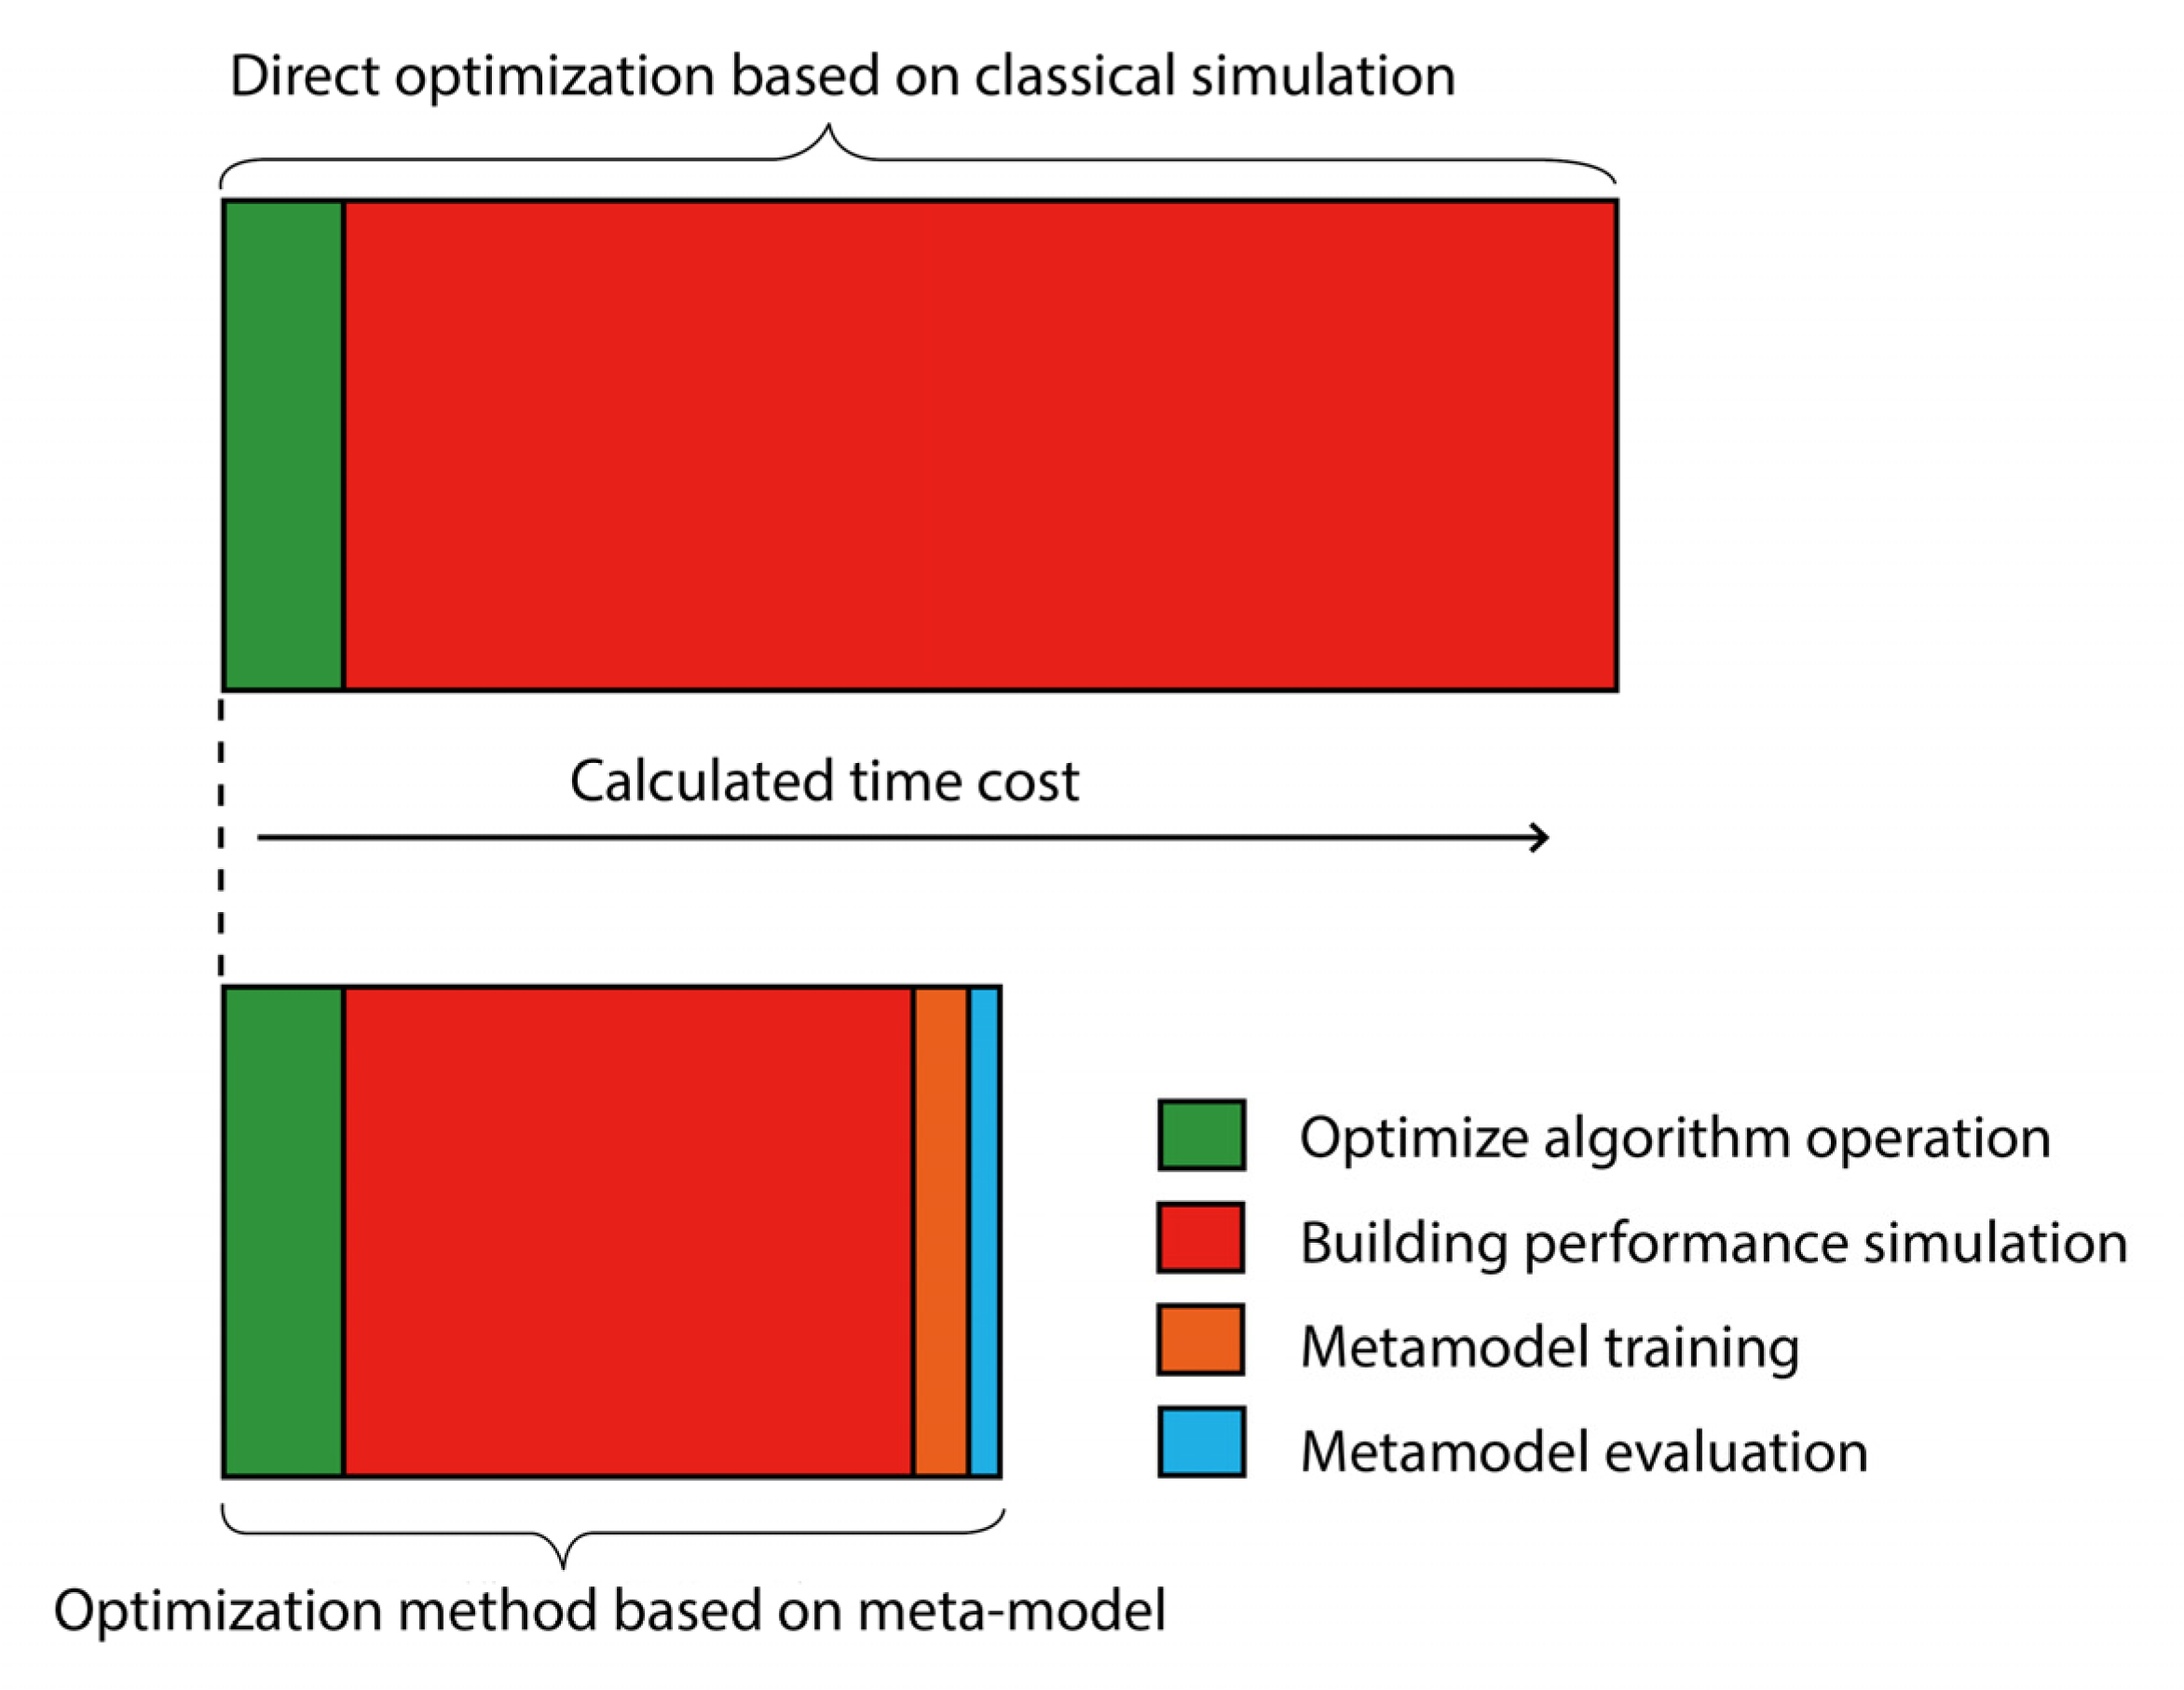
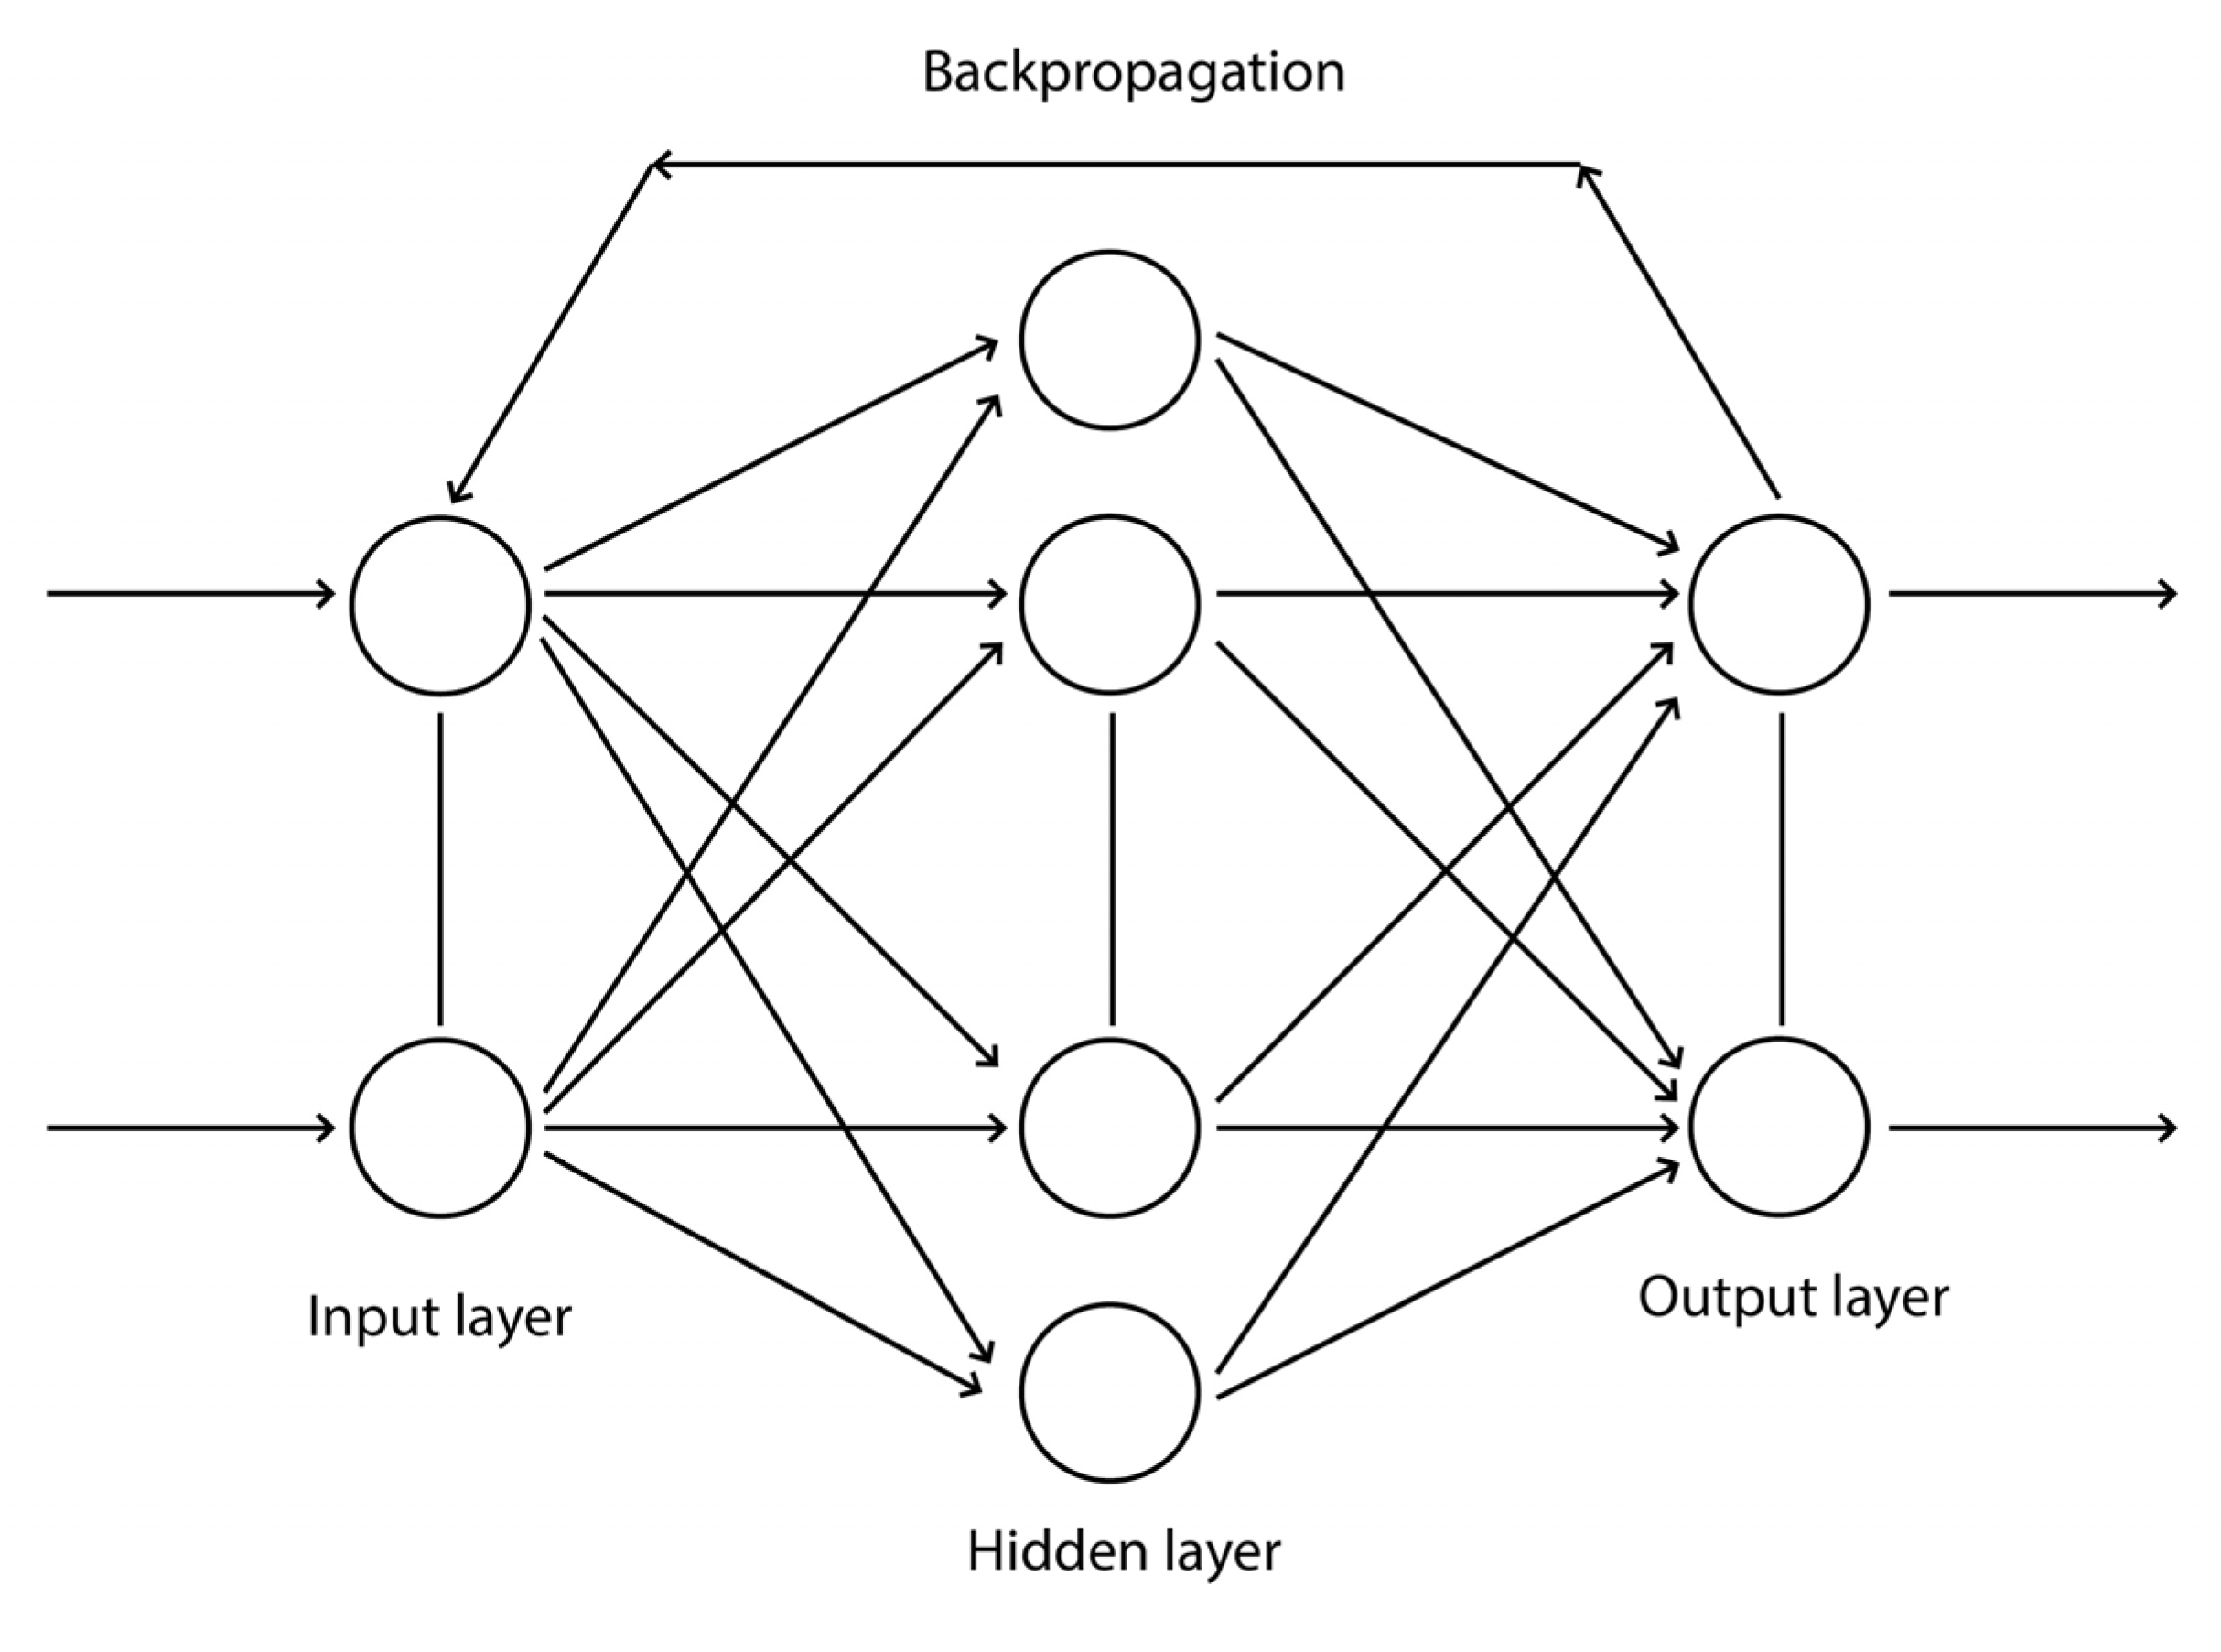
2.3. Prediction Modeling

Optimization algorithms provide solutions to complex problems, but there is a big limitation, i.e., when there is a huge number of optimization solutions, hundreds or even thousands of simulation evaluations are required to gain the best solution. The integrated optimization design of building performance usually involves a huge amount of data, making the optimization simulation very time-consuming and difficult to be operated in practical applications. The metamodel method is adopted by many researchers to build approximate models based on the stochastic simulation data in building performance optimization to demonstrate the overall characteristics of the building performance simulation data. For instance, Magnier and Haghighat [38] once used metamodel to solve multi-objective optimization problems, and they used 450 TRNSYS simulation data sets to train and validate a metamodel of the artificial neural network (ANN), which was then combined with a genetic algorithm to optimize the thermal comfort and energy consumption of the building. Asadi et al. [39] also used 950 TRNSYS data sets to train the ANN metamodel, which was then combined with genetic algorithms to evaluate the performance of building remolding projects. Yu et al. [40] used 100 EnergyPlus simulation data sets to train the ANN metamodel, which was then combined with Non-dominated Sorting Genetic Algorithmu II (NSGA-II) to optimize the energy efficiency and thermal comfort of a typical model.
It is found from the available metamodel research literature that most researchers used artificial neural network methods as a metamodel for analysis optimization. Sampling methods (e.g., Latin Hypercube sampling (LHS)) are used to obtain a small number of statistically representative samples to train ANN, thus decreasing the number of simulations of building properties to the largest extent and improving the optimization efficiency. Once the ANN metamodel is established, it can be dynamically coupled with the optimization algorithm to find the Pareto optimality for the optimization objective.
The basic process of metamodeling:
  • Representative input samples are created to train and validate the metamodel (see Figure 4).
  • The selected sample input data is simulated to obtain the corresponding output data (see Figure 4).
  • The input and output sample data are used to train the metamodel.
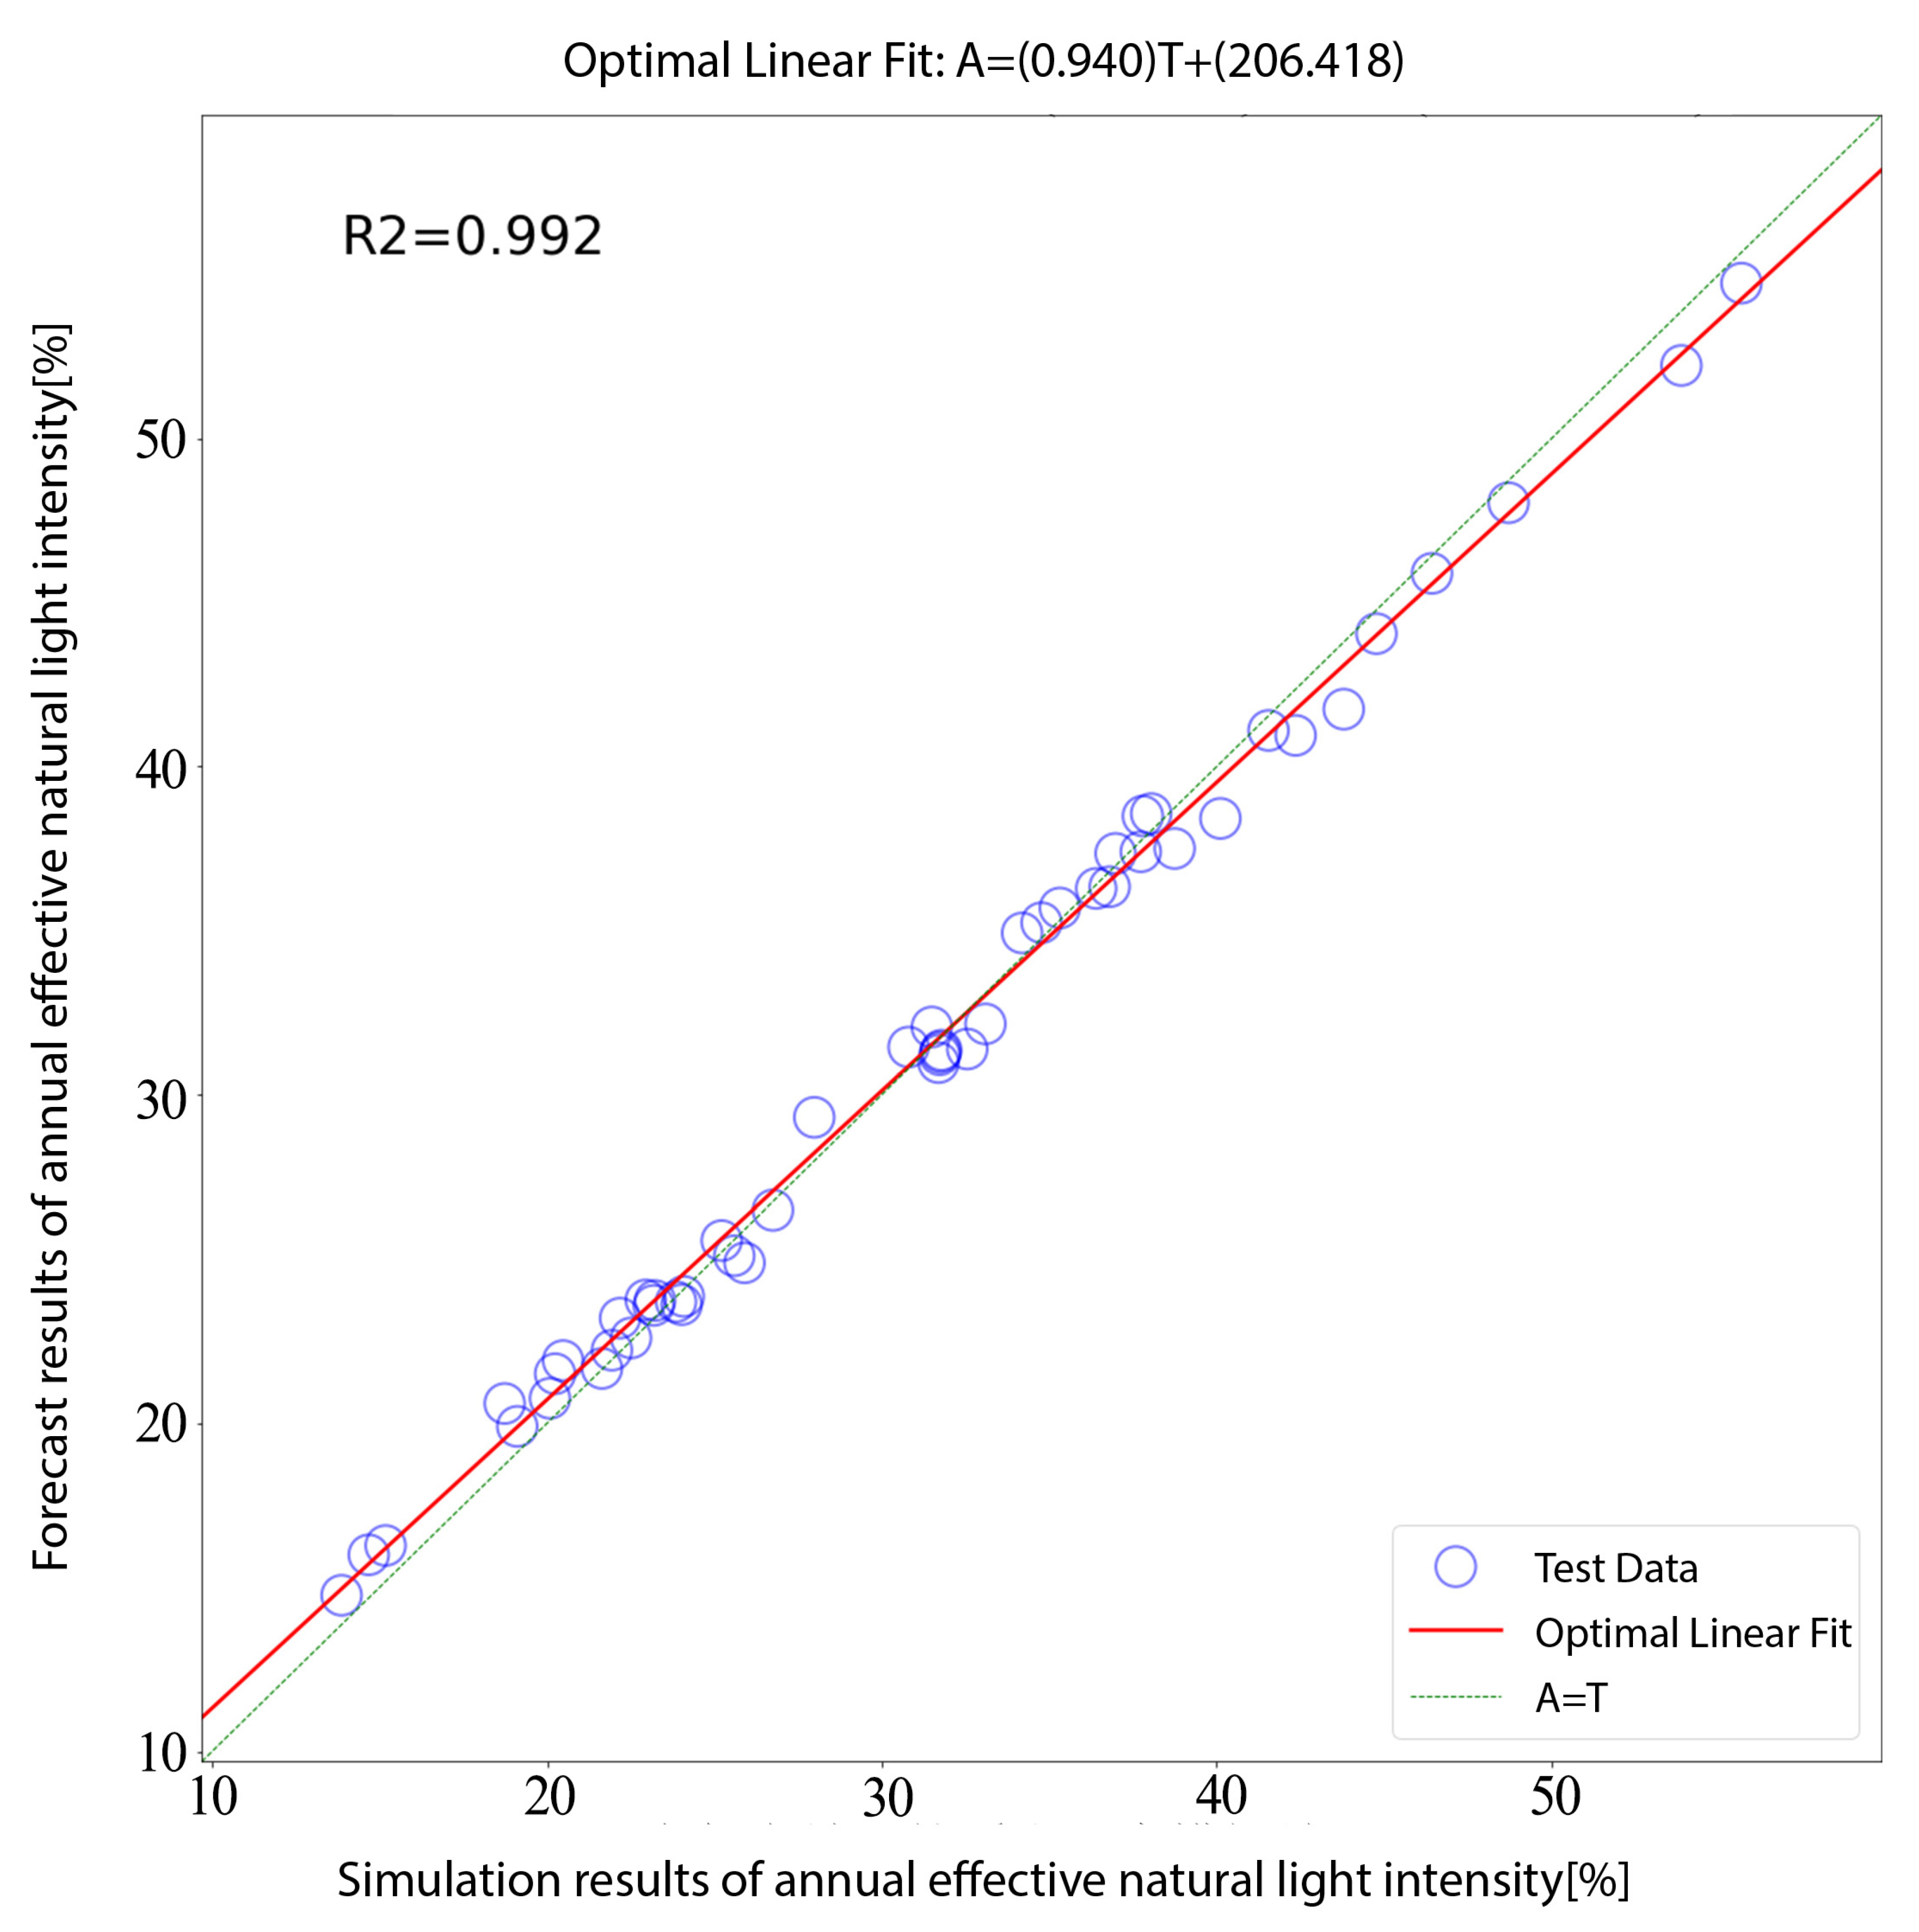
  • Different indicators are used to validate the ANN metamodel.
Figure 5 depicts a conceptual comparison of the computational cost (or the time required) of the metamodel-based optimization method and that of the optimization method based on classical simulation. Most time in the classical method is used in the model simulation, while the time for the metamodel optimization method is mostly spent on the simulation of the sample data, with a small amount of the time spent on the training of the metamodel, thus reducing the overall time.
Since a large amount of data is usually involved in parametric simulations, a method based on Monte Carlo and ANN is proposed in the study to improve the computational efficiency. According to this method, a prediction model with a high fit degree is established on the basis of extracting a certain number of random simulation results to characterize the whole data.
ANN, as an information processing system mainly derived from the imitation of the human brain structure and function, is built based on a collection of connected units or nodes of artificial neurons with certain threshold values, which are usually adjusted and weighted as they learn. The increase and decrease of weights affects the signal intensity at the connection parts [41,42]. In the actual modeling process, researchers can obtain an accurate network model only by limiting the topological structure of the neural network, as well as training and testing the network model using known input and output data as samples of learning and testing [43]. The specific structure is shown in detail in Figure 6.

3. Modeling

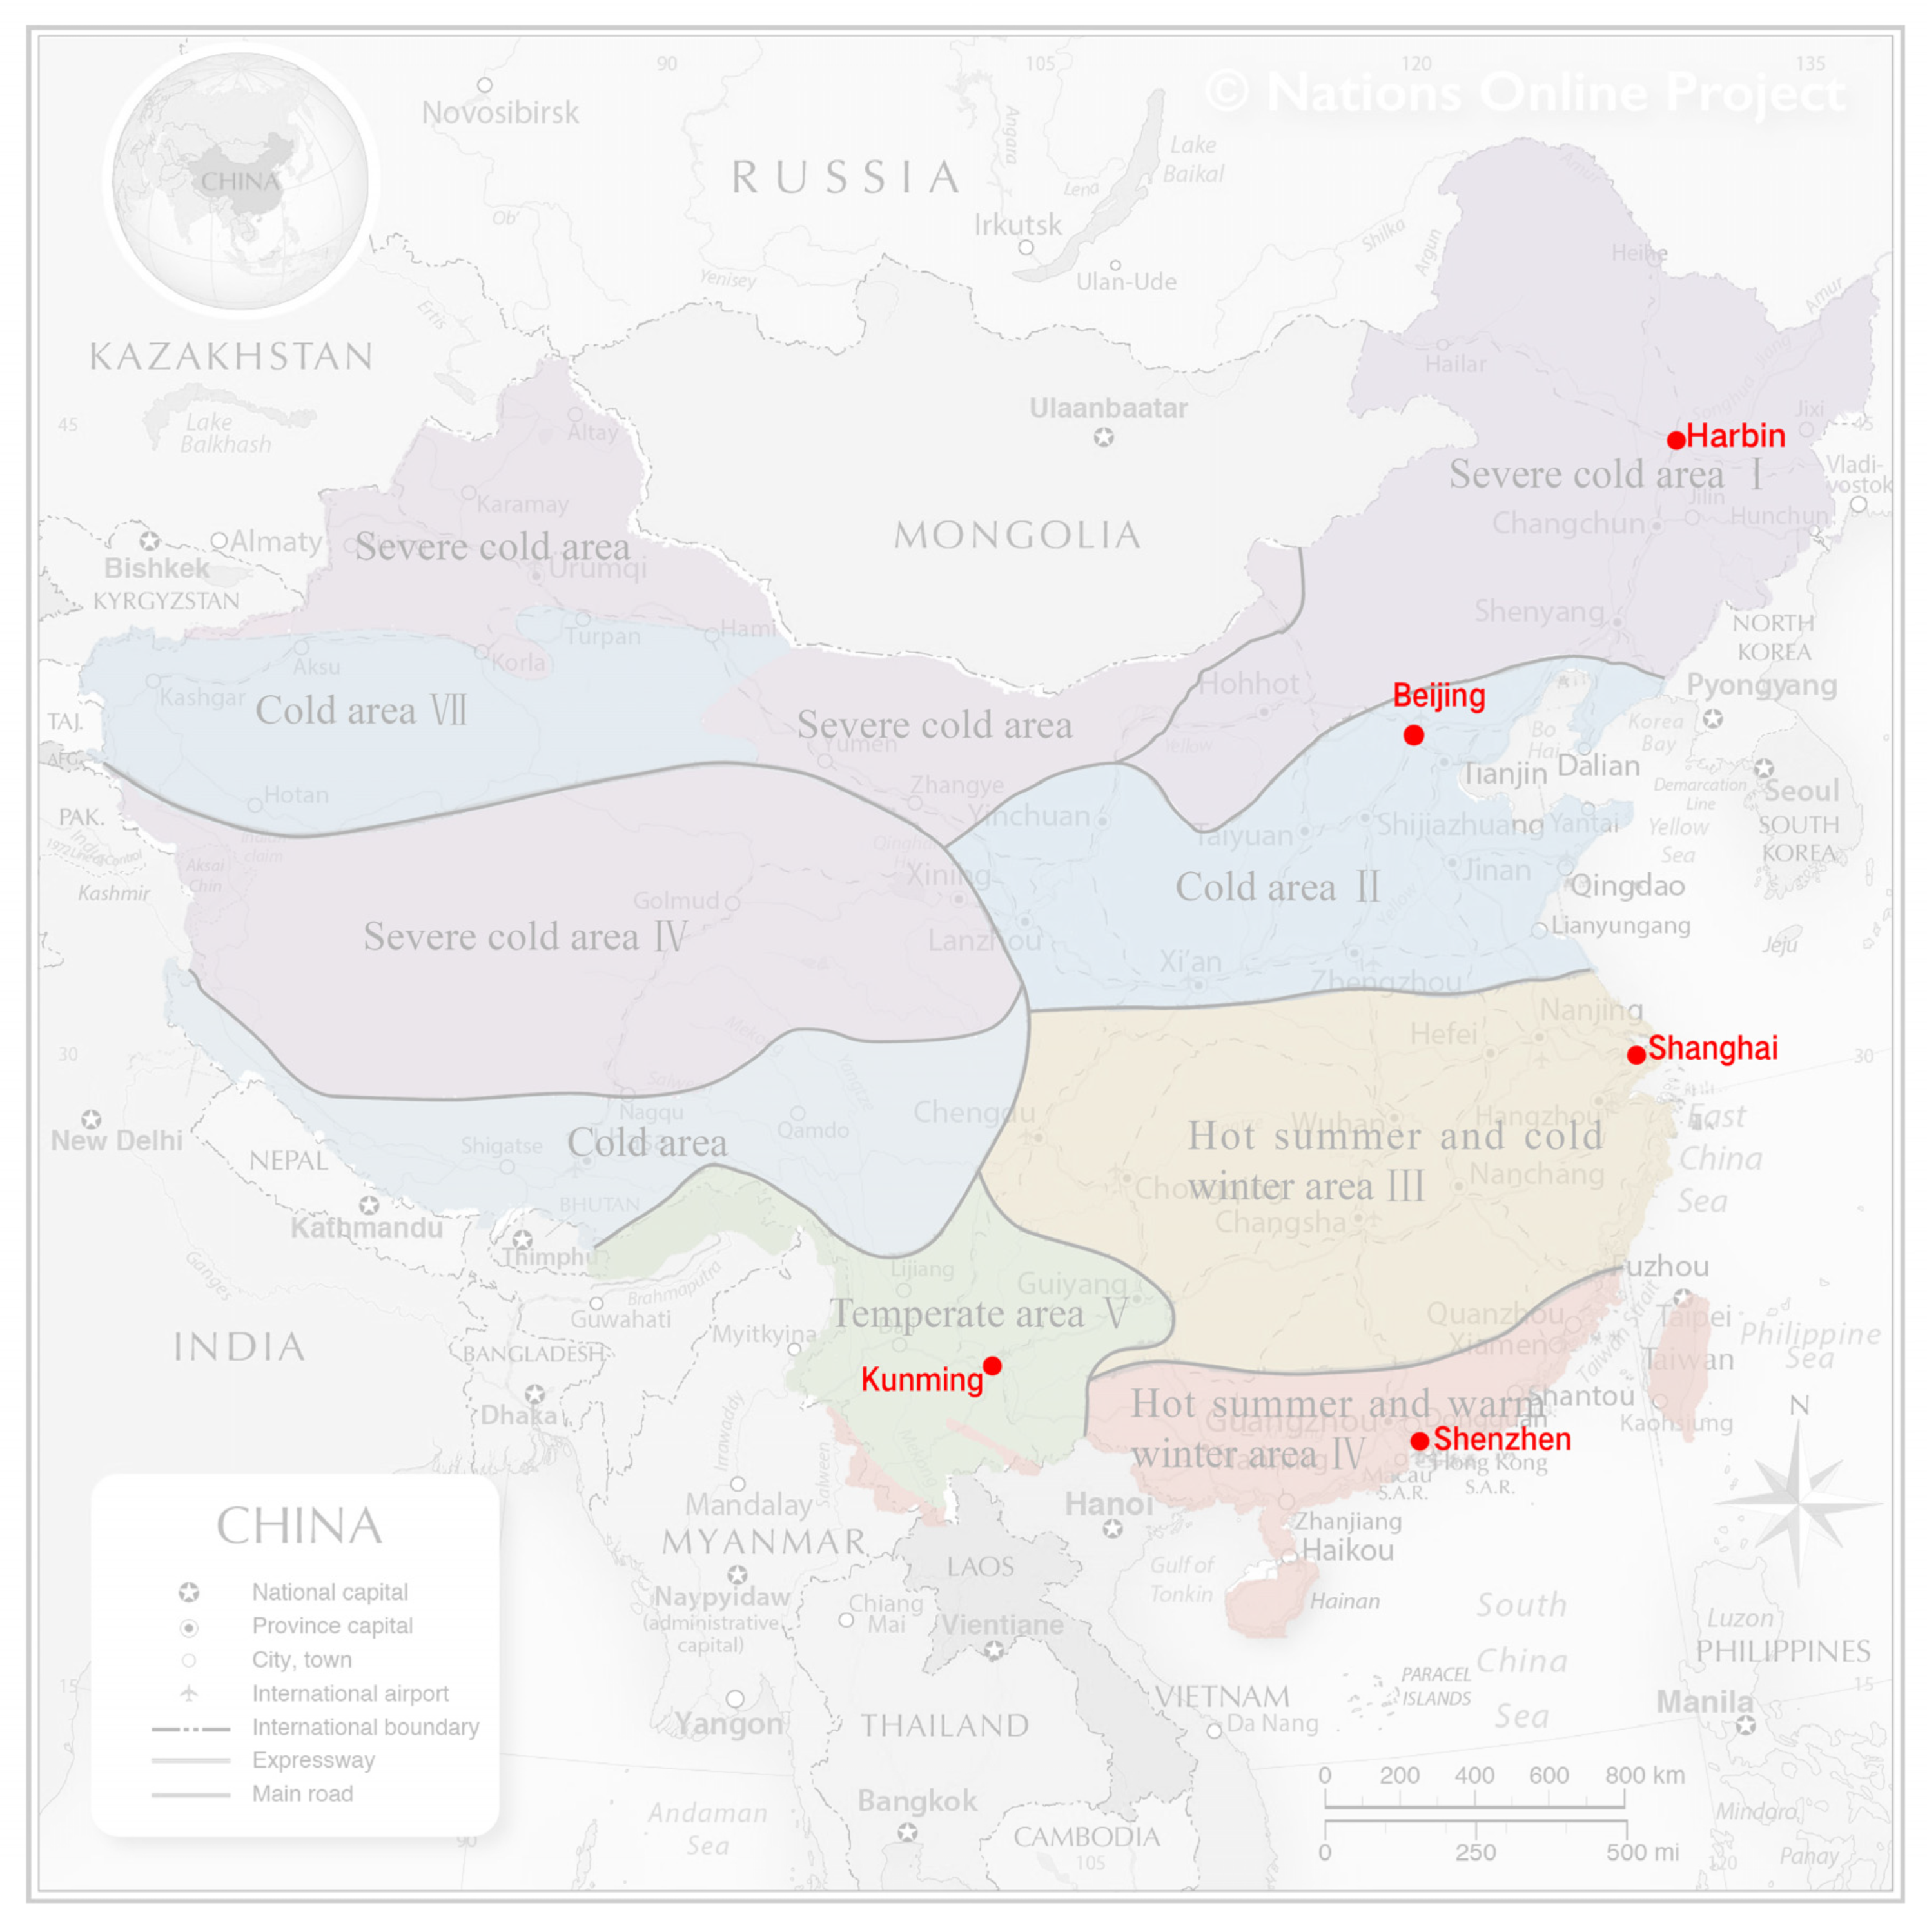
3.1. Determination of Typical Cities in China

An analysis was conducted for climate types and energy efficiency codes of China in the study. Meteorological data (EPW files) of typical cities is typical local annual meteorological data downloaded from the official website of EnergyPlus, mainly referring to parameters like the temperature of an outdoor dry bulb, relative humidity, solar radiation, and wind direction and speed.
China is located on the west coast of the Pacific Ocean, and its climate is mainly influenced by, and complicated by, the variability of the terrain. Monsoon circulation [44] in “The Standards for Thermal Design of Civil Buildings GB50176-93” promulgated in 1993 in China. The country is divided into 7 primary building climate zones and 20 secondary building climate zones based on the average temperatures of the coldest and hottest months in each region of China (see Figure 7). The building climate varies more widely between the primary zones than that between the secondary zones.
Five typical cities, including Harbin (severe cold region I), Beijing (cold region II), Shanghai (hot-summer and cold-winter region III), Shenzhen (hot-summer and warm-winter region IV), and Kunming (mild region V), are selected from climate zones I, II, III, IV, and V according to the building climate zoning in China (see Figure 1).
The heating area and non-heating are set with Qinling Mountains-Huaihe River as a dividing line in China. Centralized heating starts in areas north of the Qinling Mountains-Huaihe Rivers in mid-November each year, and lasts for four months until mid-March. While in some areas (such as northern cities like Harbin), the heating time will be extended due to climate, and in areas south of the Qinling Mountains-Huaihe Rivers, collective heating measures have not been taken so far, but some communities will be heated according to actual needs. The heating time is listed for typical cities in Table 3 based on a survey of the actual heating conditions in each city at present.

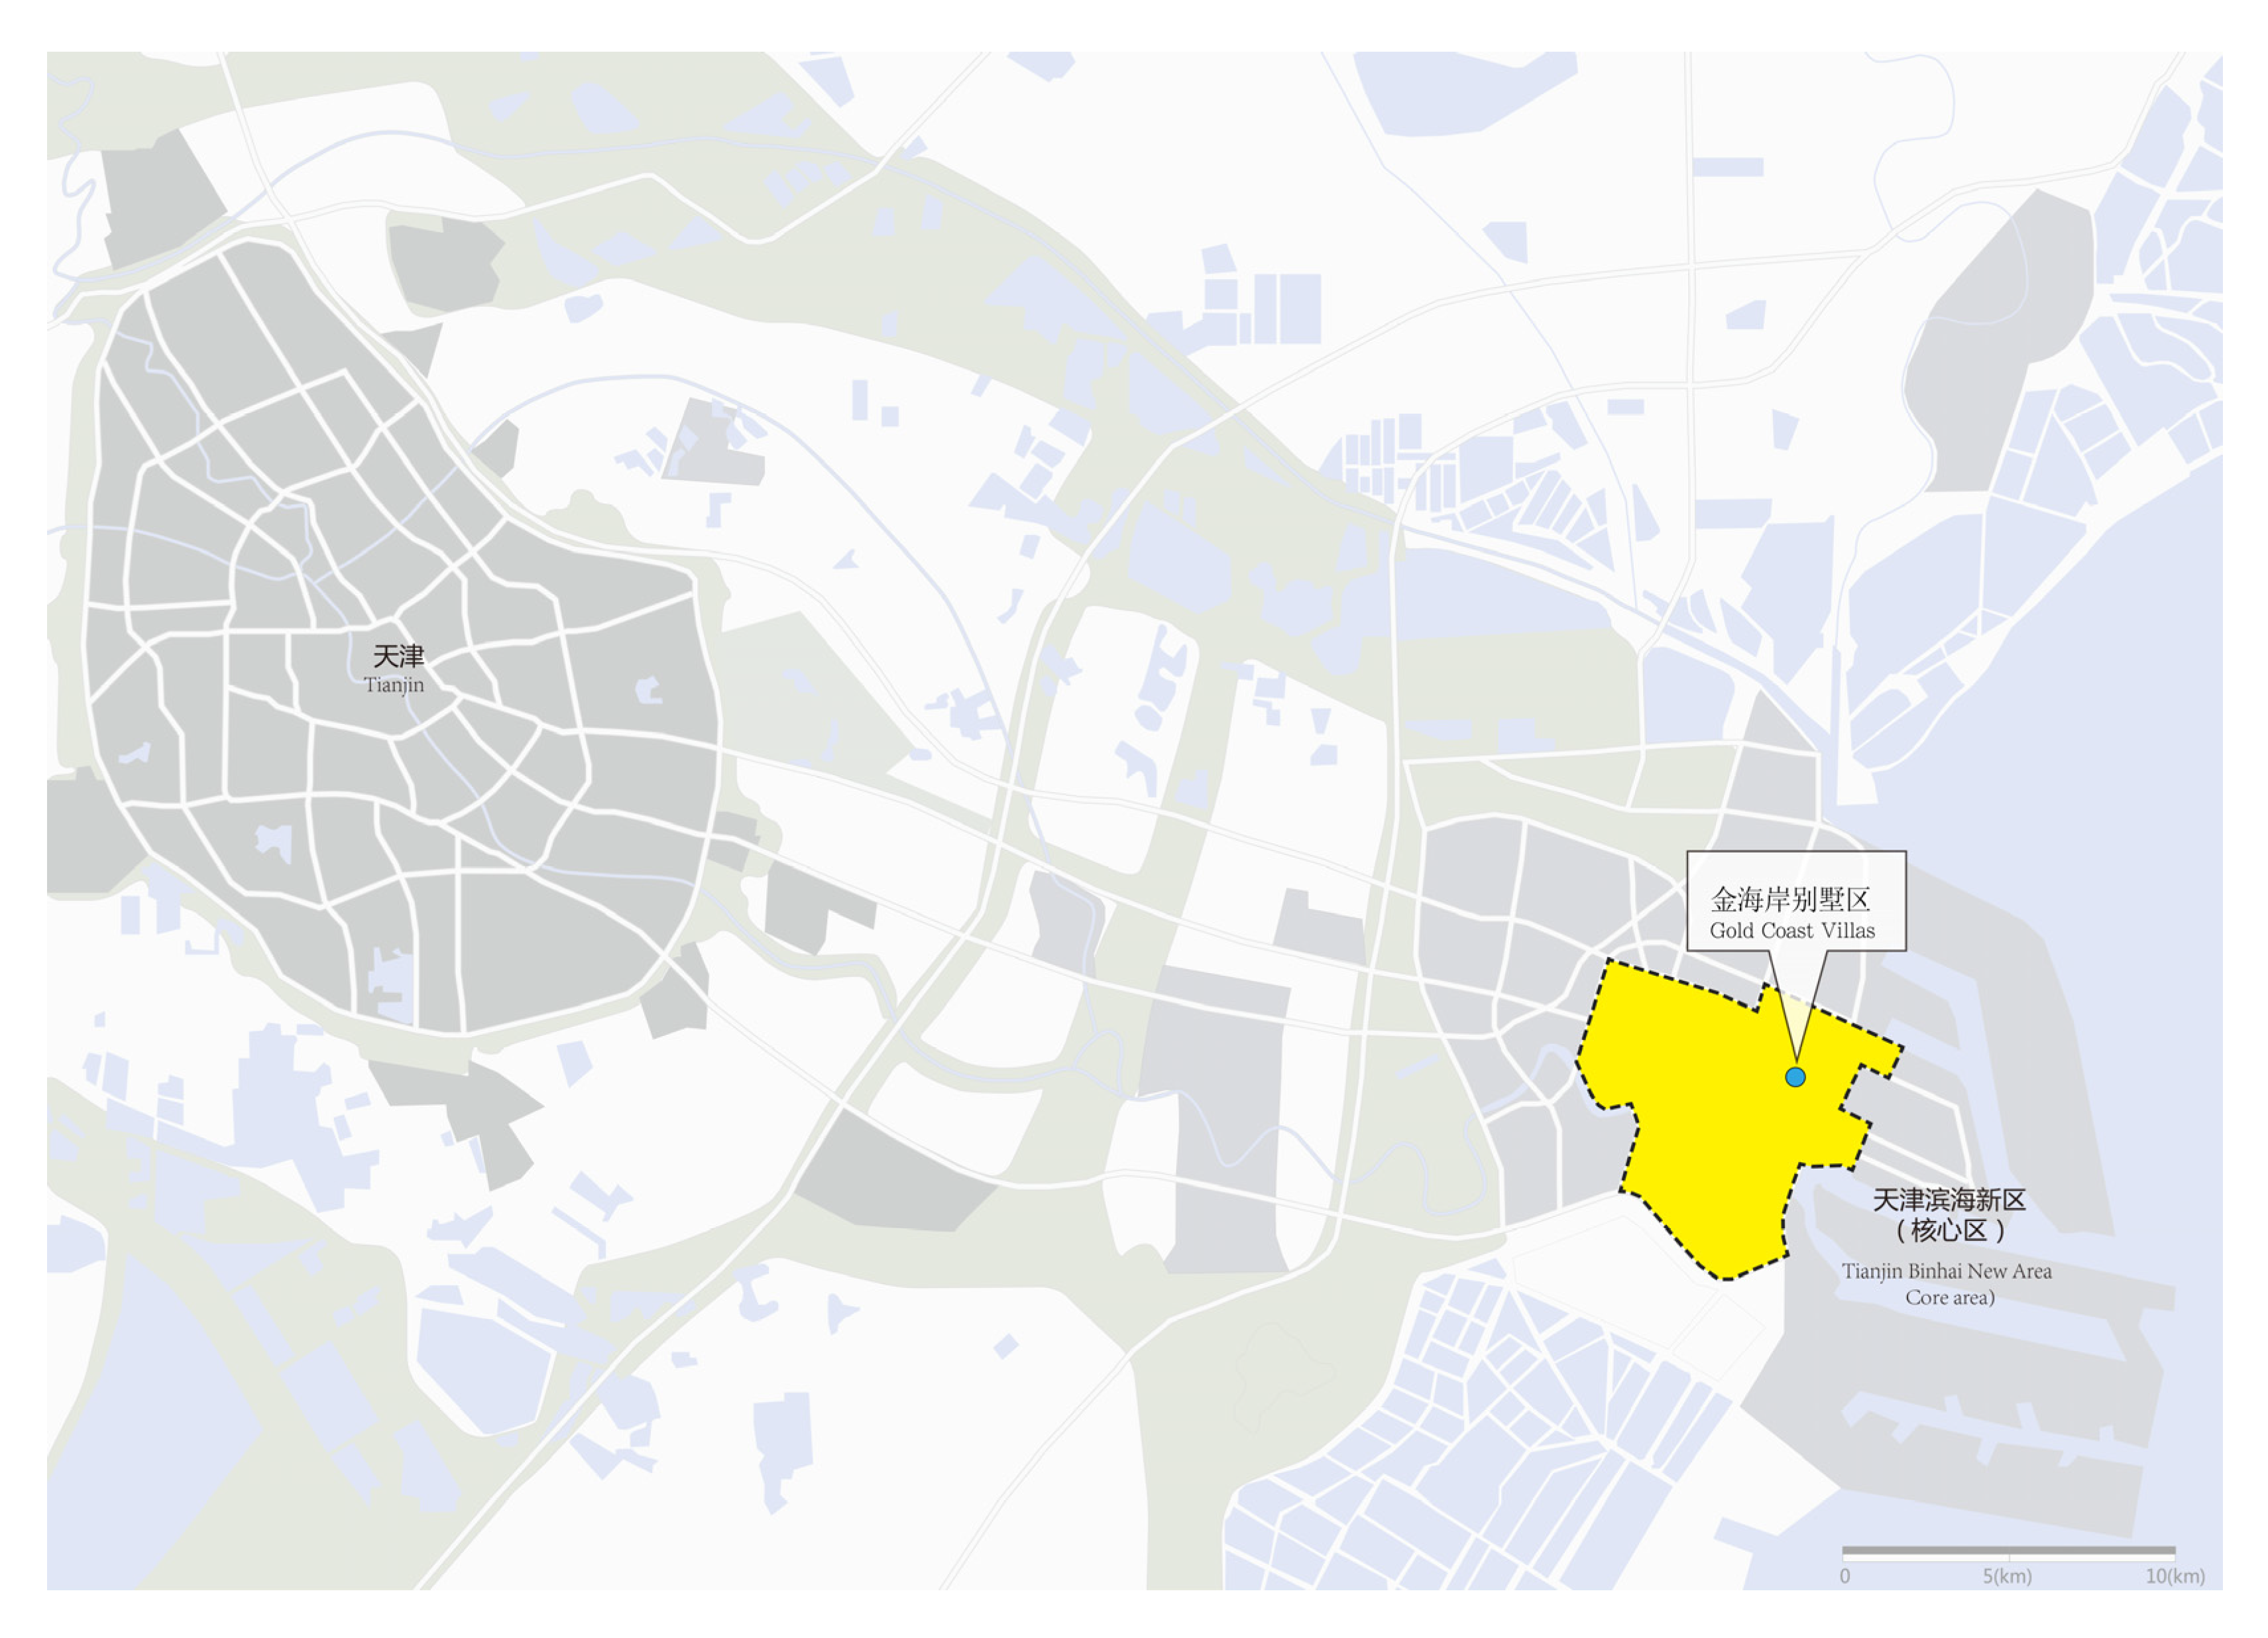
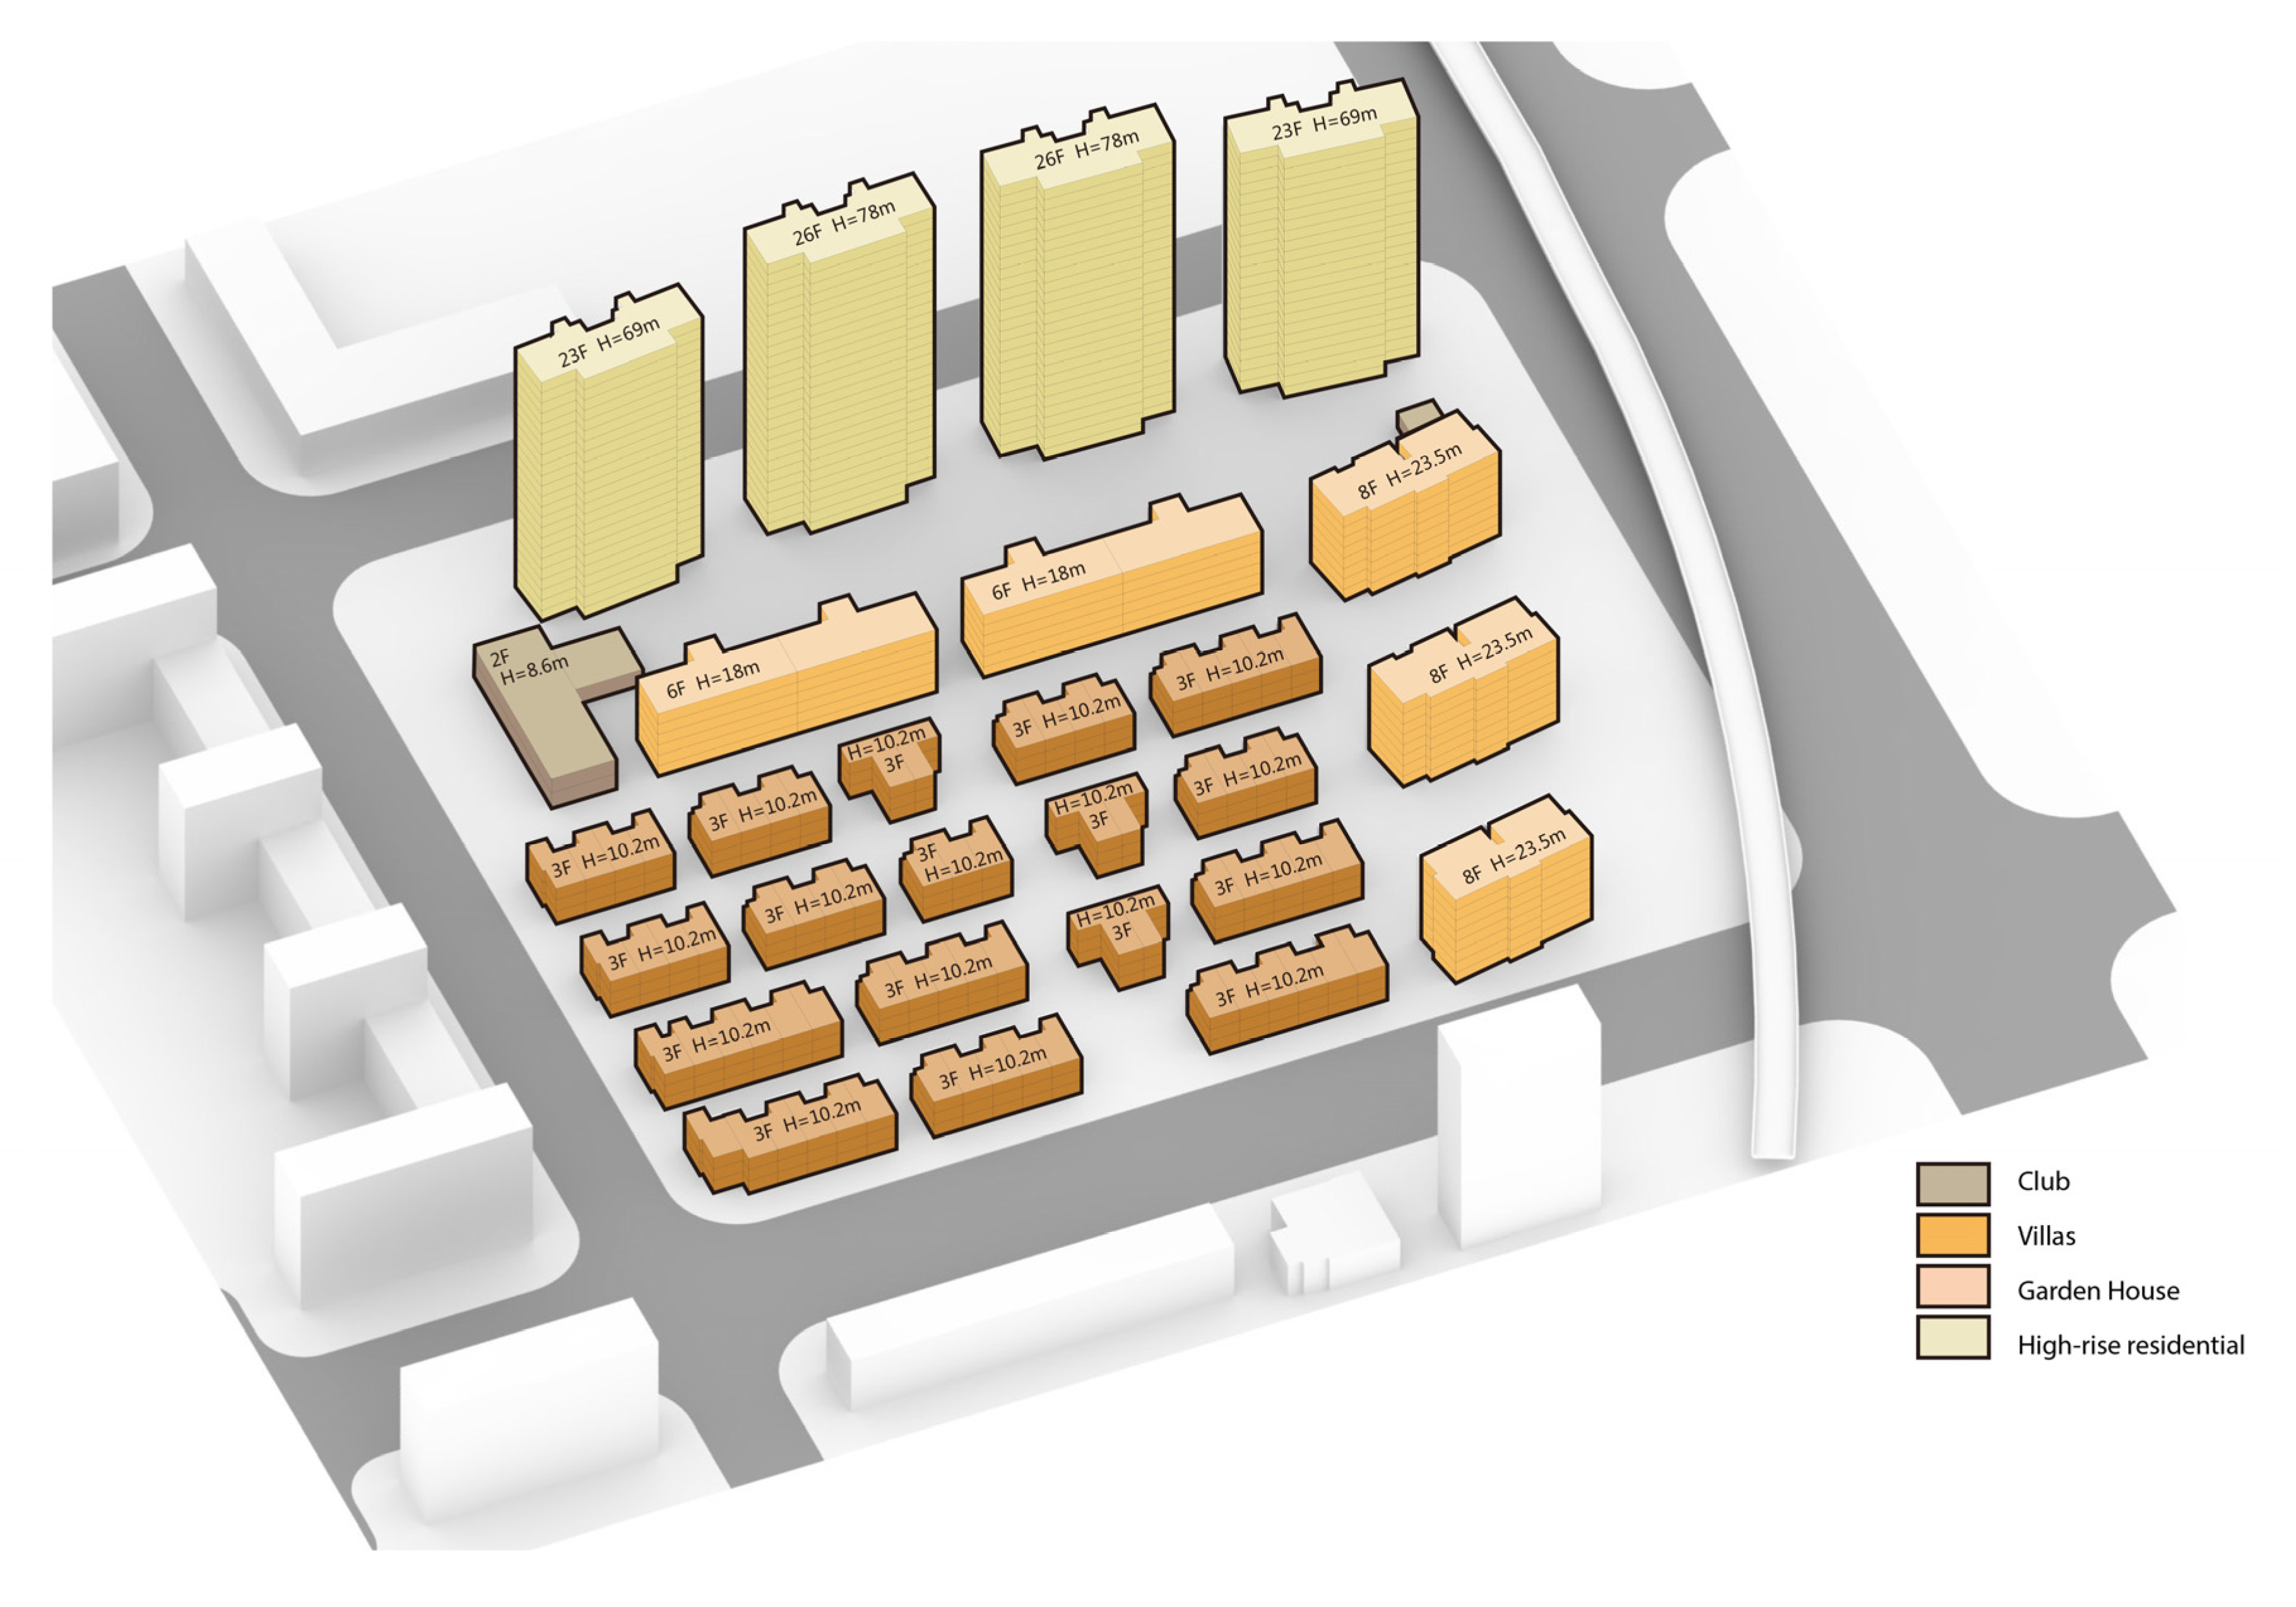
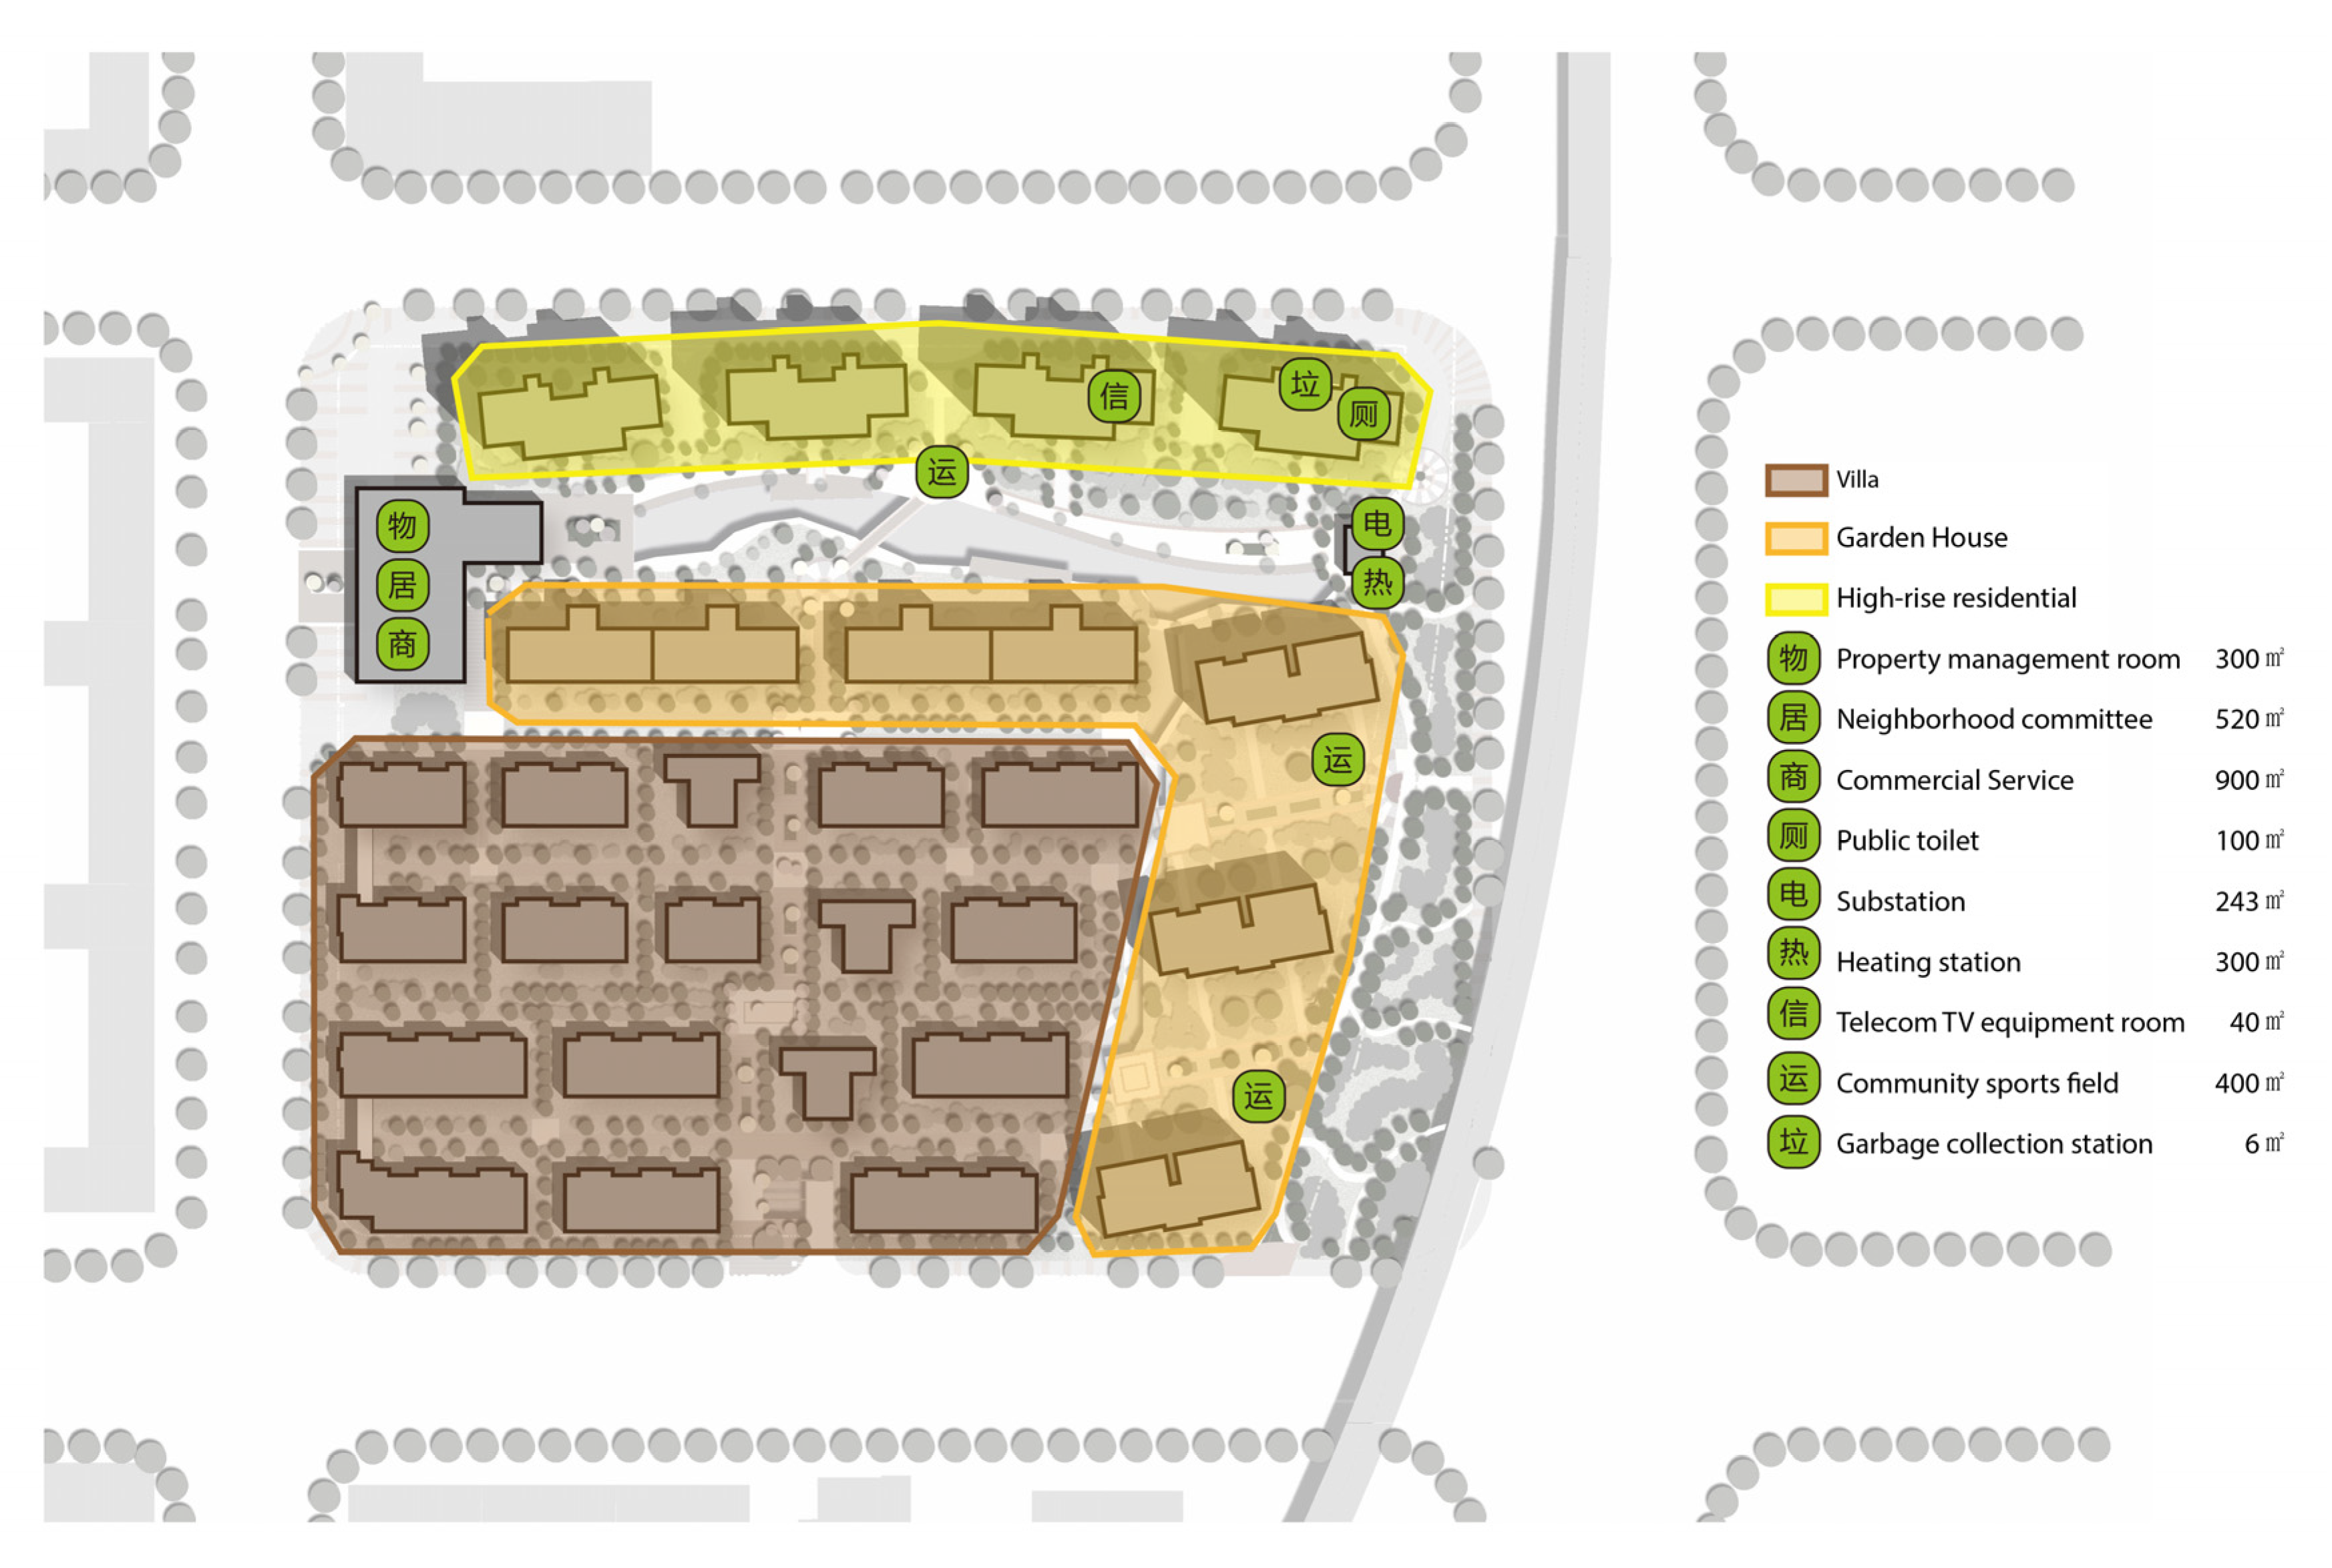
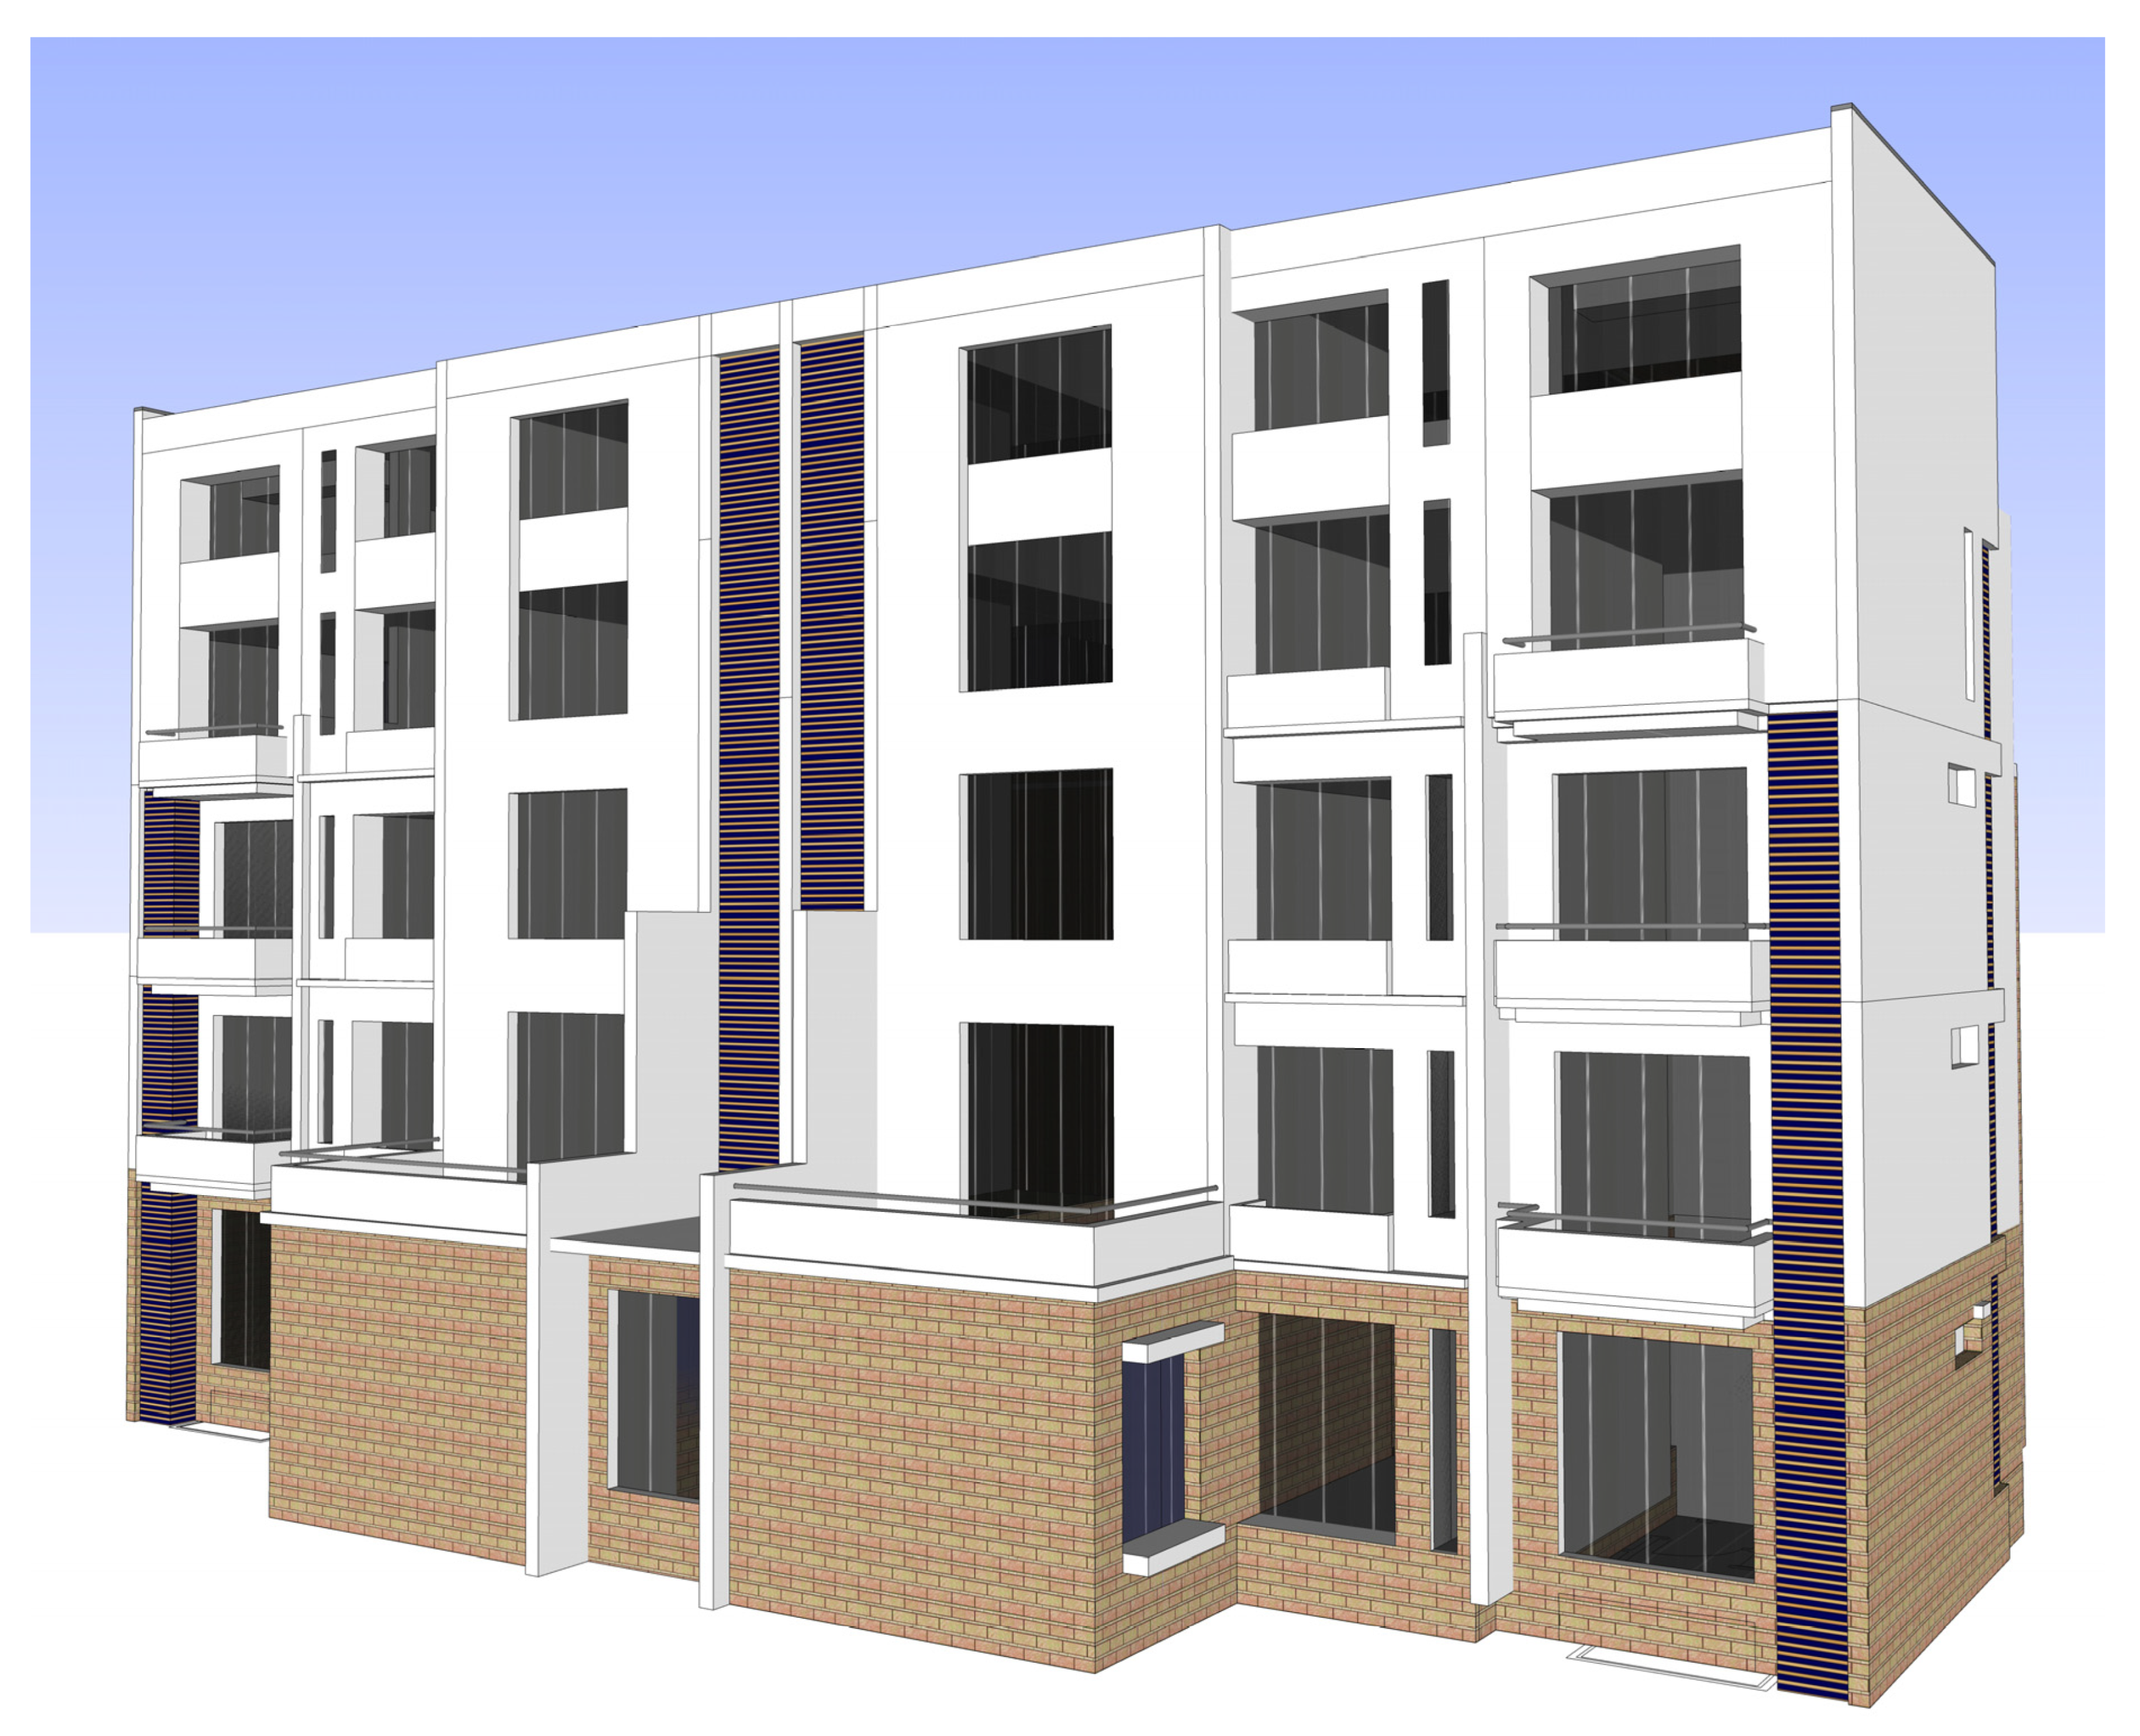
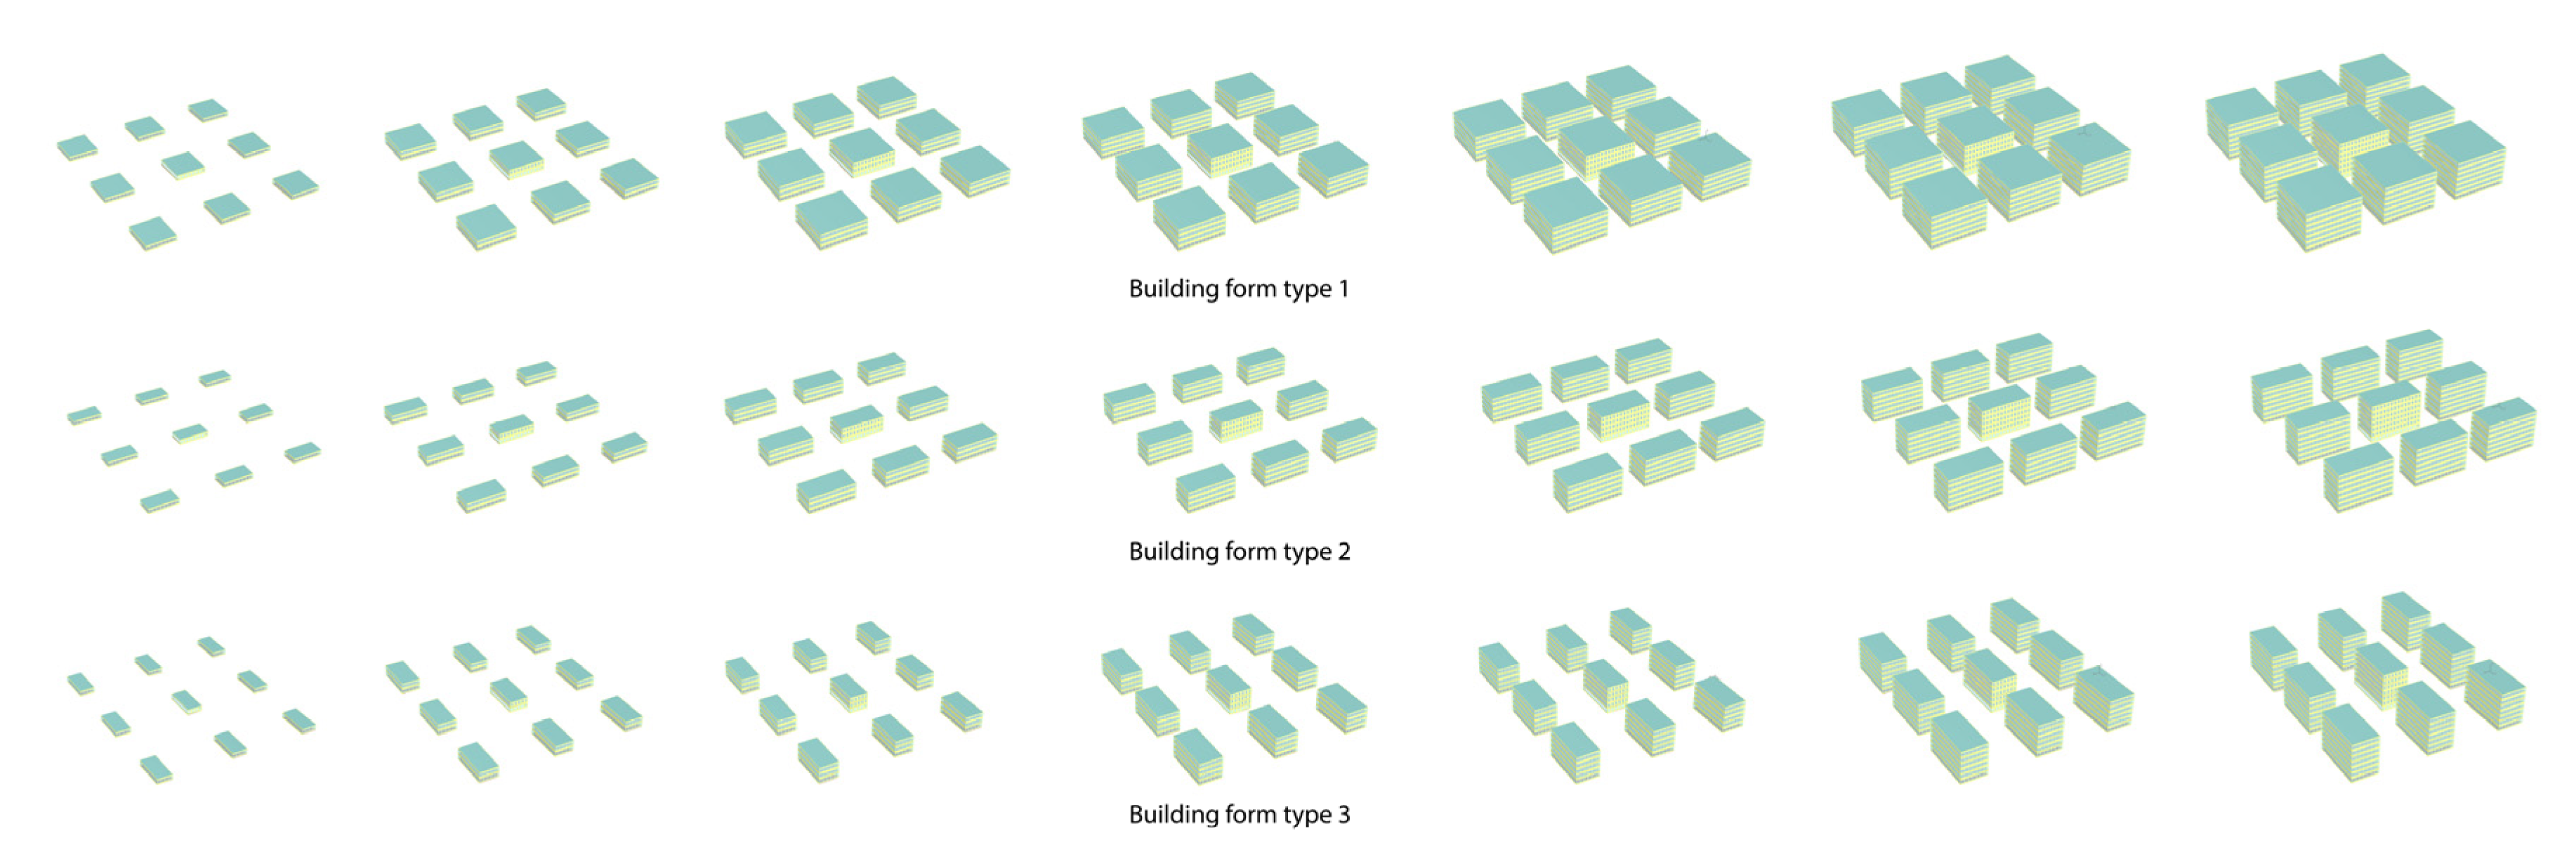
3.2. Selection of Reference Buildings

The reference building selected for the study is the Tianbao Gold Coast Community in Binhai New Area, Tianjin, as shown in Figure 8. The community consists of a clubhouse, townhouses, foreign-style houses, and high-rise buildings, as shown in Figure 9, Figure 10 and Figure 11. Four foreign-style houses stand side by side with separate entrances. There is one staircase and two estates in the townhouses and multi-story residential buildings, and a row of buildings is divided into two units. The floor area of each apartment type varies in size, but they all consist mainly of functional rooms and auxiliary spaces, such as kitchens and bathrooms.
A digital model needs to be established in the study based on the type analysis of the reference building to facilitate parametric performance analysis. The benchmark model is established with a 5-story residential building in Tianjin Tianbao Gold Coast Community as the reference building, as shown in Figure 12 and Figure 13. For a better analysis, only the simplest square shape is chosen for the parametric typical model, and the difference in the shape coefficients of the building is used to distinguish point residential buildings from strip residential buildings, so that the data control of only one typical parametric model can represent residential buildings of different types and different floors.
With the basic parameters of the reference building summarized in Table 4, based on the relevant parameters and the logic shown in Figure 14, software Grasshopper Ladybug/Honeybee is used to establish the simulation process of building performance simulation shown in Figure 15.

4. Results

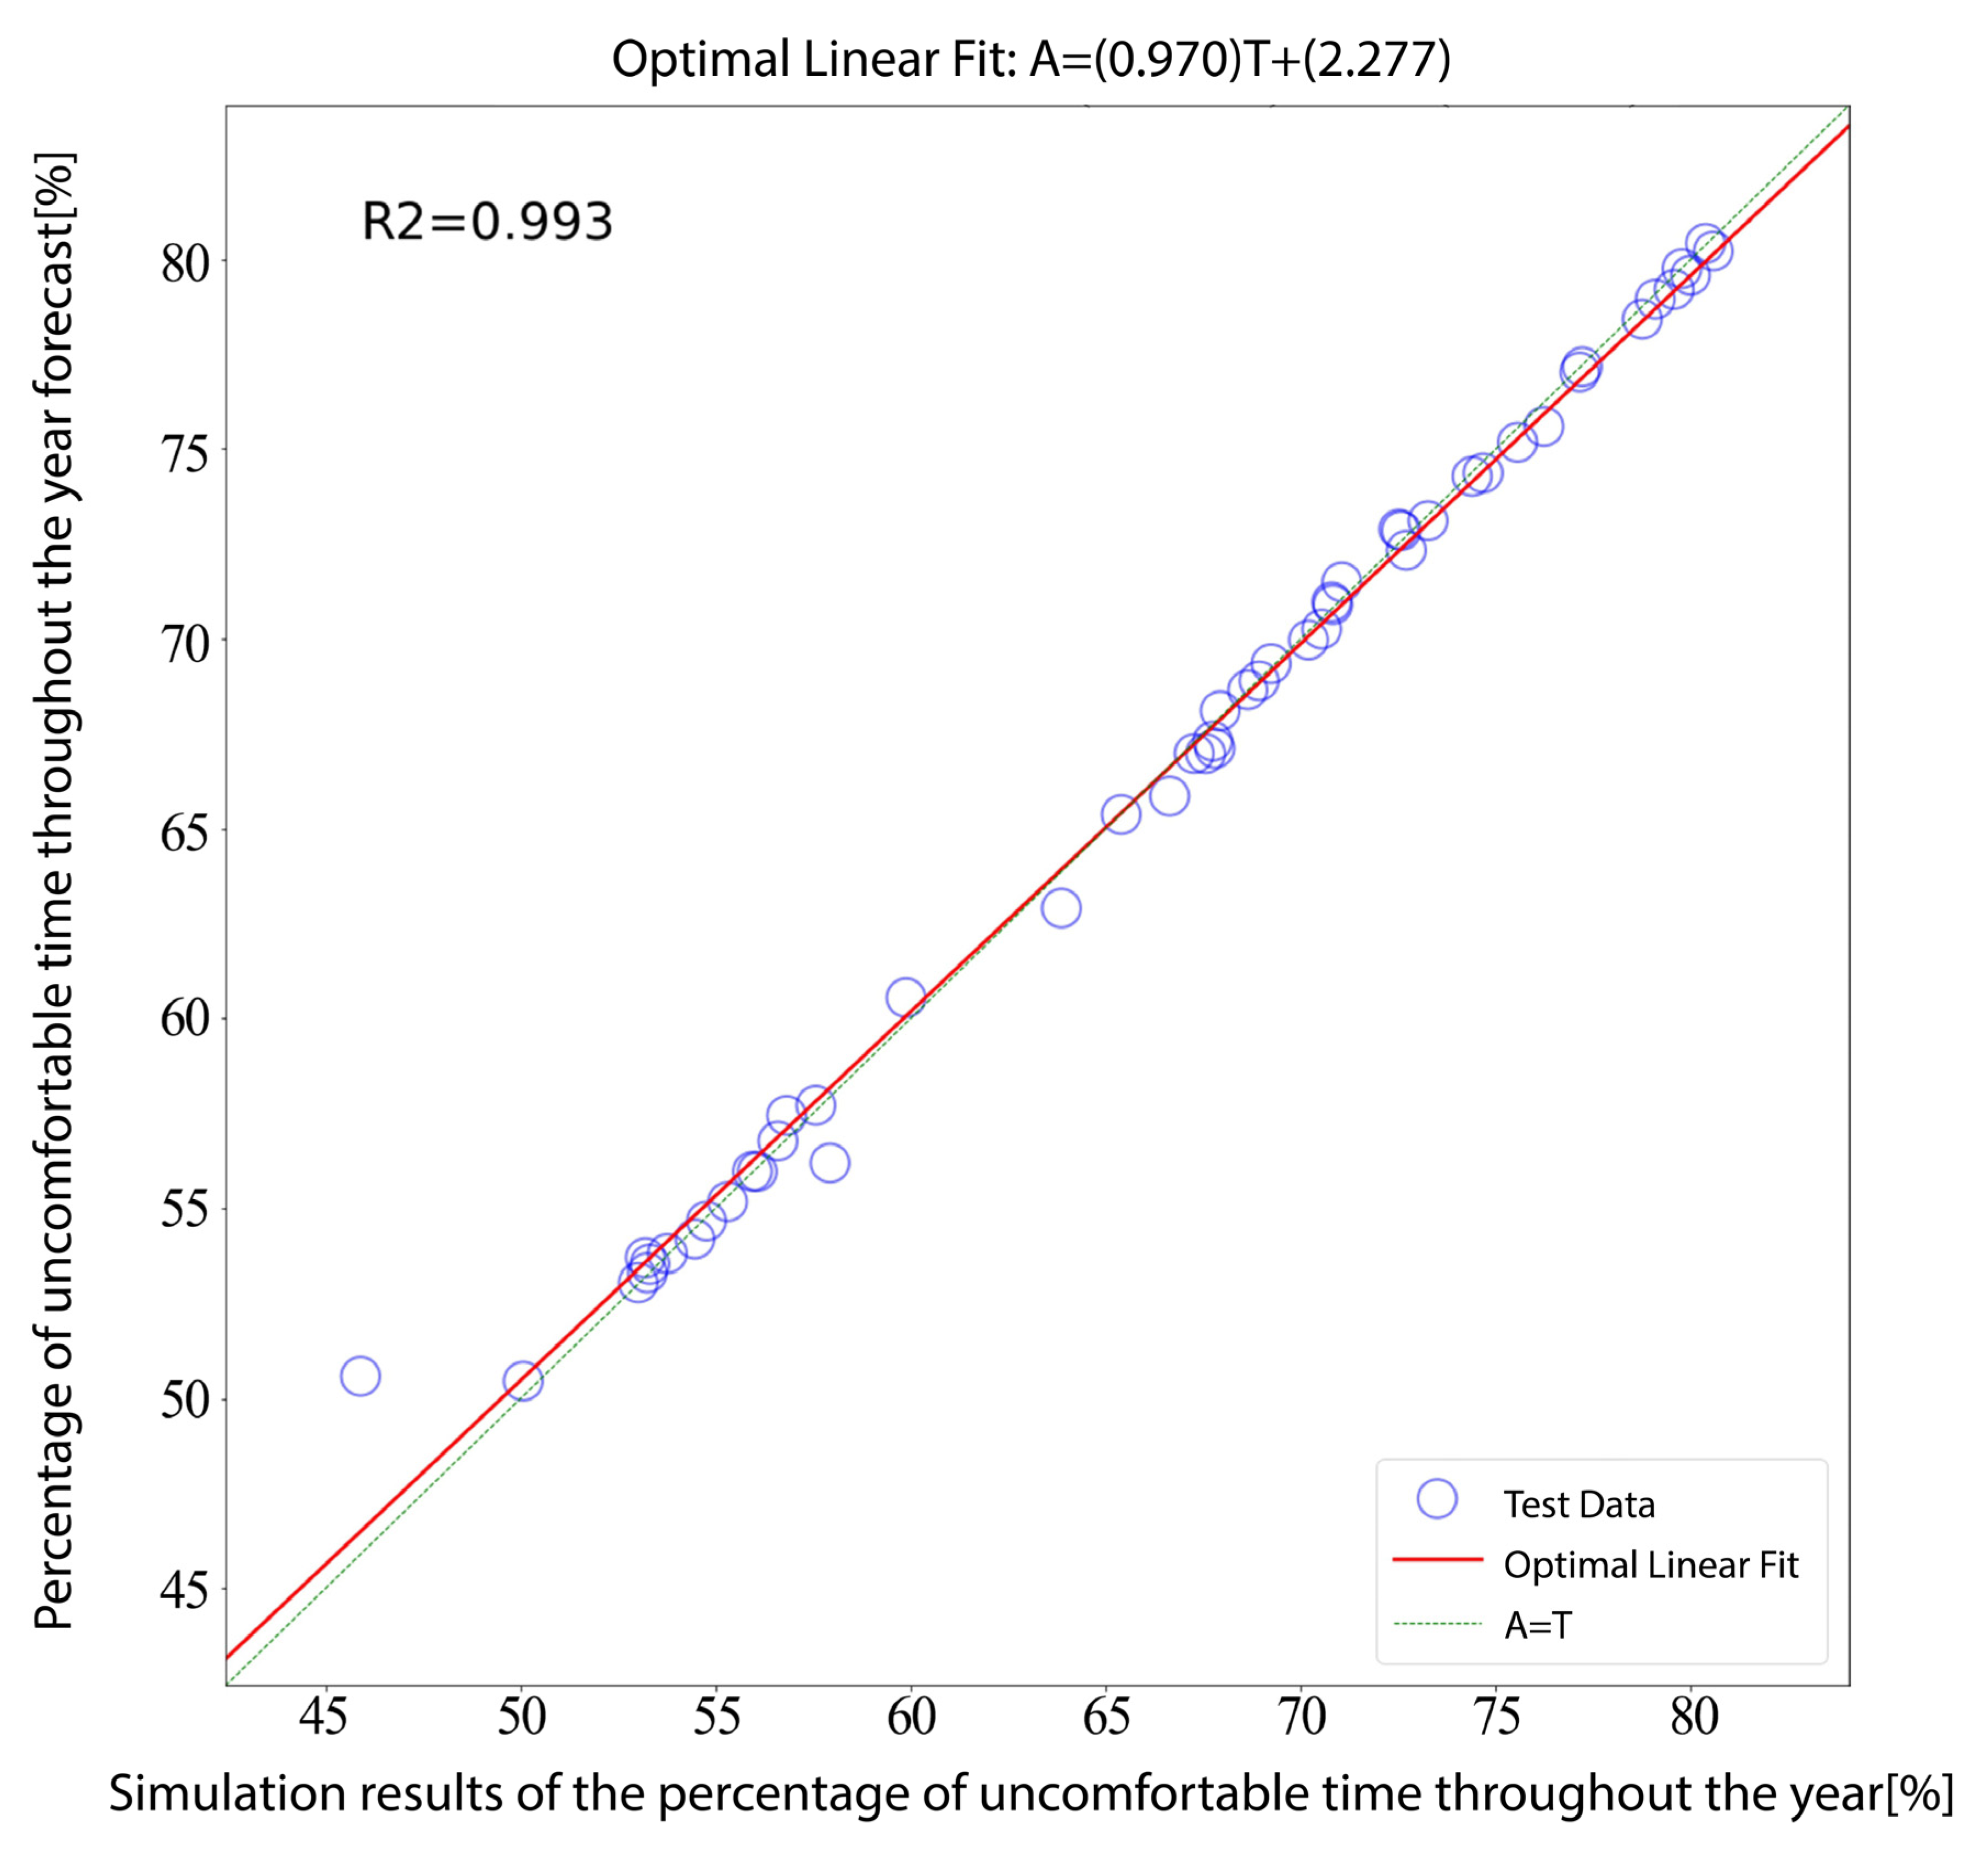
4.1. Prediction Modeling of Integrated Building Performance

The method of integrating building forms and establishing models for design parameters of the building envelope is described in Table 4 with the house types of residential houses in Tianjin Tianbao Gold Coast Community as the example. The length, width, and height of the residential building and other related parameters are extracted in the study for control settings. The design parameters of building forms are listed in Table 5, where different combinations generated from the parameters will produce 258,048 variations. Three different working conditions are defined for the envelope according to the insulation thickness and thermal conductivity coefficient, as shown in Table 6.
A simulation analysis is performed in this study based on the parameter settings in Table 5 and Table 6, and a prediction model is established. The neural network model’s performance in the training set and validation set is demonstrated in Table 7, and the results show that the error of the neural network is controlled to an acceptable range. In total, 100 data sets are selected randomly from the test sets in the study for comparison with the prediction results of the neural network, thus visually demonstrating the prediction ability of the neural network model, and the results are shown in Figure 16, Figure 17, Figure 18 and Figure 19.

4.2. Analysis of Correlation between Architectural Design Parameters and Performance Indicators

Based on 10,000 sets of data obtained for each city during the stochastic simulation, IBM SPSS Statistics 24 is used in this study to analyze the Spearman’s rank correlation coefficient between the parameters and the building energy demand, with the results of the corresponding analysis shown in Table 8, Table 9, Table 10, Table 11 and Table 12. As can be seen from the table, for these four objective functions, the spacial form parameters of residential buildings in each typical city are generally higher than the window form parameters, because the Spearman’s rank correlation coefficient of the window form parameters in each typical city is generally lower than 0.2, i.e., the correlation between the four objective functions is extremely weak. Among the spacial form parameters of the building, the length-width ratio of the front elevation has a greater influence on the building energy demand, lighting environmental comfort, and global cost than on the indoor thermal environmental comfort while the number of floors has a much greater influence on the thermal environmental comfort than on the building energy demand, lighting environmental comfort, and global cost. There is a weak correlation between the standard floor height, and building energy demand and global cost, while the standard floor height has very little influence on the indoor lighting environmental comfort and indoor thermal environmental comfort. Unlike the above form parameters, the building orientation has an extremely weak influence on all four objective functions. Relative to the building form parameters (including the spatial form parameters and window form parameters), the envelope design parameters have an influence on the other three objective functions in addition to the lighting environmental comfort to different extents under different typical urban climatic conditions. Under the climatic conditions of Harbin, Beijing, and Shanghai, these parameters have the greatest influence on the building energy demand, and Spearman’s rank correlation coefficients in these 3 cities are respectively 0.851, 0.768, and 0.659, thus a strong correlation is established here. These parameters have the strongest correlation with global cost under the climatic conditions in Shenzhen, with a Spearman’s rank correlation coefficient of −0.407, and these parameters have the strongest impact on the thermal environmental comfort under the climatic conditions in Kunming, with a Spearman’s rank correlation coefficient of −0.768. In the latter paper, the design parameters that have a large impact are extracted for further study based on the analysis of Spearman’s rank correlation coefficient, in the context of the neglect of unimportant design parameters.

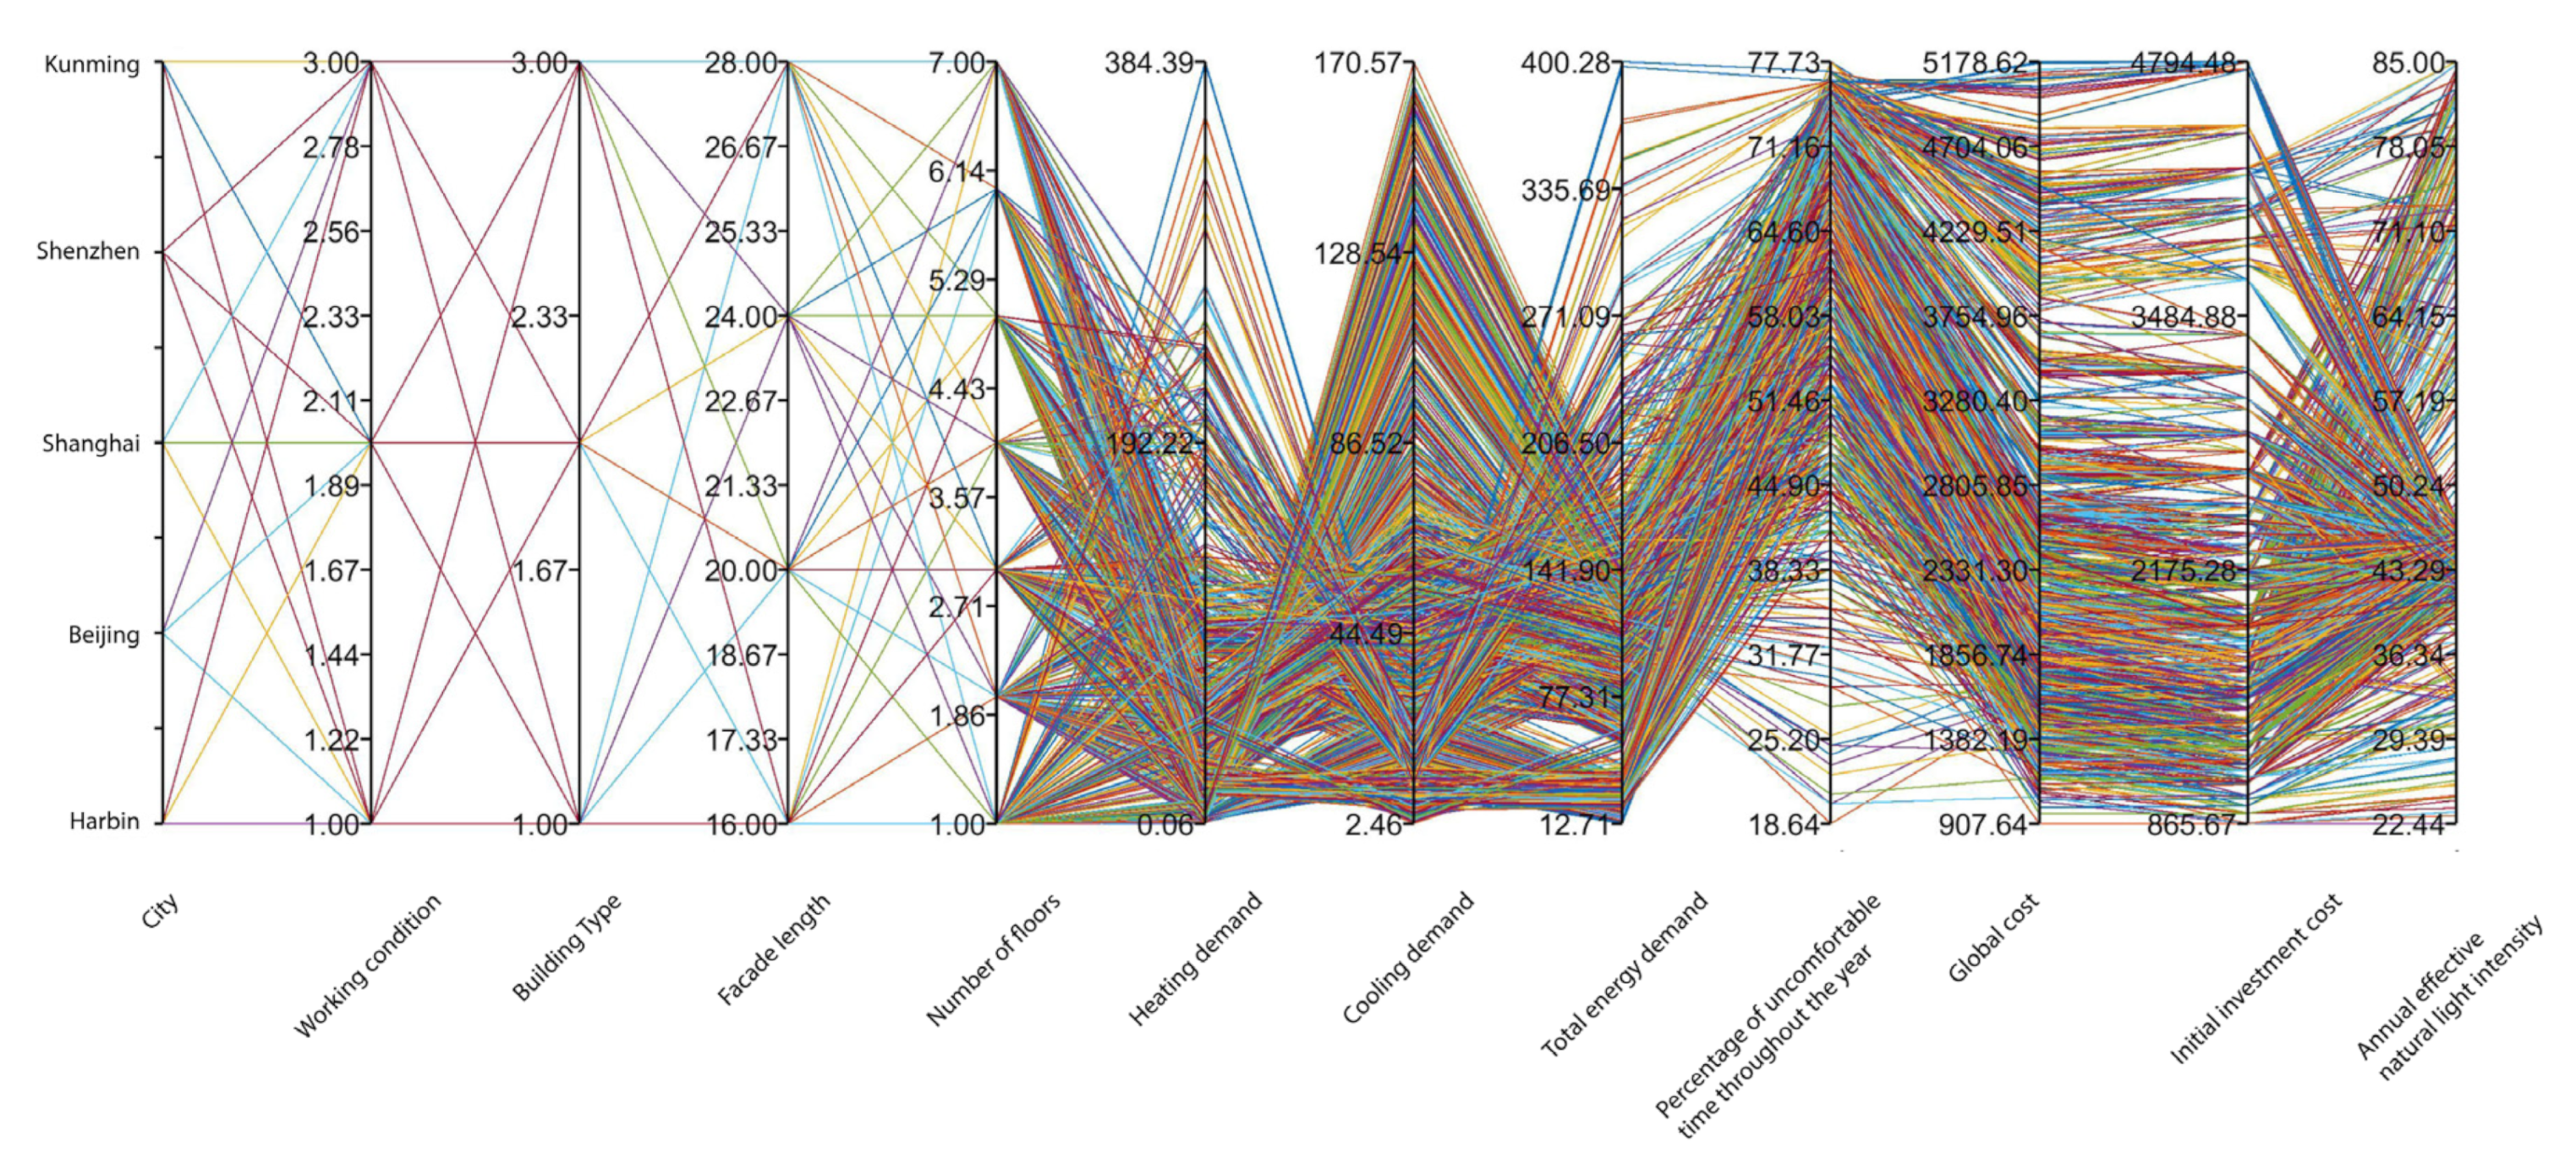
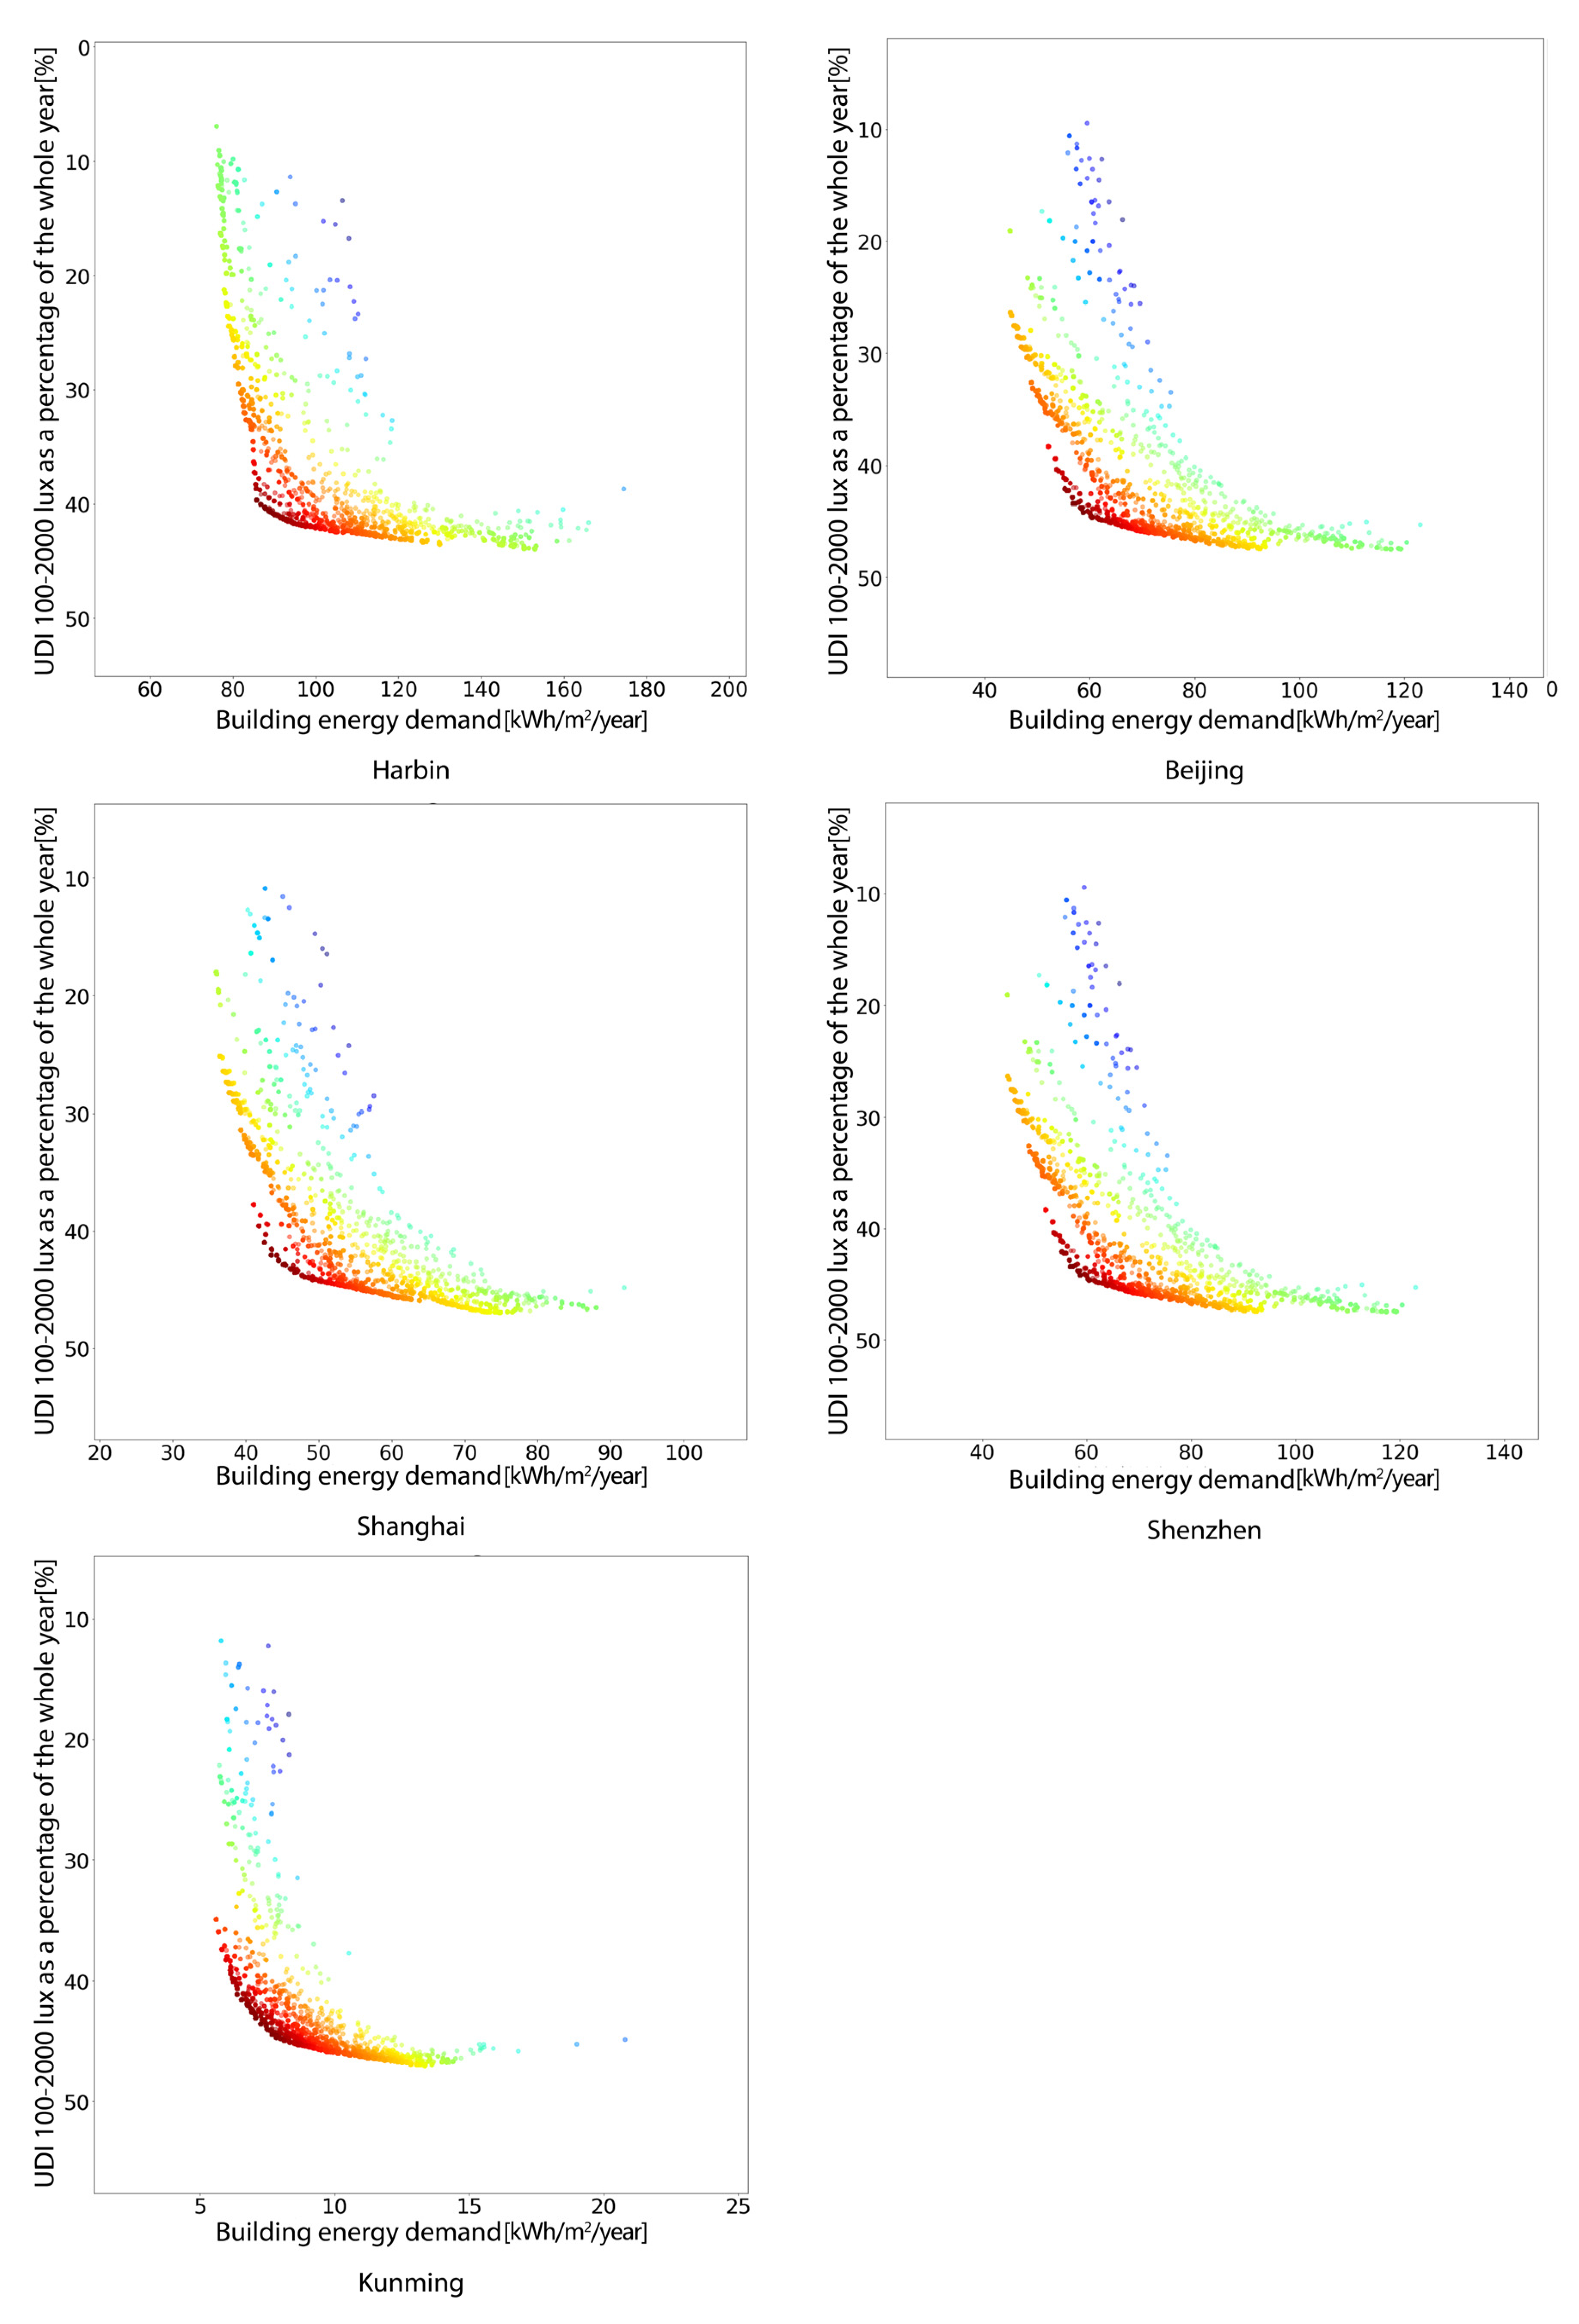
4.3. Analysis of Integrated Building Performance

Based on the above analyses of Spearman’s rank correlation coefficient, three different building form types are extracted from the integrated prediction model of building performance. The analysis priority is the design parameters, which have a great impact on the four objective functions, and the building performances of each building type, and the building form type parameters under different working conditions of the envelope and five typical urban climatic conditions are compared, as shown in Table 13 and Figure 20.
The simulation results obtained under the three working conditions based on the data in Table 13 are shown in Figure 21. The performance indicators of the parameter changes under each different building type are averaged in the study to facilitate the comparison of different building types and working conditions, with the data results shown in Table 14, Table 15 and Table 16.
In terms of the building energy demand, building form type 3 has the highest total energy demand for all working conditions, followed by building form type 2, and then by building form type 1, which has the lowest total energy demand. For all building types, except for building types 2 and 3 under the climatic conditions of Shenzhen, the total energy demand in working condition 3 is higher than that in working conditions 1 and 2, probably because the thickness of low insulating layers and the high thermal conductivity coefficient are more likely to facilitate building heat dissipation and energy efficiency under the climatic conditions of Shenzhen. In addition, different typical cities are compared, and under the climatic conditions in Harbin, the building heating demand is higher than the building cooling demand for all building form types under all working conditions; while under the climatic conditions in Shenzhen, the building cooling demand is higher than the building heating demand for all building form types under all working conditions. However, under the climatic conditions in Beijing, Shanghai, and Kunming, different building types and working conditions lead to the difference between the heating demand and cooling demand for residential buildings. Specifically, the cooling demand is higher than the heating demand for residential buildings in Beijing, Shanghai, and Kunming under working conditions 1 and 2, while the heating demand is higher than the cooling demand for residential buildings in Beijing, Shanghai, and Kunming under working condition 3.
It is found from the comparison of performance indicators of different building form types under different working conditions that the lighting environment comfort is the same for the same building type under the three working conditions, because the change of the envelope parameters has no effect on the effective natural lighting illuminance in the whole year. It is also found from the comparison of different building types that the indoor lighting environment of building type 1 is worse than that of the other two building types, while the indoor lighting environmental comfort of building type 2 is slightly better than that of building type 3, possibly due to the different building orientations of these two types.
In addition, there is a small difference between the thermal environmental comfort of different building types under the same working conditions, because there is a small effect of different building shape coefficients on the indoor thermal environment. For building type 1, the percentage of thermal environment discomfort time (in one year) under working condition 3 is lower than that under working condition 1 and working condition 2, while for building types 2 and 3, the percentage of thermal environment discomfort time (in one year) under working condition 3 is different from that under working condition 1 and working condition 2 under the climatic conditions of different cities. Under the climatic conditions of Harbin, the thermal environment comfort under working condition 3 is worse than that under working conditions 1 and 2, while in Beijing, Shanghai, Shenzhen, and Kunming, the thermal comfort under working condition 3 is better than that under working conditions 1 and 2.
For all building types, the initial investment cost and global cost of buildings under working condition 3 are lower than that under working conditions 1 and 2 while under all working conditions, the initial investment cost and global cost for building form types 3 and 2 are higher than that for building type 1.
An integrated building performance simulation framework is used in this study to compare the building energy demand (including the heating demand and cooling demand), lighting environmental comfort, thermal environmental comfort, and global cost within the setting of building form parameters and envelope design parameters. Meanwhile, it, as a reference database for the performance prediction of low-rise and medium-rise residential buildings under the climatic conditions of different cities, provides a powerful reference for architects’ energy efficiency design of low-rise and medium-rise residential buildings in different climate zones.

5. Discussion of Optimization Results

5.1. Optimization Results of form Design for Residential Buildings in Typical Cities

The best solution is gained in the study through the optimization of all design parameters based on the prediction model established in Section 4.1, with the SPEA-2 algorithm adopted. The darkest part in red marks the Pareto front, as shown in Figure 22. Table 7, Table 8, Table 9, Table 10, Table 11, Table 12, Table 13, Table 14, Table 15, Table 16, Table 17 and Table 18 show the values of design parameters and the corresponding optimization objective results for each city under different climatic conditions in the context of optimal building energy demand (i.e., minimum BED and optimal nZEB) and the optimal lighting environment (i.e., maximum percentage of time in one year for effective natural daylight illumination of 100 lx to 2000 lx, optimal UDI).
As can be seen from Table 17, the length of building front elevation for optimal energy efficiency of nZEB in each typical city is 28 m, i.e., the total energy demand of residential buildings in each typical city tends to decrease as the length of the front elevation increases while the length of the front elevation for residential buildings with optimal UDI is 16 m in cities excluding Harbin, and the length of the front elevation for residential buildings with optimal UDI in Harbin is 20 m. It is found from the length-width ratio of residential buildings in each typical city that the length-width ratio for residential buildings with optimal nZEB in typical cities excluding Kunming is 1, while the length-width ratio for residential buildings with optimal nZEB under climatic conditions of Kunming is 2. In addition, the length-width ratio for residential buildings with optimal UDI in each typical city is 2, a ratio that is more favorable for the lighting of the low floors of buildings. The floor No. with the optimal solution for residential buildings in each typical city also differs. The floor for residential buildings with optimal nZEB in Harbin, residential buildings with optimal UDI in Shenzhen, and residential buildings with optimal nZEB and UDI in Kunming is floor 7; while the floor for residential buildings with optimal UDI in Harbin and Beijing is floor 6; and the floor for residential buildings with optimal solutions in the remaining typical cities is floor 3. The optimal standard floor height in most cities is 2.7 m, showing that the total building energy demand increases as the standard floor height increases, so the standard of the lowest floor height should be adopted in most cities in order to reduce energy consumption. However, it is suggested that floor heights of 3.3, 3, and 3.3 m floor optimal UDI are adopted respectively in Harbin, Shenzhen, and Kunming to achieve the optimal lighting environmental comfort in the ground floors of the building. It is found from the optimal solution of the building orientation in each typical city in the table that when the length-width ratio is not 1, only the building orientations for optimal UDI in Harbin and Shenzhen are respectively suggested to be 90° and −45°. To achieve the optimal UDI of residential buildings in each typical city under other circumstances, the building orientation is suggested to be 0° (when the length-width ratio is 1, 90° of orientation and 0° of that overlap). It can be seen from the window-wall ratio parameters for optimal solutions (nZEB and UDI) of residential buildings in typical cities that, except for the optimal nZEB and UDI for residential buildings in Kunming, the optimal nZEB and UDI for residential buildings in other cities have a higher requirement for the window-wall ratio of the east, south, and north elevations, and a lower requirement for the window-wall ratio of the west elevation, while it is hoped that the window of the west elevation is higher than that of the east and south elevations in residential buildings in Kunming. For example, the window-wall ratio of the west elevation is suggested to be 0.35 for the optimal nZEB in the region, but that of the east, south, and north elevations is suggested to be 0.25. The window-wall ratio of the west elevation for optimal UDI is suggested to be 0.45, and the window-wall ratios of the east and south elevations (for optimal UDI) are suggested to be 0.35 and 0.25, respectively.
In general, the shape coefficients for optimal nZEB in the residential buildings of each typical city are small relative to that for optimal UDI, while the floor area ratio for optimal nZEB is large relative to that for optimal UDI. As mentioned above, under the condition that the heat transfer coefficient and window-wall ratio of each building envelope remain unchanged, the building energy consumption usually increases as the shape coefficient increases, i.e., a smaller shape coefficient means a smaller external surface area of the building, i.e., the fewer paths for energy loss represent a greater energy-efficiency significance. More considerations are given to the lighting environmental comfort of the ground floors of residential buildings in optimal UDI; therefore; the energy efficiency in optimal UDI is inferior to that in nZEB.
It is found from the comparison of the optimal performance indicators in Table 18 that there is a big difference between the total energy demand of optimal nZEB and that of optimal UDI for residential buildings in these typical cities, i.e., the total energy demand of optimal UDI is generally two times higher than the total energy demand of optimal nZEB. For example, the total energy demand of optimal UDI for residential buildings in Harbin is higher than that of optimal nZEB at 73.3 kWh/m2, and the total energy demand of optimal UDI for residential buildings in Beijing is higher than that of optimal nZEB at 41.9 kWh/m2, indicating that there is a great potential for the improvement of the energy efficiency of residential buildings in typical cities through the adjustment of building forms. Among the cities, Harbin has a greater potential for the improvement of the heating demand of residential buildings, and the heating demand for optimal nZEB is reduced by 62.1 kWh/m2 relative to that for optimal UDI, while there is a great potential for the improvement of the cooling demand of residential buildings in Shenzhen, where optimal nZEB is reduced by 70 kWh/m2 compared to the optimal UDI. The remaining cities have a more moderate potential for the improvement of the heating and cooling demands compared to Harbin and Shenzhen. It is found from the comparison of the lighting environmental comforts of the ground floors of residential buildings that there is a big difference between the percentages of the effective annual natural illuminance (100–2000 lx) in the whole year under these two optimal solutions for residential buildings in each typical city. For example, the percentage of effective annual natural illuminance in the whole year for optimal UDI is 36.6 higher than that for nZEB in the residential buildings of Harbin, and the percentage of effective annual natural illuminance in the whole year for optimal UDI is 28.4% higher than that that for nZEB in the residential buildings of Shenzhen. It can be seen that the improvement of the lighting environmental comfort in residential buildings is realized to a certain extent at the expense of the increase of the total building energy demand. While making design decisions, architects need to take into account the needs of different stakeholders for the target indicators, and to weigh the design requirements of different stakeholders.

5.2. Comparison of Sensitivity Analyses of Different Building Types

Based on the prediction model, the comparison of sensitivity analyses of some design parameters is conducted in the study on basis of the three building models (see Table 13) shown in Figure 20.
Figure 23 and Figure 24 respectively depict the relationship between the length of the front elevation and the building energy demand and the relationship between the length of the front elevation and lighting illuminance of the whole year in each of the three building types. Since there are four dimensions (including the length of the front elevation, city, building energy demand/effective lighting illuminance of the whole year, and building type) in the scatter diagrams in Figure 23 and Figure 24, for the convenience of analysis, they are decomposed according to the building types in Figure 25, and the effects of the length of the building front elevation on the building energy demand and effective lighting illuminance of the whole year under different climatic conditions of typical cities and different building types are compared respectively. The distribution of the relationship between the front elevation and building energy demand shows that the total energy demand of residential buildings in each typical city decreases slightly as the length of the front elevation increases. In addition, building type 1 has lower energy demand compared to the other two building types, possibly because building type 1 has a length-width ratio of 1, which makes the building shape coefficient smaller, while building type 3 has a slightly higher energy demand relative to building type 2, indicating that for the same building shape coefficient, the energy demand when the building orientation is 90° is higher than that when the building orientation is 0°. It is found from the analysis of the relationship between the length of the building elevation and the effective natural lighting illuminance of the whole year that as the length of the building elevation increases, the annual effective lighting illuminance of building type 2 and building type 3 remains generally stable but slightly fluctuates, while the effective lighting illuminance of building type 1 drops sharply. In addition, compared with building type 2 and 3, building type 1 has a worse indoor lighting environment.
Figure 26 and Figure 27 depict the relationship between the number of floors and the building energy demand and the relationship between the number of floors and the lighting illuminance of the whole year respectively for three building types. Since there are four dimensions (including the number of floors, city, building energy demand/effective lighting illuminance of the whole year, and building type) in the scatter diagrams in Figure 26 and Figure 27, for the convenience of analysis, they are decomposed according to the building types in Figure 28, and the effects of the number of floors on the building energy demand and effective lighting illuminance of the whole year under different climatic conditions of typical cities and different building types are compared respectively. It is found from the correlation between different numbers of floors and the building energy demand that as the number of floors changes, the energy demand of building type 1 is always lower than that of building types 2 and 3, and the energy demand of building type 3 is slightly higher than that of building type 2. It can be seen from the relationship between the number of floors and the lighting environmental comfort of ground floors for different building types that the lighting environmental comfort of ground floors for all three building types deteriorates to a certain extent as the number of floors increases, but the deterioration (of the lighting environmental comfort) of building type 1 is more obvious, and the lighting environmental comfort of type 1 is always lower than that of types 2 and 3.
It is found from the sensitivity analysis of the design parameters of residential building forms and the comparison of the design parameters and indicators of three different building types that the form design parameters have different degrees of influence on the building energy demand and the indoor lighting environmental comfort. The Chinese codes for energy efficiency in low-rise and medium-rise residential buildings mostly focus on the level of the building envelope, and there are fewer codes for the building shape, with only a rough specification of the building shape coefficients. However, the specific form parameters (like the length-width ratio and the length of the front elevation) under the same building shape coefficient are possibly very different. Although the loose building body is easily disturbed by the fluctuation of the outside temperature, the potential for natural lighting is improved. From building performance analysis based on the coupling of natural lighting and building energy consumption, a research conclusion, which is inconsistent with the conclusion obtained from conventional energy consumption simulation, is obtained, so the relationship between building form parameters and energy consumption needs further refinement.
It is worth noting that, in another article, we made a similar comparison of the building envelope design parameters of cities in different climate zones in the United States [45]. The optimal energy-saving design of typical buildings obtained was similar to that of cities in China. It can be seen that China and the United States have similar latitudes, and the differences in temperature and humidity between different climate zones are also similar, resulting in similar building performances. However, due to the different urbanization developments in China and the United States, the building types are quite different, which need to be further discussed in future studies.
In terms of the sensitivity analysis of building design parameters in the different Chinese climate zones, we provided a more detailed discussion on cities in sub-climate zones in our previous article [46]. However, this article mainly discussed the impact of future climate change on the performance of residential buildings in different Chinese climate zones, but it did not consider the differences in building typology. Besides, the sensitivity analysis of the design parameters in that paper was also relatively basic. In contrast, this article subdivided the design parameters that affect the performance of the building, and established a real-time feedback platform to make the results more intuitive.

5.3. Limitation and Outlook

Carrying out research on the energy efficiency design of low- and medium-rise residential buildings from the perspective of an architectural designer is complex and systematic work. This article formulated design strategies, energy-saving integrated design methods, and tools for residential buildings in five cities in different climate zones in China, and achieved certain results. However, due to some limitations, such as professional background, data sources, and research techniques, there are still the following tasks that need to be further improved and expanded:
(1)
The performance model of mid-rise and low-rise residential buildings established in this paper does not consider the impact of the urban environment where the building is located on the simulation. Surrounding architectural factors, such as whether the building is located in a relatively isolated new urban area or a densely constructed urban center, will affect the available sunlight and lighting resources for the target building. These factors need to be expanded in future research work.
(2)
In order to simplify the problem, this article focused on the architectural space and envelope design variables. These variables constitute the most basic building performance influencing factors but also have limitations. The style of exterior windows and the use of renewable energy still need to be expanded and analyzed in order to more fully grasp the influencing factors of building performance.
(3)
This article focused on the development principles, ideas, and process of sensitivity analysis tools in energy-saving integrated design tools. At present, this tool is relatively simple. In the future, computer languages need to be used to realize the automatic calculation of a larger amount of energy consumption simulation data to enrich the tools.
The analytical methods proposed in this paper can be applied to general design studies on building climate adaptability. Based on the established study results, the following three points in the paper can be gradually improved in the subsequent studies.
(1)
Further refinement of study of the performance parameters
In this study, limited by the computational length and computational resources, the design parameters of the building body were mainly discussed in the section of climate adaptability optimization comparison. In the subsequent studies, the control of outdoor microenvironmental parameters of buildings, like the influence of external vegetation and outdoor thermal environmental comfort, will be discussed to determine the optimal size and location of outdoor open spaces, thus providing good microclimate design strategies for residential buildings, and verifying the applicability and scalability of the research framework of the paper.
(2)
Improvement of the multi-objective optimization framework
Four different objective functions in the multi-objective optimization framework established in this paper based on different design scales, include building energy demand, lighting environmental comfort (effective natural lighting illuminance of the whole year), thermal environmental comfort (percentage of uncomfortable time of the whole year), and building life cycle cost. However, in actual building projects, the climate adaptability design of buildings is more complex and possibly restricted by the sound environment, wind environment, local policies, and social development. Therefore, the established multi-objective optimization framework needs to be further improved in future studies, thus taking more objective functions into the consideration, and systematically considering and analyzing the climate adaptability design of buildings from a more comprehensive perspective.
(3)
More residential building types are analyzed, and a library of decision cases is built
The specificity of energy-efficient building design is more obvious. The established guidelines for green building design are usually established based on top-down experience, and it is usually difficult to achieve the expected results. In this study, only a few types of relatively common residential buildings, which tend to be analyzed repeatedly in typical cities, among many residential building types, were selected for optimization and comparison. Based on a series of parametric analysis methods proposed in this study, many different residential building objects will be studied in depth; more residential building types will be considered; a case base of design and retrofitting decisions for different residential building types will be set up; and bottom-up supporting design tools will be made in the future.

6. Conclusions

The main research aim of the paper was to explore climate adaptability design strategies of buildings with a series of parametric simulation methods, and to summarize a method for climate adaptability design of residential buildings oriented to the schematic stage. Grasshopper, a parametric analysis platform commonly used in building design, was combined with EnergyPlus, building energy simulation software, in this study to integrate building design parameters and operational parameters. An integrated and passive parametric design process, which features low energy consumption, low cost, and high comfort, was constructed in the schematic design stage, involving the establishment of a typicality analysis model, sensitivity analysis of the parametric model, and multi-objective optimization based on performance simulation. This process was applied and analyzed in five typical cities in different climate zones in China.
In this study, an integrated evaluation model of building form design parameters and envelope design parameters was established, with a comparison of the performance indicators of low-rise and medium-rise residential buildings under five climatic conditions for three different building types and three envelope working conditions. The change rules were summarized for the lighting environment, thermal environment, building energy demand, and life cycle cost of residential buildings in each city under different form parameters and envelope design parameters in this study. The following conclusion can be drawn from this study:
(1)
Due to the vast land area of China, the geographical locations of typical cities are farther apart, and the optimal design of residential buildings energy demand in typical cities is quite different, which gradually increases from south to north.
(2)
Comparing the percentage of discomfortable time of the year of typical residential buildings in each city, it can be seen that the typical cities in northern China are too cold in winter, which makes them less comfortable in the thermal environment compared with residential buildings in southern cities.
(3)
The global cost and initial investment cost of the optimal design of residential buildings in typical cities in China basically showed a trend of gradually increasing from south to north.
This paper used digital tools, internationally widely used professional simulation software, and multi-objective optimization algorithms to create a systematic parametric analysis process, which can effectively carry out building climate adaptability design in the preliminary design stage. Meanwhile, it sorted out the optimization design parameters, which are mainly divided into building form design parameters and envelope design parameters. The purpose of this research was to provide architects with indicators and references for the integrated design and data models that can be used for the design of low- and medium-rise residential buildings in different climate zones in China.
This research has advanced the degree of refined analysis of climate adaptability optimization design. The design of building climate adaptability involves many different variables, such as the shape of the building, the operation mode of the building, and the number of residents. Different variables will affect each other, thus forming a systematic and complex whole. Currently, the main purpose of energy-saving design standards is to delineate an upper limit for building energy efficiency from different aspects of building design, construction, and operation, and to frame a general range of energy-saving indicators from a technical level, but they have not systematically considered built-environmental performance indicators in different design scenarios. The “Input-Output” feedback platform proposed by this research provides a quantitative analysis method for the design decisions of the public sector and private households from multiple perspectives. At the same time, through the comparison of performance indicators, it can summarize the energy-saving design laws of typical residential buildings under different climatic conditions.
Furthermore, the following conclusions can also be obtained for the integrated multi-objective optimization method and a series of parametric operational processes in the study.
(1)
Parametric design and analysis platform can effectively assist designers in the pre-design stage with the analysis and evaluation of different proposals, thus advancing the development of sustainable building design.
(2)
The parameters of building climate adaptability analysis in the schematic design stage can be divided into spatial form design parameters and envelope design parameters.
(3)
If the light and thermal comfort requirements of space users are met, life cycle cost is saved, and environmental benefits are achieved for low-energy buildings, a multiple-objective optimization needs to be conducted in the schematic design stage. Additionally, parametric models for different solution scenarios can be analyzed and explored with different dimensions of data, thus facilitating a deeper understanding of the building performance.

Author Contributions

In this paper, Z.L. performed the experiment, including conceptualization, simulation, calculation, and data visualization. Y.Z. and M.T. reviewed it. Z.Z. refined the diagram, Y.Y. wrote and edited it. All authors (Z.L., M.T., Y.Z., Z.Z. and Y.Y.) organized the paper structure. All authors have read and agreed to the published version of the manuscript.

Funding

This research was funded by Humanities and Social Sciences Fund of Zhejiang Education Department, grant number Y202146952.

Acknowledgments

The author gratefully acknowledges the editors and referees for their positive and constructive comments in the review process.

Conflicts of Interest

The authors declare no conflict of interest. The authors declare that they have no known competing financial interests or personal relationships that could have appeared to influence the work reported in this paper.

Nomenclature

UDIUseful Daylight Illuminance
BEDBuilding Energy Demand
EPBDEnergy Performance of Building Directive
GCGlobal Cost
ANNArtificial Neural Network
WWRWindow-Wall Ratio
DHDiscomfort Hours
ICInvestment Cost
nZEBNear Zero Energy Building (in this paper, it just mean to the lowest building energy demand design option rather than achieving the standard of nZEB requirement.)

References

  1. Jiang, J. China’s urban residential carbon emission and energy efficiency policy. Energy 2016, 109, 866–875. [Google Scholar] [CrossRef]
  2. Hu, S.; Yan, D.; Guo, S.; Cui, Y.; Dong, B. A survey on energy consumption and energy usage behavior of households and residential building in urban China. Energy Build. 2017, 148, 366–378. [Google Scholar] [CrossRef]
  3. Alsousi, M. User Response to Energy Conservation and Thermal Comfort of High-Rise Residential Buildings in Hot Humid Region with Referring to Gaza. Ph.D. Thesis, University of Nottingham, Nottingham, UK, 2005. [Google Scholar]
  4. Ghisi, E.; Massignani, R.F. Thermal performance of bedrooms in a multi-storey residential building in southern Brazil. Build. Environ. 2007, 42, 730–742. [Google Scholar] [CrossRef]
  5. Karynon, T.H. Report on Thermal Comfort and Building Energy Studies in Jakarta. J. Build. Environ. 2000, 35, 77–90. [Google Scholar] [CrossRef]
  6. Jürgen, S.; Wolfgang, F.; Ludwig, R. Passive Houses for different climate zones. Energy Build. 2015, 105, 71–87. [Google Scholar]
  7. Fabrizio, A.; Nicola, B.; Gerardo, M.M.; Davide, F.N. Building envelope design: Multi-objective optimization to minimize energy consumption, global cost and thermal discomfort. Application to different Italian climatic zones. Energy 2019, 174, 359–374. [Google Scholar]
  8. Martinelli, L.; Matzarakis, A. Influence of height/width proportions on the thermal comfort of courtyard typology for Italian climate zones. Sustain. Cities Soc. 2017, 29, 97–106. [Google Scholar] [CrossRef]
  9. Guan, L. Preparation of future weather data to study the impact of climate change on buildings. Build. Environ. 2009, 44, 793–800. [Google Scholar] [CrossRef]
  10. Rosenthal, D.H.; Gruenspecht, H.K.; Moran, E.A. Effects of global warming on energy use for space heating and cooling in the United States. Energy J. 1995, 16. [Google Scholar] [CrossRef]
  11. Christenson, M.; Manz, H.; Gyalistras, D. Climate warming impact on degree-days and building energy demand in Switzerland. Energy Convers. Manag. 2006, 47, 671–686. [Google Scholar] [CrossRef]
  12. Cox, R.A.; Drews, M.; Rode, C.; Nielsen, S.B. Simple future weather files for estimating heating and cooling demand. Build. Environ. 2015, 83, 104–114. [Google Scholar] [CrossRef] [Green Version]
  13. Larsen, M.A.D.; Petrović, S.; Radoszynski, A.; McKenna, R.; Balyk, O. Climate change impacts on trends and extremes in future heating and cooling demands over Europe. Energy Build. 2020, 226, 110397. [Google Scholar] [CrossRef]
  14. Cellura, M.; Guarino, F.; Longo, S.; Tumminia, G. Climate change and the building sector: Modelling and energy implications to an office building in southern Europe. Energy Sustain. Dev. 2018, 45, 46–65. [Google Scholar] [CrossRef]
  15. Belcher, S.E.; Hacker, J.N.; Powell, D.S. Constructing design weather data for future climates. Build. Serv. Eng. Res. Technol. 2005, 26, 49–61. [Google Scholar] [CrossRef]
  16. Jentsch, M.F.; Bahaj, A.S.; James, P.A. Climate change future proofing of buildings—Generation and assessment of building simulation weather files. Energy Build. 2008, 40, 2148–2168. [Google Scholar] [CrossRef]
  17. Jentsch, M.F.; James, P.A.; Bourikas, L.; Bahaj, A.S. Transforming existing weather data for worldwide locations to enable energy and building performance simulation under future climates. Renew. Energy 2013, 55, 514–524. [Google Scholar] [CrossRef]
  18. Sabunas, A.; Kanapickas, A. Estimation of climate change impact on energy consumption in a residential building in Kaunas, Lithuania, using HEED Software. Energy Procedia 2017, 128, 92–99. [Google Scholar] [CrossRef]
  19. Asimakopoulos, D.; Santamouris, M.; Farrou, I.; Laskari, M.; Saliari, M.; Zanis, G.; Giannakidis, G.; Tigas, K.; Kapsomenakis, J.; Douvis, C. Modelling the energy demand projection of the building sector in Greece in the 21st century. Energy Build. 2012, 49, 488–498. [Google Scholar] [CrossRef]
  20. Lush, D.; Butcher, K.; Appleby, P. Environmental Design: CIBSE Guide A; The Chartered Institution of Building Services Engineers: London, UK, 2006. [Google Scholar]
  21. Ramallo-González, A.P. Modelling, Simulation and Optimisation Methods for Low-Energy Buildings. Ph.D. Thesis, University of Exeter, Stocker, UK, 2013. [Google Scholar]
  22. Shi, L.; Zhang, Y.; Wang, Z.; Cheng, X.; Yan, H. Luminance parameter thresholds for user visual comfort under daylight conditions from subjective responses and physiological measurements in a gymnasium. Build. Environ. 2021, 205, 108187. [Google Scholar] [CrossRef]
  23. Zhang, S.-C.; Yang, X.-Y.; Xu, W.; Fu, Y.-J. Contribution of nearly-zero energy buildings standards enforcement to achieve carbon neutral in urban area by 2060. Adv. Clim. Chang. Res. 2021, 12, 734–743. [Google Scholar] [CrossRef]
  24. Aslanoğlu, R.; Kazak, J.K.; Yekanialibeiglou, S.; Pracki, P.; Ulusoy, B. An international survey on residential lighting: Analysis of winter-term results. Build. Environ. 2021, 206, 108294. [Google Scholar] [CrossRef]
  25. Wang, L.; Lee, E.W.; Hussian, S.A.; Yuen, A.C.Y.; Feng, W. Quantitative impact analysis of driving factors on annual residential building energy end-use combining machine learning and stochastic methods. Appl. Energy 2021, 299, 117303. [Google Scholar] [CrossRef]
  26. Balali, A.; Valipour, A. Prioritization of passive measures for energy optimization designing of sustainable hospitals and health centres. J. Build. Eng. 2020, 35, 101992. [Google Scholar] [CrossRef]
  27. Nabil, A.; Mardaljevic, J. Useful daylight illuminances: A replacement for daylight factors. Energy Build. 2006, 38, 905–913. [Google Scholar] [CrossRef]
  28. ANSI; ASHRAE. Standard 55: Thermal Environmental Conditions for Human Occupancy; American Society of Heating Refrigerating and Air Conditioning Engineers: Atlanta, GA, USA, 2013. [Google Scholar]
  29. Fanger, P.O. Thermal Comfort: Analysis and Applications in Environmental Engineering; McGraw-Hill Book Company: New York, NY, USA, 1970. [Google Scholar]
  30. Auliciems, A. Towards a psycho-physiological model of thermal perception. Int. J. Biometeorol. 1981, 25, 109–122. [Google Scholar] [CrossRef]
  31. Nancy, C.R. Building Design and Human Performance; Van Nostrand: New York, NY, USA, 1989; pp. 71–88. [Google Scholar]
  32. Peeters, L.; de Dear, R.J.; Hensen, J.; D’haeseleer, W. Thermal comfort in residential buildings: Comfort values and scales for building energy simulation. Appl. Energy 2009, 86, 772–780. [Google Scholar] [CrossRef] [Green Version]
  33. ASHRAE. Handbook Fundamentals; American Society of Heating, Refrigerating and Air-Conditioning Engineers: Atlanta, GA, USA, 2009. [Google Scholar]
  34. Pedersen, C.O.; Fisher, D.E.; Liesen, R.J. Development of a Heat Balance Procedure for Calculating Cooling Loads; ASHRAE Transaction: Atlanta, GA, USA, 1997. [Google Scholar]
  35. Walton, G.N. Thermal Analysis Research Program Reference Manual; National Bureau of Standards: Gaithersburg, MD, USA, 1983. [Google Scholar]
  36. European Committee for Standardization CEN/TR 15615. Explanation of the General Relationship between Various European Standards and the Energy Performance of Building Directive (EBPD); Umbrella Document; European Committee for Standardization (CEN): Tallinn, Estonia, 2008. [Google Scholar]
  37. EN 15459: Energy Performance of Buildings. Economic Evaluation Procedure for Energy Systems in Buildings; European Committee for Standardization (CEN): Tallinn, Estonia, 2007. [Google Scholar]
  38. Magnier, L.; Haghighat, F. Multiobjective optimization of building design using trnsys simulations, genetic algorithm, and artificial neural network. Build. Environ. 2010, 45, 739–746. [Google Scholar] [CrossRef]
  39. Asadi, E.; da Silva, M.G.; Antunes, C.H.; Dias, L.; Glicksman, L. Multi-objective optimization for building retrofit: A model using genetic algorithm and artificial neural network and an application. Energy Build. 2014, 81, 444–456. [Google Scholar] [CrossRef]
  40. Yu, W.; Li, B.; Jia, H.; Zhang, M.; Wang, D. Application of multi-objective genetic algorithm to optimize energy efficiency and thermal comfort in building design. Energy Build. 2015, 88, 135–143. [Google Scholar] [CrossRef]
  41. Roman, N.D.; Bre, F.; Fachinotti, V.D.; Lamberts, R. Application and characterization of metamodels based on artificial neural networks for building performance simulation: A systematic review. Energy Build. 2020, 217, 109972. [Google Scholar] [CrossRef]
  42. Buratti, C.; Orestano, F.C.; Palladino, D. Comparison of the Energy Performance of Existing Buildings by Means of Dynamic Simulations and Artificial Neural Networks. Energy Procedia 2016, 101, 176–183. [Google Scholar] [CrossRef]
  43. Zhu, Y.; Newbrook, D.W.; Dai, P.; de Groot, C.K.; Huang, R. Artificial neural network enabled accurate geometrical design and optimisation of thermoelectric generator. Appl. Energy 2022, 305, 117800. [Google Scholar] [CrossRef]
  44. Timilsina, G.R.; Pang, J.; Xi, Y. Enhancing the quality of climate policy analysis in China: Linking bottom-up and top-down models. Renew. Sustain. Energy Rev. 2021, 151, 111551. [Google Scholar] [CrossRef]
  45. Li, Z.; Genovese, P.V.; Zhao, Y. Study on Multi-Objective Optimization-Based Climate Responsive Design of Residential Building. Algorithms 2020, 13, 238. [Google Scholar] [CrossRef]
  46. Zou, Y.; Xiang, K.; Zhan, Q.; Li, Z. A simulation-based method to predict the life cycle energy performance of residential buildings in different climate zones of China. Build. Environ. 2021, 193, 107663. [Google Scholar] [CrossRef]
Figure 1. Location of typical cities in China.
Energies 14 08223 g001
Figure 2. Multi-objective optimization method integrating design parameters of different parts.
Energies 14 08223 g002
Figure 3. Parametric building optimization process.
Energies 14 08223 g003
Figure 4. Schematic diagram of data sampling for the decision space and target space involved in multi-objective optimization.
Energies 14 08223 g004
Figure 5. Metamodel-based optimization method and optimization method based on classical simulation.
Energies 14 08223 g005
Figure 6. Structure of the neuron network of BP algorithms.
Energies 14 08223 g006
Figure 7. Zoning map of building climate zones in China.
Energies 14 08223 g007
Figure 8. Location of Tianjin Tianbao Gold Coast Community.
Energies 14 08223 g008
Figure 9. Actual photos of Tianjin Tianbao Gold Coast Community.
Energies 14 08223 g009
Figure 10. Distribution of residential types in Tianjin Tianbao Gold Coast Community.
Energies 14 08223 g010
Figure 11. The two-dimensional planning of Tianjin Tianbao Gold Coast Community.
Energies 14 08223 g011
Figure 12. Baseline model.
Energies 14 08223 g012
Figure 13. Factors in parametric modeling of residential buildings.
Energies 14 08223 g013
Figure 14. Modeling logic of the Grasshopper platform.
Energies 14 08223 g014
Figure 15. Process description of Grasshopper.
Energies 14 08223 g015
Figure 16. Prediction model of building energy demand.
Energies 14 08223 g016
Figure 17. Prediction model of indoor lighting environmental comfort.
Energies 14 08223 g017
Figure 18. Prediction model of indoor thermal environmental comfort.
Energies 14 08223 g018
Figure 19. Prediction model for building global cost.
Energies 14 08223 g019
Figure 20. Three changes in building form types.
Energies 14 08223 g020
Figure 21. Simulation results of 3 building forms under 3 envelope working conditions and 5 typical urban climatic conditions.
Energies 14 08223 g021
Figure 22. Multi-objective optimization results for each typical city.
Energies 14 08223 g022
Figure 23. Relationship between the length of the front elevation and the building energy demand.
Energies 14 08223 g023
Figure 24. Relationship between the length of the front elevation and the effective lighting illuminance of the whole year.
Energies 14 08223 g024
Figure 25. Relationship between the length of the front elevation and the energy demand (left) and relationship between the length of the front elevation and lighting environmental comfort (right) for three building types.
Energies 14 08223 g025
Figure 26. Relationship between the number of floors and the building energy demand.
Energies 14 08223 g026
Figure 27. Relationship between the number of floors and the effective lighting illuminance of the whole year.
Energies 14 08223 g027
Figure 28. Relationship between the number of floors and the building energy demand (left) and the relationship between the number of floors and the lighting environmental comfort (right) for three building types.
Energies 14 08223 g028
Table 1. Static lighting environment evaluation index.
IndexProsCons
DFIt is easy to calculate and suitable for regulation control
  • Based on the CIE full overcast sky model, the climate condition of the building is not considered;
  • The building type, orientation, and location are not considered;
  • Only considering the most unfavorable situation, it is impossible to evaluate the illuminance which meets the standard
  • The influence of glare or auxiliary lighting system (such as shading) cannot be evaluated
U0It is simple, easy to calculate and suitable for regulatory control
  • The illumination uniformity of the space environment can only be evaluated simply;
  • Artificial lighting and natural lighting are evaluated separately, so the overall performance cannot be considered
UGRAvoid direct glare and ensure the quality of artificial lightingThe discomfort glare index used is static and only for artificial lighting
Scope of ViewEmphasis on the importance of the scope of vision
  • The way and quality of viewing scope are not considered;
  • The building typology, orientation, and location are not considered;
  • Unable to evaluate auxiliary lighting system (such as shading)
Table 2. Dynamic lighting environment evaluation index.
IndexProposerConceptCharacteristic
DAReinhart and
Walkenhorst (2001)
Percentage of cumulative time that can meet the minimum illuminance requirement by relying solely on daylighting in the whole year’s working hours
  • The index of the whole year is good
  • Considering different sky types, it can be used for CIE and PEREZE, and applicable is good
  • There is only lower limit and glare is not considered
UDIMardaljevic and
Nabil (2005)
Percentage of cumulative time during the whole year’s working hours with daylight illuminance between 100–2000 lx
  • The step length of the whole year is 1 h
  • Reflect energy saving potential, suitable for lighting energy consumption evaluation
  • Reflect the level of uncomfortable natural lighting and control glare
DAconRogers (2006)Use a trade-off coefficient to consider the part where the daylight illuminance is less than the minimum design illuminanceMake up for the defect that DA ignores the illumination below the lower limit, and use the trade-off coefficient method to supplement the energy-saving contribution of the illuminance value below the lower limit
Table 3. Typical cities selected according to building climate zoning.
Climate ZoneTypical CityHeating Degree Day (18 °C)Heating Period (Day/Month)Heating Hours Per Day
Severe cold area IHarbin≥380020/10 to 15/424 h
Cold region IIBeijing2000–379915/11 to 31/324 h
Hot summer and cold winter area IIIShanghai700–1999There is no mandatory requirement-
Hot summer and warm winter area IVShenzhen<500There is no mandatory requirement
(according to the actual demand, heating time is not set in the simulation)
-
Temperate region VKunming<2000There is no mandatory requirement
(however, it is set to 15/12 to 1/3 in the simulation according to the actual demand)
-
Table 4. Parameters of the baseline model.
TypeSubcategoryParameter CategoryUnitBaseline Model
LocationClimateClimate data-Tianjin
Building form parametersBuilding typeNumber of floors-5.00
Net height of per floorm3.00
Total height of per floorm3.00
Width (S/N direction)m14.7
Width to length ratio-1.76
Window-wall ratio (WWR)-0.394 (South)
0.258 (North)
0.227 (total)
Orientationdeg0
Geometry parametersVolume4948.6
Total exterior area1526.6
Area of all floors1566
Shape coefficient-0.308
Design parameters of building envelopeBuilding envelopeheating transmittance of external wall (average value)W/(m2K)0.56
Ground floor heating transmittance (average value)W/(m2K)0.46
Roof heating transmittance (average value)W/(m2K)0.71
Window heating transmittance (average value)W/(m2K)3.30
Solar heat gain coefficient (shading coefficient)-0.60
Building operating parametersBehaviorIndoor heat gain (lighting, appliances and occupancy rate, daily average)W/m25
Control and operation settingsHeating set point temperature°C20
Cooling set point temperature°C26
Air change rate (airtightness and ventilation)vol/h0.8
Timetable—Option 1: IG/VE/H/C *N. 0
Timetable—Option 2: IG/VE/H/C *N. 0/0/1/2
* IG: Indoor heat gain, VE: Ventilation, H: Heating, C: Cooling.
Table 5. Setting for optimal design parameters of building forms.
Direct Control Parameters
ClassificationNumberDesign VariablesUnitStep Size Value
Parameters of spatial formsA1Length of building front elevationm16;20;24;28
A2length-width ratio-2;1.5;1
A3Number of floors-1;2;3;4;5;6;7
A4Standard floor heightm2.7;3;3.3
A5Building orientation°−45;0;45;90
Parameters of window formsB1Window-wall ratio of east elevation%25;35;45;55
B2Window-wall ratio of west elevation%25;35;45;55
B3Window-wall ratio of south elevation%25;35;45;55
25;35;45;55Window-wall ratio of north elevation%25;35;45;55
Indirect impact parameters
Building widthm8;10;10.67;12;13.33;14;16;18.67;20;24;28
Building shape coefficient-0.085–0.589
(48 variations in total)
Floor area ratio%0.08–3.43
(61 variations in total)
Table 6. Three types of parameter settings of working conditions for the building envelope of low-rise and medium-rise residential buildings.
NDesign VariablesWorking Condition 1
(Thickness of High Insulating Layers, Low Thermal Conductivity Coefficient)
Working Condition 2
(Thickness of Medium Insulating Layers, Medium Thermal Conductivity Coefficient)
Working Condition 3
(Thickness of Low Insulating Layers, High Thermal Conductivity Coefficient)
1Solar radiation absorption rate of exterior wall surface [-]0.250.250.25
2Solar radiation absorption rate of the roof surface [-]0.40.40.4
3Thickness of external wall insulating layers [m]0.120.060
4Thickness of roof insulating layers [m]0.120.060
5Thickness of ground insulating layers [m]0.120.060
6Thickness of exterior brickworks [m]0.40.350.25
7Thermal conductivity coefficient of exterior brickworks [W/mK]0.250.50.9
Density of exterior brickworks [Kg/m3]60014002000
8Thickness of roof brickworks [m]0.40.350.25
9Thermal conductivity coefficient of roof brickworks [W/mK]0.250.50.9
Density of roof brickworks [Kg/m3]60014002000
10Thickness of floor brickworks [m]0.40.350.25
0.4Ground thermal conductivity coefficient [W/mK]0.250.50.9
Density of floor brickworks [Kg/m3]60014002000
12Window type [-]Double glazing, argon gas filled, low emissivity coating, PVC frame
(U = 1.90 W/m2K, SHGC = 0.69, initial investment cost = 1989 ¥/m2)
Table 7. Fitting degree of the neural network prediction model.
MAEMSER2
Training setBuilding energy demand0.1530.0180.997
Lighting environment (UDI indicator)0.0470.0071.000
Thermal environment (DH indicator)0.2610.2030.996
Global cost0.0890.0120.999
Test setBuilding energy demand0.2410.1250.939
Light environment (UDI index)0.0590.0780.992
Thermal environment (DH indicator)0.0380.0680.993
Global cost0.1840.1130.941
Table 8. Comparison of Spearman’s rank correlation coefficients of the design parameters of building forms in Harbin.
ClassificationNumberDescriptionHarbin
(Severe Cold Region I)
BED *UDI *DH *GC *
Correlation CoefficientSignificanceCorrelation CoefficientSignificanceCorrelation CoefficientSignificanceCorrelation CoefficientSignificance
Spatial form parametersA1Length of building front elevation−0.2720.000−0.6690.000−0.2390.000−0.5620.000
A2Length-width ratio0.3580.0000.3870.0000.1920.0000.4250.000
A3Number of floors−0.1080.013−0.1030.0180.0180.000−0.5810.000
A4Standard floor height0.2290.0000.0160.7130.0130.7630.2560.000
A5Building orientation0.0400.3630.0200.6390.0480.2740.0560.201
Window form parametersB1Window-wall ratio of east elevation 0.0830.0570.0060.888−0.0180.6770.0760.082
B2Window-wall ratio of west elevation0.0280.5240.0120.7840.0010.9760.0380.380
B3Window-wall ratio of south elevation0.0470.2800.1670.0000.0080.8550.0740.089
B4Window-wall ratio of north elevation0.0430.321−0.0580.1870.0530.2240.0820.059
Envelope design parametersC1Type of working conditions0.8510.0000.0220.6120.1990.000−0.0890.041
BED *: Building Energy Demand, UDI *: Useful Daylight Illuminance 100–2000 lx, DH *: Discomfort Hours, GC *: Global Cost.
Table 9. Comparison of Spearman’s rank correlation coefficients for the design parameters of building forms in Beijing.
ClassificationNumberDescriptionBeijing
(Cold Region II)
BED *UDI *DH *GC *
Correlation CoefficientSignificanceCorrelation CoefficientSignificanceCorrelation CoefficientSignificanceCorrelation CoefficientSignificance
Spatial form parametersA1Length of building front elevation−0.3360.000−0.4610.000−0.1090.006−0.5480.000
A2Length-width ratio0.0000.0000.2470.0000.0240.5530.3880.000
A3Number of floors−0.0910.022−0.058−0.058−0.9080.000−0.5250.000
A4Standard floor height0.2220.0000.0000.1260.0070.8640.2580.000
A5Building orientationBuilding orientation0.6920.0030.943−0.0100.800−0.0310.434
Window form parametersB1Window-wall ratio of east elevation−0.0740.0620.0230.5580.0310.4330.0270.496
B2Window-wall ratio of west elevation 0.0320.415−0.0110.7900.0170.6690.0120.758
B3Window-wall ration of south elevation0.0560.1600.0380.344−0.0560.1570.0370.355
B4Window-wall ration of north elevation−0.0130.748−0.0330.4040.0160.6900.0680.089
Envelope design parametersC1Type of working conditions0.7680.000−0.0040.924−0.1970.000−0.2930.000
BED *: Building Energy Demand, UDI *: Useful Daylight Illuminance 100–2000 lx, DH *: Discomfort Hours, GC *: Global Cost.
Table 10. Comparison of Spearman’s rank correlation coefficient of the design parameters of building forms in Shanghai.
ClassificationNumberDescriptionShanghai
(Hot-Summer and Cold-Winter Region III)
BED *UDI *DH *GC *
Correlation CoefficientSignificanceCorrelation CoefficientSignificanceCorrelation CoefficientSignificanceCorrelation CoefficientSignificance
Spatial form parametersA1Length of building front elevation−0.4530.0000.0000.000−0.1250.002−0.5330.000
A2Length-width ratio0.3280.0000.5300.0000.0780.0780.4580.000
A3Number of floors−0.0930.020−0.1200.002−0.8560.000−0.4790.000
A4Standard floor height0.2720.0000.0870.030−0.0610.0000.2130.000
A5Building orientation0.0220.5890.0060.880−0.0010.9820.0010.983
Window form parametersB1Window-wall ratio of east elevation0.0800.0450.0820.0410.0270.5060.0700.078
B2Window-wall ratio of west elevation0.1010.0110.1130.0050.0040.9270.0880.027
B3Window-wall ratio of south elevation0.0280.4870.0770.054−0.2770.000−0.1020.010
B4Window-wall ratio of north elevation0.0640.1110.0830.0370.0900.0240.0760.056
Envelope design parametersC1Type of working conditions0.6590.000−0.0540.000−0.4570.0000.0000.000
BED *: Building Energy Demand, UDI *: Useful Daylight Illuminance 100–2000 lx, DH *: Discomfort Hours, GC *: Global Cost.
Table 11. Comparison of Spearman’s rank correlation coefficient of the design parameters of building forms in Shenzhen.
ClassificationNumberDescriptionShenzhen
(Hot-Summer and Warm-Winter Region IV)
BED *UDI *DH *GC *
Correlation CoefficientSignificanceCorrelation CoefficientSignificanceCorrelation CoefficientSignificanceCorrelation CoefficientSignificance
Spatial form parametersA1Length of building front elevationSignificance0.000−0.3970.000−0.1700.000−0.5240.000
A2Length-width ratio0.4580.0000.4580.0000.0880.0880.3840.000
A3Number of floors−0.0460.239−0.1480.000−0.5980.000−0.4770.000
A4Standard floor height0.2450.0000.0000.239−0.0100.000−0.0100.000
A5Building orientation0.0780.2110.0070.8580.0090.8200.0390.322
Window form parametersB1Window-wall ration of east elevation0.0830.0360.0240.5400.0000.0610.0830.036
B2Window-wall ratio of west elevation0.0360.0050.0050.3990.0450.2530.0550.159
B3Window-wall ratio of south elevation0.0750.0560.1160.0030.0090.8190.0390.324
B4Window-wall ratio of north elevation0.1110.0050.0470.2290.0880.0880.0650.098
Envelope design parametersC1Type of working conditions−0.2040.000−0.0130.748−0.0130.000−0.4070.000
BED *: Building Energy Demand, UDI *: Useful Daylight Illuminance 100–2000 lx, DH *: Discomfort Hours, GC *: Global Cost.
Table 12. Comparison of Spearman’s rank correlation coefficient of the design parameters of building forms in Kunming.
ClassificationNumberDescriptionKunming
(Mild Region V)
BED *UDI *DH *GC *
Correlation CoefficientSignificanceCorrelation CoefficientSignificanceCorrelation CoefficientSignificanceCorrelation CoefficientSignificance
Spatial form parametersA1Length of building front elevation−0.5070.000−0.4400.000−0.1540.000−0.5010.000
A2Length-width ratio0.3470.0000.2970.0000.1150.0000.4270.000
A3Number of floors−0.2410.000−0.1260.0000.0000.0000.0000.000
A4Standard floor height0.2530.0000.0000.000−0.0450.0000.2950.000
A5Building orientation−0.0120.761−0.0090.000−0.0240.559−0.0430.292
Window form parametersB1Window-wall ratio of east elevation0.0700.0860.0080.8450.0430.2940.0620.126
B2Window-wall ratio of west elevation0.1660.0000.0430.043−0.0070.8680.0670.101
B3Window-wall ratio of south elevation0.0570.1610.1290.0020.0230.0230.0840.039
B4North elevation window-to-wall ratio0.0930.0220.0420.307−0.0140.7290.0030.943
Envelope design parametersC1Type of working conditions0.9430.0000.0360.3840.3840.000−0.3610.000
BED *: Building Energy Demand, UDI *: Useful Daylight Illuminance 100–2000 lx, DH *: Discomfort Hours, GC *: Global Cost.
Table 13. Parameter setting of building forms for low-rise and medium-rise residential buildings.
Building type 1
Design variablesUnitParameter value
Length of building front elevationm16;20;24;28
Length-width ratio-1
Number of floors-1;2;3;4;5;6;7
Standard floor heightm0.4
Building orientation°0
Window-wall ratio of east elevation%m
Window-wall ratio of west elevation%%
Window-wall ratio of south elevation%m
Window-wall ratio of north elevation%%
Building type 2
Design variablesUnitParameter value
Length of building front elevationm16;20;24;28
Length-width ratio-2
Number of floors-1;2;3;4;5;6;7
Standard floor heightm3
Building orientation°0
Window-wall ratio of east elevation%45
Window-wall ratio of west elevation%%
Window-wall ratio of south elevation%45
Window-wall ratio of north elevation%%
Building type 3
Design variablesUnitParameter value
Length of building front elevationm16;20;24;28
Length-width ratio-2
Number of floors-1;2;3;4;5;6;7
Standard floor heightm3
Building orientation°90
Window-wall ratio of east elevation%45
Window-wall ratio of west elevation%25
Window-wall ratio of south elevation%45
Window-wall ratio of north elevation%25
Table 14. Average performance indicators for building type 1 under each typical urban climatic condition.
Objective FunctionHarbinBeijingShanghaiShenzhenKunming
Working condition123123123123123
BED (Heating) [kWhp/m2a]73.8884.30204.6128.8034.3105.0210.6613.5957.300.010.24.671.152.0323.60
BED (Cooling) [kWhp/m2a]21.1119.7013.7740.3338.6836.7652.5150.6449.55102.3099.81107.3517.2015.006.38
BED (total) [kWhp/m2a]94.99103.99218.3869.1373.11141.7863.1764.24106.85102.3199.83112.0218.3517.0329.99
UDI 100–2000 lx [%]36.2336.2336.2336.2336.2336.2337.0137.0137.0137.9537.9537.9538.4538.4538.45
DH [%]73.1570.5858.1464.6664.1560.7466.2364.5060.4968.3767.4749.7551.7549.6137.03
GC [¥/m2] Global cost2176.412210.491999.272123.752147.621843.332111.622129.51772.212191.482202.381782.752020.312033.431615.73
IC [¥/m2] Investment cost1983.021998.771554.681983.021998.771554.681983.021998.771554.681983.021998.771554.681983.021998.771554.68
Table 15. Average performance indicators for building type 2 in each typical urban climatic condition.
Objective FunctionHarbinBeijingShanghaiShenzhenKunming
Working condition123123123123123
BED (Heating) [kWhp/m2a]:100.21114.54238.1841.4349.65120.2517.9822.7766.650.350.595.462.914.7226.79
BED (Cooling) [kWhp/m2a]:27.0425.5416.9354.2252.5943.6868.8167.0257.77136.22133.97124.6523.0520.578.07
BED (total) [kWhp/m2a]127.25140.08255.1295.65102.24163.9386.7989.79124.42136.57134.56130.0925.9625.2934.86
UDI 100–2000 lx [%]:41.9241.9241.9244.3644.3644.3644.3644.3644.3645.7645.7645.7645.4545.4545.45
DH [%]56.4655.2461.4464.8564.8260.8467.3465.7460.9353.3853.3553.0550.1049.2636.79
GC [¥/m2]: Global cost2655.282699.002436.872590.952621.962251.242572.902596.632170.812674.242687.782182.342449.062465.301988.47
IC [¥/m2]: Investment cost2396.212423.821917.502396.212413.821917.502396.212413.821917.502396.212413.821917.502396.212413.821917.50
Table 16. Average performance indicators of building type 3 under the climatic conditions of each typical city.
Objective FunctionHarbinBeijingShanghaiShenzhenKunming
Working condition123123123123123
BED (Heating) [kWhp/m2a]:102.08116.33239.8543.4351.69122.5318.2423.0267.020.230.565.432.834.6226.60
BED (Cooling) [kWhp/m2a]:28.8427.4218.5558.4356.8047.1773.1771.4161.63141.84139.76130.2024.3522.229.81
BED (total) [kWhp/m2a]130.92143.75258.39101.86108.48169.7091.4194.44128.65142.07140.33135.6427.1926.8436.41
UDI 100–2000 lx [%]:40.7340.7340.7343.6343.6343.6343.6343.6343.6343.9843.9843.9843.9143.9143.91
DH [%]57.9057.7962.7164.8564.7961.2266.9665.2361.1156.7956.4960.3051.3449.2940.38
GC [¥/m2]: Global cost2662.742706.472443.552603.572634.682262.982582.312606.082179.402685.652699.512497.182451.562468.471991.62
IC [¥/m2]: Investment cost2396.212413.821917.502396.212413.821917.502396.212413.821917.502396.212413.821917.502396.212413.821917.50
Table 17. Optimization design parameters of building forms in each typical city.
ClassificationNumberDescriptionHarbinBeijingShanghaiShenzhenKunming
nZEB
(*)
UDI
(*)
nZEB
(*)
UDI
(*)
nZEB
(*)
UDI
(*)
nZEB
(*)
UDI
(*)
nZEB
(*)
UDI
(*)
Spatial form parametersA1Length of building front elevation28202816281628162816
A2Length-width ratio1212121222
A3Number of floors7636333777
A4Standard floor height2.73.32.72.72.72.72.732.73.3
A5Building orientation0909009000−4500
Window form parametersB1Window-wall ratio of east elevation0.250.550.250.550.250.550.250.550.250.35
B2Window-wall ratio of west elevation0.250.250.250.250.250.450.250.350.350.45
B3Window-wall ratio of south elevation0.250.350.250.550.250.450.250.550.250.25
B4Window-wall ratio of north elevation0.250.550.250.550.250.550.250.550.250.55
Parameters of indirect influence
Building width2810288288288148
Building shape coefficients0.1390.2310.2090.2870.2090.3480.2090.2730.1810.268
Floor area ratio3.430.751.470.481.470.241.470.5617150.56
nZEB (*): the best solution for energy demand of the whole year. UDI (*): optimal solution for the time percentage of effective natural lighting illuminance 100 lx~2000 lx in the whole year.
Table 18. Performance indicators of the optimal solution.
Objective FunctionHarbinBeijingShanghaiShenzhenKunming
nZEB
(*)
UDI
(*)
nZEB
(*)
UDI
(*)
nZEB
(*)
UDI
(*)
nZEB
(*)
UDI
(*)
nZEB
(*)
UDI
(*)
BED [kWh/m2/year]:
Building energy demand
76.10149.4047.7089.6036.0074.9044.80114.805.6014.20
H [kWh/m2/year]:
Heating energy demand
68.60130.7032.0042.6013.8023.300.000.001.305.10
C [kWh/m2/year]:
Cooling energy demand
7.5018.7015.8047.022.2051.6044.80114.804.409.10
UDI 100–2000 lux
[%]:
7.0043.6020.5046.4018.0047.0019.1047.5033.6047.00
nZEB (*): the best solution for energy demand of the whole year. UDI (*): optimal solution for the time percentage of effective natural lighting illuminance 100 lx~2000 lx in the whole year.
Publisher’s Note: MDPI stays neutral with regard to jurisdictional claims in published maps and institutional affiliations.

