Abstract
In photovoltaic power plants, fault diagnosis tools are essential for ensuring a high energy yield. These tools should be capable of accurately identifying and quantifying the factors behind the various fault mechanisms commonly found in photovoltaic plants. Considering the aforementioned factors, this article proposes an online smart PV monitoring solution, which is capable of detecting malfunctions that arise from accidental and/or technical causes through the analysis of I-V curves, however, without the necessity to interrupt the operation of the system, thus reducing the maintenance cost. Accidental causes can lead to the reduction of energy productivity due to the excessive accumulation of dirt on the photovoltaic modules, partial shading and eventual errors that occur during its installation. On the other hand, technical causes can be attributed to faults found on the photovoltaic modules, which lead to gradual losses in their electric and material characteristics. Therefore, by using the electric characteristics supplied by the manufacturer of the installed modules, the I-V and P-V curves of the operational photovoltaic strings were obtained in real time, compared to the respective theoretical curves obtained through mathematical modeling. In order to validate the proposed online monitoring system and its potential for predictive maintenance application, a field experimentation was mounted in a 93.8 kWp photovoltaic system.
1. Introduction
The growth in demand for electricity, the limited amount of fossil fuels and the emission of polluting gases, such as CO2, makes the development of alternative sources of energy generation a requirement. Sustainable development policies are being put into practice and, through them, the use of renewable energy sources finds greater growth compared to non-renewable sources. Among them, solar stands out for being abundant, free of charge and widely available. It can also be installed in different environments, having a low impact and generating minimum pollution values [1].
The performance of the photovoltaic system is affected by some factors, such as temperature, irradiation, and faults on the PV modules. The increase in the temperature of the photovoltaic modules decreases the power generated and can also cause early degradation and a subsequent decrease in lifetime [2]. The current generated by the module is directly proportional to the solar irradiation, i.e., the greater it is, the greater the power generated by the PV module. Faults can cause drastic decreases in generated power, thus making the system operate in an inadequate manner, which not only increases the investment return period but also decreases the lifetime of the PV module.
Among the possible faults, the most common are shading, hot spots and a degradation of the PV modules [3]. Shading occurs when clouds or some sort of structure hinders, partially or completely, the capacity of solar irradiation to reach the PV modules, thus producing a decrease in the generated power [4]. For this reason, they should be positioned correctly to improve efficiency. Hotspots are, however, the result of elevated temperatures on a photovoltaic cell, which may occur on one part of the PV module or entirely. Generally, this elevation is caused by dirt, shading or faulty cells. In order to correct this problem, bypass diodes are installed, which provide another path for the current, thus avoiding a rise in temperature (hot spots) and its failure [5]. Degradation, in turn, is the gradual deterioration of the components of the module, which can alter its capacity to operate within the expected limits. The main types of degradation are corrosion, delamination, discoloration and breaks/cracking [6]. It is estimated that PV modules lose, on average, 0.7 to 0.8% of their energy generation capacity per year [7]. In the first year, this loss can be accentuated, which can reach 2.5 to 3.5% on silicon modules, mainly caused by LID (Light Induced Degradation) [8].
In order to correctly deal with the aforementioned faults and efficiency losses, constant real-time monitoring and diagnosis became tools of upmost importance for achieving a high yield performance, quality and lifetime of the PV modules [9].
The diagnosis of the operational state of the PV modules consists of identifying and classifying the faults. It is possible to use different diagnostic techniques, such as the visual inspection of the PV modules, imaging techniques such as infrared and thermography, as well as the use of acquisition systems of electric and/or climatic data, such as irradiance and temperature. These techniques require different levels of cost, evaluation time and knowledge for faults identification.
Electroluminescence (EL) images, for example, are used for detecting micro cracks, interrupted contacts, and other PV failures [10]. Infrared (IR) images are also applied in diagnosing the PV modules [11] and can be associated with EL for better diagnosis. These two methods require specific weather conditions and equipment to provide reliable results. For IR, an irradiance of higher than 600 W/m2 is recommended, as is a constant ambient conditions, for example, with no clouds [12]. In [13], a methodology of taking IR images using aerial infrared thermography is presented, in which drones can be applied. For EL images, in [12], it is mentioned that the best condition is when the irradiance is approximately 50 W/m2, one hour after sunset. Therefore, it can be concluded that despite the good results that can be achieved, the costs involved, the difficulty of carrying out field work and the need for specialized technical labor are factors that make it impossible to adopt these methods to perform predictive maintenance in PV systems.
On the other hand, various diagnosis methods that use electric data can be easily performed. These include an analysis of the I-V curve, a power analysis and artificial intelligence (AI) [9]. A vast research bibliography has been presented in [4], which includes studies from across all fields. These demonstrate that most of the proposed solutions work in an offline mode and that the methods using power losses and I-V curve analysis can detect practically all kind of faults and failures commonly observed in PV arrays.
In [14], a diagnosis using the I-V curve is performed, along with the operating power through Matlab®. To obtain the I-V curve, equipment that acts by varying the operating point is employed, for which it is necessary to interrupt the operation of the system, thus increasing its cost and complexity. In [15], a system using a Kernel-Based Extreme Learning Machine (KELM) is proposed for the diagnosis of the I-V curve, which uses data collected by I-V curve test equipment and Matlab® simulations for training, where exists the need for previously obtained data and simulations to operate the system. In [16], a diagnostic system is created with its own software, using real efficiency data along with the estimations produced through the project, in order to determine the system losses. In [17] neural networks for performing the off-line diagnosis for the I-V curves are used. Therefore, it is important to notice that the I-V curves off-line diagnosis requires specific high-cost equipment, trained staff, and the disconnection of the PV strings, which prevents energy production during PV-plant inspection, leading to financial losses.
In this context, this project consisted of the experimental development of an online smart diagnosis technique of PV arrays through the analysis of I-V and P-V curves. These were obtained through mathematical modelling that uses the features of the PV modules, such as the climatic data and electrical string point of operation (current and voltage). Through these features, a system diagnosis is performed through the identification of possible faults and an analysis of the relative power, which is the ratio between the real operating power and the expected operating power. IoT (Internet of Things) technology, through LoRa (Long Range) communication [18,19] and low-cost microcontroller open-source platform, such as Arduino®, are deployed to integrate all the sensors’ data, send them to the cloud, and integrate data-logging functions.
Among the advantages of the proposed system, emphasis must be placed upon the following features: online and real time faults diagnosis system; possibility of manual input of values for voltage, current, irradiation and temperature for testing purposes; simple software and low cost hardware; possibility of analyzing isolated PV modules and/or strings and arrays; suitable for PV modules from any technology, material or manufacturer; there is no need for algorithm training or previous testing in the field; does not require interruption of the energy production.
Such features, that differ from the conventional commercial ones, make it possible to provide services in the context of predictive maintenance (e.g., soiling status, degradation of PV modules, shading, MPPT fault, modules mismatch, blown fuse identification, short-circuit and/or open-circuit continuous operation), by sending simple and important information for the final user without requiring specialized technical analyses to determine and to execute the necessary work so as to ensure better performance and reduced payback time. To conclude, in Table 1 some insights about the main diagnosis technique for PV arrays are presented.

Table 1.
Discussion about the main requirements for a diagnosis method to provide predictive maintenance in PV arrays.
Therefore, it is important to emphasize that the main contribution/novelty of this work is to present a smart diagnostic tool for the PV owner and for the PV installation company, by providing a detailed analysis of the status of the PV system by means of I-V curves characterization and a performance analysis. Therefore, the developed smart PV monitoring technique can be deployed, while avoiding an interruption of energy production and/or the necessity of sending an operational and maintenance (O&M) team to the field without previous knowledge of what has caused power losses, thus, saving time and reducing costs.
2. Materials and Methods
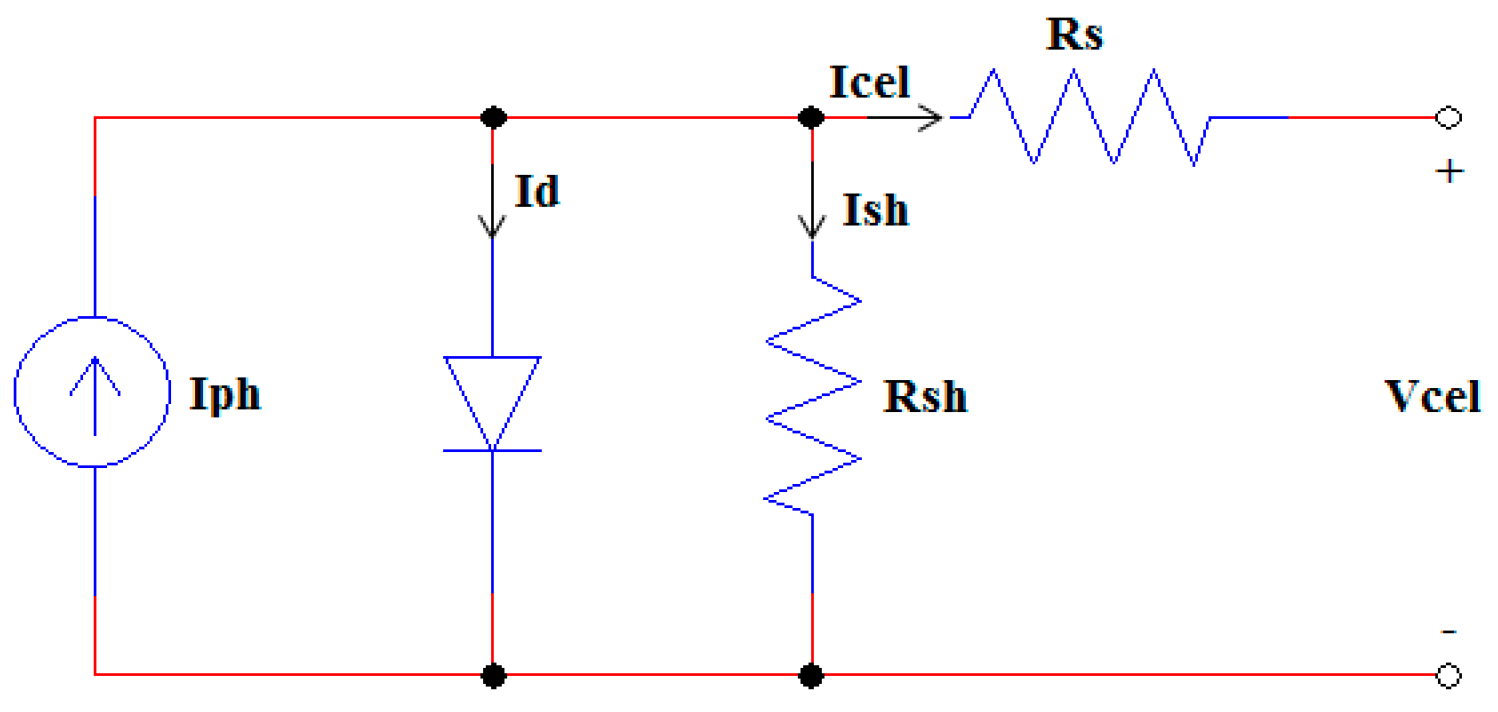
The ideal model for a photovoltaic cell can be represented by a current source with an antiparallel diode. However, in the real PV cell, there other effects exist that are not considered in the simplified model, and for such the Rs resistance series and parallel Rsh are inserted, which represent losses and leaks, respectively. This model offers better precision without significantly increasing the complexity regarding the simplified model and is illustrated in Figure 1 [20].
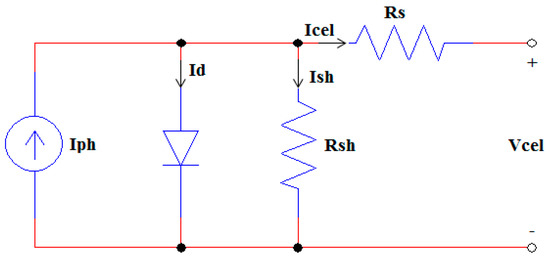
Figure 1.
Equivalent photovoltaic cell circuit.
The output current equation Icel is given by Equation (1), as follows:
where,
In order to solve Equation (1), the use of a mathematical method is recommended, due to its complexity. The Newton-Rhapson iterative method is very well known due to its simplicity and rapid convergence, which makes it popular in computational applications. This method finds an approximation of the roots of an equation through n iterations, when the difference between I(n+1) and In reaches a previously determined threshold [21].
However, the PV modules do not always operate as expected, thus creating a difference between the results obtained in the equations and those in the experiment. This occurs due to certain factors, such as dirt, shading, control errors or damaged equipment. In [22], the main faults, their description and the parameters altered by them are presented. Table 2 summarizes the faults and their effects on the I-V curve, where the arrows indicate whether the parameter suffers an increase or decrease in relation to the expected value without the fault. As an example, a module affected by PID (Potential Induced Degradation) presents a reduction of its power and voltage. Another example is the PV module operating with an open-circuit fault, which will reduce its power and current to zero.
Table 2.
Main types of faults and their effects on the I-V and P-V curves.
With regard to the analysis of the system under the shading condition, it is important to highlight that respective failure is detected by the reduction of the current drawn from the modules, thus affecting energy extraction, which can be identified through an analysis of the relative power. It is also important to note that, if the extracted power reduction condition persists, it is necessary to send a technical team to analyze the respective photovoltaic arrangement in order to determine the cause of the problem, which may be correlated to bypass diode failure.
Therefore, one can conclude that shading conditions are detected by the reduction of the relative power and that the implementation of sophisticated PV models to obtain and analyze P-V curves with false or multiple maximum power points is not required.
3. Methodology
The sensors used in this study acquired the values of the current, voltage, temperature, and solar irradiation. The voltage sensor used is the LV 20-P and the current sensor is the LA 55-P. Both function through the hall effect, which can operate at voltages of up to 500 V and 50 A, respectively.
The temperature sensor employed is the DS18B20 with an operational range between −55 °C to 125 °C with accuracy of ±0.5 °C. This sensor uses the One Wire protocol for communicating data and possesses a waterproof covering. In order to obtain the cell temperature, Equation (5) is used, where Tcel is the operational temperature of the cell, Tamb is the environment temperature, NOCT is the nominal operational temperature of the cell and G is the irradiance [23].
The employed irradiation sensor is the SR05-D2A2, a second-class digital pyranometer recognized through ISO 9060, which measures solar irradiation from 0 to 1600 W/m2 in a field angle of 180° and output of 4 to 20 mA. The microcontroller board used is the Arduino Mega 2560, an open-source platform that operates with its own programming language, based on Wiring. All the circuits necessary for operating the sensors and microcontrollers were developed and integrated into a case that is resistant to heat and humidity, with MC4 terminals for easy connection to the monitored PV modules.
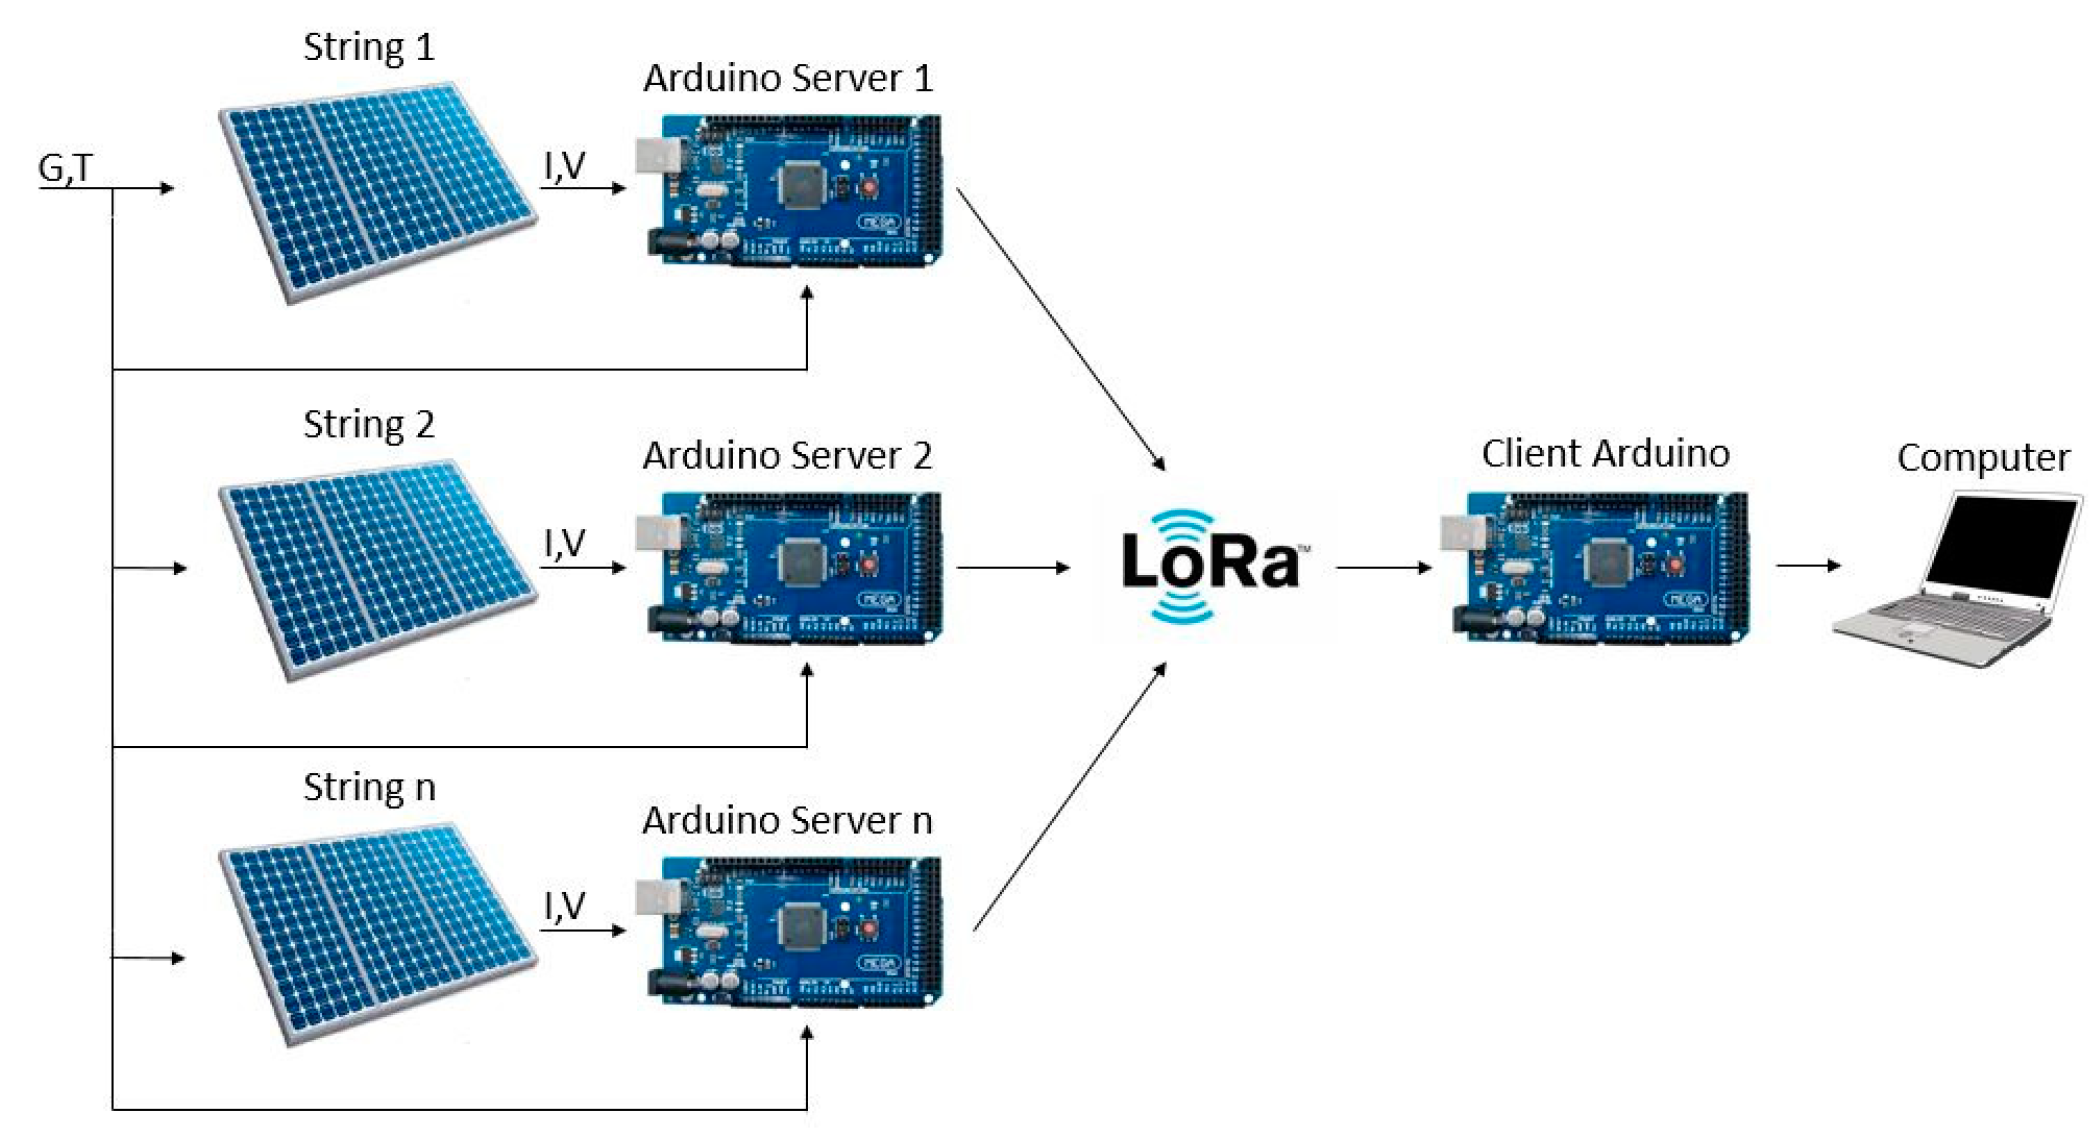
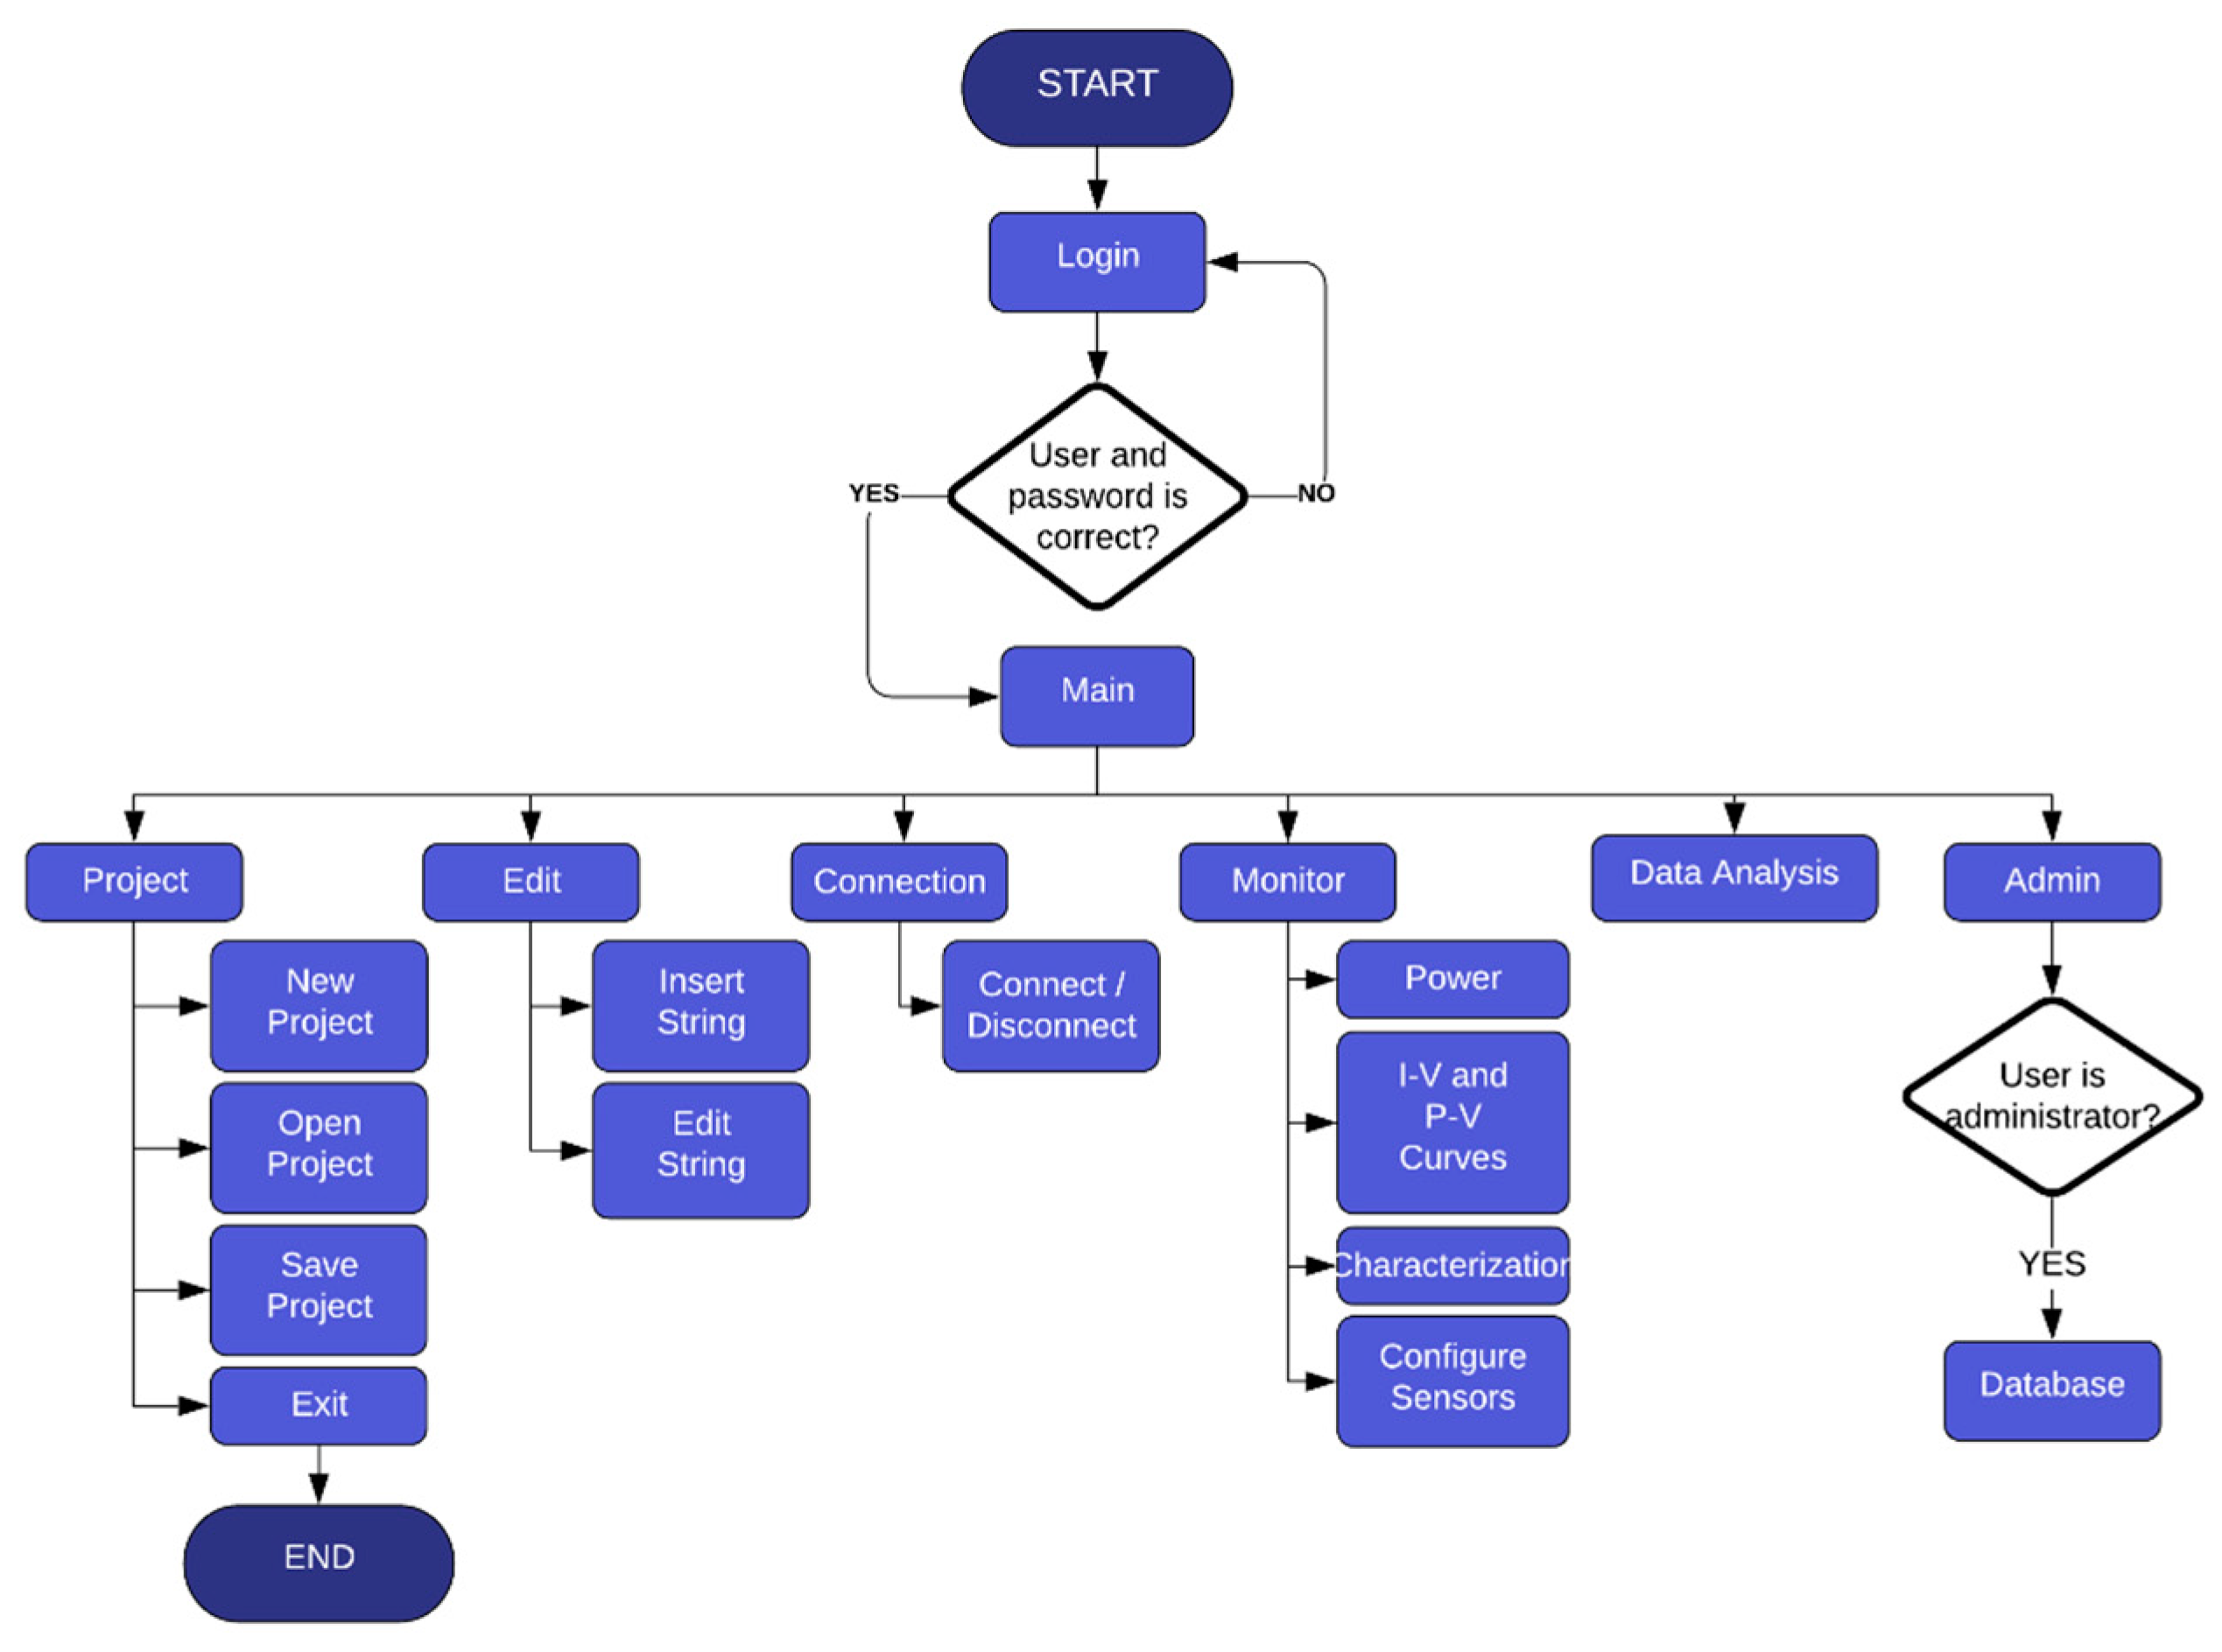
In order to facilitate data access, all communication between the servers (microcontrollers receiving and processing the data from the sensors) and the client (microcontroller connected to the computer where the software is running) is performed through LoRa technology, which allows for communication over long distances with low energy consumption. The structure of the system is illustrated through Figure 2. The developed software, illustrated by the flowchart in Figure 3, receives the client data and performs the required functions. These functions include storing information from the sensors into a database, editing the PV modules, generating reports/datasheets, the calibration of sensors and the monitoring and diagnosis of the I-V and P-V curves in real time, all of which are performed through an easy-to-use interface.
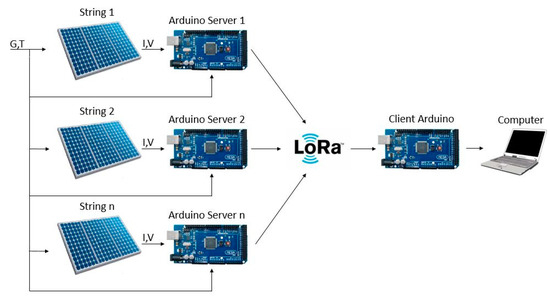
Figure 2.
System structure showing the developed setup.

Figure 3.
Operational flowchart of the software.
The function to generate the I-V curve of the modules under operational conditions is illustrated in Figure 3. It is initialized by supplying the data from the manufacturer datasheet and the data from the sensors installed in the field (temperature, irradiance, voltage and current). Through these data, Iph, Id and Ish are calculated using the Newton-Rhapson method, along with the maximum expected voltage and current for that operational condition. If the error between the expected maximum power and that obtained by the model is higher than the threshold, a variation of the Rs and Rsh values is performed, whereby their values are always stored when the error is the lowest found. Once the error reaches a value lower than the threshold, the graphs for I-V and P-V curves are generated, and the diagnosis of the curves is initiated.
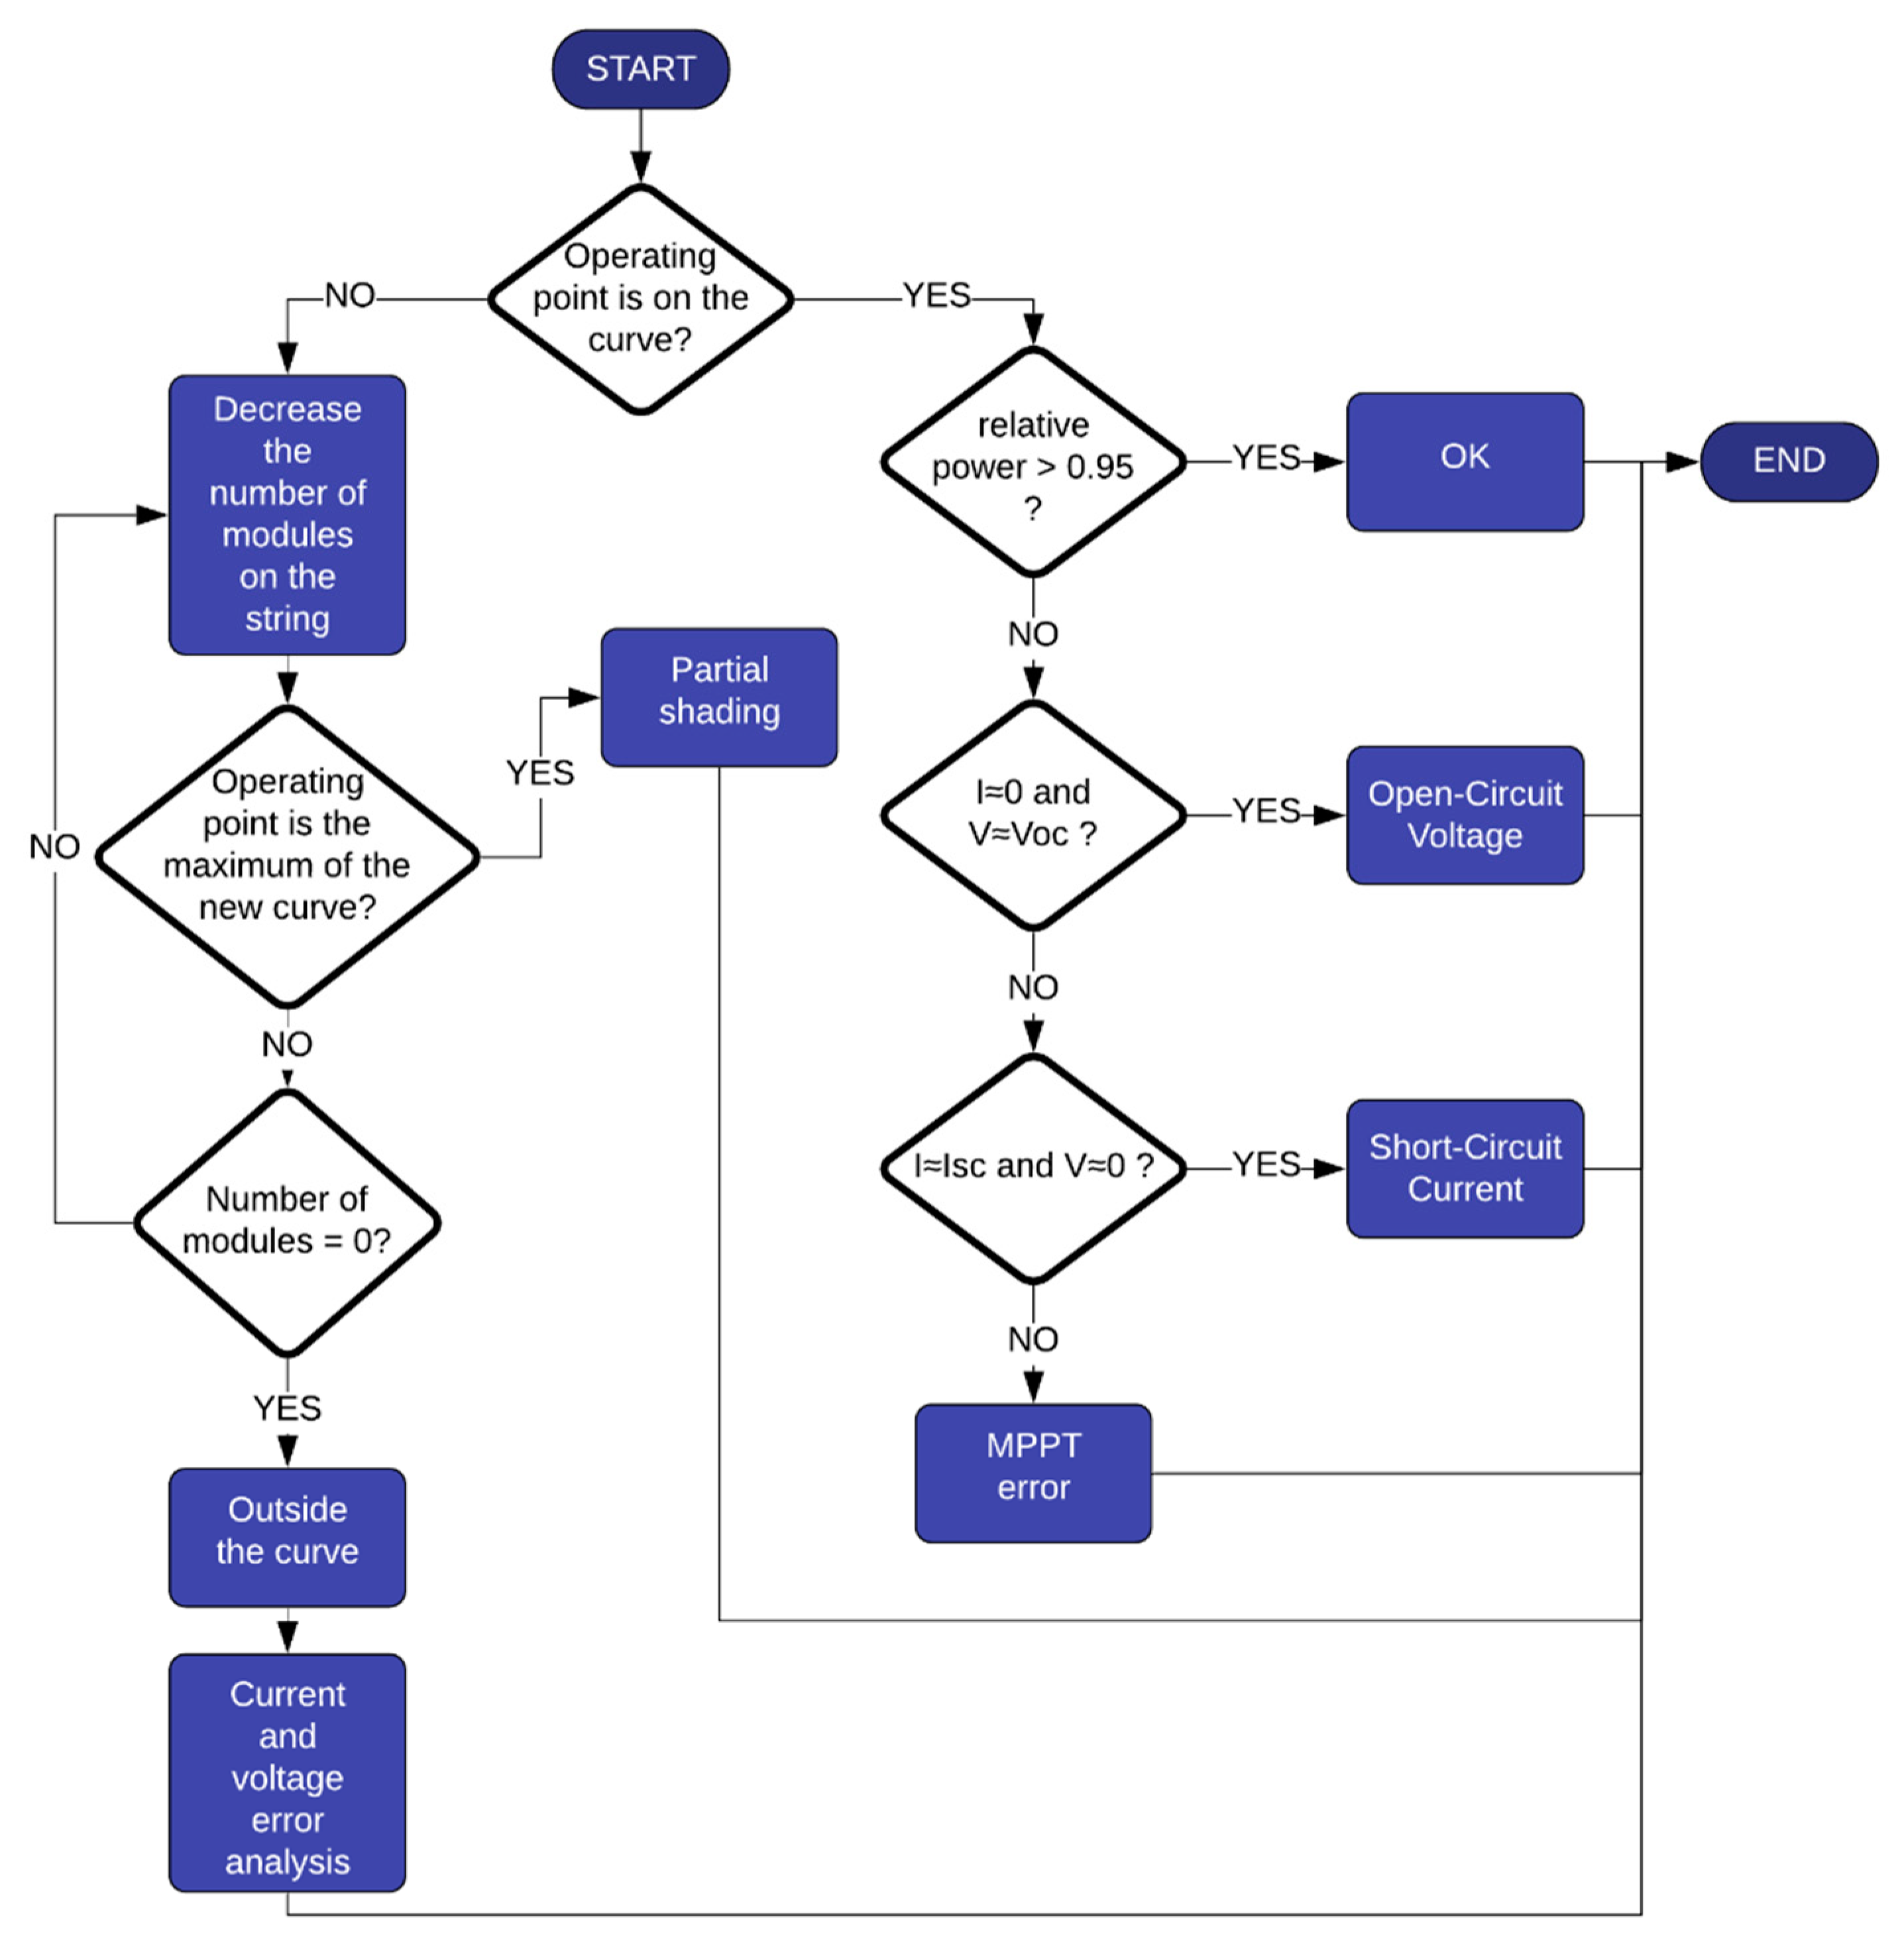
The diagnosis process, illustrated in the flowchart of Figure 4, starts by checking whether the operating point is found near the estimated I-V curve and, if so, an analysis is performed once the point is closer to the open-circuit voltage, short-circuit current, maximum power or between these points, producing a separate indication for each of these situations. If the operating point is outside the curve, all possible variations of the number of modules in the string are performed, and a new I-V curve is generated for each case. For each of these curves, a verification is made for whether the operating point is found near the expected MPP (Maximum Power Point), and if so, the number of PV modules that were removed to obtain that curve is indicated. If all tests fail, an error analysis of the operating voltage and current is performed in relation to that expected, in order to identify the possible failure cause, according to Table 2.
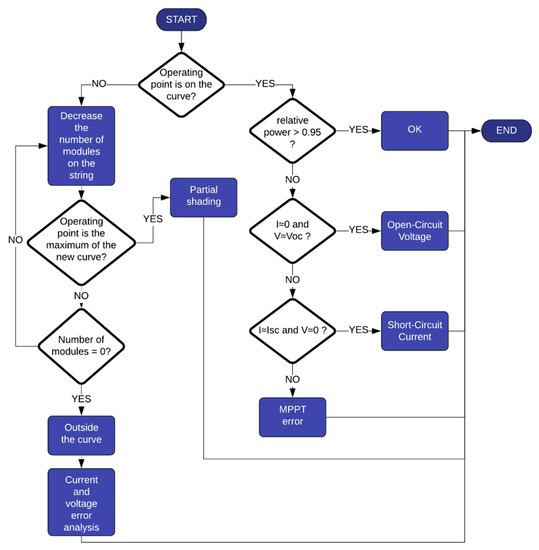
Figure 4.
Flowchart of the monitoring function.
4. Results and Discussion
In order to validate the mathematical model used by the developed software, laboratory tests were performed using the equipment Solar I-V® on 5 different PV modules (Table 3) and 5 different strings (Table 4) available at the research laboratory, as portrayed in Figure 5. The relative error among the expected values at the maximum power point data (Pmax, Imax and Vmax), the open-circuit voltage (Voc) and short-circuit current (Isc), and those found by the developed software, are also presented in Table 3 and Table 4.
Table 3.
Relative errors of the mathematical modelling of different PV modules.
Table 4.
Relative errors of the mathematical modelling of the PV strings.
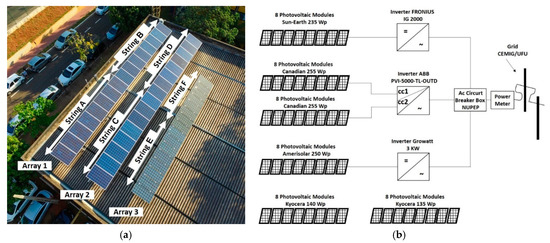
Figure 5.
Photovoltaic power plant installed in the research laboratory (a) aerial photo and mapping of photovoltaic modules (b) simplified single-line diagram.
For example, the results obtained for the string with 8 PV modules Canadian CSI CS6P-255P (shown in Table 4) under the operating condition of a 990.3 W/m2 and a temperature of 51.36 °C on the cell, are presented in Figure 6. One can observe that the I-V and P-V curves are reproduced accurately with a good match between the theoretical (solid line) and practical results (red cross).
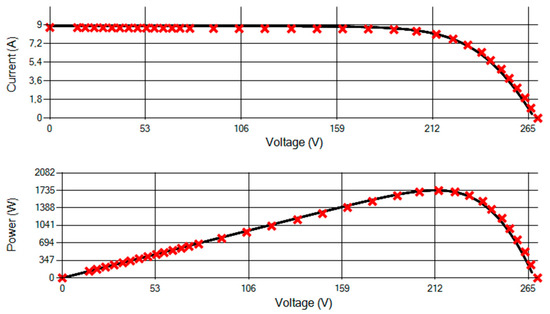
Figure 6.
Expected I-V curve (solid line) and real points of operation (in red cross).
Once that the laboratory tests were successfully performed, the proposed fault diagnostic technique was evaluated in the field, as portrayed in Figure 7. The system is composed of 280 PV modules Canadian Solar CS3U-335P, connected to 3 Fronius inverters model Eco 25.0-3-S of 25 kW each. Concerning the results presented in this paper, the data acquisition period was from 3 June 2020 to 30 September 2020, a period in which more than 800,000 samples were obtained under diverse weather conditions. In addition to the data obtained through the developed monitoring system, data from the commercial inverters were used to analyze the PV strings where the equipment was not installed. For inverters 1 and 2, 95 PV modules were connected to each, divided in 5 strings in parallel, each with 19 modules in a series. Inverter 3 operates with 5 strings in parallel, each with 18 modules in series. The relative power measured during the evaluated period is presented in Figure 8. This result shows that the average relative power during this period was around 98.44% of the expected maximum DC power extracted from the PV array, with a standard deviation of 2.55%. The green band represented a tolerance of ±5% of the expected maximum DC power, which was established in order to determine whether or not it is necessary to send a technical team to conduct technical inspection work in the field.
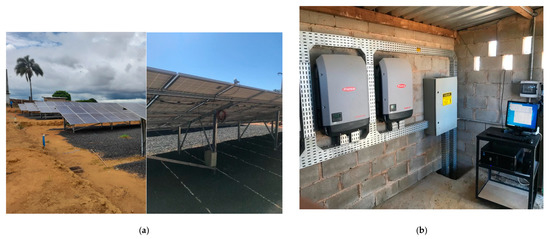
Figure 7.
PV System: (a) PV modules and experimental set-up installed (b) inverters and computer running the developed online monitoring software.
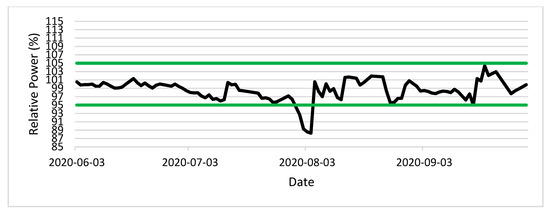
Figure 8.
Measured relative power in the period (black line) and expected power range (green lines).
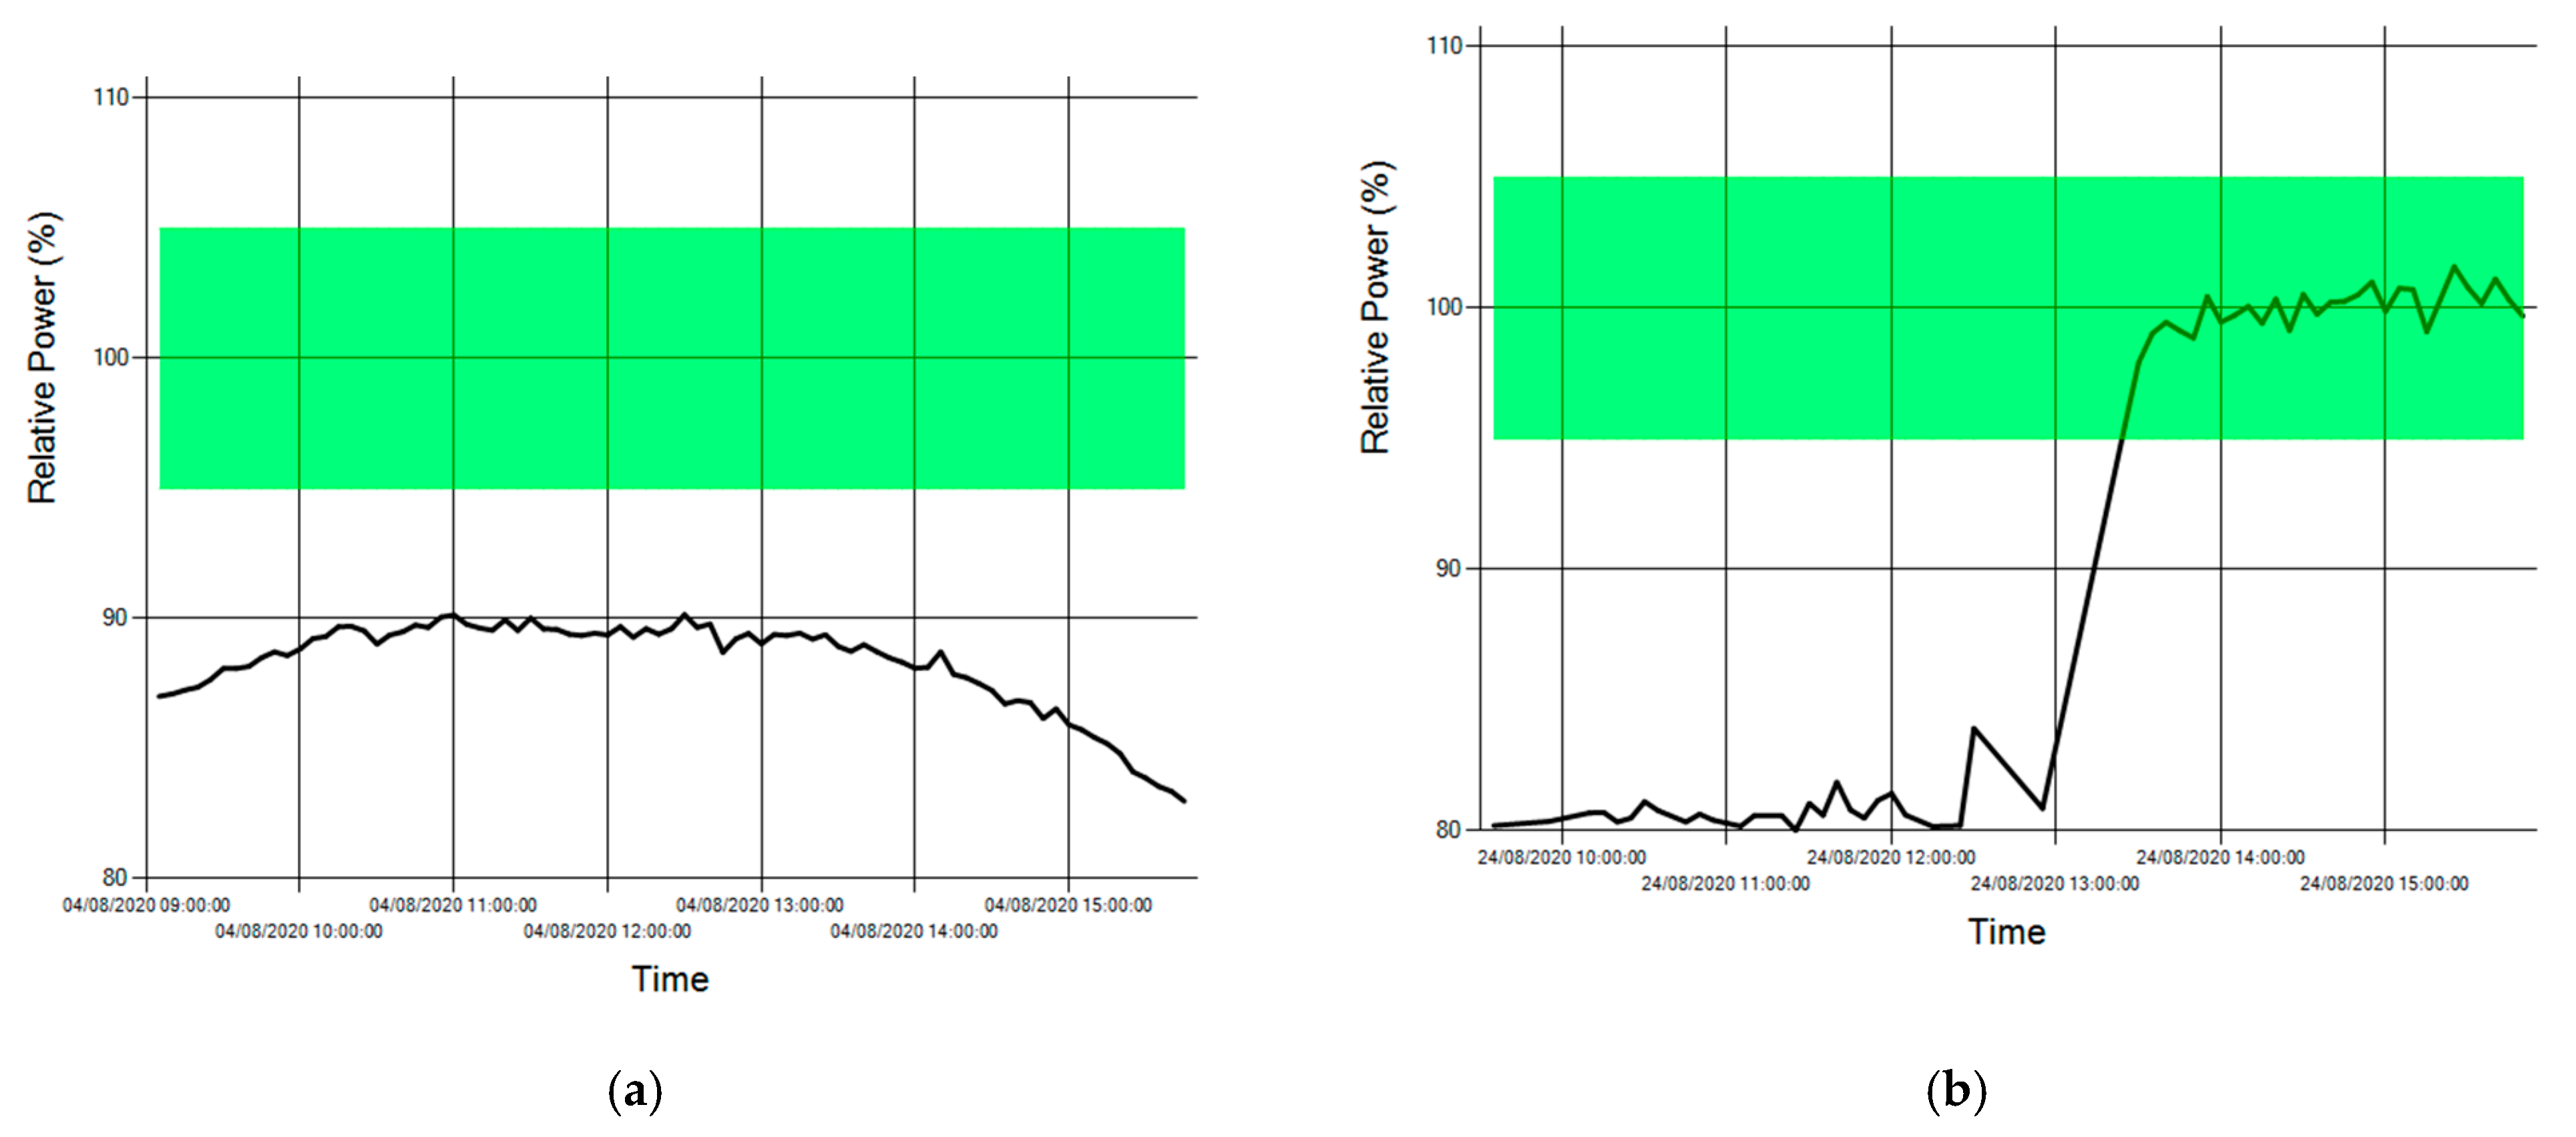
Through an analysis of Figure 8, one can observe that the proposed monitoring system showed that the relative power reached the lower tolerance limit many times, thus indicating that the system was operating with undesirable performance, which would lead to significant financial losses. This is because the PV arrays were installed in a farm, with heavy vehicle traffic and grain processing. Therefore, the O&M team was activated, and cleanings were carried out on 13 July 2020, 5 August 2020 and 17 September 2020, where there was an average increase of 7.55% in relative power. On 4 August 2020, the relative power reached the lowest value of 88.29%, as shown in Figure 9a. The owner was notified, and, on 5 August 2020, the PV modules were cleaned, and the relative power increased from 88.29% to 100.55%, as shown in Figure 8.

Figure 9.
Fault diagnostic by means of measured relative power activating (a) Soiling (b) Blown string fuse.
On 24 August 2020, a large power loss was detected in inverter 3. The diagnosis for the period until 1:25 pm was 96.46% for partial shading or module/string failure, due to the variation in the expected power value for that specific time. The owner was alerted and, after a technical inspection was carried out in the field (PV array of inverter 3), the electrician identified a blown fuse in a PV string, and after its replacement, the system returned to normal operation condition, as shown in Figure 9b (e.g., the power extracted from the PV modules is greater than the expected power for that period). It is important to note that a blown fuse does not significantly affect the overall performance (shown in Figure 8) and would be overlooked by the O&M team if a common monitoring system were used. It is also important to point out that losses caused by shading are also detected by the reduction of the current drawn from the PV array [4,5], thus affecting the energy extraction, which can be identified through the analysis of the relative power. Therefore, the implementation of sophisticated PV models to obtain and analyze P-V curves with false or multiple maximum power points is not necessary for predictive maintenance purposes.
In Figure 10a, the data obtained in a normal day of operation is presented. One can observe that the relative power is around 99.09%, with standard deviation of 0.89% and no intervention is necessary. In Figure 10b, another interesting situation is presented, showing that, due to the inverters power derating protection, during some periods of the day in the months of July, August and September, the system is capable to show that, from approximately 10:45 am to 1:20 pm, the operation point is different from the maximum power point (MPP) expected. This occurs due to the output power derating protection of the inverters, which is activated, thereby forcing the reduction of power extracted from the PV array so as not to exceed the rated inverter power.
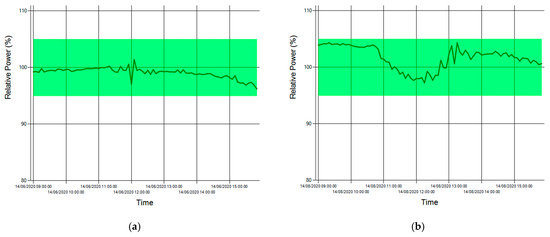
Figure 10.
Measured relative power in (a) Normal day of operation (b) MPP error due to inverters’ power derating.
5. Conclusions
The implementation of an online smart monitoring system for PV plants developed in this study opened the possibility for proving its efficiency in diagnosing faults, as well as monitoring the system performance. The tests performed, as their prime objective, were tasked with validating the efficiency of the mathematical model used for obtaining the theoretical data closer to the I-V and P-V curves for PV arrays. These tests were compared to the practical results obtained from the PV plant that aimed to diagnose the operational state of the PV modules.
Interestingly, in this study we highlighted that during the tests period reported in this study—from 3 June 2020 to 30 September 2020 (total of 04 months)—more than 800,000 data were collected, which made the precise diagnosis of faults possible, such as soiling, blown fuse and MPP error, without the need of any operational interruption or operator intervention in the field due to the remote smart monitoring feature. For this period, emphasis was placed upon the fact that the system’s real-time monitoring of the relative power of the PV array presented a standard deviation of only 2.55%.
Considering the above-mentioned factors, it is evident that there is great potential for the equipment proposed in this study for application as a preventive maintenance tool, as it greatly contributes to increased energy generation efficiency, reduces operating costs with corrective maintenance and, consequently, reduces the payback time. Finally, it helps the PV system owner and the PV system installation company to detect problems that occur in a faster and reliable way, simplifying the solution process and without the need for specialized engineers to analyze the results.
Author Contributions
L.C.G.F.: Conceptualization; T.A.F., F.C.M. and L.C.G.F.: Methodology; T.A.F.: Software; T.A.F., F.C.M. and L.C.G.F.: Validation, Formal Analysis, Investigation; L.C.G.F.: Resources, Supervision, Project Administration; T.A.F., F.C.M. and L.C.G.F.: Writing—Review & Editing. All authors have read and agreed to the published version of the manuscript.
Funding
This work was supported in part by CNPq (Process 303350/2019-9, 304489/2017-4 and 420602/2016-0), in party by FAPEMIG (Process TEC-PPM-00485-17), and in part by the Federal University of Uberlandia (Process SEI 23117.085493/2021-71).
Data Availability Statement
The software data used to support the findings of this study are available from the corresponding author upon request.
Conflicts of Interest
The funders had no role in the design of the study; in the collection, analyses, or interpretation of data; in the writing of the manuscript, or in the decision to publish the results.
References
- Lu, X.; Lin, P.; Cheng, S.; Lin, Y.; Chen, Z.; Wu, L.; Zheng, Q. Fault diagnosis for photovoltaic array based on convolutional neural network and electrical time series graph. Energy Convers. Manag. 2019, 196, 950–965. [Google Scholar] [CrossRef]
- Siecker, J.; Kusakana, K.; Numbi, B.P. A review of solar photovoltaic systems cooling technologies. Renew. Sustain. Energy Rev. 2017, 79, 192–203. [Google Scholar] [CrossRef]
- Omer, Z.M.; Fardoun, A.A.; Hussain, A. Large scale photovoltaic array fault diagnosis for optimized solar cell parameters extracted by heuristic evolutionary algorithm. In Proceedings of IEEE Power and Energy Society General Meeting (PESGM), Boston, MA, USA, 17–21 July 2016; IEEE: Piscataway, NJ, USA, 2016; pp. 1–5. [Google Scholar] [CrossRef]
- Bayrak, F.; Ertürk, G.; Oztop, H.F. Effects of partial shading on energy and exergy efficiencies for photovoltaic panels. J. Clean. Prod. 2017, 164, 58–69. [Google Scholar] [CrossRef]
- Guerriero, P.; Tricoli, P.; Daliento, S. A bypass circuit for avoiding the hot spot in pv modules. Sol. Energy 2019, 181, 430–438. [Google Scholar] [CrossRef]
- Ndiaye, A.; Charki, A.; Kobi, A.; Kébé, C.M.F.; Ndiaye, P.A.; Sambou, V. Degradations of silicon photovoltaic modules: A literature review. Sol. Energy 2013, 96, 140–151. [Google Scholar] [CrossRef]
- Jordan, D.C.; Kurtz, S.R. Photovoltaic Degradation Rates—An Analytical Review. Prog. Photovolt. Res. Appl. 2013, 21, 12–29. [Google Scholar] [CrossRef] [Green Version]
- Strevel, N.; Trippel, L.; Gloeckler, M. Performance characterization and superior energy yield of First Solar PV power plants in high-temperature conditions. Photovolt. Int. 2012, 17, 148–154. [Google Scholar]
- Chen, Z.; Chen, Y.; Wu, L.; Cheng, S.; Lin, P. Deep residual network based fault detection and diagnosis of photovoltaic arrays using current-voltage curves and ambient conditions. Energy Convers. Manag. 2019, 198, 111793. [Google Scholar] [CrossRef]
- Ebner, R.; Zamini, S.; Újvári, G. Defect Analysis in Different Photovoltaic Modules Using Electroluminescence (EL) and Infrared (IR)-Thermography. In Proceedings of the 25th European Photovoltaic Solar Energy Conference and Exhibition, Valencia, Spain, 6–10 September 2010; pp. 333–336. [Google Scholar] [CrossRef]
- Ebner, R.; Zamini, S.; Újvári, G. Non-destructive techniques for quality control of PV modules: Infrared thermography, electro- and photoluminescence imaging. In Proceedings of IECON 2013—39th Annual Conference of the IEEE Industrial Electronics Society, Vienna, Austria, 10–14 November 2013; IEEE: Piscataway, NJ, USA, 2013; pp. 8104–8109. [Google Scholar] [CrossRef]
- Jahn, U.; Herz, M.; Köntges, M.; Kunze, I.; Parlevliet, D.; Paggi, M.; Tsanakas, I.; Stein, J.S.; Berger, K.A.; Ranta, S.; et al. Review on Infrared and Electroluminescence Imaging for PV Field Applications; Report IEA-PVPS T-13-10:2018; International Energy Agency: Paris, France, 2018. [Google Scholar]
- Aline, K.V.O.; Mohammadreza, A.; Ricardo, R. Aerial infrared thermography for low-cost and fast fault detection in utility-scale PV power plants. Sol. Energy 2020, 211, 712–724. [Google Scholar] [CrossRef]
- Ali, M.H.; Rabhi, A.; El Hajjaji, A.; Tina, G.M. Real Time Fault Detection in Photovoltaic Systems. Energy Procedia 2017, 111, 914–923. [Google Scholar] [CrossRef]
- Chen, Z.; Wu, L.; Cheng, S.; Lin, P.; Wu, Y.; Lin, W. Intelligent fault diagnosis of photovoltaic arrays based on optimized kernel extreme learning machine and IV characteristics. Appl. Energy 2017, 204, 912–931. [Google Scholar] [CrossRef]
- Andò, B.; Baglio, S.; Pistorio, A.; Tina, G.M.; Ventura, C. Sentinella: Smart monitoring of photovoltaic systems at panel level. IEEE Trans. Instrum. Meas. 2015, 64, 2188–2199. [Google Scholar] [CrossRef]
- Chine, W.; Mellit, A.; Lughi, V.; Malek, A.; Sulligoi, G.; Pavan, A.M. Novel fault diagnosis technique for photovoltaic systems based on artificial neural networks. Renew. Energy 2016, 90, 501–512. [Google Scholar] [CrossRef]
- Rokonuzzaman, M.; Shakeri, M.; Hamid, F.A.; Mishu, M.K.; Pasupuleti, J.; Rahman, K.S.; Tiong, S.K.; Amin, N. IoT-enabled high efficiency smart solar charge controller with maximum power point tracking—Design, hardware implementation and performance testing. Electronics 2020, 9, 1267. [Google Scholar] [CrossRef]
- Jiang, B.; Iqbal, M.T. Open source data logging and data visualization for an isolated PV system. Electronics 2019, 8, 424. [Google Scholar] [CrossRef] [Green Version]
- Ishaque, K.; Salam, Z. An improved modeling method to determine the model parameters of photovoltaic (PV) modules using differential evolution (DE). Sol. Energy 2011, 85, 2349–2359. [Google Scholar] [CrossRef]
- Bonkoungou, D.; Koalaga, Z.; Njomo, D. Modelling and Simulation of photovoltaic module considering single-diode equivalent circuit model in MATLAB. Int. J. Emerg. Technol. Adv. Eng. 2013, 3, 493–502. [Google Scholar]
- Livera, A.; Theristis, M.; Makrides, G.; Georghiou, G.E. Recent advances in failure diagnosis techniques based on performance data analysis for grid-connected photovoltaic systems. Renew. Energy 2019, 133, 126–143. [Google Scholar] [CrossRef]
- Silva, A.M.; Melo, F.C.; Reis, J.H.; Freitas, L.C.G. The study and application of evaluation methods for photovoltaic modules under real operational conditions, in a region of the Brazilian Southeast. Renew. Energy 2019, 138, 1189–1204. [Google Scholar] [CrossRef]


Publisher’s Note: MDPI stays neutral with regard to jurisdictional claims in published maps and institutional affiliations. |
© 2021 by the authors. Licensee MDPI, Basel, Switzerland. This article is an open access article distributed under the terms and conditions of the Creative Commons Attribution (CC BY) license (https://creativecommons.org/licenses/by/4.0/).