Abstract
The landscape shaped by the energy industry is rich in various slender structures, such as smokestacks, cooling towers, and others. It is thus becoming increasingly important to effectively monitor the geometrical condition of all types of such structures. Slender structures are deformed elastically under loads due to wind. A proper analysis of the changes and deformations of such structures requires a continuous ground-based measurement system which allows the movement of the structure to be measured in two horizontal directions, from a significant distance and with a possibly reduced number of stations. For this purpose, two methods were implemented: a linear terrestrial laser scanning method (TLS) and an optical, direct distance measurement method—tachymetry (TCH). The least squares method was used to fit rings on various levels of the structure and then the centers of the rings were identified. The comparison of the identified ring centers enabled the axis of the structure to be measured for deviation in two perpendicular directions. The methods were verified on actual structures: a smokestack 110 m in height, a cooling tower 60 m in height, and a wind turbine with the rotor axis at 149 m. The measurement results were compared with respect to the measurement time and the obtained accuracies at which the point locations were identified on the structure. The proposed methods are an effective tool for monitoring the condition of slender objects both during their operating life and after it. Regular monitoring of the geometric condition of slender structures in the energy industry limits the risk of major or catastrophic events, and as a result allows the safe and uninterrupted delivery of electric energy to clients.
1. Introduction
The energy industry plays an important role in the economy, and as such, involves the construction of various types of tall and slender industrial objects. In a coal-based (conventional) economy, such objects include smokestacks and cooling towers, and in a renewable energy-based economy-wind turbines. Their proper operation is critical for the safe generation, transformation, and transmission of energy. From the structural-engineering perspective, such objects are very different. However, they still share some features: they are circular in a horizontal cross-section, they have large foundations, they are typically constructed of concrete or concrete and steel, and they have thin outer walls. All such structures must withstand loads due to changing wind conditions, and wind turbines are additionally subjected to loads due to the varying parameters of the movement of their rotors. Over the last few years, an increase has been observed in the share of wind generation in the energy mix, as well as in the energy efficiency of wind turbines and in the yield of renewable energy from wind [1]. On the other hand, a more frequent and intensive operation of wind turbines causes them to be more often and intensively affected by dynamic loads, and entails, as a result, more frequent cases of deformations and catastrophic events [2].
Therefore, measurements of loads acting on such structures, and in particular dynamic tests of their deformations, are very important for the evaluation and forecasting of their condition and its change in time (i.e., for the monitoring of the condition of the structure) [3]. Moreover, actual deformations of smokestacks, cooling towers, and wind turbines must be measured in actual operating conditions [4,5,6]. Measurements of the geometrical condition of an object allow a verification of models used in theoretical calculations and in forecast comparisons [7,8,9,10,11,12,13]. The technique used in the measurements of the geometry of cooling towers, smokestacks, and wind turbines is identical for all these types of objects. The most significant deformations of slender objects can be expected in the main wind direction. However, the levels of wind loads vary constantly as a result of variable weather conditions [14,15]. Direct access to an object located in the area of an active industrial facility or in a wind farm is very often limited. Frequently, the object is not fully visible, and the line of sight is blocked by both natural and anthropomorphic objects. In effect, a measurement from only one position is insufficient to evaluate the deformation of an object. In order to fully characterize the movement of such industrial objects with the use of a ground-based apparatus, at least three survey locations are needed. They allow the location of the axis of the object to be identified in two perpendicular axes, and also enable the evaluation and control of measurement accuracy. Moreover, the survey should not require the installation of additional markers on the object and should be possible from a distance greater than 150 m. The most important indicator of the stability of a structure is the verticality of its axis: exceeding its limit displacement values leads to a catastrophic and destructive event. However, changes on the side surface of a structure can also significantly contribute to its destruction. In order to avoid a catastrophic event, the geometry of slender objects is regularly controlled.
One of the methods commonly used for measuring deformations of slender industrial objects is to use strain gauges and accelerometers installed inside or outside the object. This method is particularly often used in monitoring the geometry of wind turbine towers [16,17,18,19]. However, such sensors can provide information about the movement of the object as recorded only in the installation locations. Moreover, the sensors must by installed physically on the object and at a certain height, and such a procedure may not always be possible due to limited accessibility. For example, the installation of such sensors inside smokestacks or cooling towers is impossible due to the operating conditions and contaminations. On the other hand, their installation outside is technically difficult and the sensors are prone to damage. Some authors analyze the geometries of tall industrial objects in a continuous mode, allowing for the changes of weather conditions during the measurement [20,21,22]. This approach, however, entails some problems related to the measurement duration, as the measurement on each stand lasts for at least several dozen minutes. With the view to the above limitations, two indirect methods of monitoring the geometry of slender objects are proposed. They involve optical measurements from a greater distance and do not require the installation of additional elements on the object. The first method is based on the use of a non-prism total station (TCH), and the second is based on the automatic terrestrial laser scanning (TLS). Terrestrial laser scanning automates and, in a sense, simplifies total station surveying (TCH), being an expansion on it or a supplement to it [23]. Surveys of slender objects follow the photogrammetric method or the surrounding tangential method. However, for technological reasons, the surrounding tangential method cannot be used in the measurements of cooling towers, as the identified ray lengths become artificially reduced. Moreover, the method is very time-consuming, which becomes a limitation in variable measurement conditions. Photogrammetric methods provide the image of an object in one unit of time, and if paired with edge detection or texture difference detection, they can be used to analyze the condition of an object. However, they require stereoscopic images obtained from different measurement locations, and this fact extends the measurement time. An UAV measurement is possible, but less accurate [24]. Another limitation of photogrammetry results from the distance to the object. Obtaining high-resolution photographs from great distances is technically limited, and the processing of the resulting large data files requires a lot of time [25].
Considering all of the above limitations, this study was based on two methods, and the laser scanning method is a development of the tachymetric method with the use of an automatically generated laser beam. The TCH survey was performed with the non-prism method by measuring the horizontal and vertical directions as well as the distance to the object. The laser-scanning measurement was performed by sending a laser beam to the object and by measuring the frequency and phase of the return signal in the horizontal and vertical direction. If measured from only one location, deflections in the vertical axis of an object can be identified only in the measurement direction and in the perpendicular direction. In order to measure the deflection in two axes, at least two survey locations are required. However, two survey locations are insufficient to evaluate and control the accuracy of such a measurement. Such evaluation and control are possible if measurements are performed from three locations. For the measurement of the radius of an object to be correct, it must be performed on one level (the points must be on an identical height). And the monitoring of changes over time requires the measurements to be performed for precisely identifiable measurement points, which are identical over time.
Total station survey (TCH) is the most typically used technique of monitoring deformations in industrial objects, such as bridges, smokestacks, cooling towers, and others. They are advantageous in that they are uncomplicated in both the use of the apparatus and the calculation of the final values. Moreover, the fact that the measurement points are identical over time allows the deformations to be correctly interpreted. On the other hand, the length of the TCH measurement is its disadvantage. In the case of slender objects, the limitation of the method lies in the time available and in the variability of external conditions, as well as in the need to use additional elements of the total station (the bending prism). A proper TCH survey requires at least 3 measurement locations, and the transfer between the locations can take from more 10 ten minutes to up to several hours. Over such a long period of time, the weather conditions can change diametrically.
Terrestrial laser scanning (TLS) is a well-known technique used for monitoring deformations in large objects from great distances and from a minimum number of measurement locations without the need to employ reflective markers. TLS has been used in the monitoring of the deformations inter alia of bridges, dams, tunnels, and towers [26,27]. Schill and Eichhorn [28], Mitka et al. [29], and also Artese and Nico [6] used TLS to investigate the deformations of wind turbine towers, Muszyński and Milczarek—the deformations of smokestacks [30], and Kocierz et al.—of cooling towers [31]. The above authors used laser scanners in linear scanning mode to scan the objects along their vertical axes. However, the deflections and the corresponding deformations were measured in only one axial direction.
A comparison of the measurement methods used on different industrial objects allows conclusions about the usefulness of a particular method for a particular type of an object. On the one hand, the measurement duration is problematic from the perspective of variable external conditions, and on the other hand the fact that measurement locations remain identical over a longer duration of time allows information on the changes in the geometry of an object in time. The possibility to minimize the number of measurement locations is another aspect important in the case of slender objects. A measurement performed from one location limits the spatial analysis of the deformation to only one half of the object—the other half remains invisible and cannot be properly interpreted in geographical terms. Although it is possible to fit the circle or the ellipsis in three measurement points, the results do not reflect the actual shape of the object considered as a whole. The error for fitting a circle in points on one side of the object is different than the fitting error for points regularly distributed on the object.
The change, or the deflection of the axis of an object due to uneven subsidence of its foundations, is measured independently with the use of differential leveling. Level surveys allow the deflection of the base of the object to be measured in 2 perpendicular axes. In the case of a smokestack or a wind turbine, this base is represented by the foundations on which the measurement points are located, and in the case of a cooling tower, by the load-bearing piles of the structure and by the foundation plate. The difference of the height changes in successive measurement stages of an object indicates the deflection of its axis. The value of the deflection can be calculated if the distance between the measurement points is known. The above measurement follows an assumption that the foundation behavior is described in terms of the behavior of a rigid body. This assumption was not followed in the present study. The maximum values of deflections for slender structures are described in both ISO and Eurocode standards. In the case of the objects investigated in this study, the maximum deflection values are as follows: wind turbine tower—346 mm, brick smokestack—275 mm, cooling tower—133 mm. Exceeding these values may lead to catastrophic events. The calculated deflection values are the basis for discontinuing the operation of the object and performing the necessary repairs and maintenance works [32,33]
The total station survey and the TLS measurements were performed on actual objects: a wind turbine, a smokestack, and a cooling tower. For reference purposes, there were used coordinate systems with the centers in the axes of the surveyed objects on the lowest level possible for measurement. The survey methods were compared with respect to the accuracy of the obtained results. The summary of the measurement results and the predictions regarding the application of the survey technologies are provided at the end of this article.
2. Materials and Methods
2.1. The Principles and Methodology of the Measurements
2.1.1. Total Station Survey (TCH)
The measurement of the spatial coordinates of a point consists in identifying the values of three coordinates in the local coordinate system related to the surveyed object. The center of the coordinate system overlaps with the center of the object. The measurement of the coordinates is possible with respect to the survey control network established locally for the object and represents its coordinate system. Spatial coordinates (x, y, z) of the control network points are known in the local system. All of the points have their coordinates defined in the coordinate system of the object. Prior to the measurement, the survey control network must be measured, and the results must be aligned with the use of the least squares methods. A local system is the best solution in the case of surveying industrial objects: the measurement results are not affected by the cartographic distortions present in the state-managed cartographic systems. The coordinate system is used on a small area, and, in addition, a limited surrounding area may be treated as a plane surface. A measurement performed from different locations provides a spatially uncomplicated and unambiguous 3D coordinate system. The measurement consists of the identification of horizontal and vertical angles and also of the distances to the points, as well as of the calculating of the coordinates on the surface of the object by implementing trigonometric function.
2.1.2. Terrestrial Laser Scanning (TLS)
Terrestrial laser scanning (TLS) consists of the measuring of the distance by implementing, as in the case of the total station method (TCH), the principle governing the travel time of the laser beam. Laser spots are emitted in pulses and the time, t, required for the light to reach the target and return to the scanner is then measured. At light speed c, the distance s can be calculated from a simple equation: s = (c × t)/2. Terrestrial laser scanners operating in linear mode have a rotating mirror that scans the emitted laser beam at a set scanning angle θ with N increment steps. With the measured distances s(n), n = 1, …, N and with the known width of the angular step Δθ = θ/N, the measured points on the surface of the object were first obtained in polar coordinates and then transformed into a 2D form of the coordinates of the measurement location. Subsequently, the clouds of points must be combined on unambiguously identified points in the terrain. The points can be marked with survey targets. The combination of point clouds obtained from different locations provides a full view of the surveyed object in the coordinate system related to the surveyed object. The combined point clouds are subsequently transformed to the coordinates of the surveyed object in order to analyze the changes with respect to the prior measurement or to theoretical values.
2.2. Study Methodology
Changes in the geometry of a surveyed object are analyzed by monitoring horizontal and vertical displacements on the basis of the changes of the coordinates in time. The reference surface is typically a model of the object constructed from its design plans or the coordinates from earlier direct in situ measurements. A system of rectangular coordinates is attached in the center of the object on its lowest level. As a result, it is unchangeable and can be reproduced during the measurements or calculations. Figure 1 shows the measurement levels on each of the surveyed industrial objects.
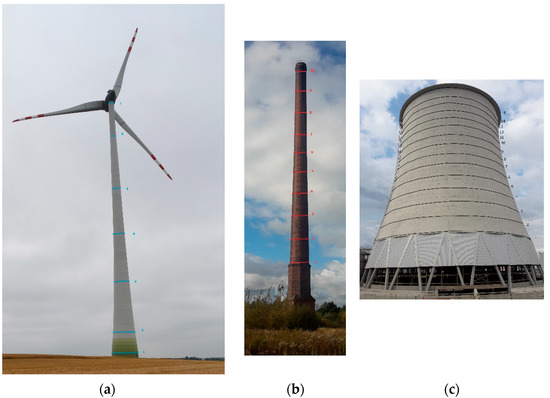
Figure 1.
Photographs of (a) wind turbine tower, (b) smokestack, and (c) cooling tower with the measurement levels.
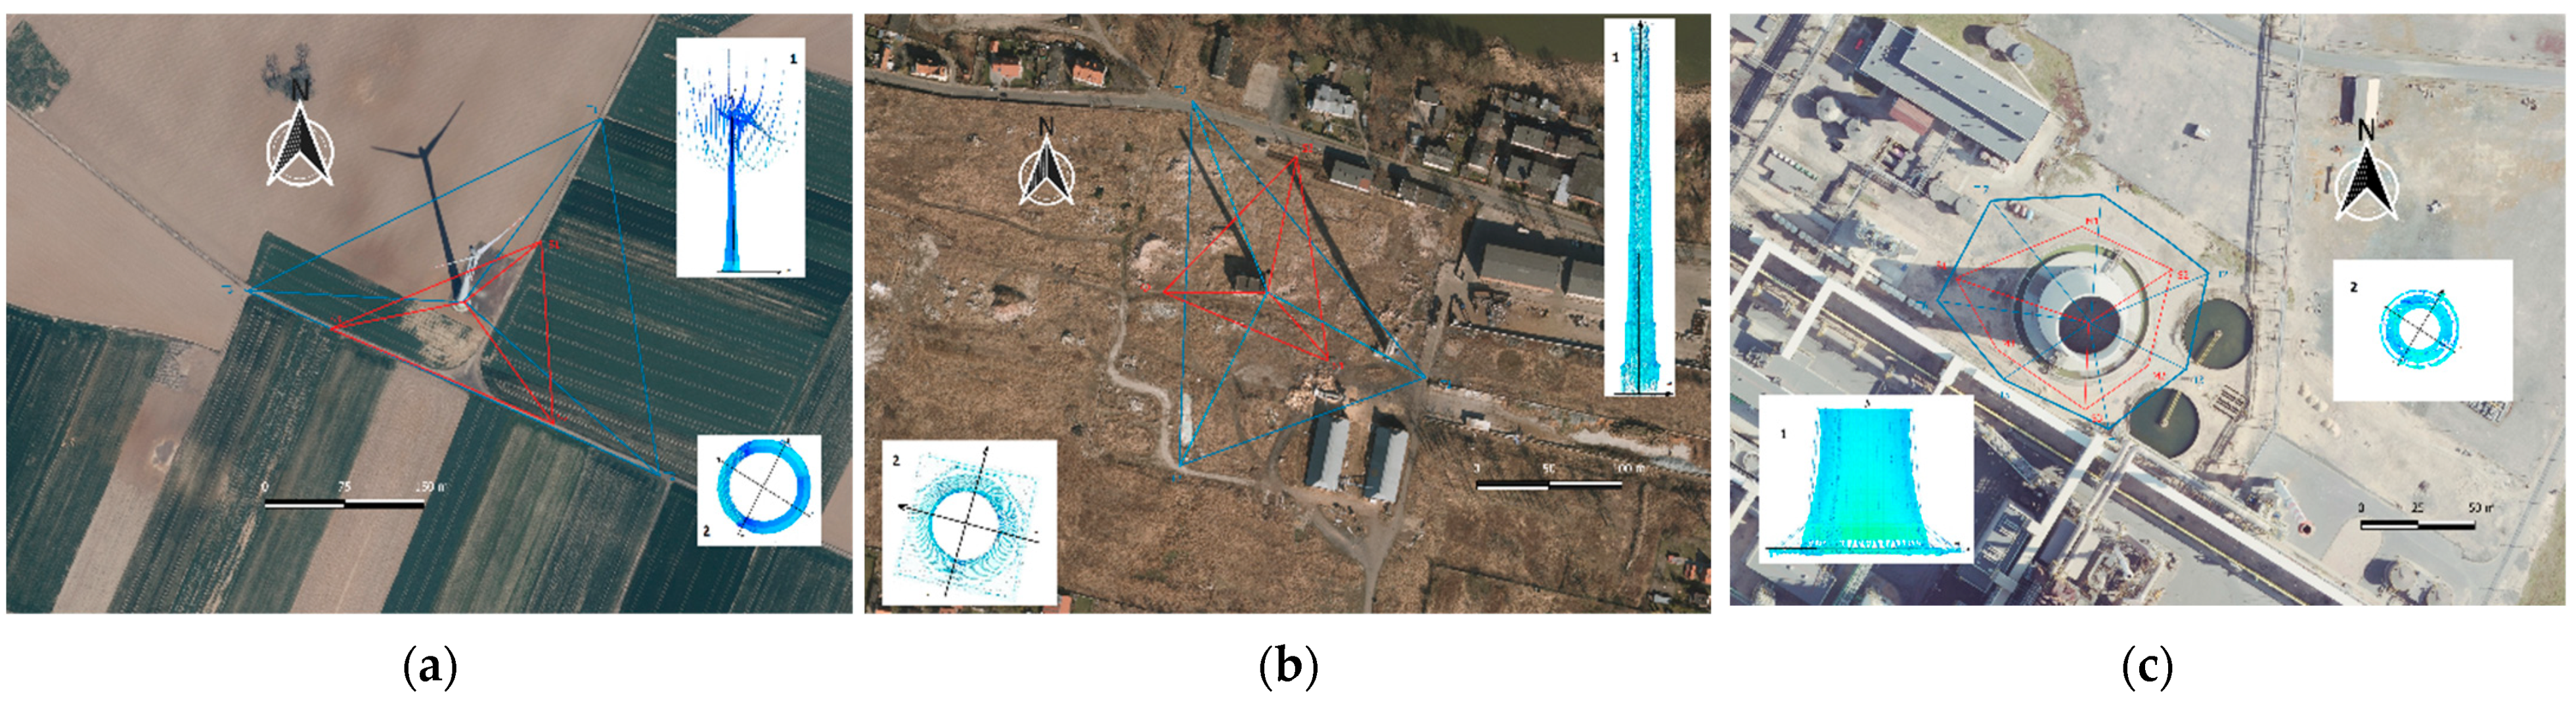
The coordinate system is not oriented to the north but can be consistent with the measurement direction. Figure 2 shows the measured objects together with the control network and the local coordinate system adjusted to the object.
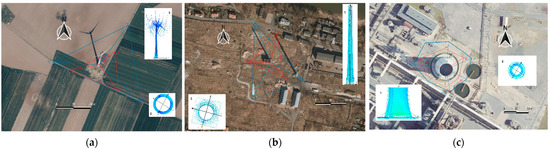
Figure 2.
Positions of the measurement locations around the objects together with the local coordinate system: (a) cooling tower, (b) smokestack, (c) wind turbine tower. (1) Scan of the object—side view, (2) local coordinate system–top view. Blue lines–control network, observation range, and total station positions; red lines–control network, observation range, and laser positions. Image in the background—orthophotomap from the Geoportal web service (https://mapy.geoportal.gov.pl/ accessed on 15 November 2021).
Both the TCH and the TLS surveys allow new coordinates to be obtained for the points on the generator of the side surface of the object. The displacement is the change of coordinates in time between consecutive measurements or with respect to the theoretical values assumed during the construction phase of the object.
2.3. Horizontal Displacements and Deformations
Horizontal displacements are measured by determining the changes of the object location on a horizontal plane along two axes and by fitting the point distribution on the surface to the theoretical shape. Horizontal displacement analysis is performed in horizontal cross-sections, calculated for different levels of the object. Depending on the height, complexity, and construction technology, the number of such levels can vary from several to several dozen. Objects, such as wind turbine towers and smokestacks, have a regular shape and therefore the measurement levels do not need to be arranged with a great density, because such a TCH survey would require a lot of time in constant external (atmospheric) conditions. Cooling towers have a more complicated shape, and therefore need to be measured on more levels. During a TCH measurement, in which the surveyor aims at a certain point on the object, the number of measurement levels should be possibly limited. Such limitations are not present in the TLS method, as the measurement is much quicker and covers the entire height and width of the object. The measurement levels are defined with an accuracy of 2–3 cm, which is sufficient to ensure that the calculations are correct. Figure 1 shows the distribution of the measurement levels.
The next calculation step is to fit a circle in the measurement points of the same level. The fitting is performed with the use of the least squares method and with simultaneous calculations of the center of the circle and of deviations from the circle, in accordance with the principles discussed in the literature [34,35].
By measuring the values of the coordinates on successive measurement levels, it is possible to calculate the deflection of the axis of the object in the horizontal plane. The deviation from the center is the deviation of the envelope of the surveyed object.
3. Test Measurements
3.1. Measured Objects
The proposed survey methods were verified on a wind turbine, a smokestack, and a cooling tower. All of these objects are located in Poland: the wind turbine tower and the cooling tower are in continuous operation. The smokestack is located on the premises of a closed industrial facility. The measured wind turbine tower is part of a 3.0 MW Enercon E-115 turbine located in the vicinity of Wroclaw. The rotor is installed at the height of 149 m. The turbine tower is a conical hybrid structure: Its lower part (57 m) is made of concrete, and its upper part is made of steel. The measurements were taken on seven levels (see Figure 1a), distributed irregularly along the entire height of the tower in accordance with the structural parameters of the tower. The measured points corresponded to the characteristics of the structure. Figure 3 shows the location of the objects on the map.
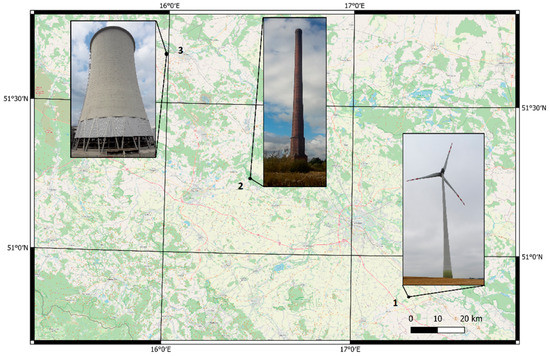
Figure 3.
Location of the surveyed objects on the map: (1) wind turbine, (2) smokestack, and (3) cooling tower. Map in the background: Open Street Map (http://www.openstreetmap.org, accessed on 23 November 2021).
The surveyed smokestack is 110 m high and is located in Malczyce. The smokestack is a conical structure made of brick. The measurement points were located on 10 levels (see Figure 1b), distributed regularly along the entire height of the object. The smokestack is to be demolished. The cooling tower is 60 m high and is located in the vicinity of Glogow. The axis of the tower was measured for vertical displacement on 15 levels (see Figure 1c), distributed regularly along its entire height. The parameters of the measured objects are presented in Table 1.

Table 1.
Characteristics of the measured objects.
The deformations (imperfections) of the shapes of the objects were identified on the basis of deviations from the fitted circles on successive measurement levels, with the reference level being level “0”, possibly located close to the terrain surface.
3.2. The Measurement System and Its Configuration
The TCH measurements were performed with the use of the Trimble S3 robotic total station having an accuracy of ±2” for horizontal and vertical measurements, and ±(2 + 2) ppm for distance measurements. The TLS measurements were performed with the Riegl VMZ-400 infrared laser scanner. It provides 1000 measurement points at the scan angle θ = 90°, which translates into the angle step Δθ of 0.09°. The scanning frequency is 60 Hz and can be increased to 120 Hz with the number of points reduced to 500. This study was performed with the use of the 60 Hz frequency. According to the manufacturer, the measurement inaccuracy is 5 mm, although it can be expected to be higher at greater distances. Table 2 presents the accuracy parameters of the two devices.
Table 2.
Measurement accuracies with respect to the control network.
The obtained accuracies were very similar for each of the surveyed objects regardless of the measurement method. The use of identical apparatuses ensured similar accuracies.
3.3. Measurement Results
Each of the objects was surveyed in favorable weather conditions, in the absence of precipitation, at light wind (2–5 m/s), and with mostly clear skies. In each case, the surveying team waited for similar atmospheric conditions that would remain unchanged over the entire measurement duration. The measurement on one total station location lasted for approximately 45 min. Each object was measured from three locations. Including both the duration of each measurement and the time needed to transfer between the locations, the entire measurement duration of one object was approximately 3 h. The TLS measurement on one location lasted for approximately 7–8 min, and including the time needed to transfer between the locations, the entire measurement duration of one object was approximately 60 min. The smokestack was surveyed in October 2021 at an average wind speed of 2.8 m/s from south-east direction. The total number of stations and the laser scanner were positioned in three locations, at different albeit similar distances from the smokestack. The cooling tower was surveyed in September 2015 at an average wind speed of 4.50 m/s from the north-west direction. The measurement apparatus was positioned at different albeit similar distances from the cooling tower. The wind turbine tower was surveyed in June 2021 at an average wind speed of 3–4 m/s from the west. The distances of the measurement locations from the objects are different, but possibly similar and depend on the terrain conditions. In each case, the distances were selected so as to reflect the geometry of the entire object observed from a minimum number of locations. Figure 2 shows the measurement locations.
Regardless of the method, each object was surveyed at the same time. However, the TCH surveys finished later than the TLS surveys.
4. Results
4.1. Deflection of Object Axis
The TCH survey requires not only the measurement but also calculations against the control network set around the surveyed object. The calculations were performed with the use of the least squares method. The results indicate the measurement accuracy of a particular location. In the case of the wind turbine tower, this inaccuracy is mp = ±2 mm. Based on the results, coordinates were defined on the generator surface with errors resulting from the propagation of uncertainty. The coordinate errors do not exceed the value m(x, y, z) = ±4 mm for TCH and m(x, y ,z) = ±8 mm for TLS. The observations enabled the calculations of circle fitting and of circle centers for each of the methods and for each of the objects. The error of identifying the circle center results from measurement accuracy, from control network determination accuracy, and also from the fact that the values of circle fitting on each level are different. The circle fitting error depends on the number of points approximated on the circle. This number is significantly lower in the TCH method, from 6 to 30. In the TLS method, the side surfaces of the wind turbine tower and of the smokestack contain from 100 to 300 such points, and the generator of the cooling tower envelope contains from 4000 to 5000 points. The axis deflection values are shown in Table 3 for the wind turbine tower, in Table 4 for the smokestack and in Table 5 for the cooling tower, along with the error of identifying the center of the fitted circle (δo) provided in millimeters. The results of horizontal displacement calculations with respect to the survey method and to the surveyed object are presented in further tables below.
Table 3.
Horizontal deflections of the wind turbine tower.
Table 4.
Horizontal deflections of the industrial smokestack.
Table 5.
Horizontal deflections of the cooling tower.
The deflection values are shown in the figures below (see Figure 4, Figure 5 and Figure 6), separate for each of the objects. The value of the deflection is provided in millimeters, in accordance with the requirements of international standards [31,32,36,37,38]. The deflection of each of the surveyed objects shown in the figures does not differ significantly, regardless of the survey method used. The error values (standard deviations) differ depending on the survey method and on the object. The smallest measurement error is observed in the case of the TCH method. The greatest error is in the TLS measurement of the cooling tower. The measurement accuracy depends on the structure of a particular object. The entire surface of the wind turbine tower is smooth, the bricks of the industrial stack are porous, slightly damaged, and the concrete in the side surface of the cooling tower has the most porous surface. Expectedly, with a high number of points, the distribution of fitting errors for non-uniform surfaces increases in a manner directly proportional to the porosity of the surface. However, with a high number of points observed at the same height, the errors apparently remain on a similar level.
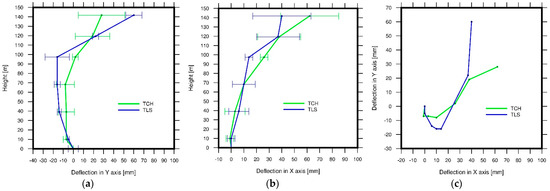
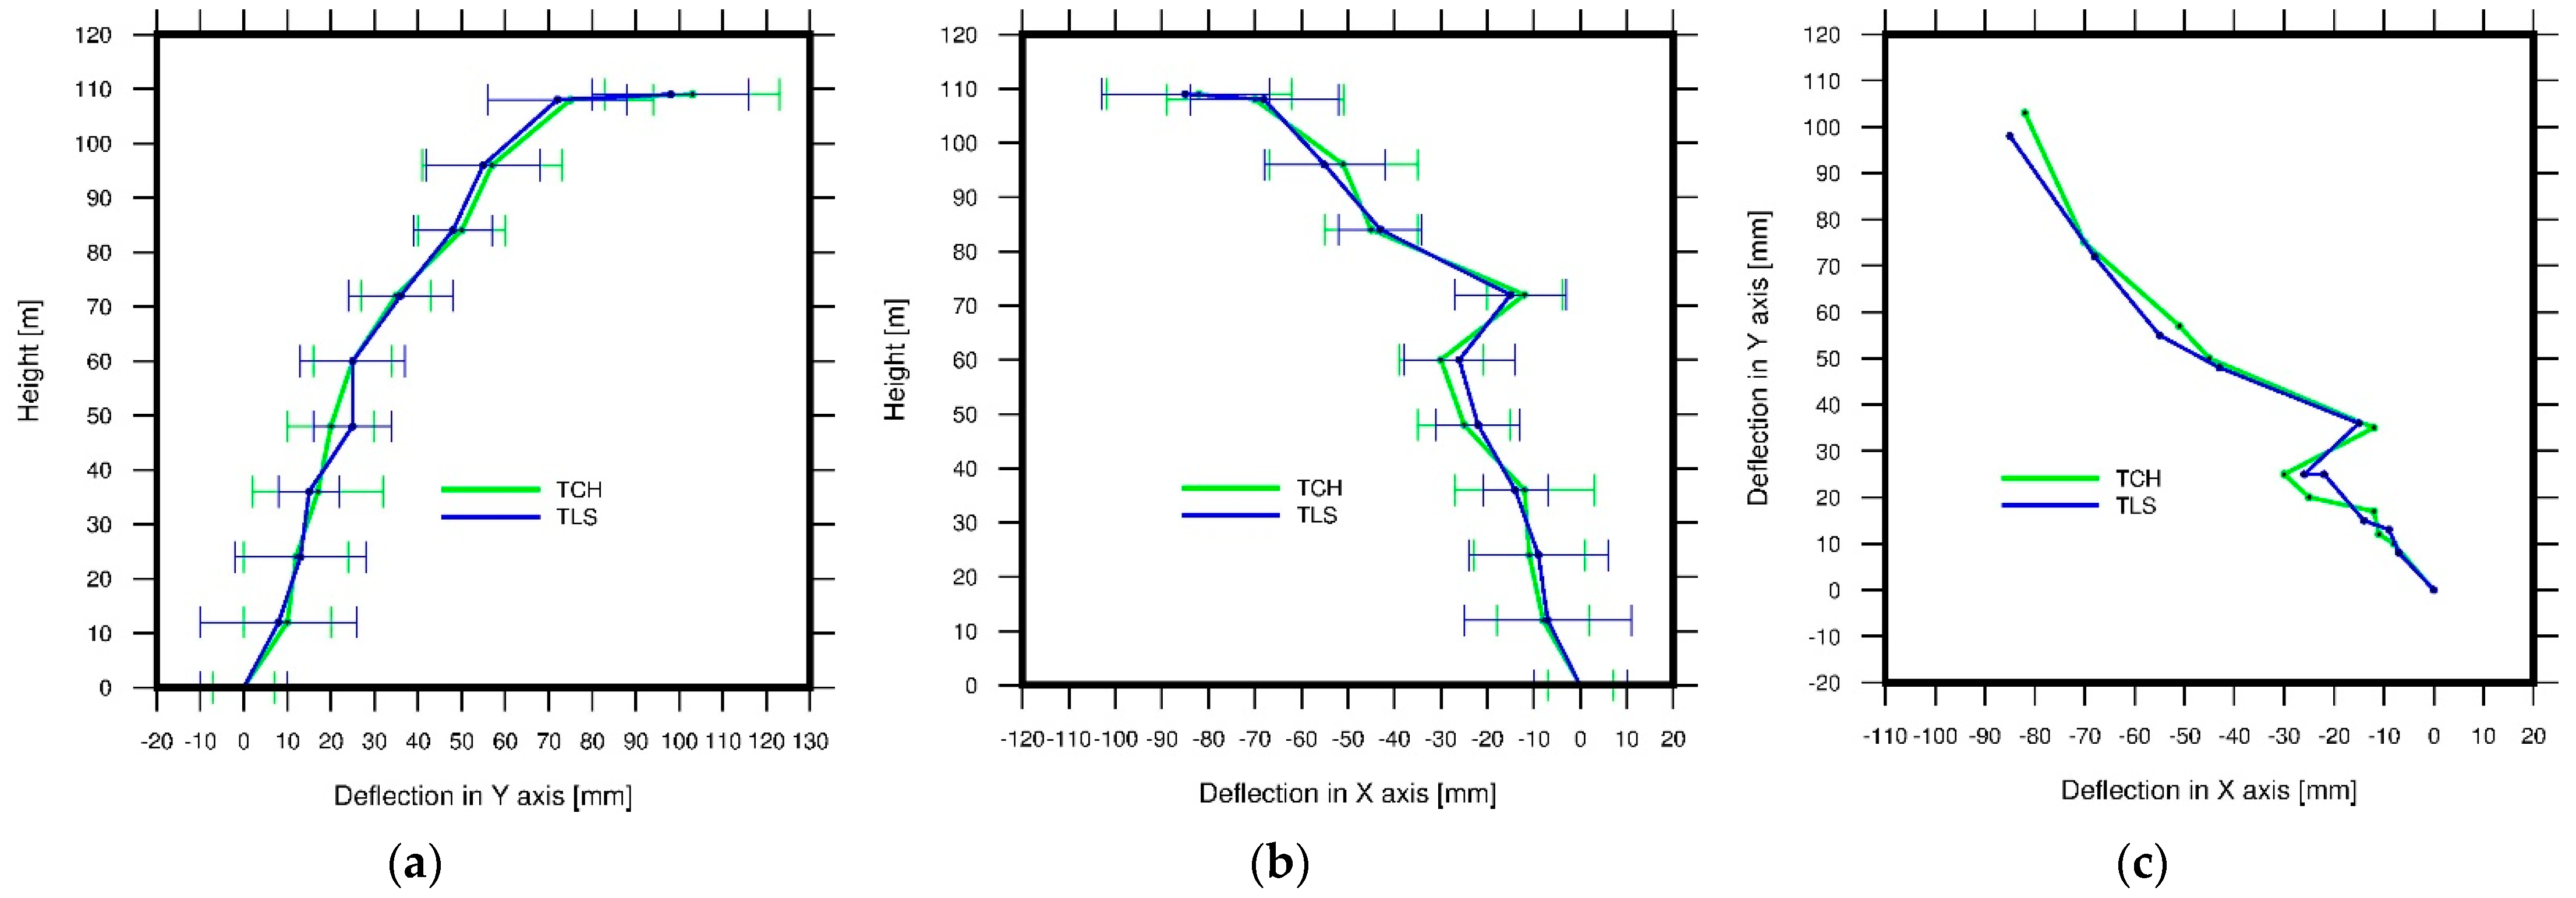
Figure 4.
Deflection graphs of the wind turbine tower: (a) in the YZ axis, (b) in the XZ axis, and (c) in the XY axis. In XZ and YZ axis vectors are with error bar in millimeters.
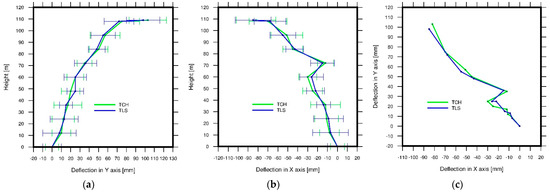
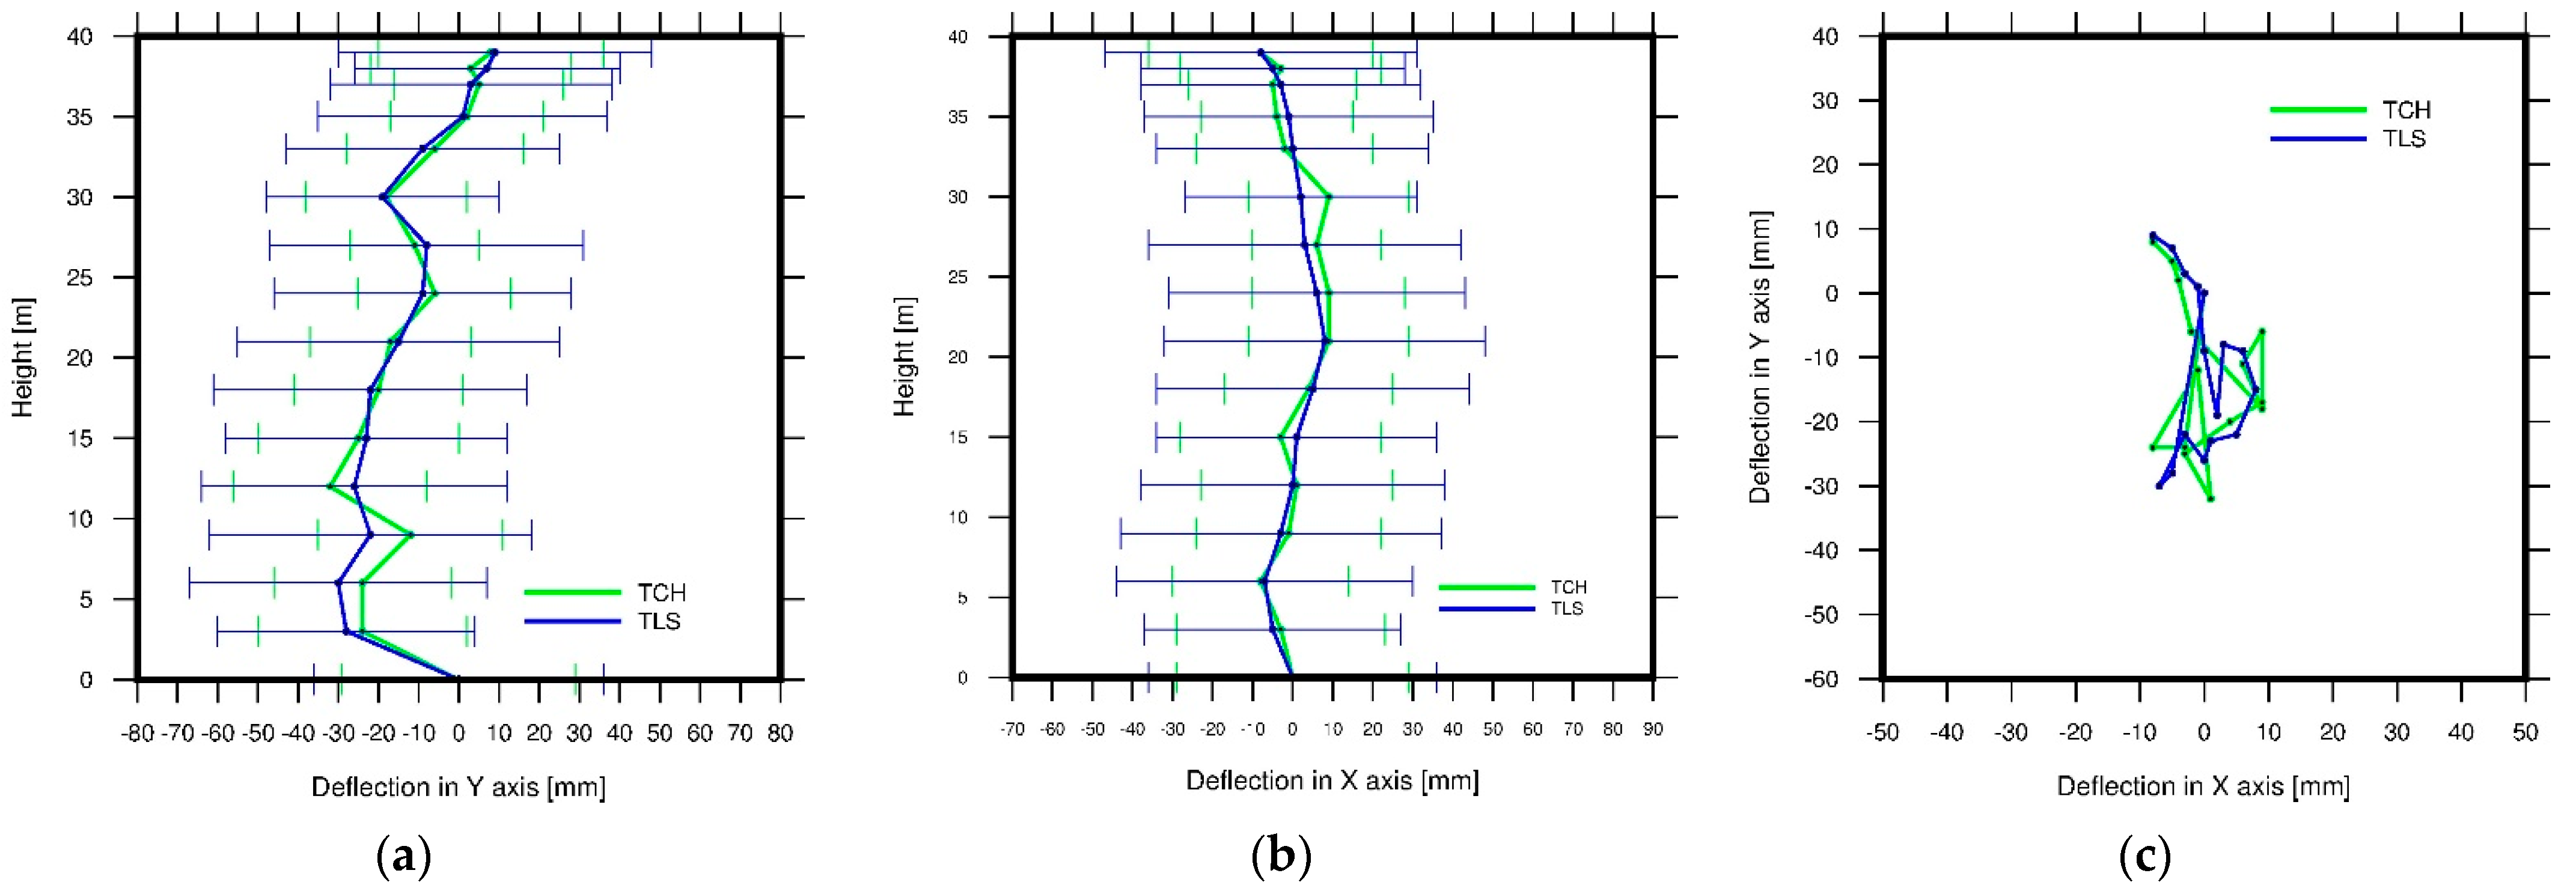
Figure 5.
Deflection graphs of the industrial smokestack: (a) in the YZ axis, (b) in the XZ axis, and (c) in the XY axis. In XZ and YZ, axis vectors are depicted with an error bar in millimeters.
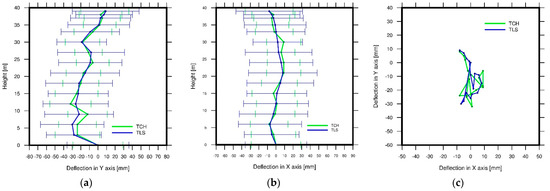
Figure 6.
Deflection graphs of the cooling tower: (a) in the YZ axis, (b) in the XZ axis, (c) in the XY axis. In XZ and YZ, axis vectors are depicted with an error bar in millimeters.
Both the table and the graph show that the deflection of the wind turbine tower is the most variable, which is the result of its structure: tall and relatively flexible, it is very sensitive to even the weakest wind gusts. The rotational movement of the rotor, although it was slow during the measurement (several m/s), causes additional minor deflection of the axis. In this case, the total station measurement differs from the laser scanning: the latter shows greater deflection along the entire axis length of the tower. Although the TLS measurement was shorter and may be considered more reliable, the total station measurement, being longer, is actually more effective at representing the total movement of the structure. Unfortunately, in this case, the accuracy of displacement measurement decreases due to the measurement duration. A regularity can be observed in the case of each measurement: the longer its duration, the lower its accuracy. The greatest deflection is observed in the steel part of the tower; it changes dynamically and has a stepwise character. The deflection of the cooling tower is minor in comparison with the deflection of the smokestack or the turbine tower, and the stability of the structure is very good regardless of the atmospheric conditions. The deflection at the top of the wind turbine tower, just under the rotor, reaches 72 mm. The object can thus be operated safely, as the above-mentioned limit values are not exceeded.
The deflection of the smokestack axis, as measured with the two methods, are in the same directions. The axis visibly deflects in the direction consistent with the prevailing wind direction, i.e., in the south-east direction. On the measurement day the wind was in the west direction. It might have contributed to the deflection of the axis by several hundredths of a millimeter. The smokestack axis deflects evenly up to the height of 70–80 m, and an increase in deflection value is observed in its upper part. This fact may be due to sudden gusts of wind, which cause the uppermost part of the smokestack to deflect more in consistence with the prevailing wind direction. The deflection of the highest measured point on the smokestack, close to its top, is 132 mm. The safety limit is not exceeded. The smokestack is non-operational and used as a tower for telecommunication antennas.
The cooling tower-axis shows a minor deflection, which is natural, as the object is not tall and rather wide. Although the envelope of the cooling tower is very thin relative to its height, the stability of the entire object is noticeable. The deflection of its axis is multi-dimensional and varies within ±30 mm, depending on the survey method. The green color in the graph represents deflection measured with the total station, and the blue color represents deflection measured with the laser scanner. The color designations in the successive graphs are identical. The maximum deflection of the cooling tower reaches 31 mm. It is below the limit value and allows the tower to be safely operated.
4.2. Geometric Imperfections
The safe operation of a slender object requires measuring not only of its deflection, but also of the geometric imperfections of its envelopes. In this case, the first measurement level for each of the structures was used as example to demonstrate the principle behind the measuring of envelope deformations. An additional advantage of the calculation approach based on the circle fitting with the use of the least squares method lies in the possibility to calculate imperfections as a deviation from the theoretical circles on the surface of the object. Fitting deviations (vi = Rt − Rp), where Rt is the fitted radius, and Rp is the measured radius, provide the deformation values of the actual surface.
The fitting of circles on successive analyzed levels allowed the calculation of deviations from the circles, which represent information about the geometric imperfections of the surveyed objects. The number of the deviation values is different and depends on the object and the control points distributed along the meridians on the surveyed object. The changes were illustrated in circle fitting deformation graphs for the wind turbine tower, the smokestack, and the cooling tower.
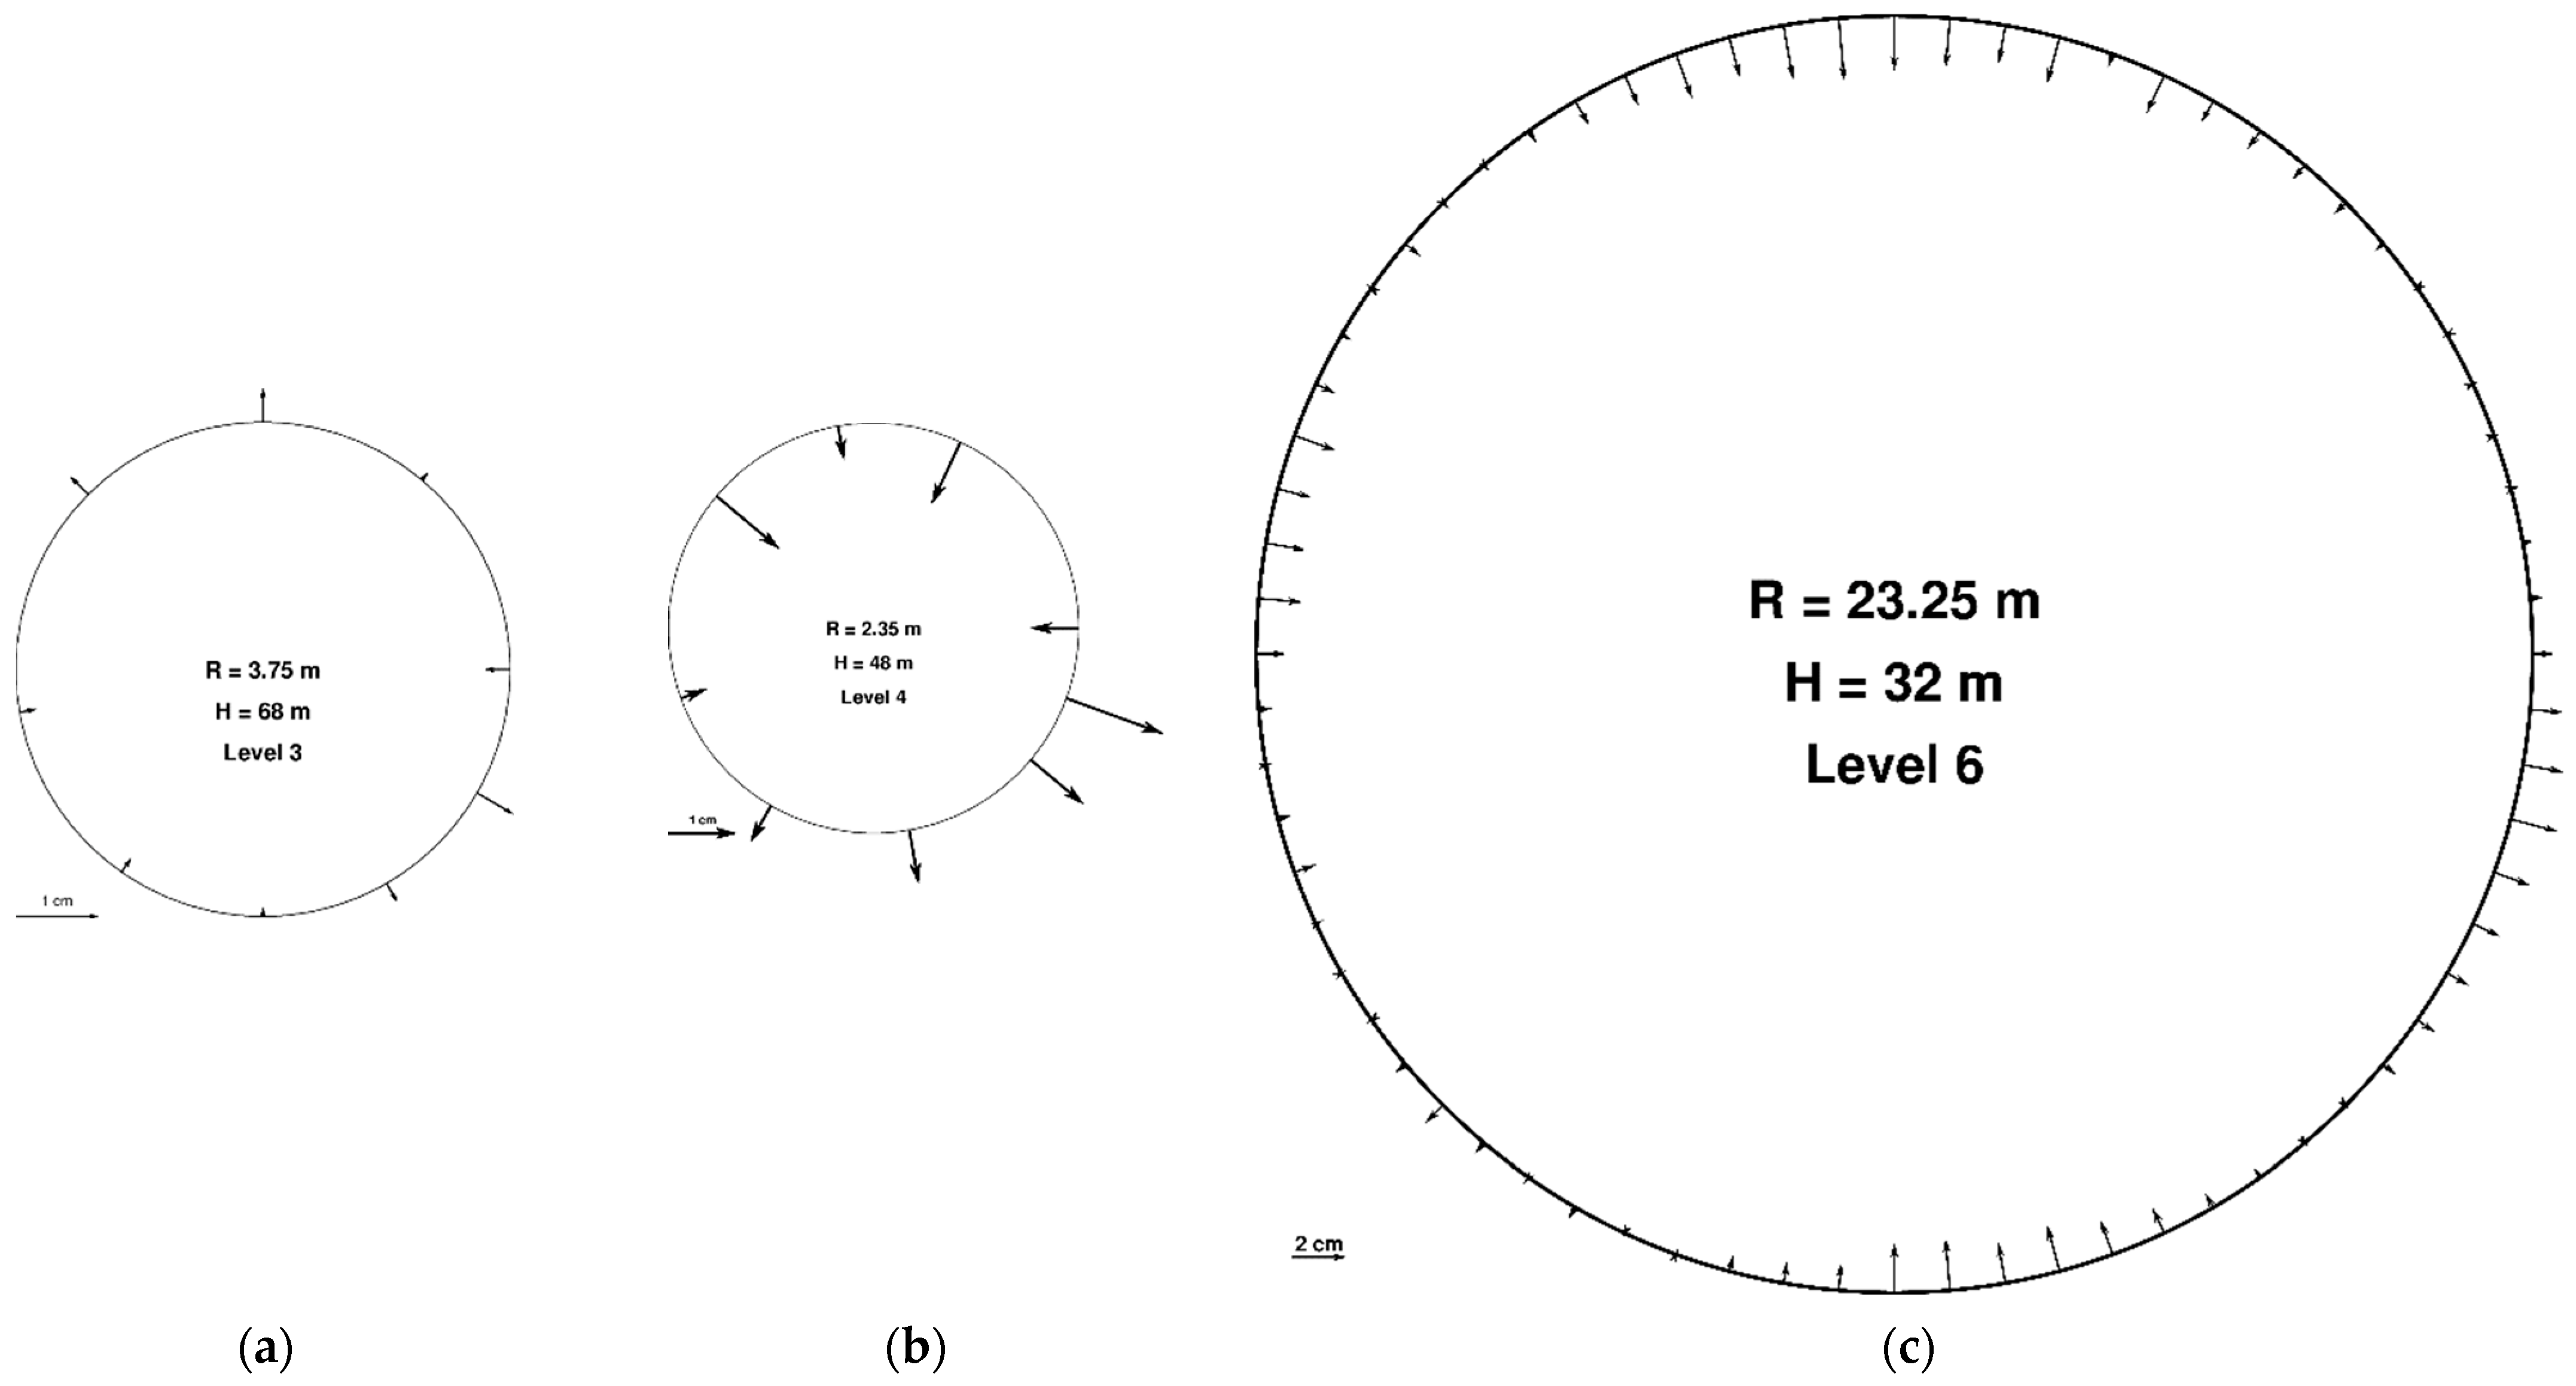
The graphs of the changes indicate the deflection directions. The deflection values are also the imperfection (deformation) values of the envelope of the surveyed object. The graphs indicate the deformations of the outer envelope of the wind turbine tower in its central part, at the height of 70 m above the ground (see Figure 7a). The measurements were performed with the use of the total station method and the case is similar with the deformations of the smokestack in its upper part, 80 m above the ground, as shown in the next figure (see Figure 7b). The last figure shows the deformations of the envelope of the cooling tower in its lower part—10 m above the support piles (see Figure 7c). The study involved the point cloud from the TLS measurements. The deformations are related mainly to the prevailing wind direction. This type of geometric analysis serves to identify the geometric deformations of the surveyed envelopes.
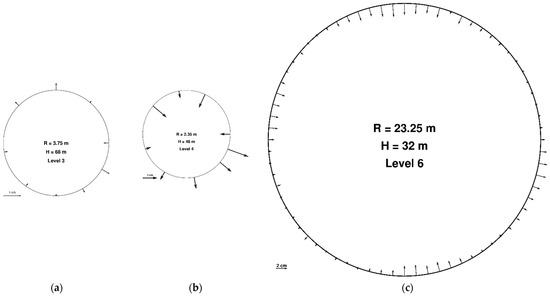
Figure 7.
Representative graphs of circle fitting for: (a) wind turbine tower, (b) industrial smokestack, and (c) cooling tower. The deflection vectors are scaled with respect to the object size.
5. Conclusions
The power-industry objects measured with the use of two independent methods show changes in the geometry of the surface generators. Regardless of the applied method, the results are similar at a high measurement regime—at identical measurement conditions. The conclusions are related to the methodology of direct surveys performed for slender objects. The total station surveys are accurate and, importantly, repeatable. Each measurement cycle is based on the same points, albeit not stabilized or marked on the surface of the object. The implementation of a coordinate system related to the object stabilizes the point system on the surface. The measurement duration is a certain limitation, as it is approx. 30 min and that being despite a relatively small number of points on the surveyed surface. This may be a disadvantage in dynamically changing atmospheric conditions. Another limitation results from the fact that the number of points is relatively small: if their density is increased and if they are all measured, the required measurement duration may be extended by as much as 100% or 200%. Each of the points must be targeted independently. The TLS method proves very effective in the measurements of the geometry of objects that quickly change in time; the measurement is quick, the number of is points high, and they are identified with high accuracy. However, the limitation of the method lies in its repeatability; each measurement entails the identification of new points on the surface. Regarding the theoretical shape of the surface, its changes can be defined, but only the changes that are related to the measurement moment. Unfortunately, the surveyed points are identified randomly and depend on the angle of mirror realignment and on the moment in which the measurement starts. This is the case with great distances, and when a survey is performed from three independent locations, the scanner must be located at an appropriately great distance (approx. 150 m). At such great distances, it is impossible to set the scanning parameters so that the points are repeatable—a shift several centimeters in length will occur even if the greatest care is shown. Repeatability can be obtained by using survey targets, but this solution is not available for every object. Another advantage of laser scanning is the possibility to define any number of measurement levels already after in situ measurements are completed. This is impossible in the total station method. In conclusion, the surveying method should be selected depending on the needs, the time available, and the measurement scope. The TLS method proves more effective in the case of measurements in changing atmospheric conditions (wind turbine towers); however, in the case of objects that are less sensitive to variable atmospheric conditions, and in particular to wind, the total station method can, and sometimes should, be used. The geometry of tall objects in the energy industry requires constant monitoring. The destruction of an object involved in the generation, transformation, or transmission of electric power may entail considerable disruptions or even a failure of the power system. The proposed measurement methods may be also applied to other objects, such as pylons, silos, posts, or other supports. The only requirement is for the horizontal cross-section of the object to be circular, so that the circles that serve to analyze the vertical deviations of the axis can be fitted into it.
When the measurements were performed, the power-industry objects discussed in this study were in good technical condition. Their identified geometries were acceptable, and the objects did not need to be withdrawn from service. However, in the case when the limit values are approached, within the measurement error, the operation of such objects should be discontinued, and they should be repaired. Typically, the geometries of slender objects are inspected annually. Comparison with the results from the previous year indicates the deformation direction. Increased deviations from the vertical may lead to a catastrophic event and cause the operator of the object to incur significant costs, which may be avoided if the geometry of such structures is regularly measured. Failure to perform such regular monitoring increases the risk of unexpected downtime and, on some occasions, even irreversible damage of such an object. The proposed measurement and result-analysis methods offer a time-efficient and accurate verification of the technical condition of slender objects in the energy industry.
Funding
This publication was supported by the Open Access Publication Fund of Wroclaw University of Science and Technology, Faculty of Geoengineering, Mining and Geology.
Institutional Review Board Statement
Not applicable.
Informed Consent Statement
Not applicable.
Data Availability Statement
The data presented in this study are available on request from the corresponding author. The data are not publicly available due to privacy restrictions.
Conflicts of Interest
The author declares no conflict of interest. The funders had no role in the design of the study; in the collection, analyses, or interpretation of data; in the writing of the manuscript, or in the decision to publish the results.
References
- Bogdanov, D.; Farfan, J.; Sadovskaia, K.; Aghahosseini, A.; Child, M.; Gulagi, A.; Oyewo, A.S.; Barbosa, L.D.S.N.S.; Breyer, C. Radical transformation pathway towards sustainable electricity via evolutionary steps. Nat. Commun. 2019, 10, 1077. [Google Scholar] [CrossRef] [Green Version]
- Lee, K.-S.; Bang, H.-J. A study on the prediction of lateral buckling load for wind turbine tower structures. Int. J. Precis. Eng. Manuf. 2012, 13, 1829–1836. [Google Scholar] [CrossRef]
- Helming, P.; von Freyberg, A.; Sorg, M.; Fischer, A. Wind Turbine Tower Deformation Measurement Using Terrestrial Laser Scanning on a 3.4 MW Wind Turbine. Energies 2021, 14, 3255. [Google Scholar] [CrossRef]
- Zrinjski, M.; Tupek, A.; Barković, Đ.; Polović, A. Industrial Masonry Chimney Geometry Analysis: A Total Station Based Evaluation of the Unmanned Aerial System Photogrammetry Approach. Sensors 2021, 21, 6265. [Google Scholar] [CrossRef]
- Ke, S.; Wang, H.; Ge, Y. Comparison of stationary and non-stationary wind-induced responses of a super-large cooling tower based on field measurements. Thin-Walled Struct. 2019, 137, 331–346. [Google Scholar] [CrossRef]
- Artese, S.; Nico, G. TLS and GB-RAR Measurements of Vibration Frequencies and Oscillation Amplitudes of Tall Structures: An Application to Wind Towers. Appl. Sci. 2020, 10, 2237. [Google Scholar] [CrossRef] [Green Version]
- Zou, Y.-F.; He, X.-H.; Jing, H.-Q.; Zhou, S.; Niu, H.-W.; Chen, Z.-Q. Characteristics of wind-induced displacement of super-large cooling tower based-on continuous medium model wind tunnel test. J. Wind Eng. Ind. Aerodyn. 2018, 180, 201–212. [Google Scholar] [CrossRef]
- Kaszowska, O.; Gruchlik, P.; Mika, W. Industrial chimney monitoring—Contemporary methods. E3S Web Conf. 2018, 36, 01005. [Google Scholar] [CrossRef]
- Diaconita, A.I.; Andrei, G.; Rusu, E. Estimation of the Tower Shape Effect on the Stress–Strain Behavior of Wind Turbines Operating under Offshore Boundary Conditions. Inventions 2022, 7, 11. [Google Scholar] [CrossRef]
- Ma, T.-T.; Zhao, L.; Chen, N.-Y.; Ge, Y.-J.; Zhang, D. Wind-induced dynamic performance of a super-large hyperbolic steel-truss cooling tower. Thin-Walled Struct. 2020, 157, 107061. [Google Scholar] [CrossRef]
- Głowacki, T.; Muszyński, Z. Analysis of cooling tower’s geometry by means of geodetic and thermovision method. IOP Conf. Ser. Mater. Sci. Eng. 2018, 365, 042075. [Google Scholar] [CrossRef]
- Ali, A.; De Risi, R.; Sextos, A. Finite element modeling optimization of wind turbine blades from an earthquake engineering perspective. Eng. Struct. 2020, 222, 111105. [Google Scholar] [CrossRef]
- Negm, H.M.; Maalawi, K. Structural design optimization of wind turbine towers. Comput. Struct. 2000, 74, 649–666. [Google Scholar] [CrossRef]
- Takizawa, K.; Tezduyar, T.E.; McIntyre, S.; Kostov, N.; Kolesar, R.; Habluetzel, C. Space–time VMS computation of wind-turbine rotor and tower aerodynamics. Comput. Mech. 2014, 53, 1–15. [Google Scholar] [CrossRef]
- de Lana, J.A.; Júnior, P.A.A.M.; Magalhães, C.A.; Magalhães, A.L.M.A.; Junior, A.C.D.A.; Ribeiro, M.S.D.B. Behavior study of prestressed concrete wind-turbine tower in circular cross-section. Eng. Struct. 2020, 227, 111403. [Google Scholar] [CrossRef]
- Pieraccini, M.; Parrini, F.; Fratini, M.; Atzeni, C.; Spinelli, P. In-service testing of wind turbine towers using a microwave sensor. Renew. Energy 2008, 33, 13–21. [Google Scholar] [CrossRef]
- Wan, B.; Hu, B.; Lv, Q. Research on the Damage Experiment Model Design and Metal Magnetic Memory Testing of Wind Turbine Tower in Service. In Proceedings of the 2020 IEEE 4th Conference on Energy Internet and Energy System Integration (EI2), Wuhan, China, 30 October–1 November 2020; pp. 1879–1884. [Google Scholar] [CrossRef]
- Wymore, M.L.; Van Dam, J.E.; Ceylan, H.; Qiao, D. A survey of health monitoring systems for wind turbines. Renew. Sustain. Energy Rev. 2015, 52, 976–990. [Google Scholar] [CrossRef]
- Wang, Y.; Dai, K.; Xu, Y.; Zhu, W.; Lu, W.; Shi, Y.; Mei, Z.; Xue, S.; Faulkner, K. Field Testing of Wind Turbine Towers with Contact and Noncontact Vibration Measurement Methods. J. Perform. Constr. Facil. 2020, 34, 04019094. [Google Scholar] [CrossRef]
- Gikas, V. Ambient vibration monitoring of slender structures by microwave interferometer remote sensing. J. Appl. Geod. 2012, 6, 167–176. [Google Scholar] [CrossRef]
- Moschas, F.; Stiros, S. High accuracy measurement of deflections of an electricity transmission line tower. Eng. Struct. 2014, 80, 418–425. [Google Scholar] [CrossRef]
- Momomura, Y.; Marukawa, H.; Okamura, T.; Hongo, E.; Ohkuma, T. Full-scale measurements of wind-induced vibration of a transmission line system in a mountainous area. J. Wind. Eng. Ind. Aerodyn. 1997, 72, 241–252. [Google Scholar] [CrossRef]
- Vezočnik, R.; Ambrožič, T.; Sterle, O.; Bilban, G.; Pfeifer, N.; Stopar, B. Use of Terrestrial Laser Scanning Technology for Long Term High Precision Deformation Monitoring. Sensors 2009, 9, 9873–9895. [Google Scholar] [CrossRef]
- Harshit; Jain, K.; Mishra, V. Analysis of Survey Approach Using UAV Images and Lidar for a Chimney Study. J. Indian Soc. Remote Sens. 2021, 49, 613–618. [Google Scholar] [CrossRef]
- Baqersad, J.; Poozesh, P.; Niezrecki, C.; Avitabile, P. Photogrammetry and optical methods in structural dynamics—A review. Mech. Syst. Signal Process. 2017, 86, 17–34. [Google Scholar] [CrossRef]
- Xu, N.; Huang, D.; Song, S.; Ling, X.; Strasbaugh, C.; Yilmaz, A.; Sezen, H.; Qin, R. A volumetric change detection framework using UAV oblique photogrammetry—A case study of ultra-high-resolution monitoring of progressive building collapse. Int. J. Digit. Earth 2021, 14, 1705–1720. [Google Scholar] [CrossRef]
- Wujanz, D. Terrestrial Laser Scanning for Geodetic Deformation Monitoring; Technische Universitaet: Berlin, Germany, 2016. [Google Scholar] [CrossRef]
- Schill, F.; Eichhorn, A. (Eds.) Investigations of Low- and High-Frequency Movements of Wind Power Plants Using a Profile Laser Scanner, 3rd ed.; Joint International Symposium on Deformation Monitoring (JISDM): Vienna, Austria, 2016; Volume 30. [Google Scholar]
- Mitka, B.; Klapa, P.; Gniadek, J. Use of Terrestrial Laser Scanning for Measurements of Wind Power Stations. Geomat. Environ. Eng. 2019, 13, 39. [Google Scholar] [CrossRef]
- Muszynski, Z.; Milczarek, W. Application of Terrestrial Laser Scanning to Study the Geometry of Slender Objects. IOP Conf. Ser. Earth Environ. Sci. 2017, 95, 42069. [Google Scholar] [CrossRef] [Green Version]
- Kocierz, R.; Rębisz, M.; Ortyl, Ł. Measurement point density and measurement methods in determining the geometric imperfections of shell surfaces. Rep. Geod. Geoinform. 2018, 105. [Google Scholar] [CrossRef] [Green Version]
- ISO Standard No. 8322-6:1991; Building Construction—Measuring Instruments—Procedures for Determining Accuracy in Use—Part 6. International Organization for Standardization: Geneva, Switzerland, 1991. Available online: https://www.iso.org/standard/15452.html (accessed on 15 March 2022).
- ISO Standard No. 4463-2:1995; Measurement Methods for Building—Setting-Out and Measurement—Part 2. International Organization for Standardization: Geneva, Switzerland, 1995. Available online: https://www.iso.org/standard/10357.html (accessed on 15 March 2022).
- Chernov, N.; Lesort, C. Least Squares Fitting of Circles. J. Math. Imaging Vis. 2005, 23, 239–252. [Google Scholar] [CrossRef]
- Kasa, I. A circle fitting procedure and its error analysis. IEEE Trans. Instrum. Meas. 1976, IM-25, 8–14. [Google Scholar] [CrossRef]
- EN 1993-3-2; Eurocode 3: Design of Steel Structures—Part 3-2: Towers, Masts and Chimneys—Chimneys. Authority: The European Union Per Regulation 305/2011, Directive 98/34/EC, Directive 2004/18/EC. European Union: Brussels, Belgium, 2006.
- EN 1996-1-1; Eurocode 6: Design of Masonry Structures—Part 1-1: General Rules for Reinforced and Unreinforced Masonry Structures. Authority: The European Union Per Regulation 305/2011, Directive 98/34/EC, Directive 2004/18/EC. European Union: Brussels, Belgium, 2005.
- EN 1992-1-1; Eurocode 2: Design of Concrete Structures—Part 1-1: General Rules and Rules for Buildings. Authority: The European Union Per Regulation 305/2011, Directive 98/34/EC, Directive 2004/18/EC. European Union: Brussels, Belgium, 2004.


Publisher’s Note: MDPI stays neutral with regard to jurisdictional claims in published maps and institutional affiliations. |
© 2022 by the author. Licensee MDPI, Basel, Switzerland. This article is an open access article distributed under the terms and conditions of the Creative Commons Attribution (CC BY) license (https://creativecommons.org/licenses/by/4.0/).