Article

Analysis of Control Strategies Based on Virtual Inertia for the Improvement of Frequency Stability in an Islanded Grid with Wind Generators and Battery Energy Storage Systems

1
Faculty of Engineering, Electrical Engineering, Universidad Laica Eloy Alfaro de Manabí, Manta 130214, Ecuador
2
Area of Electrical Engineering, ETSI Industriales, Universidad Politecnica de Madrid, 28006 Madrid, Spain
3
Department of Electrical, Electronic and Telecommunication, Universidad de Cuenca, Cuenca 010203, Ecuador
*
Author to whom correspondence should be addressed.
Energies 2021, 14(3), 698; https://doi.org/10.3390/en14030698
Submission received: 6 January 2021 / Revised: 24 January 2021 / Accepted: 26 January 2021 / Published: 29 January 2021
(This article belongs to the Special Issue Wind Generation in Low Inertia Power Systems)

Abstract

:
Rising levels of non-synchronous generation in power systems are leading to increasing difficulties in primary frequency control. In response, there has been much research effort aimed at providing individual electronic interfaced generators with different frequency response capabilities. There is now a growing research interest in analyzing the interactions among different power system elements that include these features. This paper explores how the implementation of control strategies based on the concept of virtual inertia can help to improve frequency stability. More specifically, the work is focused on islanded systems with high share of wind generation interacting with battery energy storage systems. The paper presents a methodology for modeling a power system with virtual primary frequency control, as an aid to power system planning and operation. The methodology and its implementation are illustrated with a real case study.

1. Introduction

In the last two decades, electric power systems have experienced very significant changes in their operational requirements, mainly due to a growing share of non-conventional renewable energy in the electricity generation mix, along with the operation of grids with a higher degree of complexity [1,2,3]. From the beginning of the massive electrical generation industry at the beginning of the 20th century, conventional synchronous generators have been responsible for guaranteeing frequency stability [4], among other tasks within the operation of a power system. However, mainly in weak or islanded networks, synchronous machines do not always have the capacity to respond fast enough to keep the system stable in the face of power disturbances caused by imbalances between generated and demanded power [5,6,7].
If an increasing share of electricity generation based on non-conventional renewable energy resources is added to this type of power systems, one of the consequences is a significant reduction of the equivalent inertia of the system [8]. This is due to the fact that such renewable generators have an interface for connection to the grid based on the use of electronic power converters, in which a frequency variation in the grid side does not entail a modification of the active power supplied, as the latter keeps a value close to the reference set by its corresponding control system. From the point of view of the power system, this is seen as a lack of inertial response. To address this issue, previous works have outlined the design and implementation of additional control schemes that provide certain complementary regulation capabilities to certain renewable generators (e.g., photovoltaic [9,10], wind [11,12], hybrid of both [3,13]) and battery energy storage systems [14,15], with the aim of modifying the active power injected into the network in response to variations in frequency, similar to how conventional synchronous generators do; hence, the use of the term “virtual inertia”. Further, very interesting review papers addressing inertia and frequency control strategies can be found in [8,16,17].
One of the most used resources to improve frequency stability in island-type microgrids is a battery energy storage system (BESS), with an increasing degree of utilization in electrical systems worldwide, for example, in South Australia or China, with 100 MW/129 MWh and 200 MW/800 MWh, respectively [18]. However, despite the effectivity of BESS in technical terms, it is not possible to ignore its significant economic cost [19,20]. This has motivated the exploration of less cost-intensive alternatives or complementary technologies.
In this sense, scientific contributions presented in [21,22] propose the use of additional control schemes in variable speed wind turbines that make use of the inertial resources existing in their rotating masses, giving support to the frequency recovery of the system in the event of power disturbances. This ancillary service is also provided by wind turbines by controlling the pitch angle of their blades to limit the incoming wind power and to contribute to the power balance of the grid [23,24]. The application of these solutions allows a grid-friendly integration of wind turbines in terms of the frequency recovery capability of the whole system. In these works, detailed models are employed to accurately represent the time-domain behavior of the power system elements in a simulation environment. However, their application in multi-machine systems may be impractical due to the huge computational effort required. In inertial response and frequency control studies, the dynamics of different agents of the system can be represented by a load frequency control scheme [10,25] which allows to achieve a noticeable modeling simplification without penalizing the accuracy of numerical results. This paper proposes a methodological guide for modeling the elements of a wind-diesel-energy storage islanded grid, based on the load frequency control scheme along with its implementation in a computational environment. The resulting model can be used to represent other power systems with similar characteristics, and it facilitates the integration of additional energy agents: generation, storage, and consumption.
This work presents a comparative study of the potential benefits obtained by the implementation of two control strategies designed to improve the frequency control actions of the system: one, based on the use of BESS, and the other, on the use of the inertial resources existing in a variable speed wind turbine. The hypothesis of this research is that the combined action of these two solutions will lead to more effective results in the mitigation of frequency fluctuations and the reduction of the frequency nadir, compared to applying such strategies separately.
It is intended that, with the results of this study, the operators of weak and isolated power systems with a significant penetration of wind generation can have an analysis tool that allows them to define new operating procedures and expansion plans of the system in order to improve the quality of the frequency response to disturbances caused by power imbalances.
This paper is organized as follows: Section 2 details the methodology used to carry out the analysis of the grid frequency control, describes the electrical system considered as a case study, and presents the computer simulation modeling of the system under study; Section 3 shows the results obtained when analyzing the behavior of the system in four operating scenarios along with a critical discussion; and Section 4 draws the main conclusions of the study.

2. Methodology

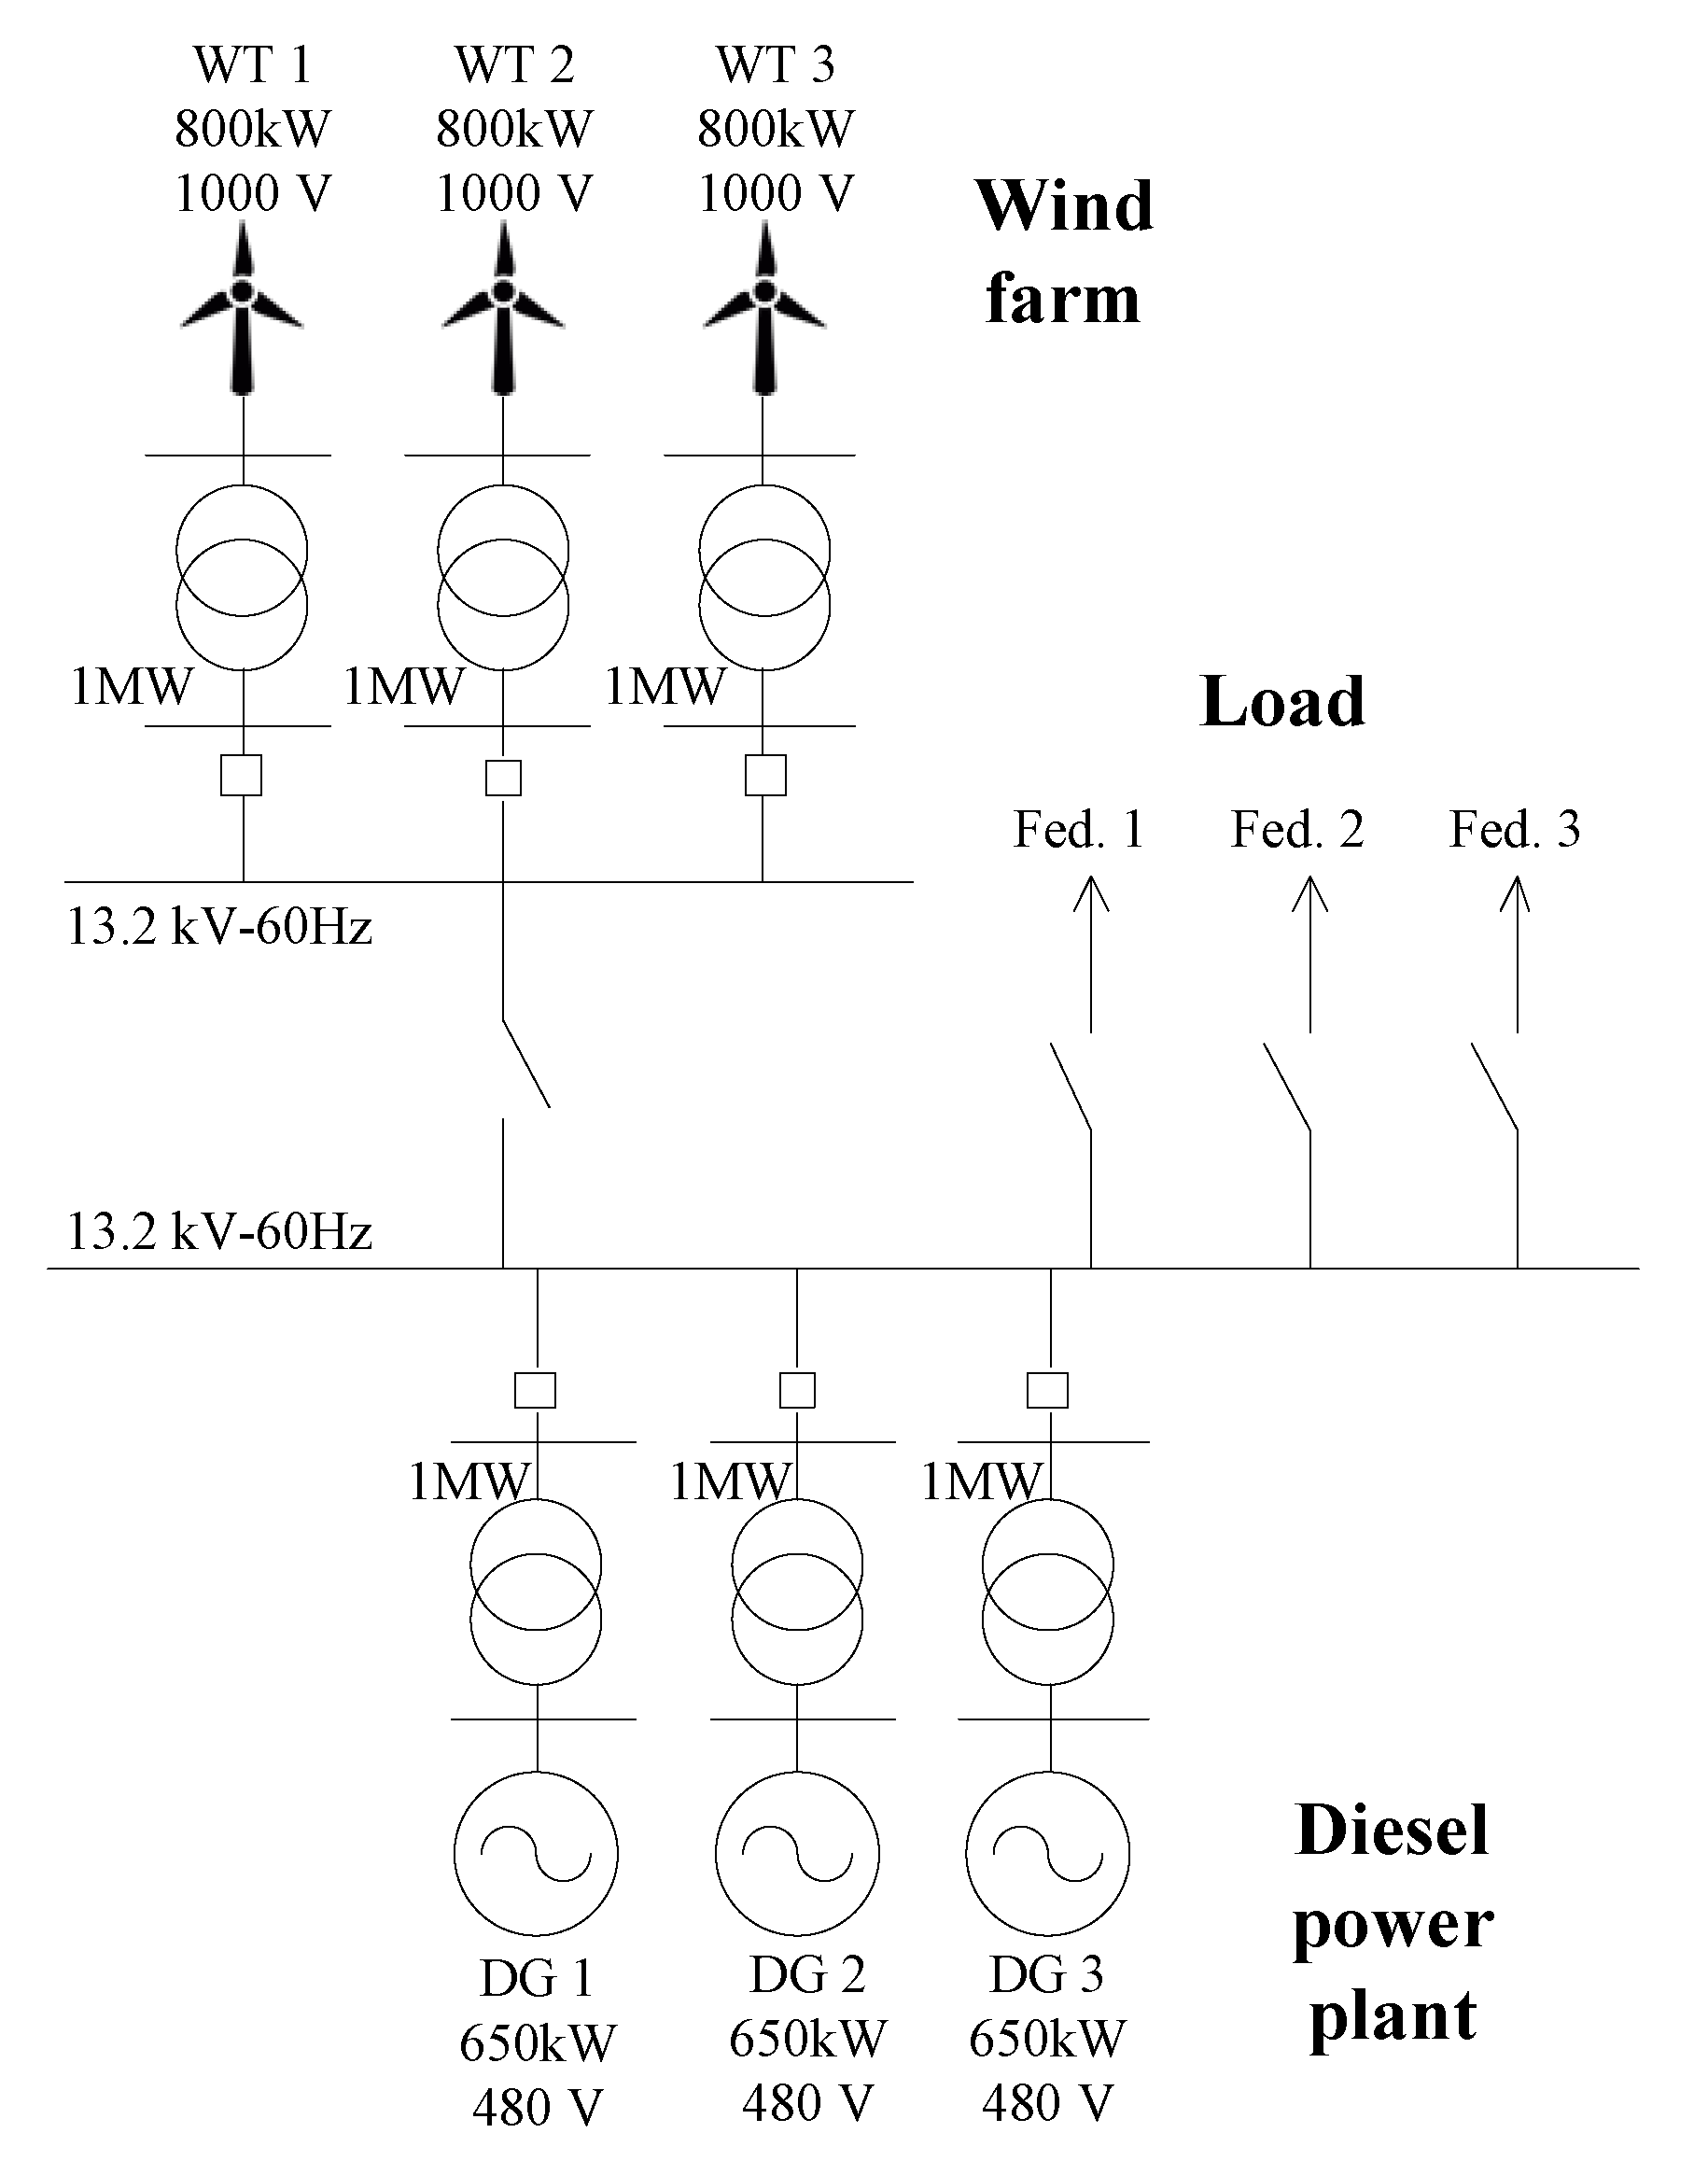
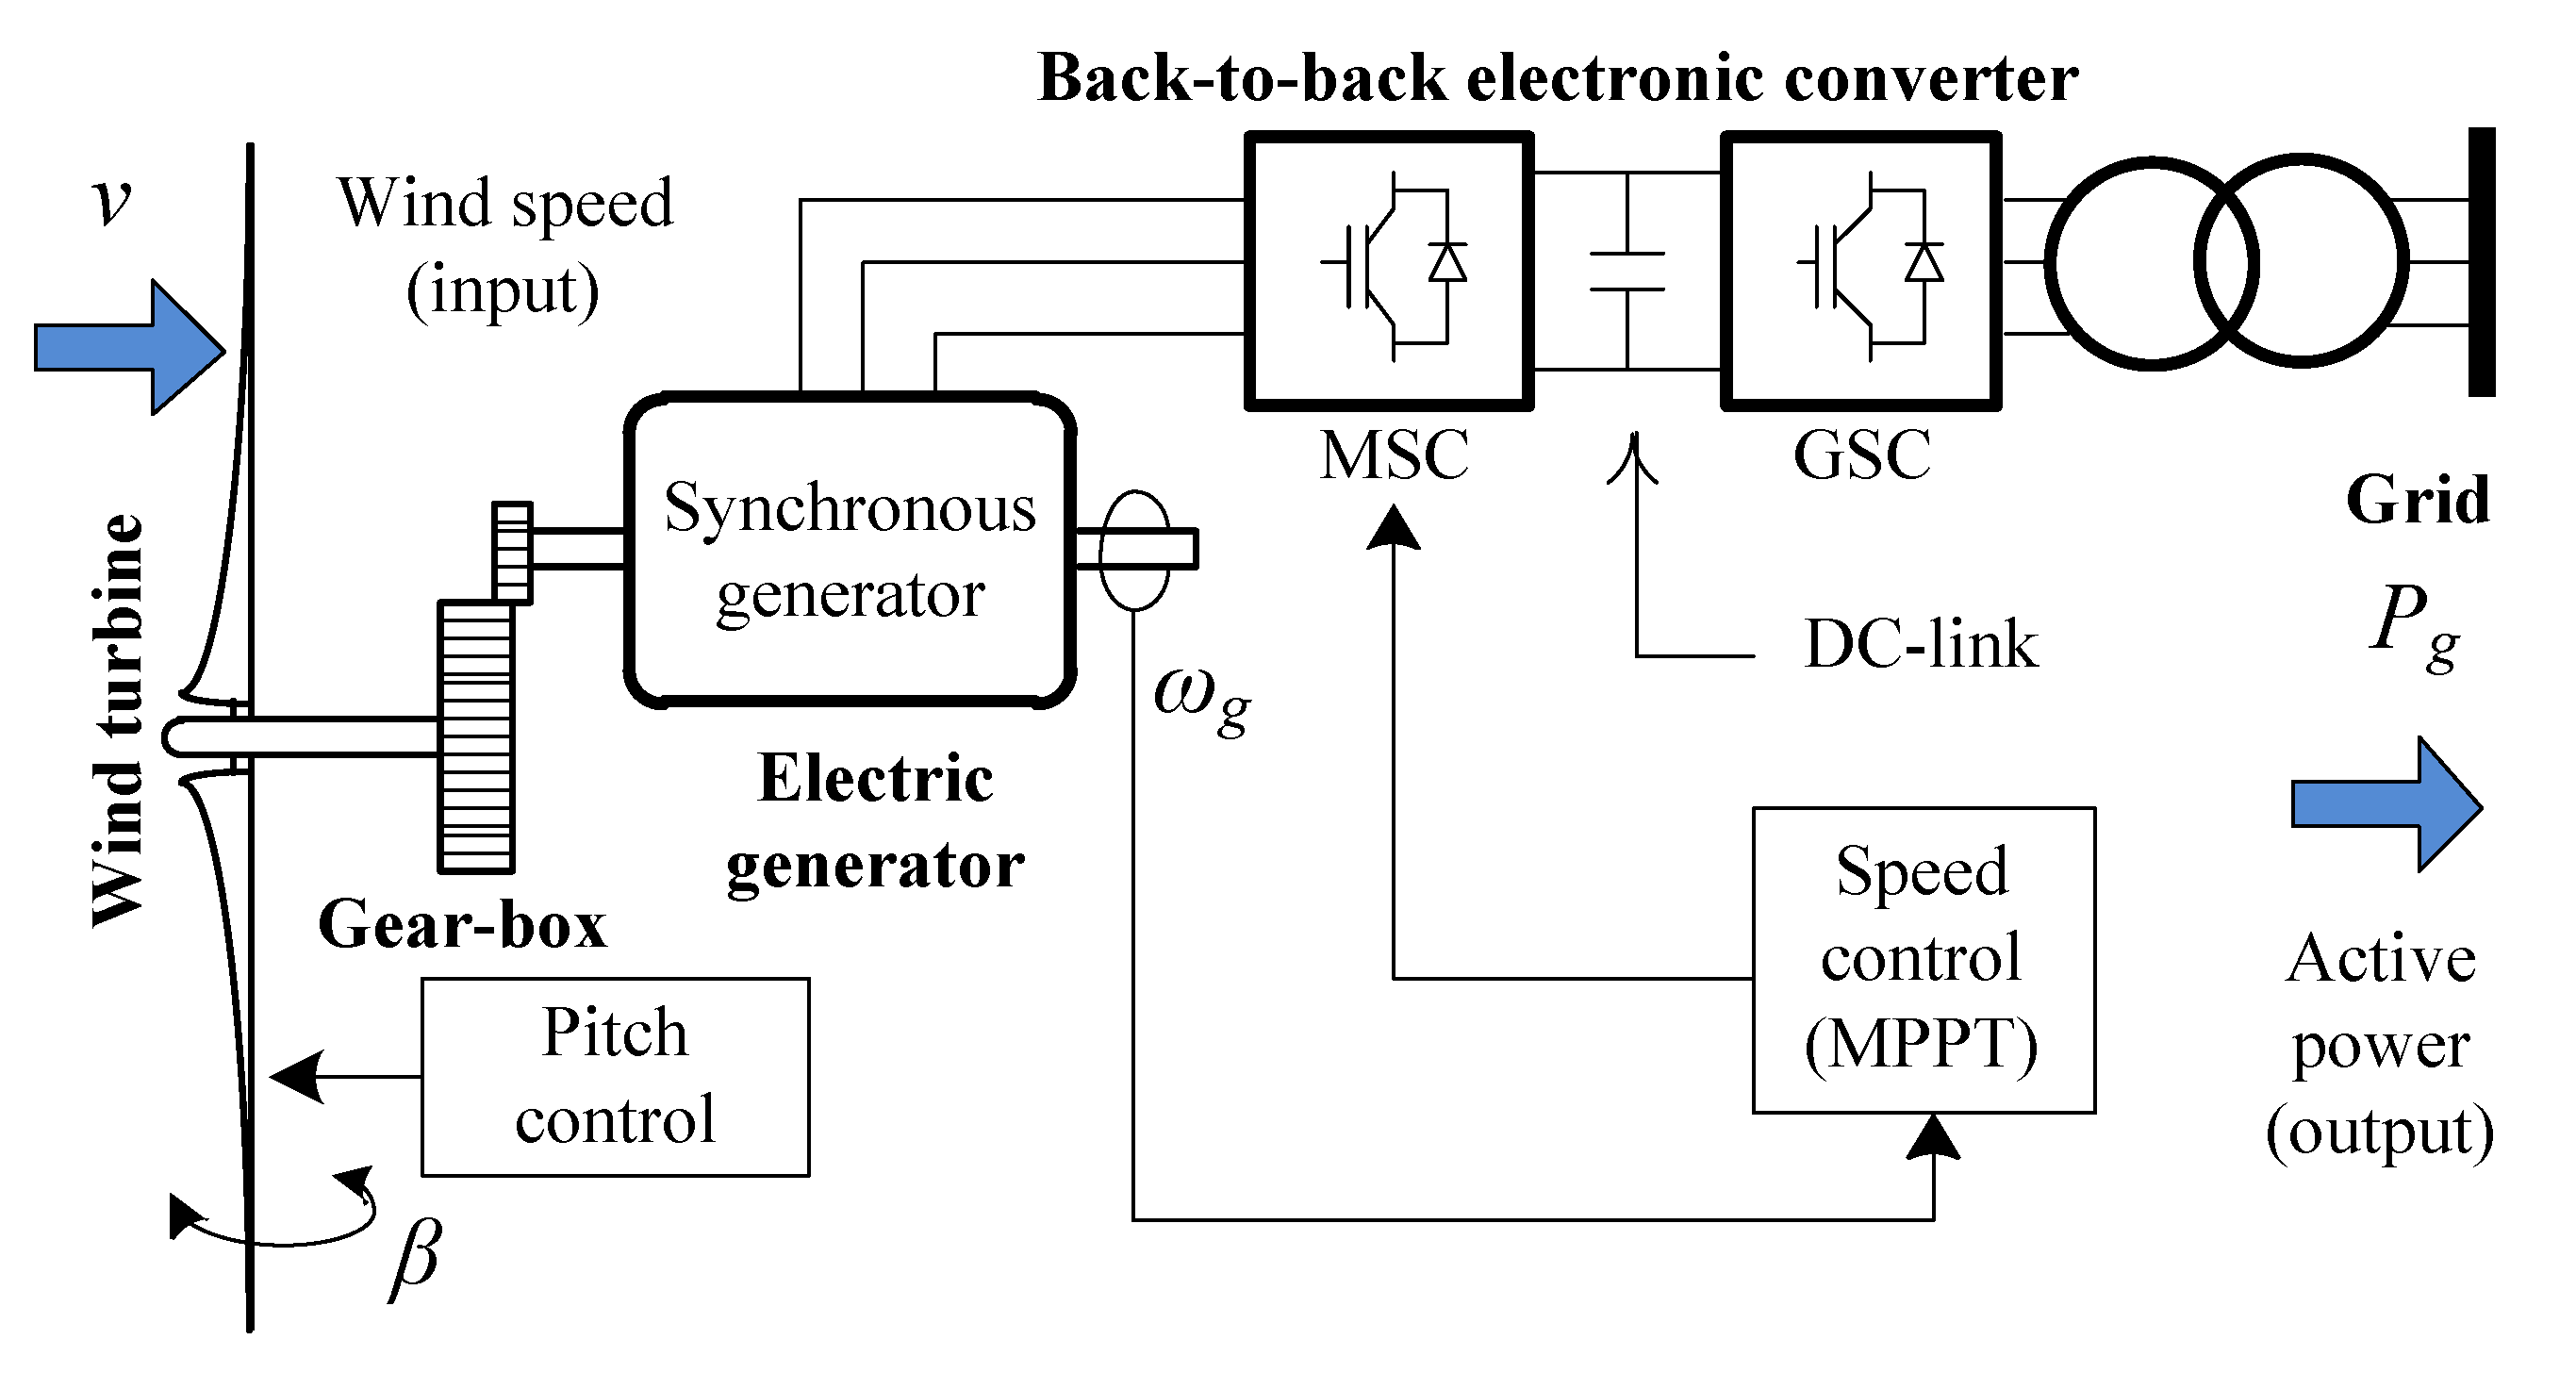
2.1. System Description

As a case study, the electrical system of San Cristobal Island (Galapagos, Ecuador) has been considered, whose electricity demand is supplied by a hybrid wind-diesel generation system [26]. Given its geographical conditions, an interconnection with a continental power system is technically and economically unfeasible, so this constitutes a typical case of a microgrid operating in island mode, with diesel generation plants and high penetration of wind generation. The simplified single-line diagram of this system is illustrated in Figure 1.
Regarding the operating conditions of the case study, historical records of operation and dispatch of the real system have been analyzed to select a particularly problematic case in terms of frequency control, with a wind penetration of 66% in a peak demand situation (2424 kW) [26]. Under these high wind conditions, the system tends to undergo pronounced frequency fluctuations, given the inability of the existing thermal generation to fully absorb the fluctuations of injected wind power.
This operating situation constitutes a latent risk for the continuity of the power supply, since such frequency excursions could lead to the tripping of certain over/under-frequency protection relays installed in different pieces of equipment of the system, a situation that has actually occurred on occasions in the system under study. An immediate solution to this problem would be to increase the number of diesel units in the microgrid, in order to strengthen the equivalent inertial response of the system. However, this measure is difficult to apply given the island’s enormous ecological interest [27,28].
The analysis of this system has been carried out with the Matlab/Simulink® (MathWorks, Natick, MA, USA) computer simulation tool, in which the elements of interest have been modeled and parameterized taking as a reference the work presented in [26].
An imbalance between generated and demanded power of ±0.1 p.u. has been considered as a disturbing event to quantitatively evaluate the impact of incorporating each of the proposed strategies on frequency stability in the system under study.
In addition, four operational scenarios have been analyzed: in the first one, the grid frequency control tasks are performed only by diesel generators; in the second scenario, a virtual inertia algorithm is incorporated in the variable speed wind turbines to contribute to the frequency support of the system together with the operational synchronous generation; in the third one, the corrective action provided by a battery storage system is evaluated by implementing an emulated inertial response in the power controller of its electronic converter; and, in the fourth scenario, the impact of both improvement strategies acting simultaneously, and in interaction with conventional thermal generation, is analyzed.
For assessing the magnitude of frequency deviations experienced by the system in the different scenarios, an actual national grid code is taken as a reference framework. In this sense, the Ecuadorian Electricity Regulation and Control Agency establishes, in Dispatch and Operation Procedure V2, Chapter 5.3 [29], that the target frequency of the National Interconnected System is 60.00 Hz, with a range of variation in normal operation conditions between 59.85 and 60.15 Hz, except for emergency states, faults, and restoration periods.
It is worth noting that, in the case of island systems, grid codes tend to be more permissive in their minimum and maximum limits in respect to what is established for continental systems, given their constructive and operational characteristics. Table 1 summarizes the frequency ranges within which the calibration of the frequency relays protecting the Ecuadorian power system generators is recommended.

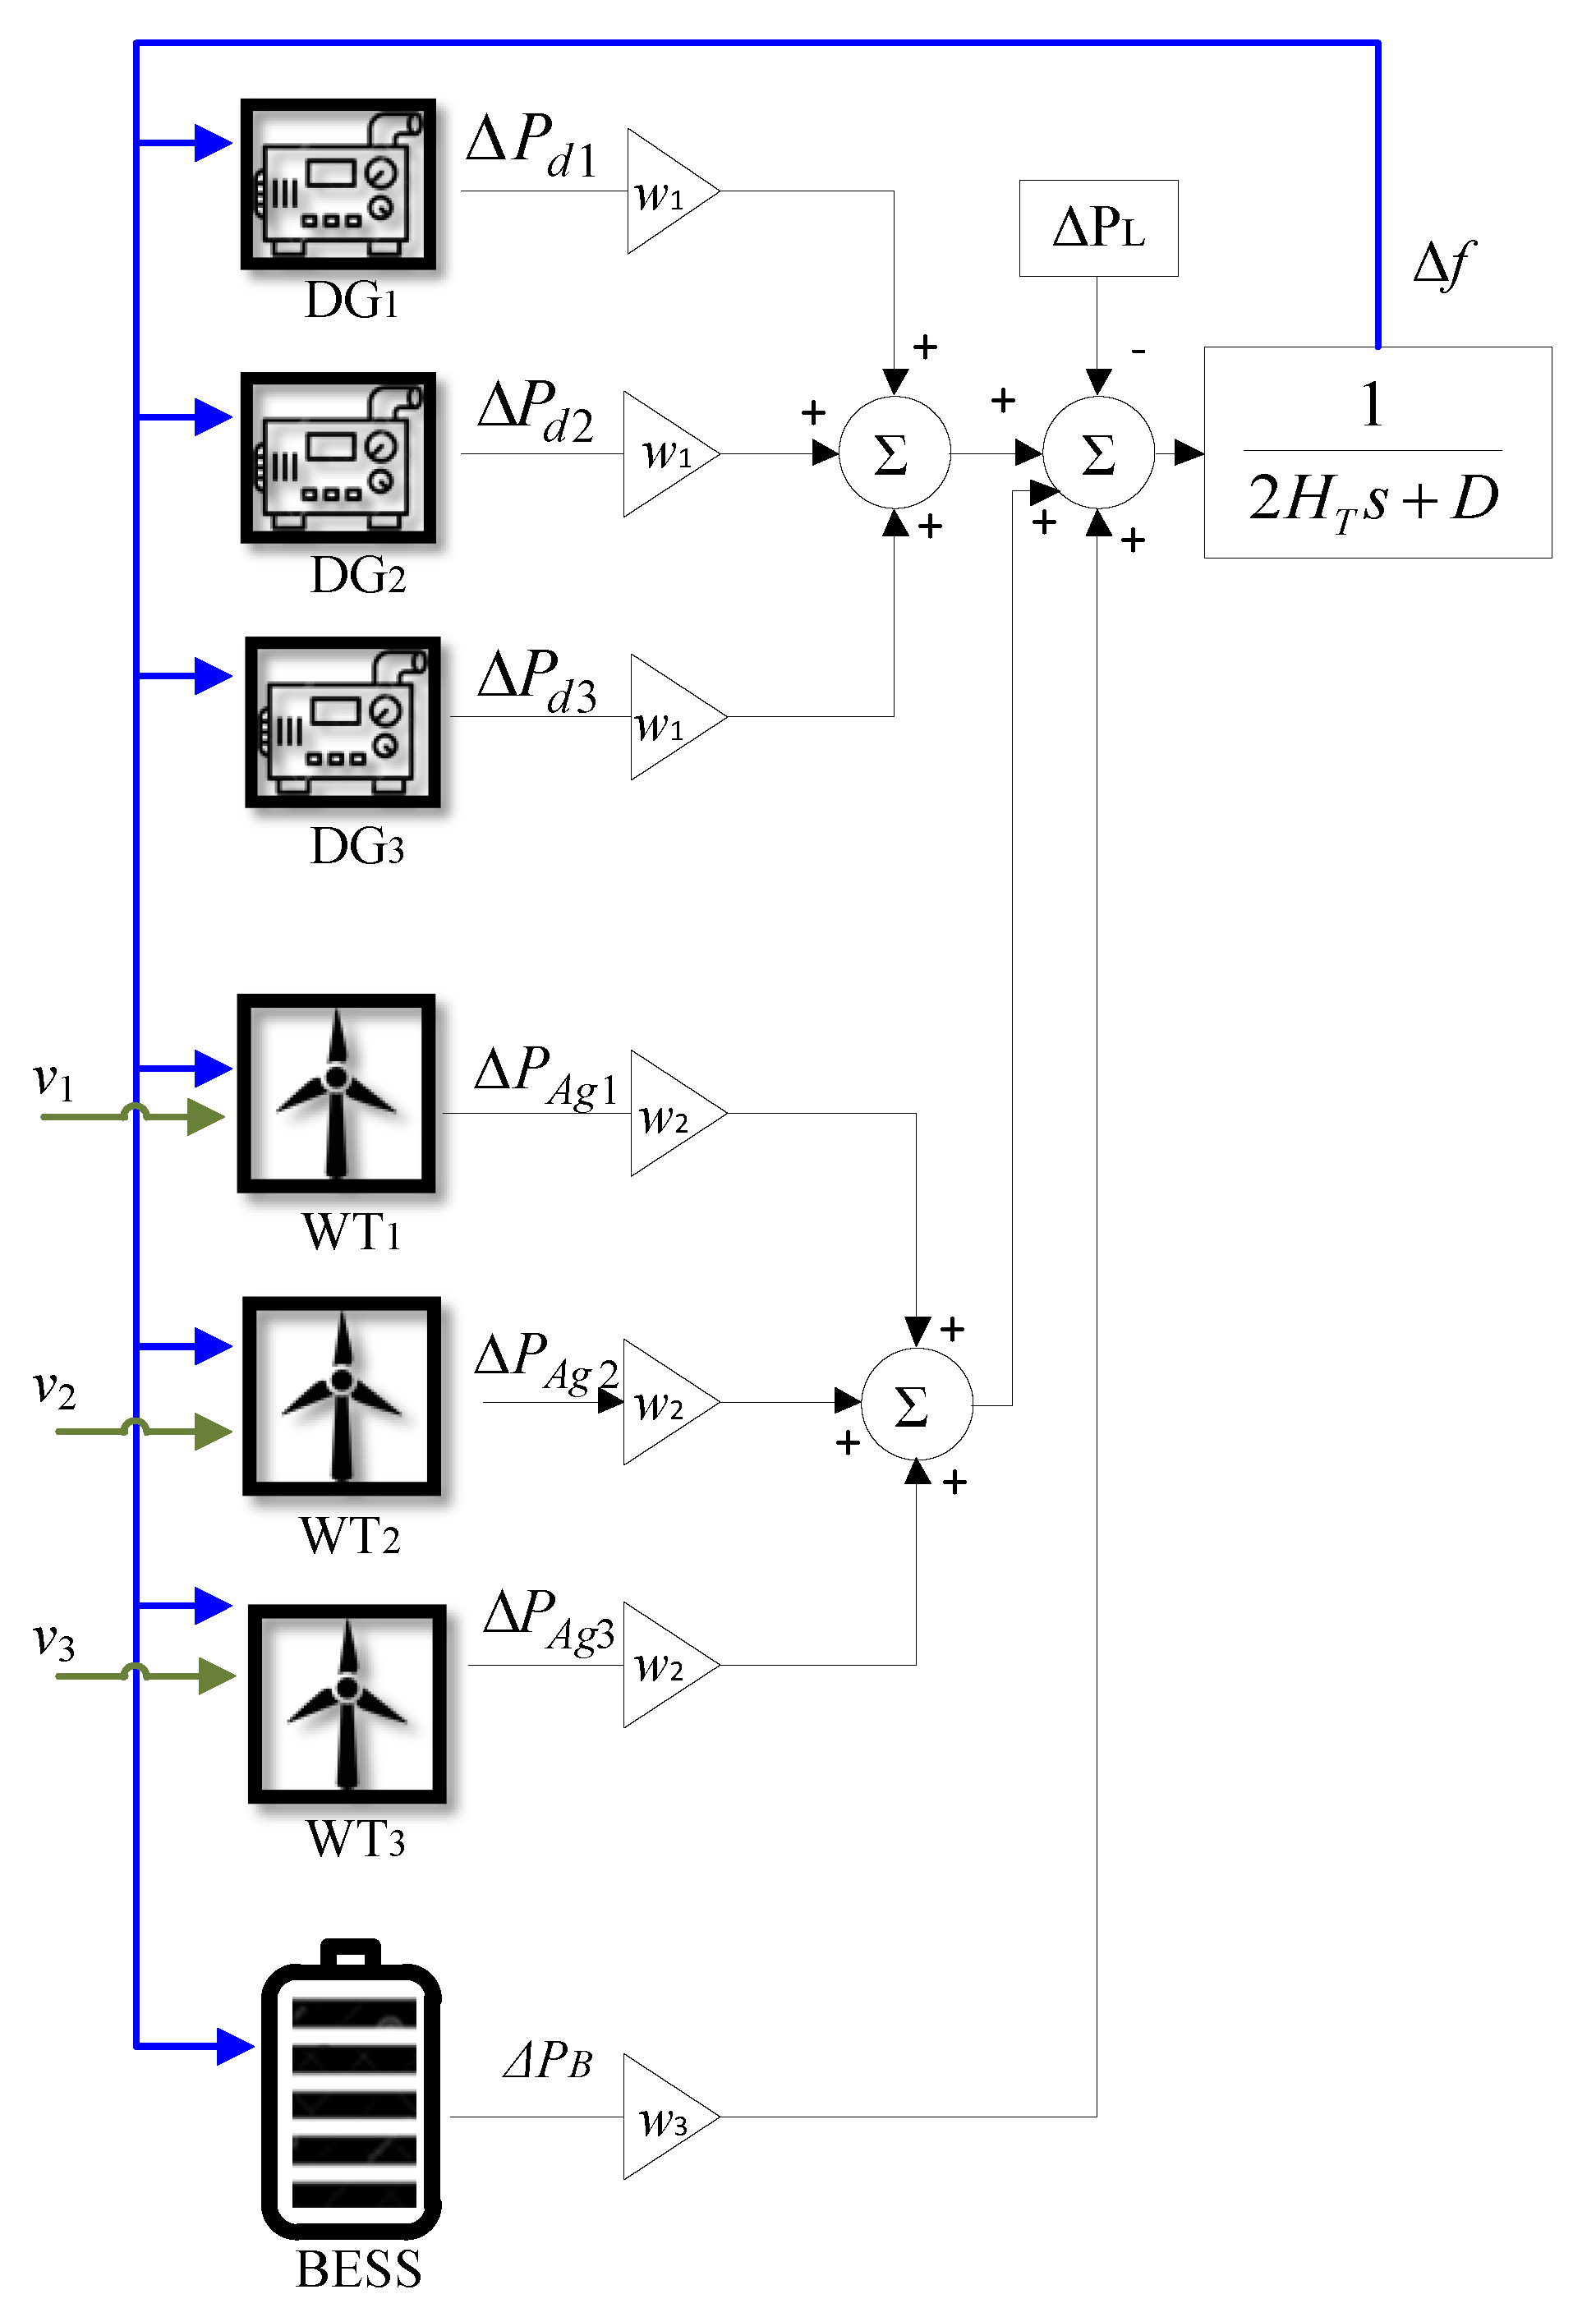
2.2. System Modeling

In traditional electrical systems, the inertial power response is directly associated with the kinetic energy stored in rotating machines. In a synchronous machine, this energy can be expressed as [4]
E kinetic = 0 . 5 J [ kg · m 2 ] ω 2 [ rad / s ]
where J is the moment of inertia of the turbine-generator set and ω is the angular speed of the rotor of the machine. On the other hand, the rotor speed variation depends on the balance between electrical and mechanical torque, as follows:
T m T e = P m ω P e ω = J d ω d t
where Tm and Te represent the electrical and mechanical torque and Pm and Pe are the mechanical and electrical power, respectively.
The rate of change of frequency (RoCoF) can be expressed as:
d ω d t = ω ( P m P e ) 2 H · S
where H is the inertia constant of the set, defined by the relationship between the kinetic energy stored in the rotating masses and the nominal power of the machine S:
H = E kinetic S
Since the frequency stability of the system will be evaluated, it is convenient to introduce the simplified models of each one of the generating units in the representation given by the oscillation equation. As a function of incremental magnitudes, in values per unit, according to [4,30], this equation is:
2 H T d   Δ ω [ p u ] d t + D Δ ω [ p u ] = Δ P m [ p u ] Δ P e [ p u ] ,
where HT is the equivalent inertia constant of the system and D is the coefficient of variation of demand with frequency.
From the previous equation, it is possible to obtain the model of the system as shown schematically in Figure 2 [4,30], where:
  • ΔPL is the deviation in the value of the load that the system experiences in per unit. It will be negative if the charge decreases and positive when the opposite happens.
  • ΔPdn represents the power compensation contribution generated by each diesel generator to contribute to the recovery of the system frequency.
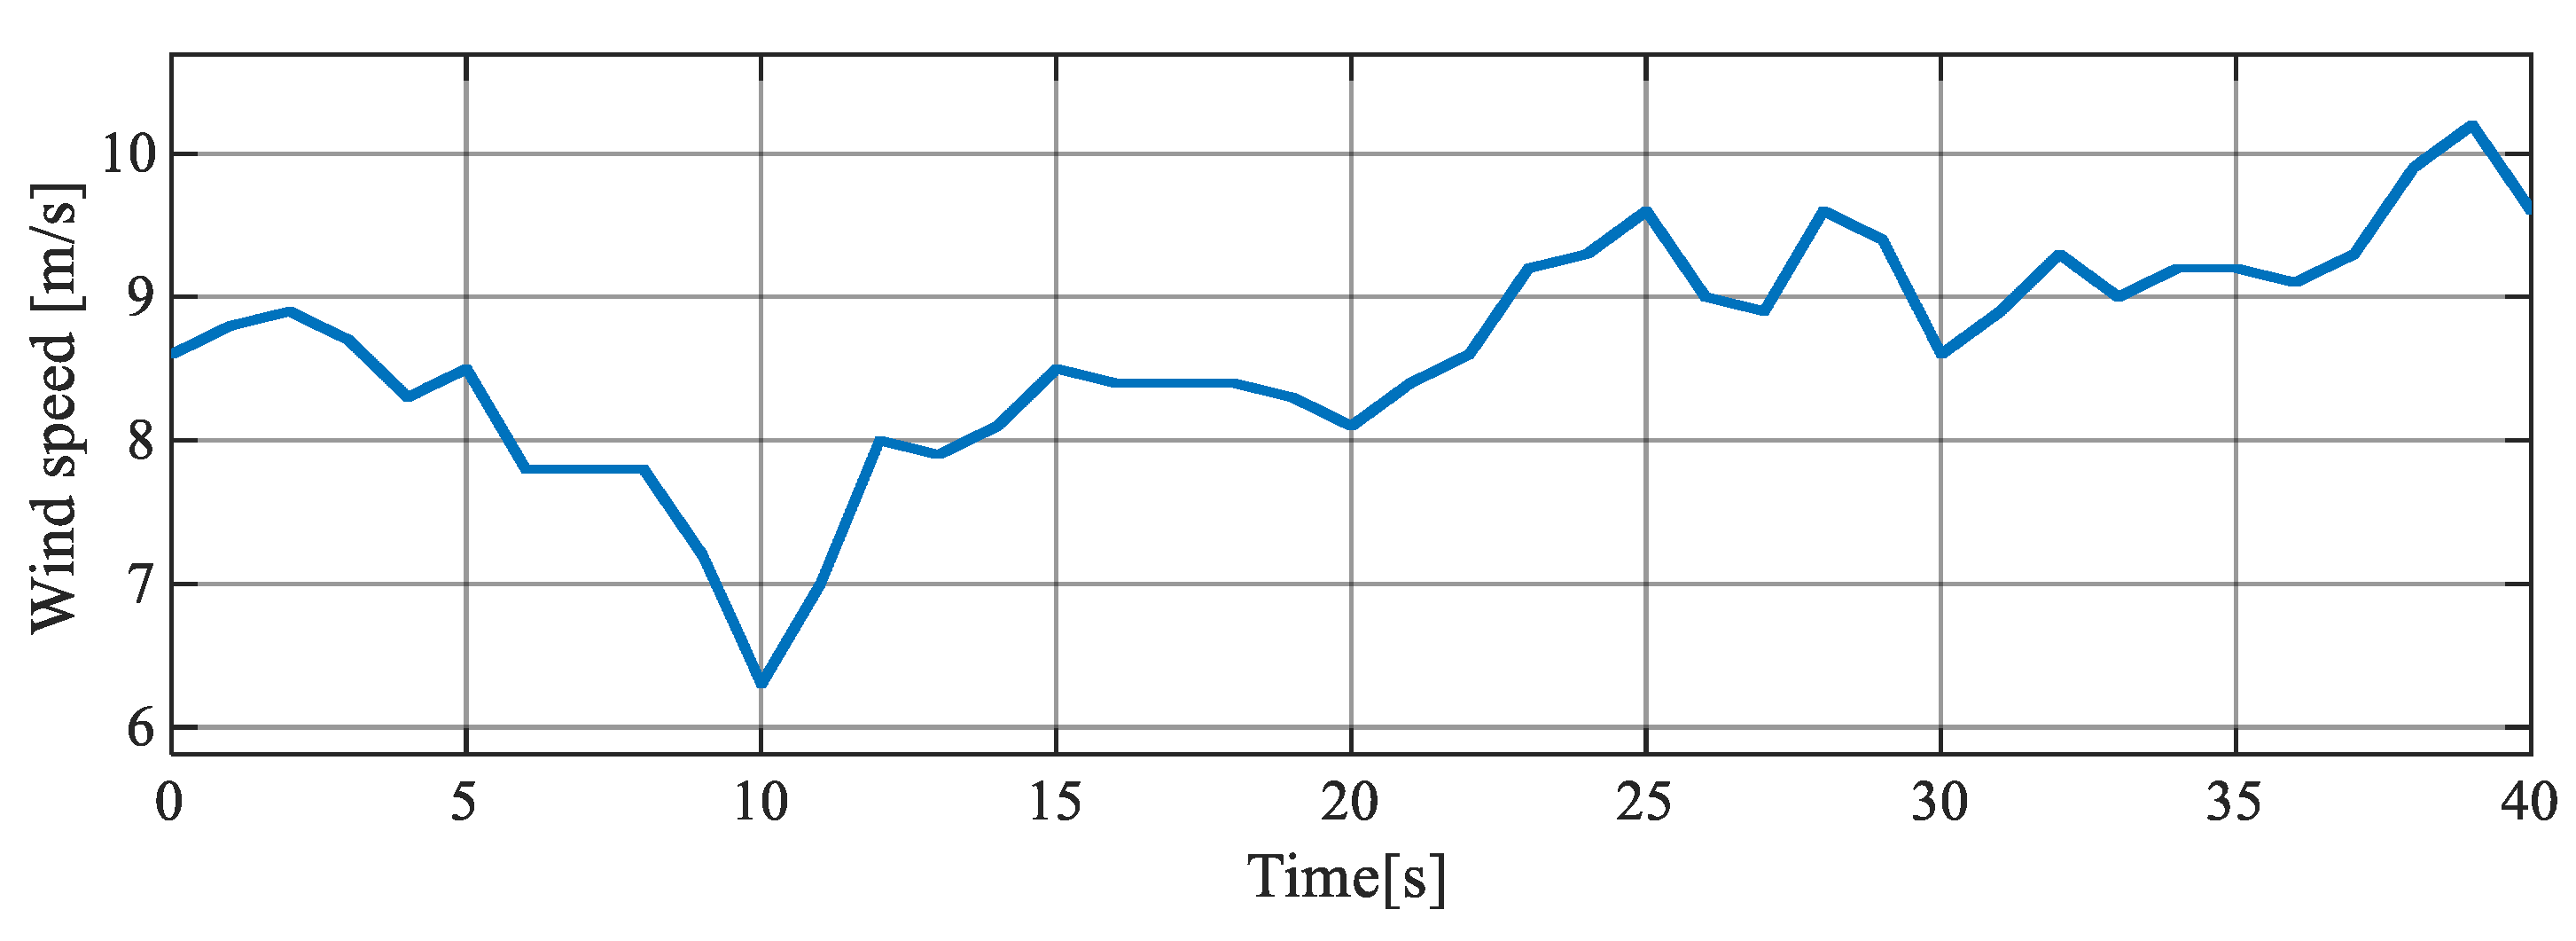
  • vn represents the incident wind speed at each wind turbine.
  • wi is the participation factor of each generation unit, both in the frequency support of the system and in the coverage of demand. In per unit values, this factor is defined as the relationship between the installed capacity of each generation unit and the base power considered for the analysis. For example, in this study the installed power of diesel power plants has been taken (Sbase = 3 × 0.813 MVA = 2.439 MVA), with which the participation factors are: w1 = 0.813/2.439 = 1/3 [pu], w2 = 0.8/2.439 = 0.328 [pu].
The modeling of the diesel and wind generation units is described below, as a summary of what is described in greater detail in [26], as well as the energy storage unit.

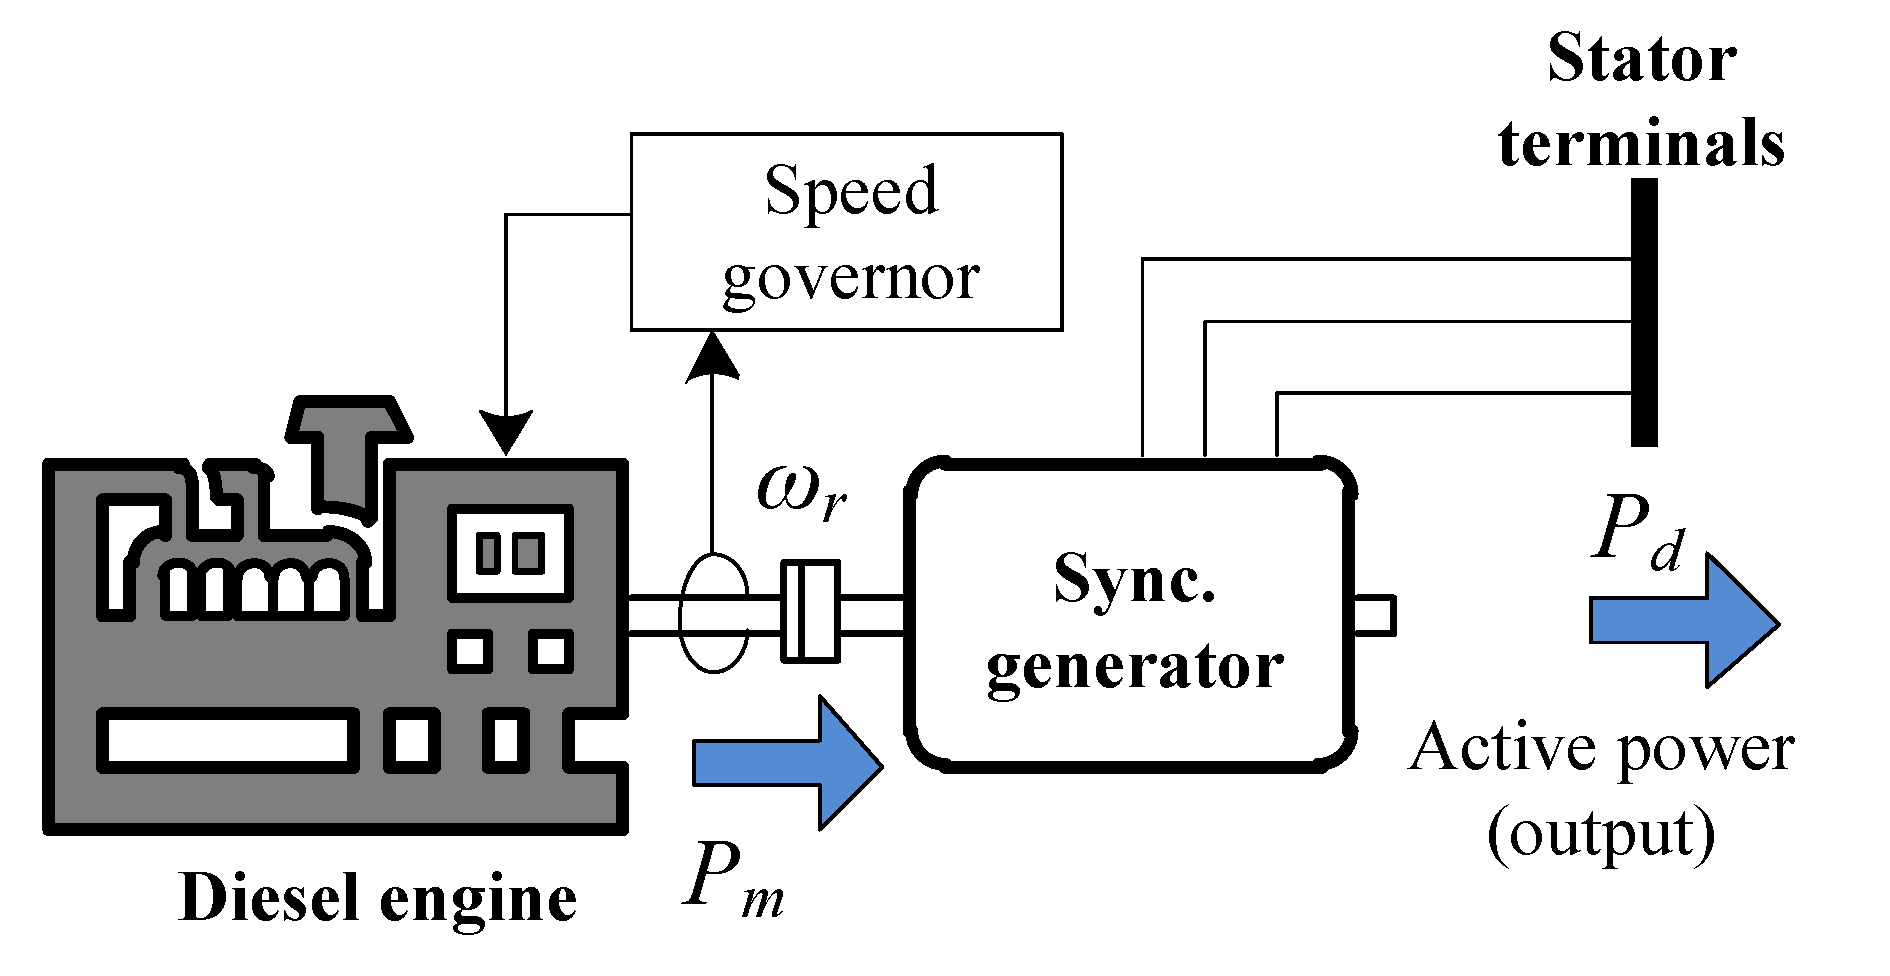
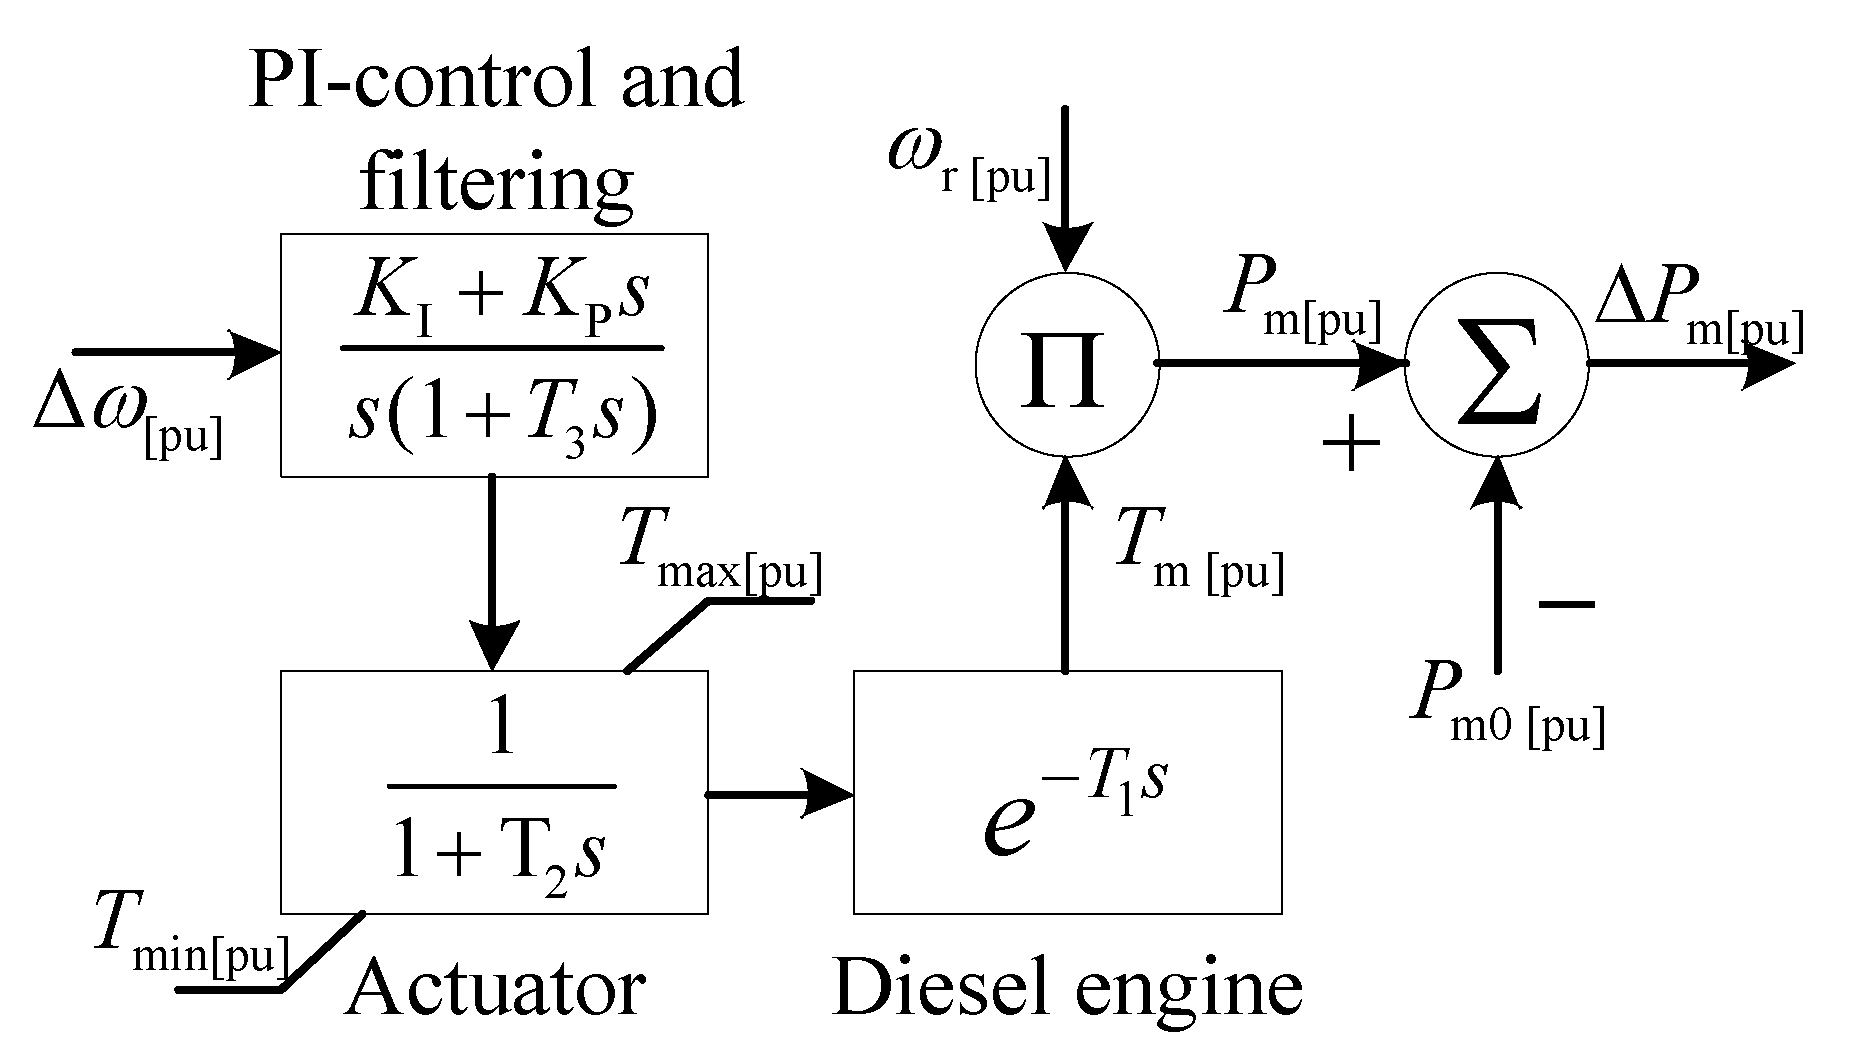
2.2.1. Diesel Power Plant

The thermal power plant of the system under study is made up of 3 units, each of which has a synchronous generator with salient poles and an exciter with rotating diodes. Its general configuration is schematically represented in Figure 3 [26] and its main characteristics are listed in Appendix A.
As a diesel engine model, the one proposed by [31], particularized for this case study, has been used. Figure 4 shows the schematic representation of the proposed model and the values assigned to its different parameters are indicated in Appendix B, where
  • ωr is the angular velocity of the generator.
  • Tmax and Tmin are the mechanical torque limits, Tm, that are input to the actuator.
  • ΔPm represents the deviation of the mechanical power compared to a pre-established initial value, Pm0.
It is important to note that the physical processes involved in the control actions are represented by first-order systems with time constants T2 and T3 and by a delay function of value T1. Additionally, KP and KI are the PI controller gains.

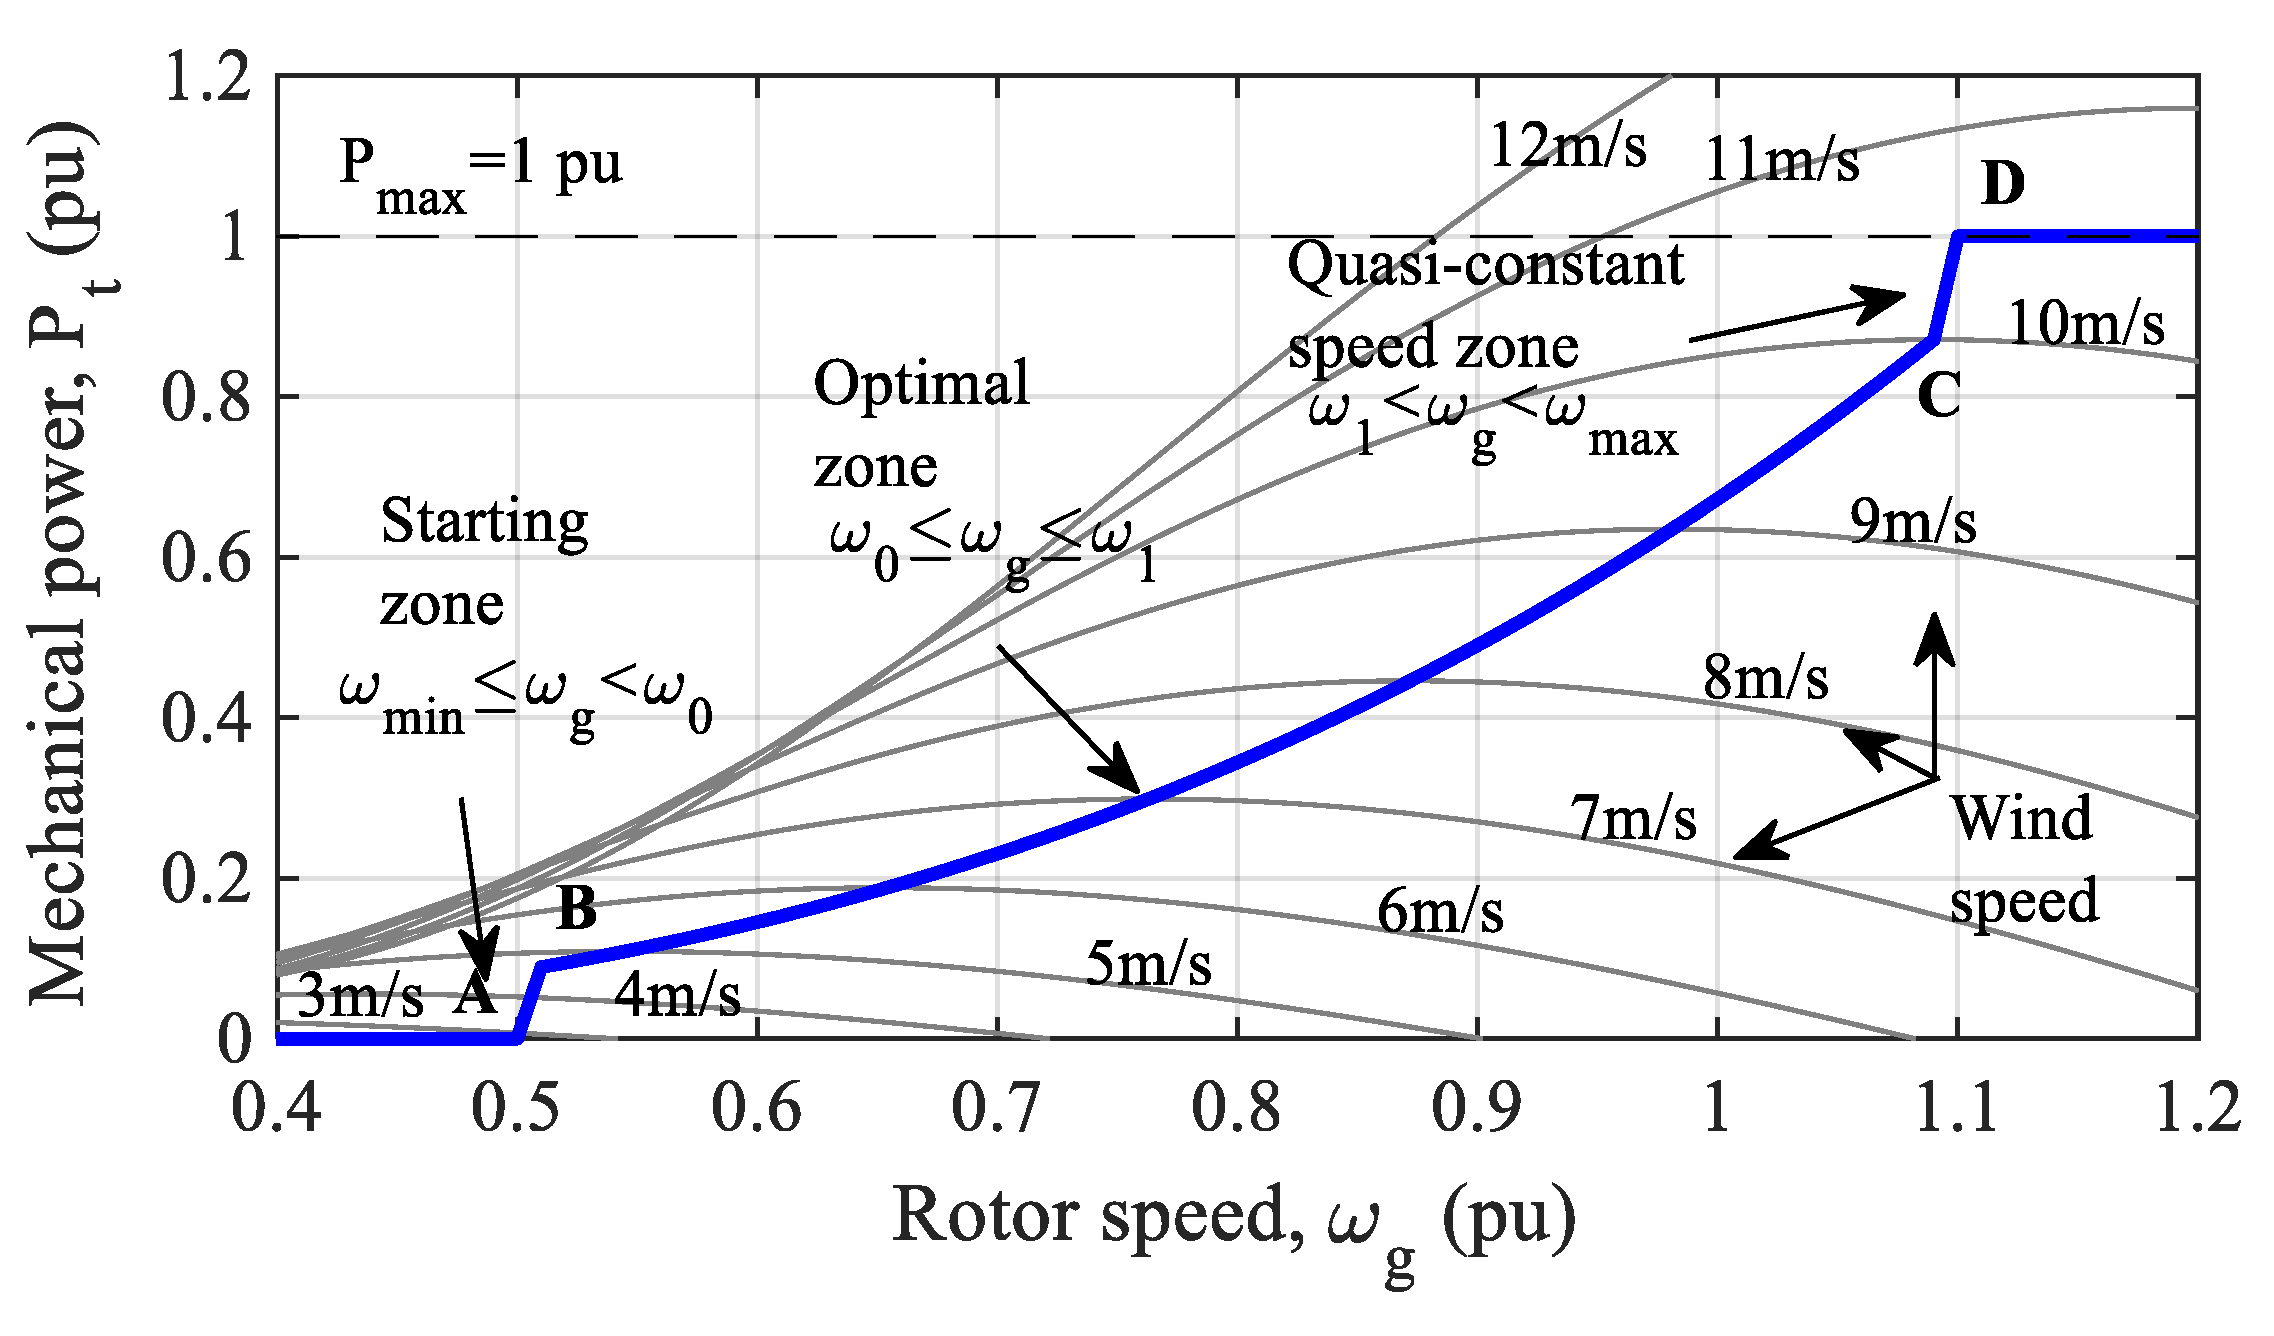
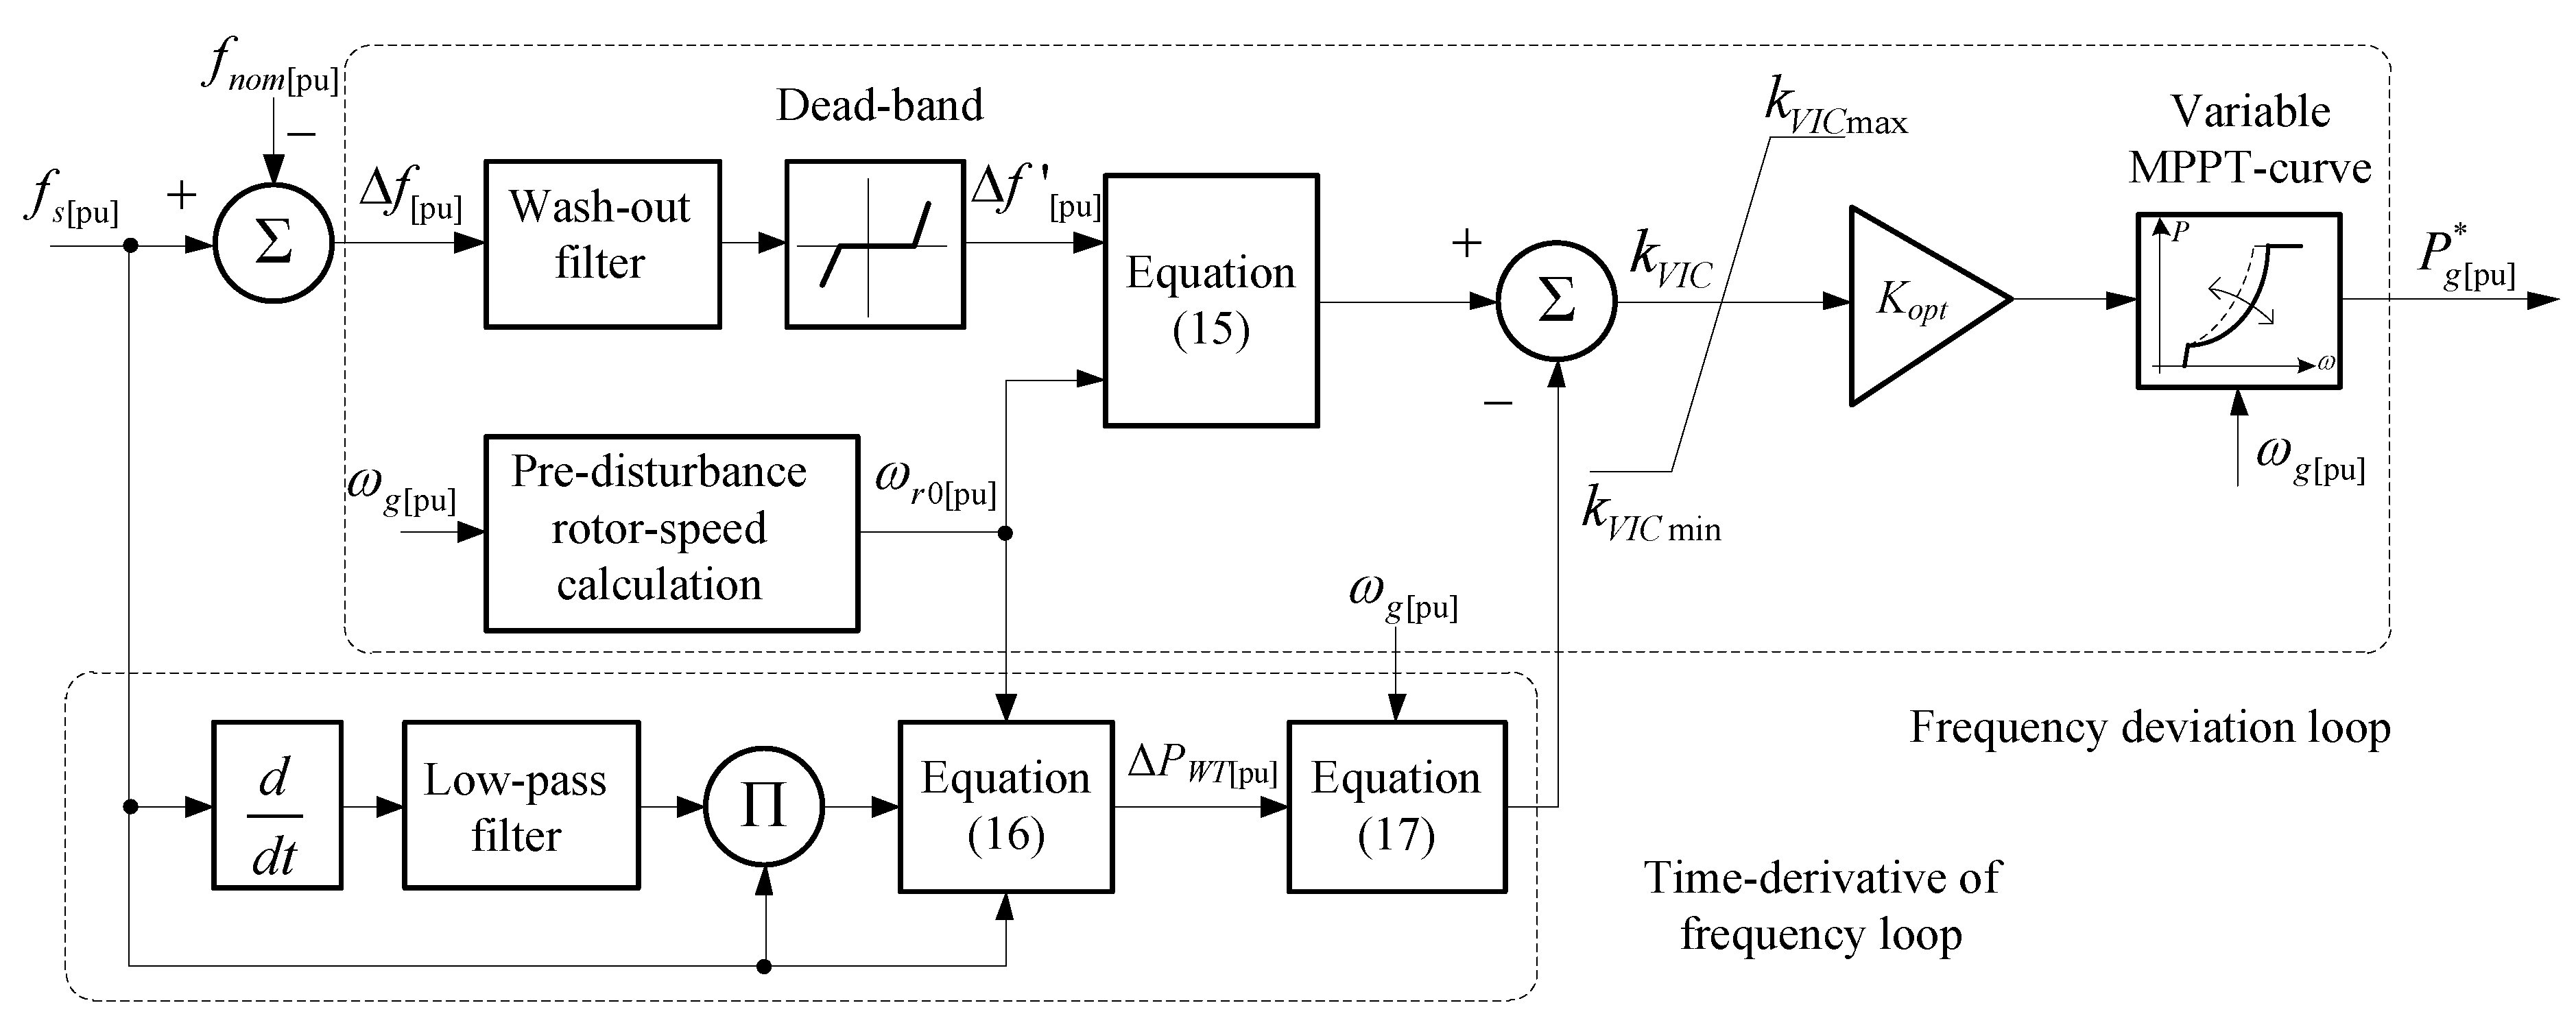
2.2.2. Wind Power Plant

The San Cristóbal wind farm is made up of three variable speed wind turbines with full power electronic converter (type IV, from the manufacturer MADE, model A-59). Each one has a brushless synchronous generator driven by a horizontal axis turbine. It is schematically represented in Figure 5 [26].
Its representation derives from some of the author’s proposal [21], consisting of a simplified electromechanical model of a variable speed wind turbine conceived particularly for the study that is the object of this work. The relevant technical information for the implementation of the wind turbine model is summarized in Appendix C. Given that the objective of this study is based on the application of virtual inertia, a brief presentation of the concept and its application in a variable speed wind turbine will be given next.
This concept consists of introducing changes in the active power command signal dispatched by the wind turbine in response to the variation of some variable of interest; in this case, the network frequency. This characteristic, supported by the kinetic energy stored in the wind turbine, is implemented in the active power controller of the machine. The virtual inertia control scheme used in this study has been taken from [21] and is outlined later in Figure 8. Before describing the mechanics of the method, some aspects concerning the control criteria of the active power dispatched by the wind turbine are addressed.
In Figure 6, the characteristic P-ω curve of a three-bladed wind turbine is shown, particularized for the commercial model adopted in this study. The maximum power point tracking (MPPT) characteristic has been superimposed on the curves of the mechanical power developed by the turbine.
In order to model the dynamics of the MPPT curve, the optimal power in each operating zone is characterized, as shown in the following set of equations:
Zone   AB :   P opt = K opt ω 0 3 ( ω o ω min ) ( ω g ω min )
Zone   BC :   P opt = K opt ω 0 3
Zone   CD :   P opt = ( P max + K opt ω 1 3 ) ( ω max ω 1 ) ( ω g ω max ) + P max
From   D :   P opt = P max
where
  • Popt = Optimum power delivered by the wind turbine.
    K opt = K p K λ 3 λ opt 3 C p , max
    C p , max = C p ( λ opt , β min )
    K p = 0 . 5 P base ρ π R 2
    λ opt = K λ ω opt v
    K λ = ω t ,   base [ rad / s ] R [ m ]
  • ρ = Air density (kg/m3).
  • R = Turbine blade radius (m).
  • Cp,max = Maximum power coefficient.
  • λopt = Optimal specific or relative turbine speed.
  • v = wind speed.
According to the criterion proposed in [21], the changes in the value of the setpoint active power injected by the wind turbine into the grid are carried out by shifting the MPPT curve above or below its original position, as illustrated in Figure 7. This is achieved by manipulating the optimization constant, Kopt, in Equations (6)–(9), by multiplying by a factor, kVIC, which presents sensitivity to changes in the frequency of the system, Δf, and its derivative, df/dt.
Depending on the deviation of the frequency from its rated value, the multiplication factor, kVIC, will generate a series of maximum power follow-up curves, which will be called VIC curves (Virtual Inertia Control curves).
Next, the mechanics of the method are explained, using Figure 7. Assuming that the wind turbine is subjected to a constant wind speed (v = 8 m/s), according to the MPPT algorithm, its operating point on the P-ω characteristic of the machine will be located at point A. If, at a certain moment, the network experiences an increase in the demanded power (or a loss of generated power), the frequency will begin to decline. To make the wind turbine support the grid frequency, it must respond with an increase in the active power it injects.
This method of virtual inertia forces the MPPT curve to shift upwards to drive the wind turbine operation to point O immediately. In this new operating condition, the rotor decelerates, and the kinetic energy stored in its rotating masses is released to support the restoration of the grid frequency. During the deceleration process, the operating point moves from O to B along the modified MPPT characteristic.
Once the frequency support is no longer needed, the wind turbine must return to its optimal operating point, A, therefore, the method will return the MPPT curve to its original position. The control action provided by the virtual inertia method described here, whose deductive process is detailed in [21], is defined in the following equation:
k V I C = ω r 0 [ rad / s ] 3 ( ω r 0 [ rad / s ] + 2 π k v i r Δ f [ H z ] / p ) 3 Δ P W T [ p u ] K opt ω g [ p u ] 3 W V I R
where
  • ω r 0 [ rad / s ] = initial angular velocity of the rotor.
  • k v i r = virtual inertia coefficient.
  • Δ P W T [ p u ] = power delivered by the wind turbine due to the change in rotor speed, which can be defined as:
    Δ P W T [ p u ] = 2 ( ω r 0 [ p u ] ω s [ p u ] k vir H eq [ s ] ) f s [ p u ] d f s [ p u ] d t
  • WVIR = weighting factor, defined as the ratio of the kinetic energy developed by the wind turbine to the maximum kinetic energy that it can store, as follows:
    W V I R = ω g 2 ω m i n 2 ω m a x 2 ω m i n 2
Figure 8 shows a general schematic representation of the virtual inertia algorithm that must be implemented in the wind turbine speed controller to enable its participation in frequency control tasks. The details of the implementation of the scheme and the values of its parameters are described in detail in [21].

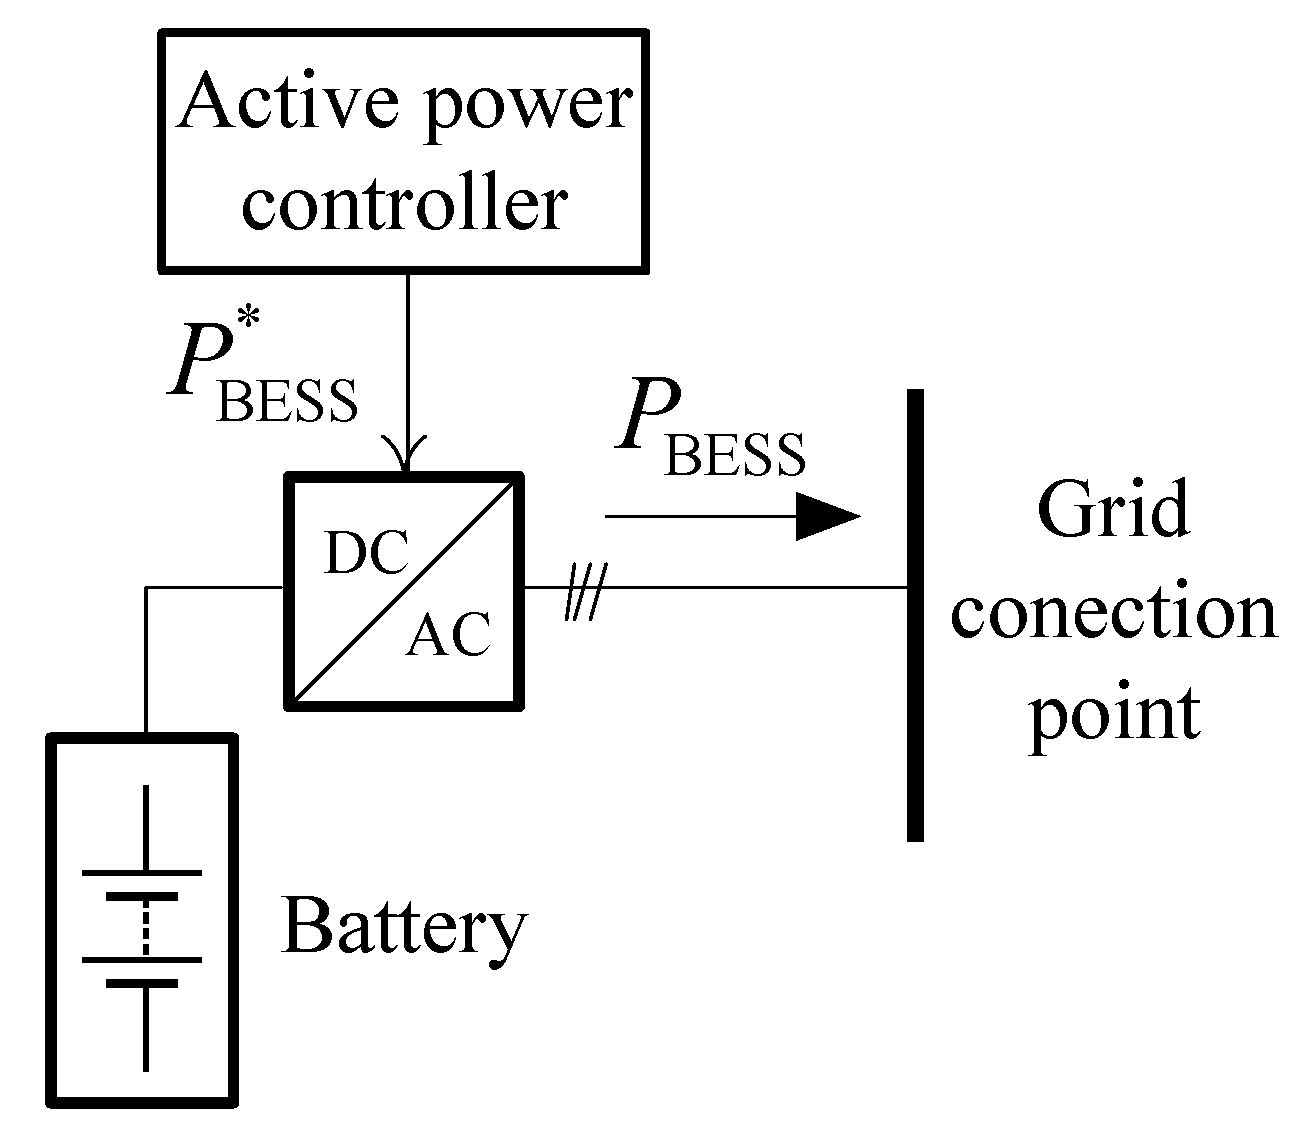
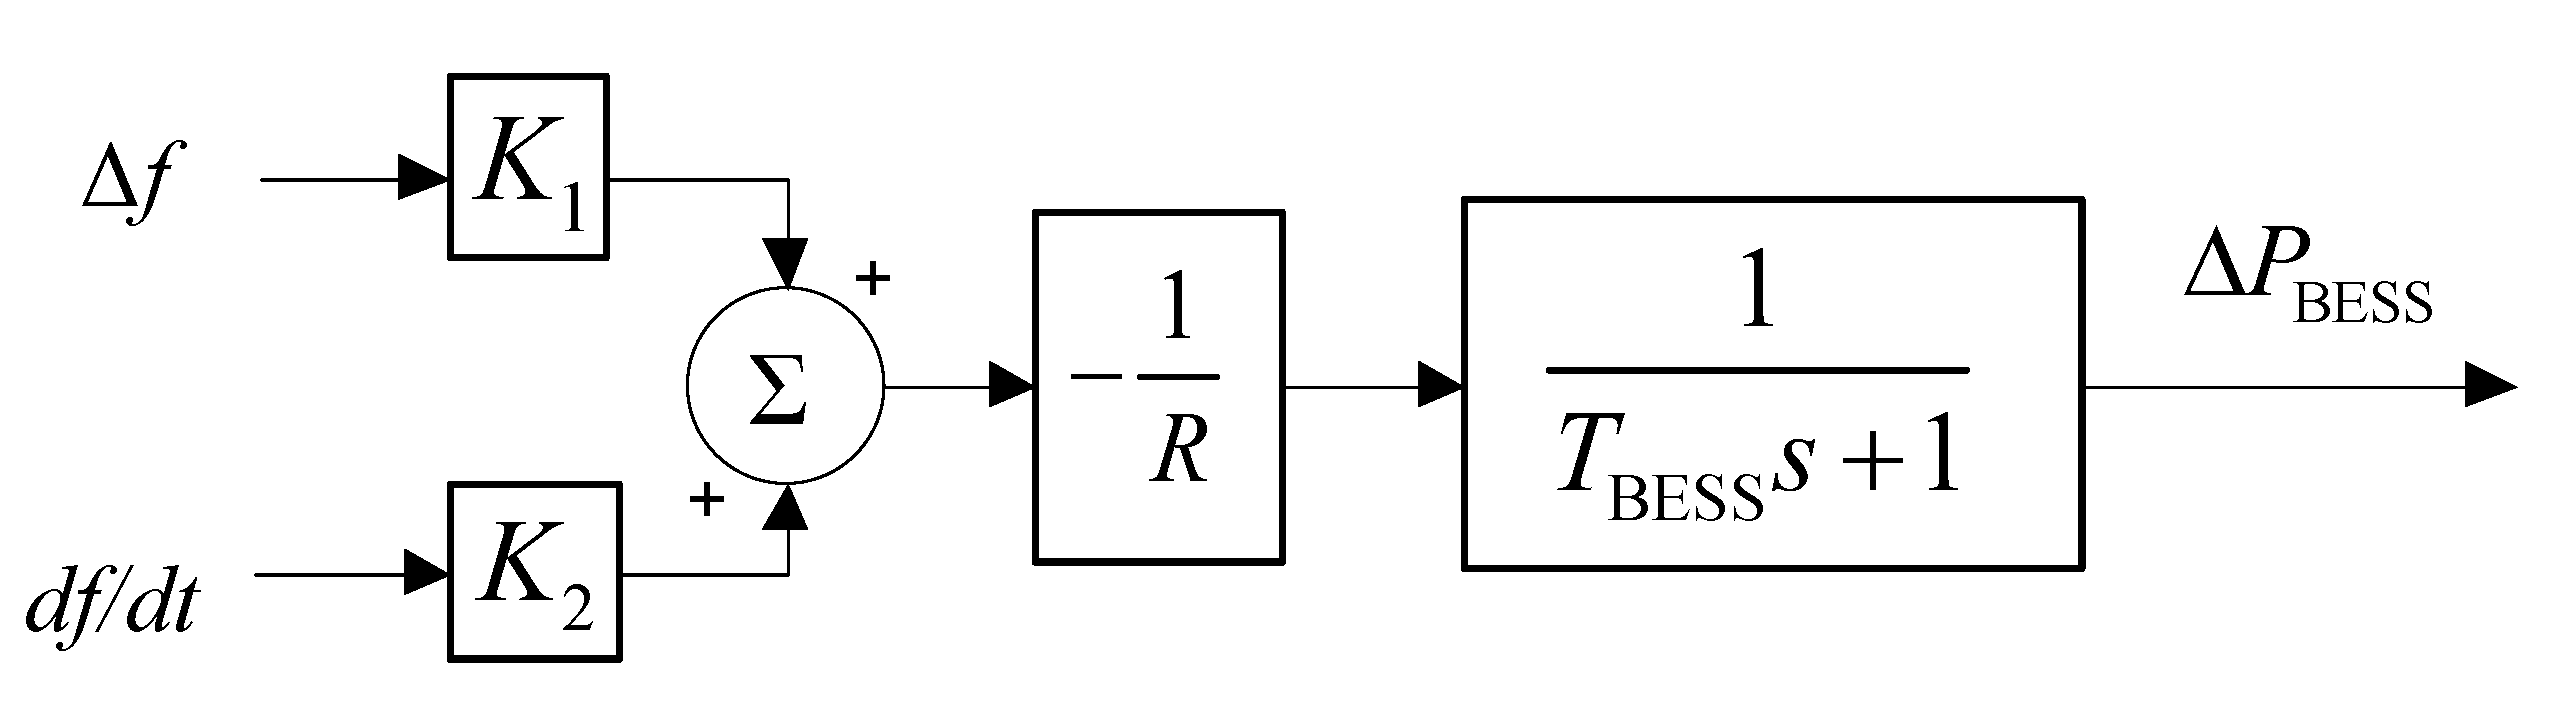
2.2.3. Battery Energy Storage System

Among the potential benefits of incorporating battery energy storage systems (BESS) into electrical power systems are: improvement of the transmission of electrical energy, damping of power oscillations, dynamic voltage stability, short-term power reserve, leveling of the demand profile, reduction of power supply interruptions due to low-frequency load shedding processes, sub synchronous resonance damping, and improvement of power quality [32,33].
A complementary application of interest is frequency regulation, the object of this work, in which the BESS is loaded or unloaded in response to the active power compensation needs in the system in the event of an increase or decrease of frequency, respectively [34].
In general terms, a BESS consists of three main components: the battery module, which stores electrical energy through an electrochemical process; the electronic power converter, normally referred to as an inverter, which converts direct current into alternating current to be injected or absorbed from the system as appropriate; and the power control systems, whose function is to establish active and reactive power setpoints based on the role adopted by the BESS within the electrical power system. A typical general diagram of a BESS is illustrated in Figure 9.
In order to incorporate the model that represents the dynamics of the energy storage unit within the scheme considered for the representation of the electrical power system, in the time horizon covered by the frequency control actions, the model proposed by [35] is adopted, as illustrated in Figure 10. In this, the virtual inertia control is implemented by adding two control loops: one dependent on the frequency variation, ∆f, like a power-frequency droop control, and the other, dependent on the frequency variation rate, in the time domain, df/dt, or RoCoF. Thus, when the system frequency varies, this scheme will respond with a change in the active power setpoint ΔPBESS in order to emulate an inertial response.
A common practice in this type of study is to represent the dynamics of the battery by means of a first-order transfer function, with a TBESS time constant depending on its technology. The values of the parameters of the scheme of Figure 10 are summarized in Appendix D.
It should be noted that this linear model, common in frequency stability studies, has certain limitations since it obviates non-linearities. For example, the response capacity of the storage system to frequency variations has a certain dependence on the state of charge of the battery. With very low state of charge, the power injection capacity can be limited to values below the nominal power of the electronic converter in order to protect the battery.
Similarly, with very high state of charge, the power absorption capacity of the battery may be diminished. However, it must be taken into account that the inertial emulation, on the one hand, takes place during very short periods of time, which implies really reduced energy exchanges between the battery and the electrical energy system, and, on the other hand, as the sign of the frequency deviation is constantly changing, the energy exchange is also changing, so the average energy balance is practically zero.
Finally, to particularize the model for the case study, given that there is currently no storage unit installed on San Cristóbal Island, the one existing on a neighboring island (Isabela), in which a 660 kW system is already installed, will be taken as a reference. Thus, the participation factor of this technology within the primary frequency control scheme proposed in this study (Figure 2) is quantified as:
w3 = 0.66/2.439 = 0.2706 p.u.

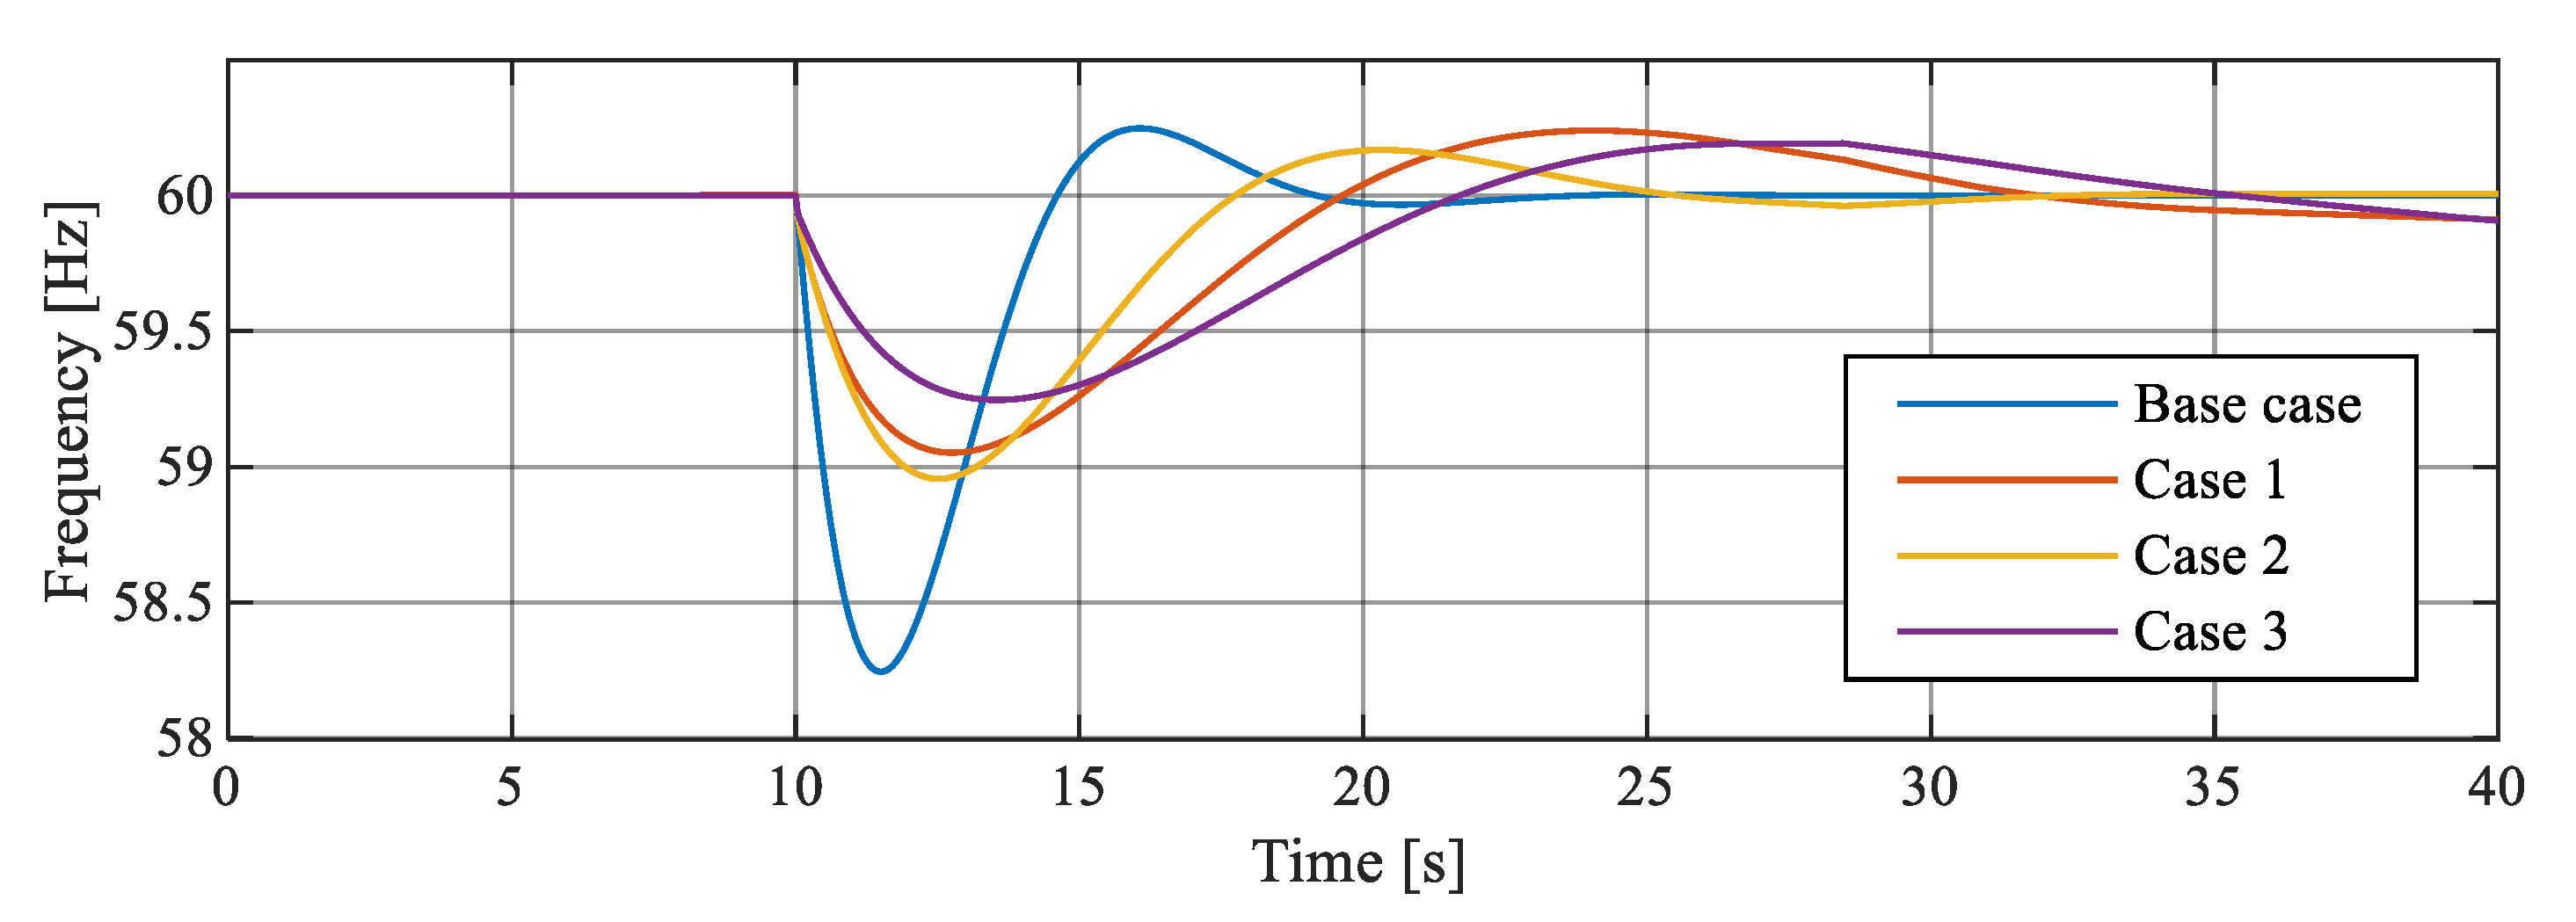
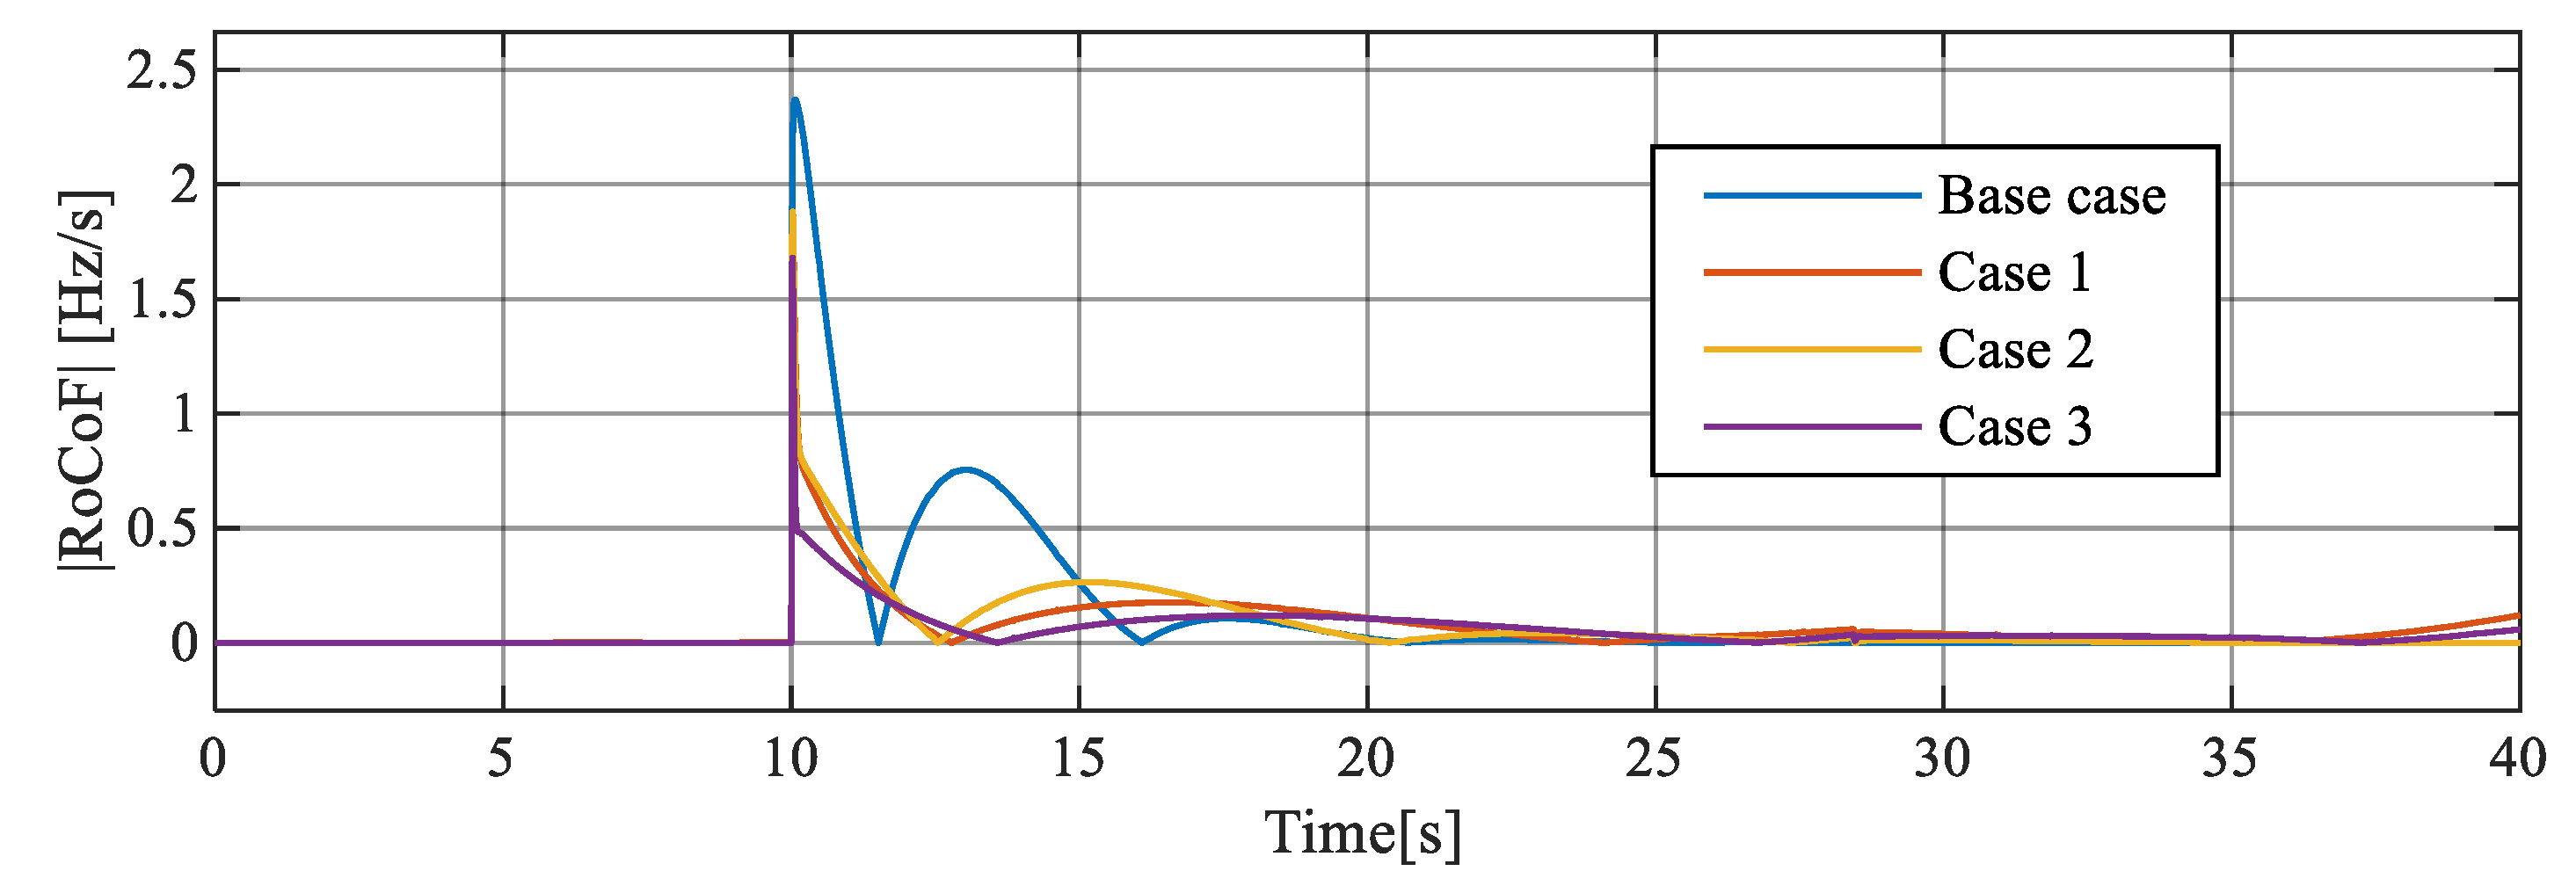
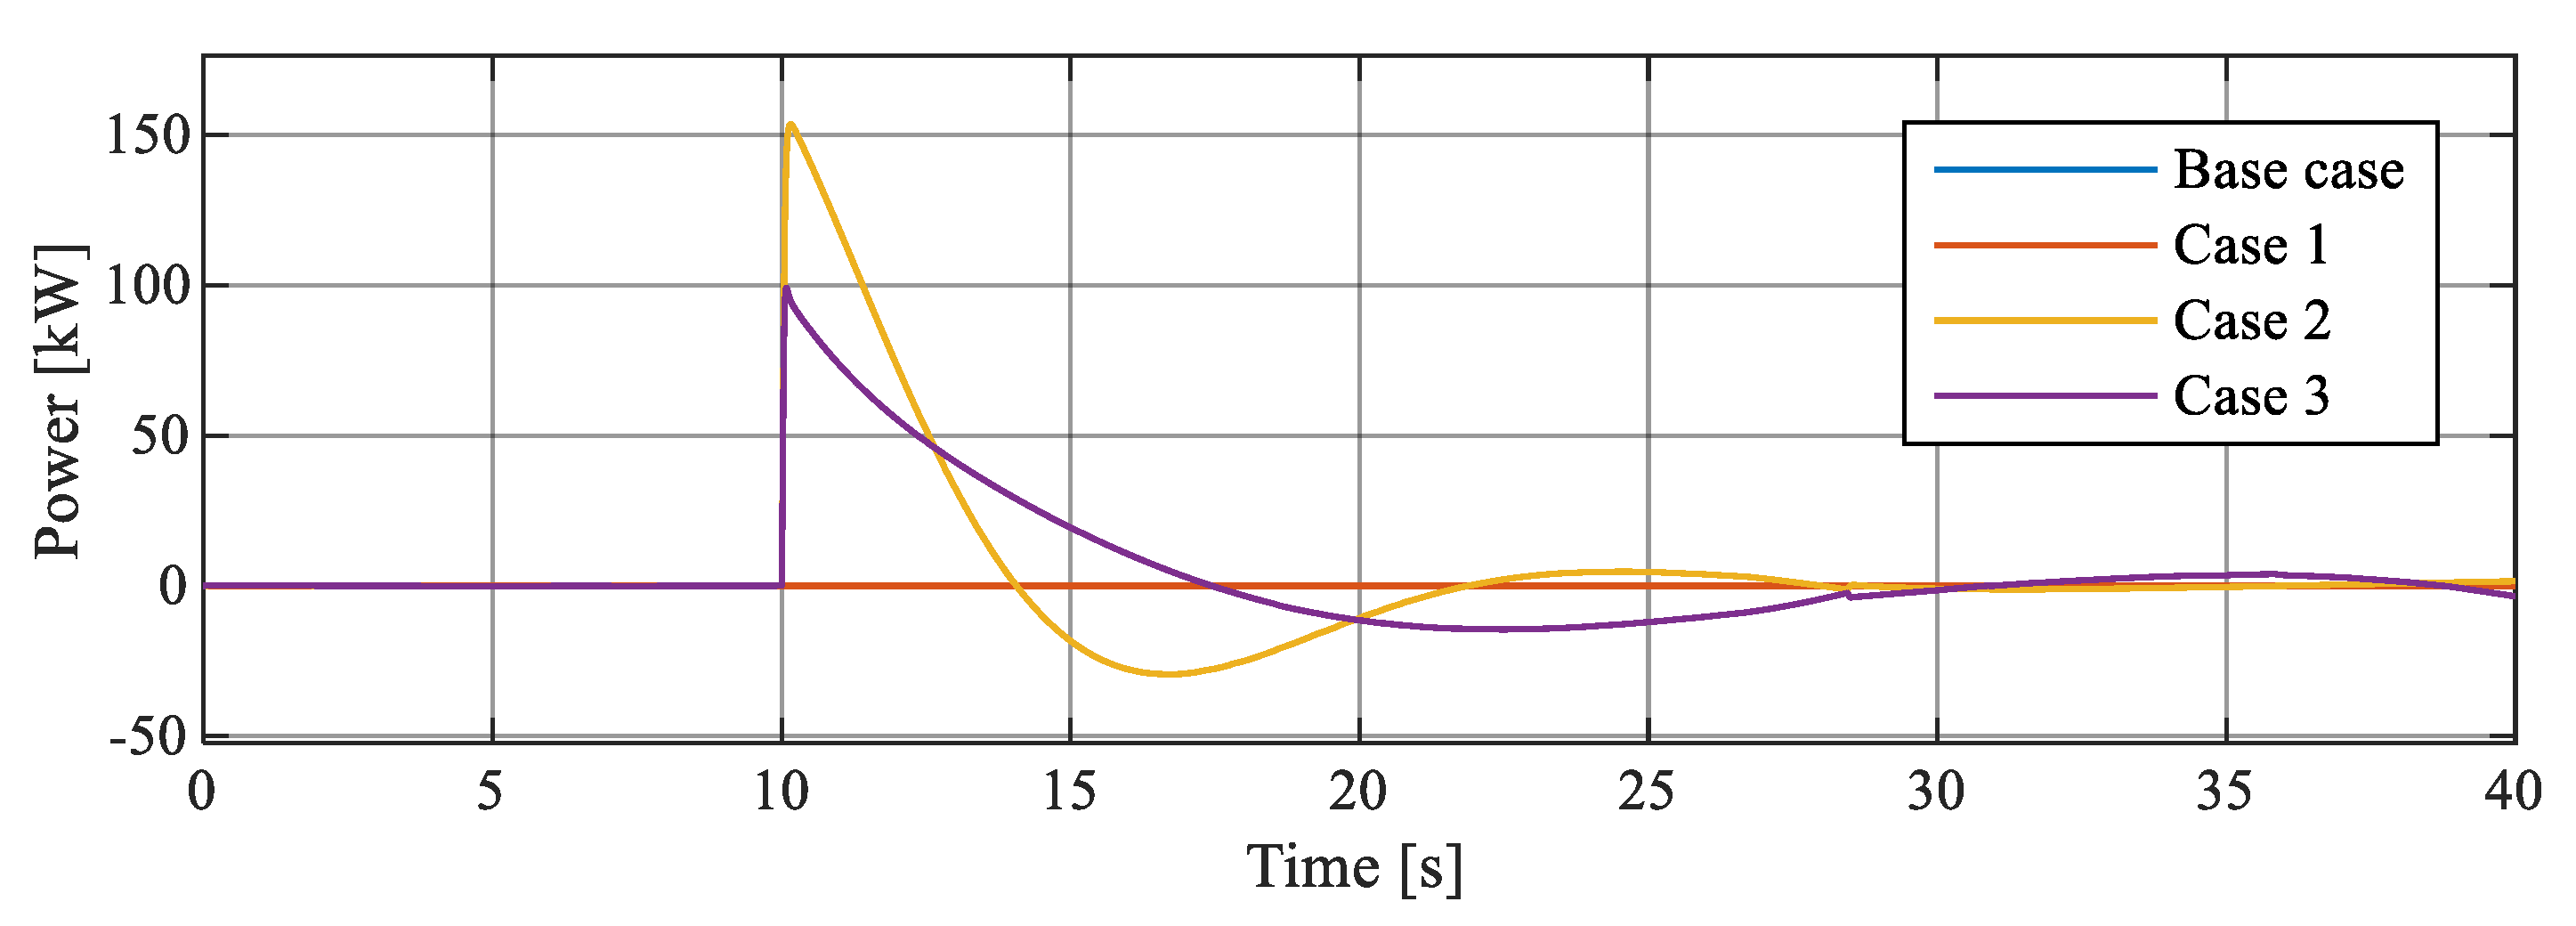
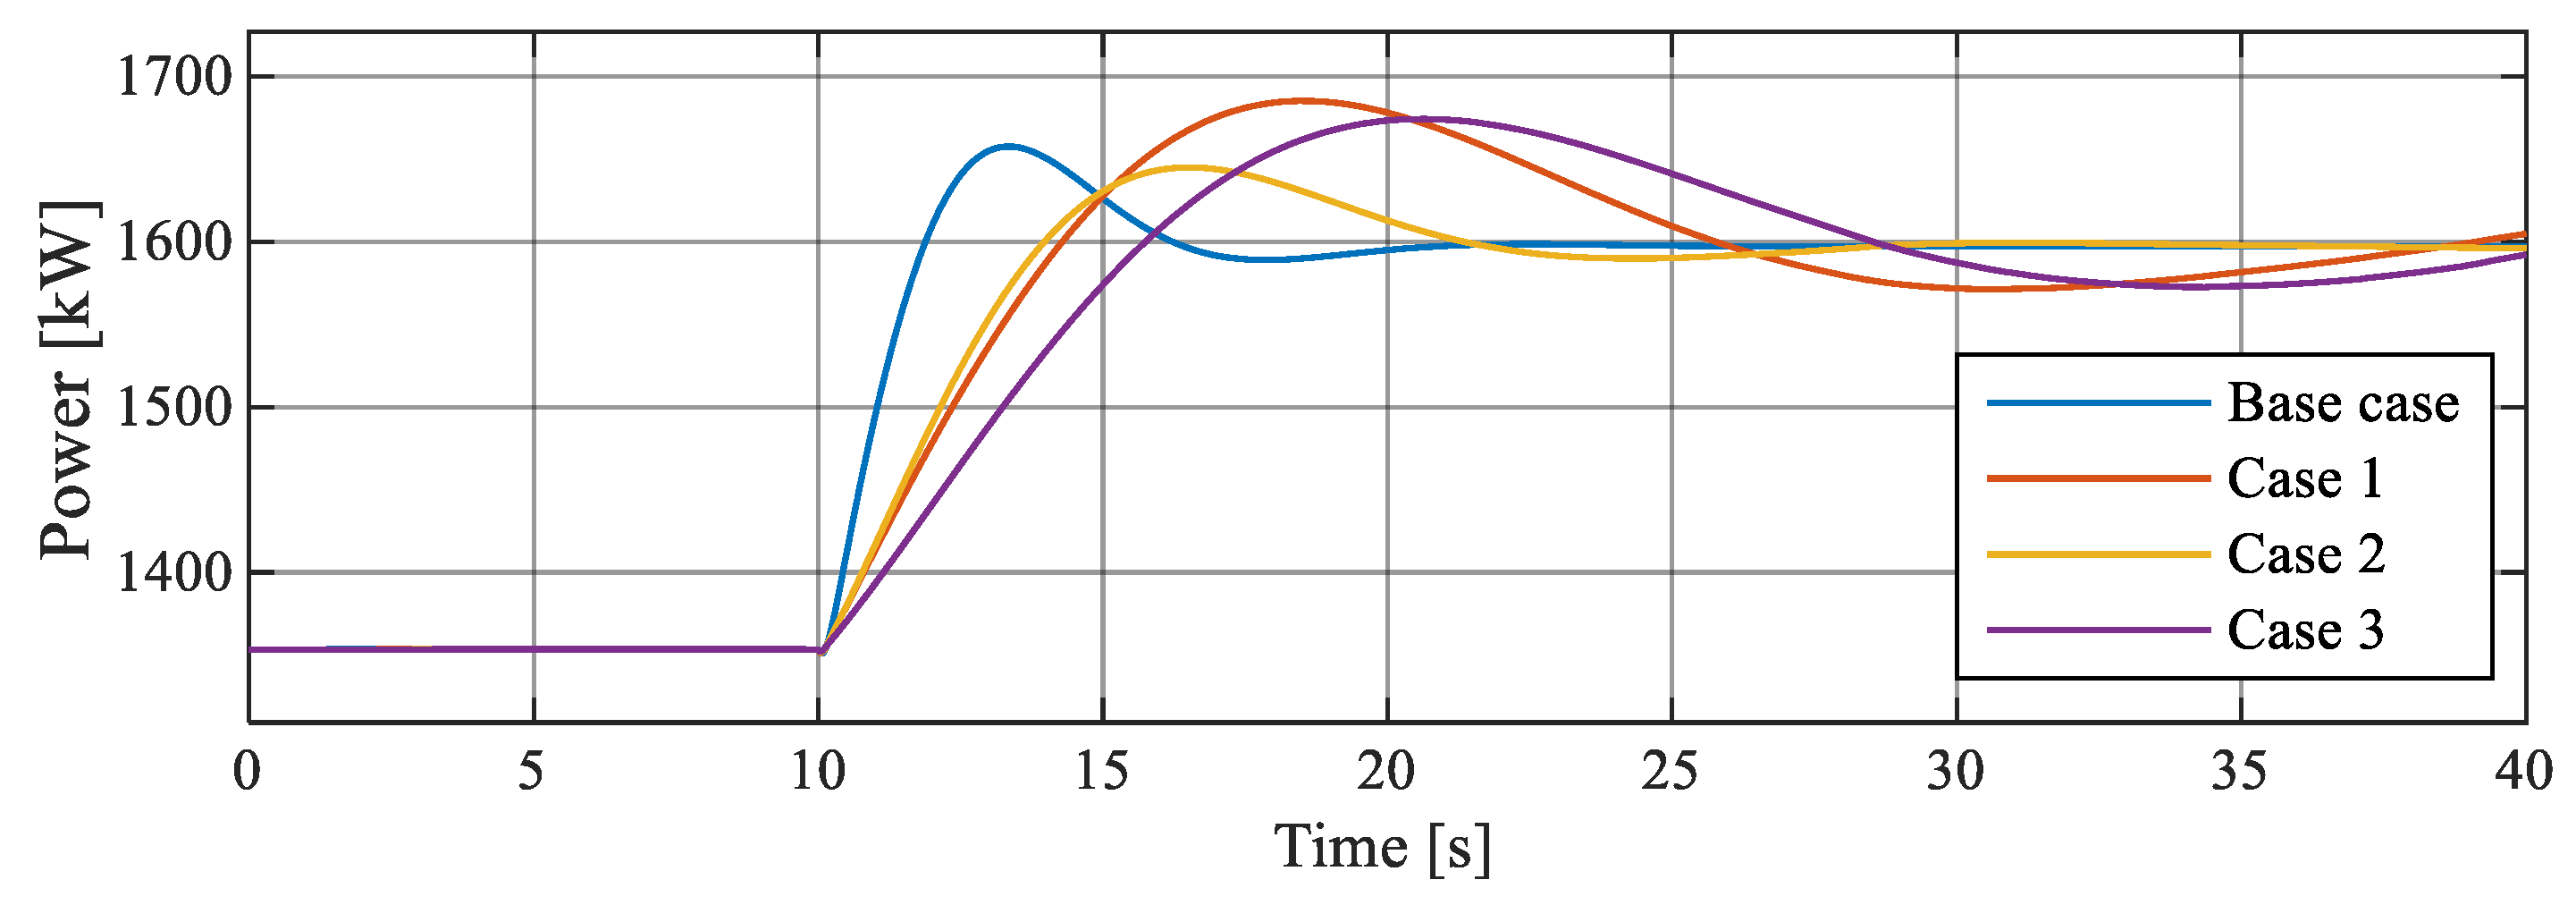
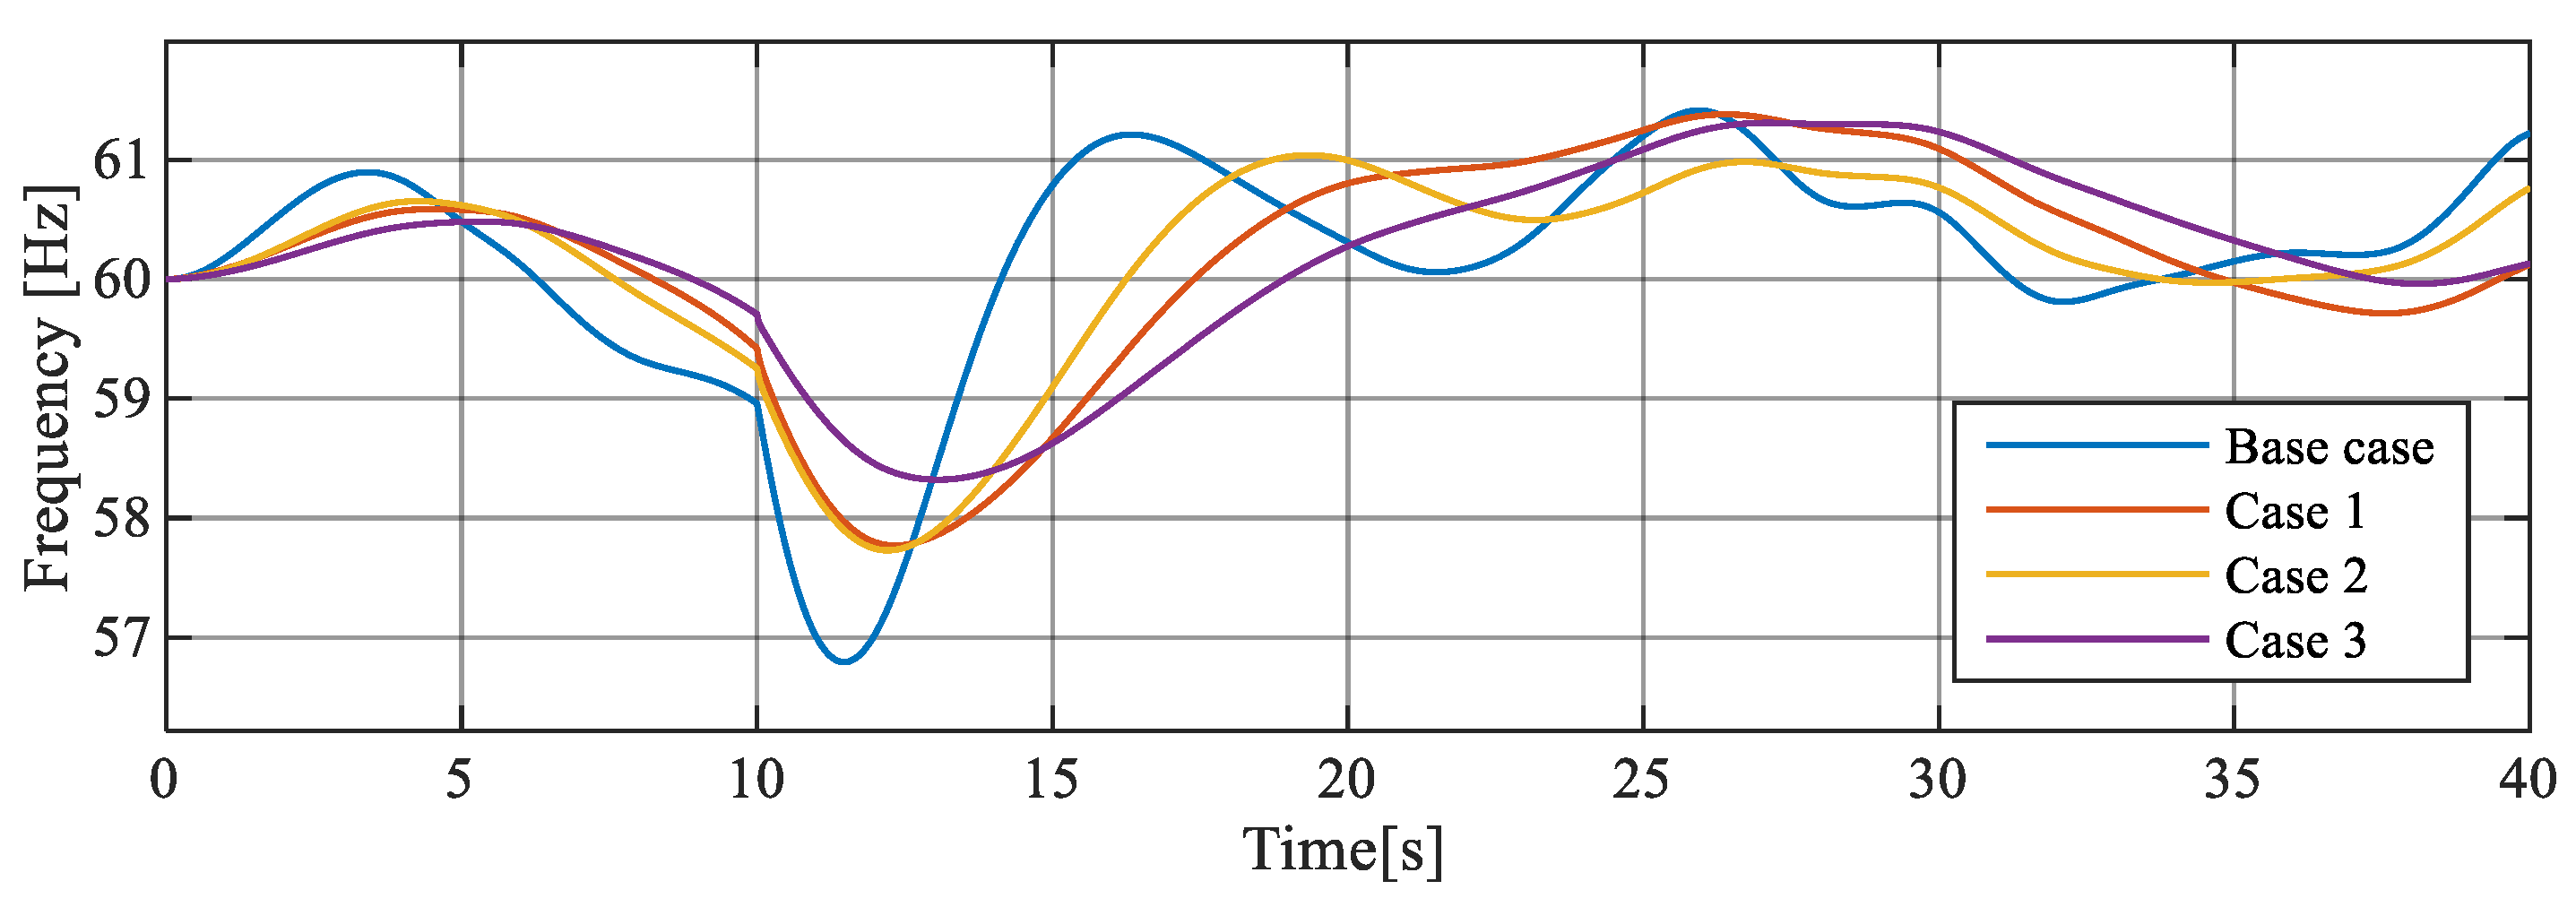
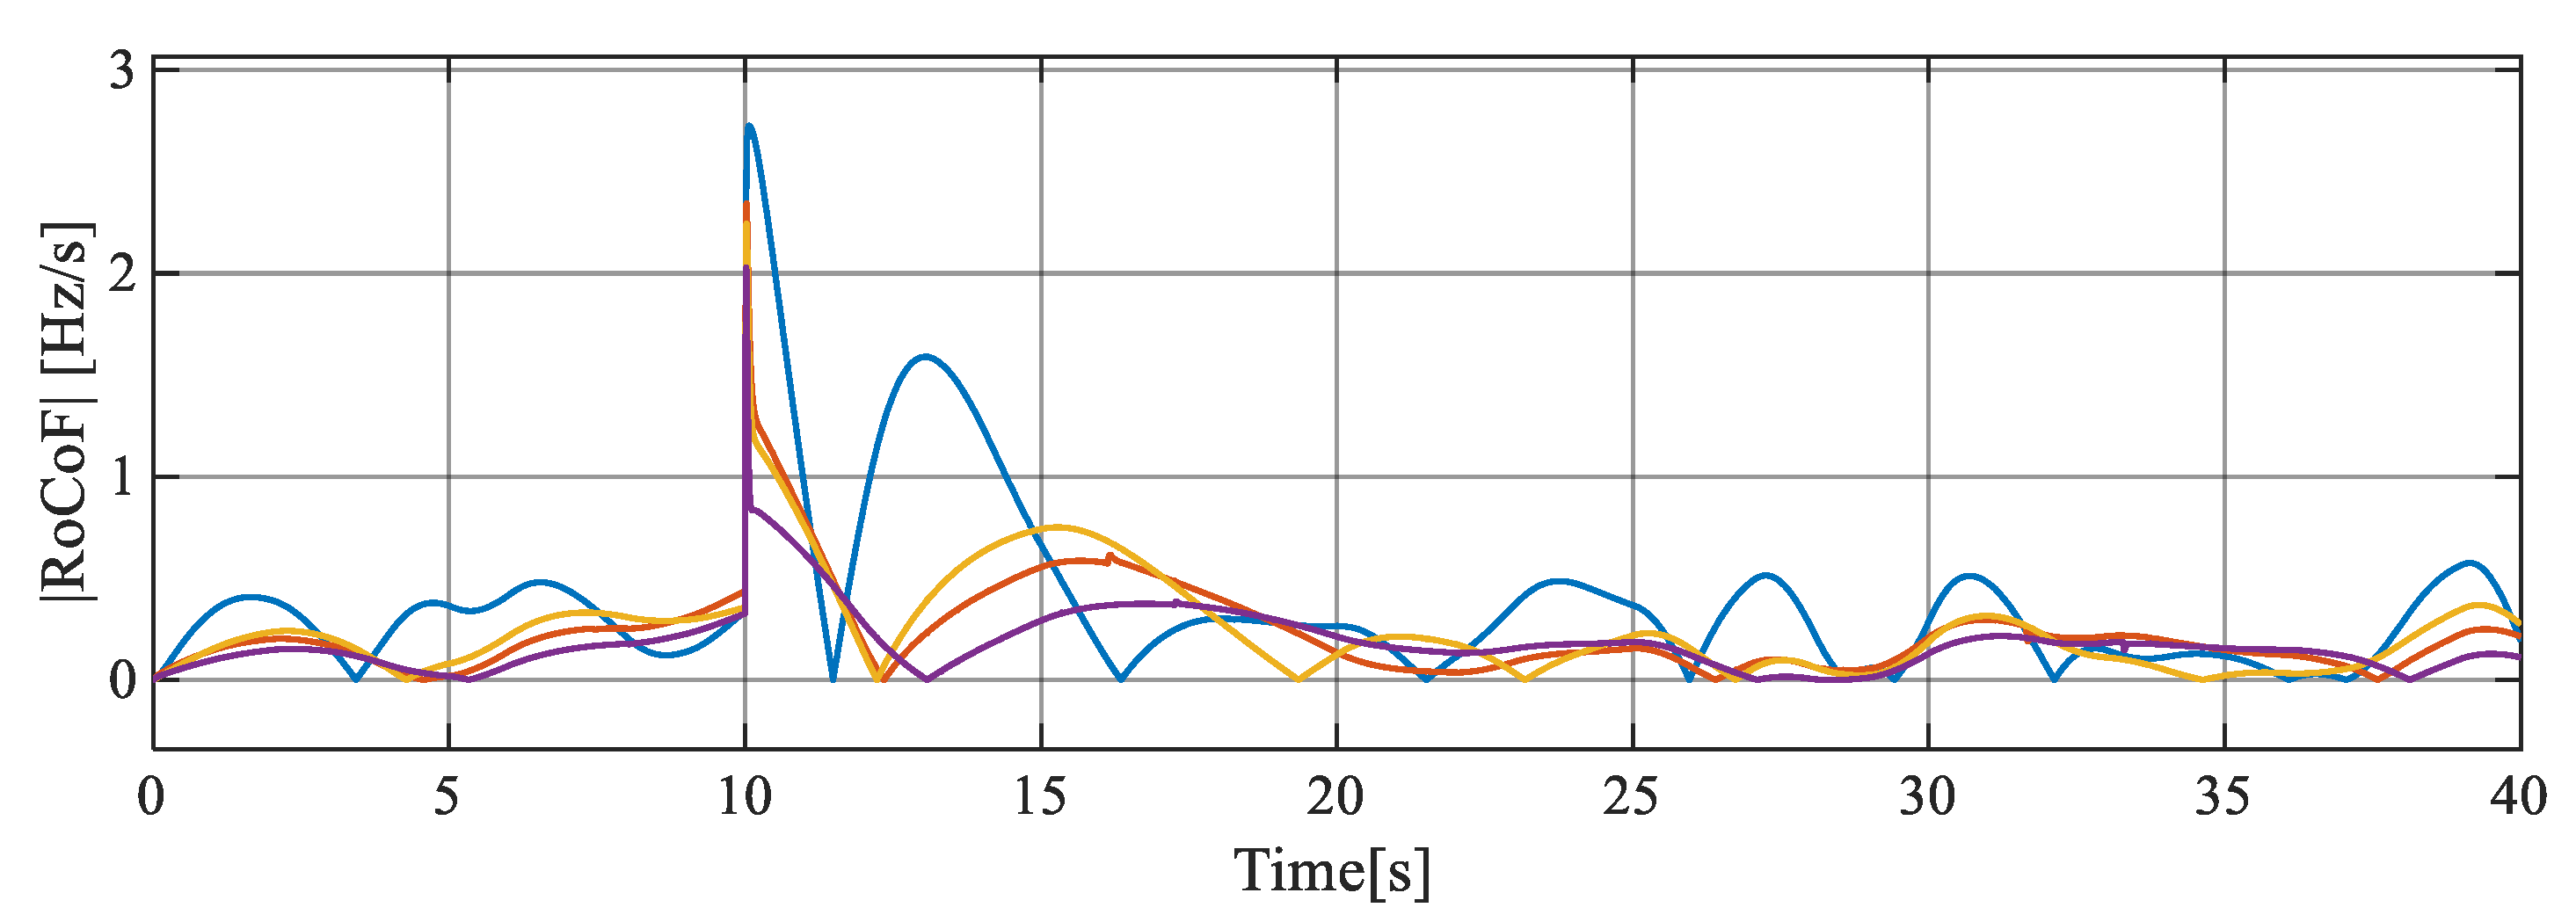
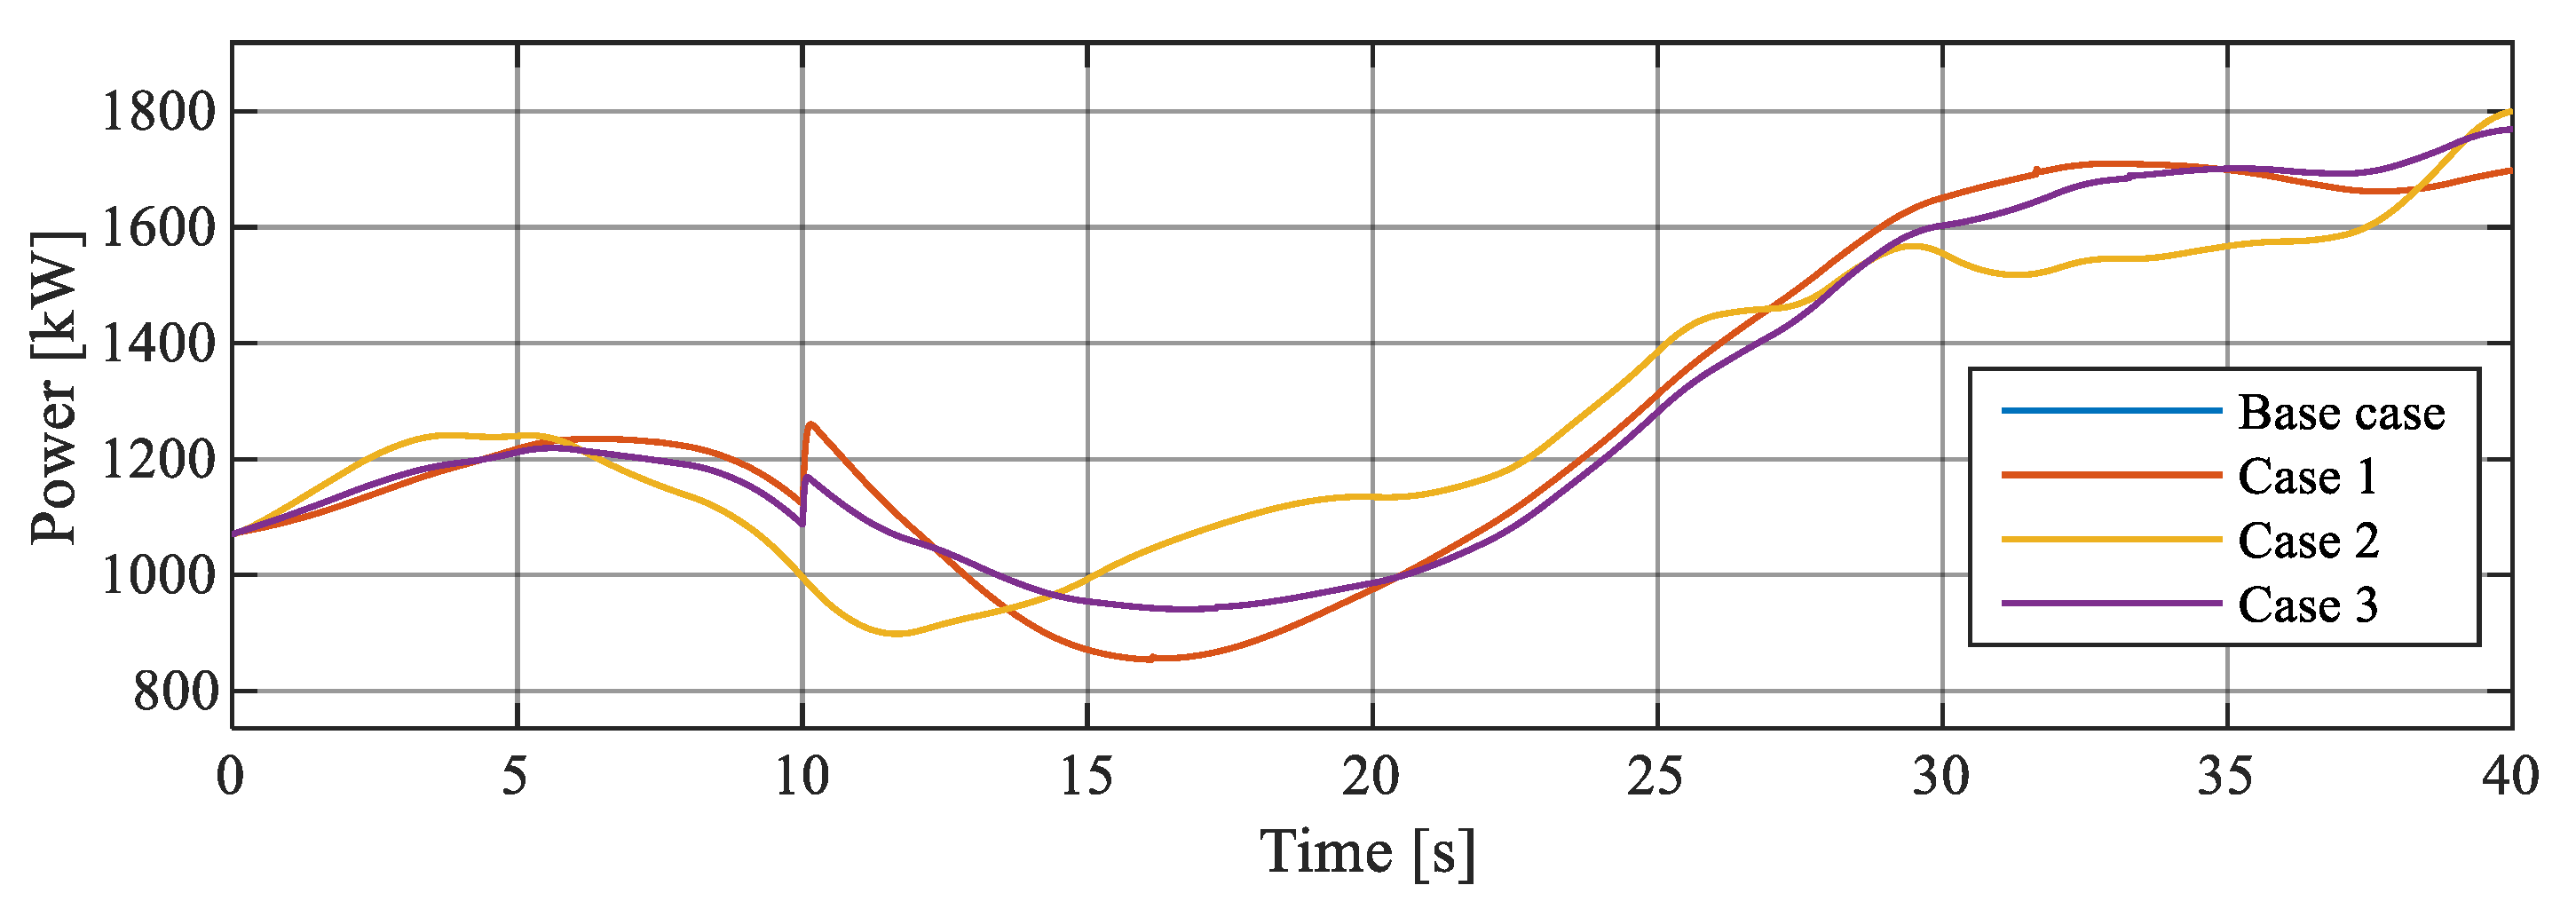
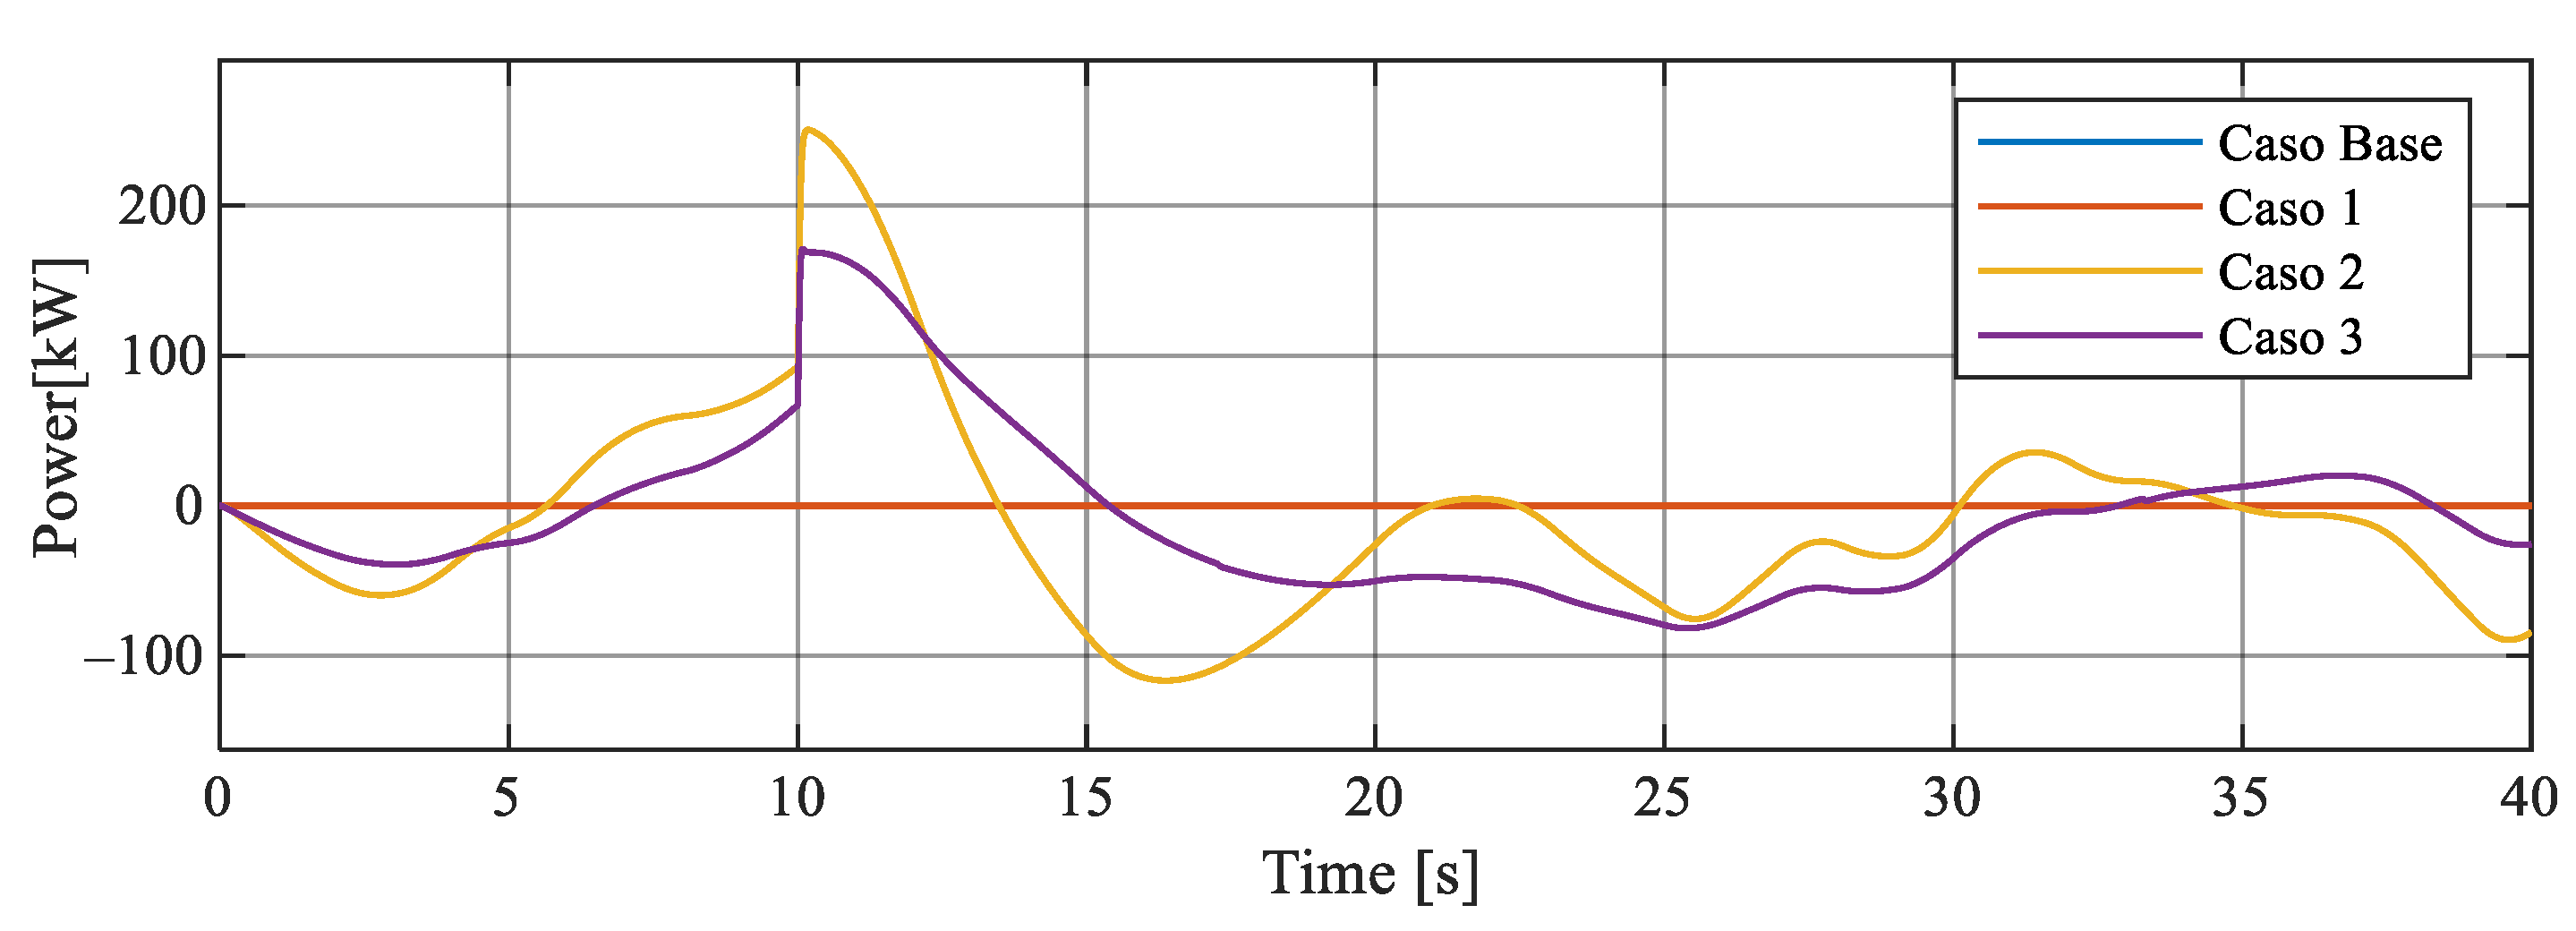
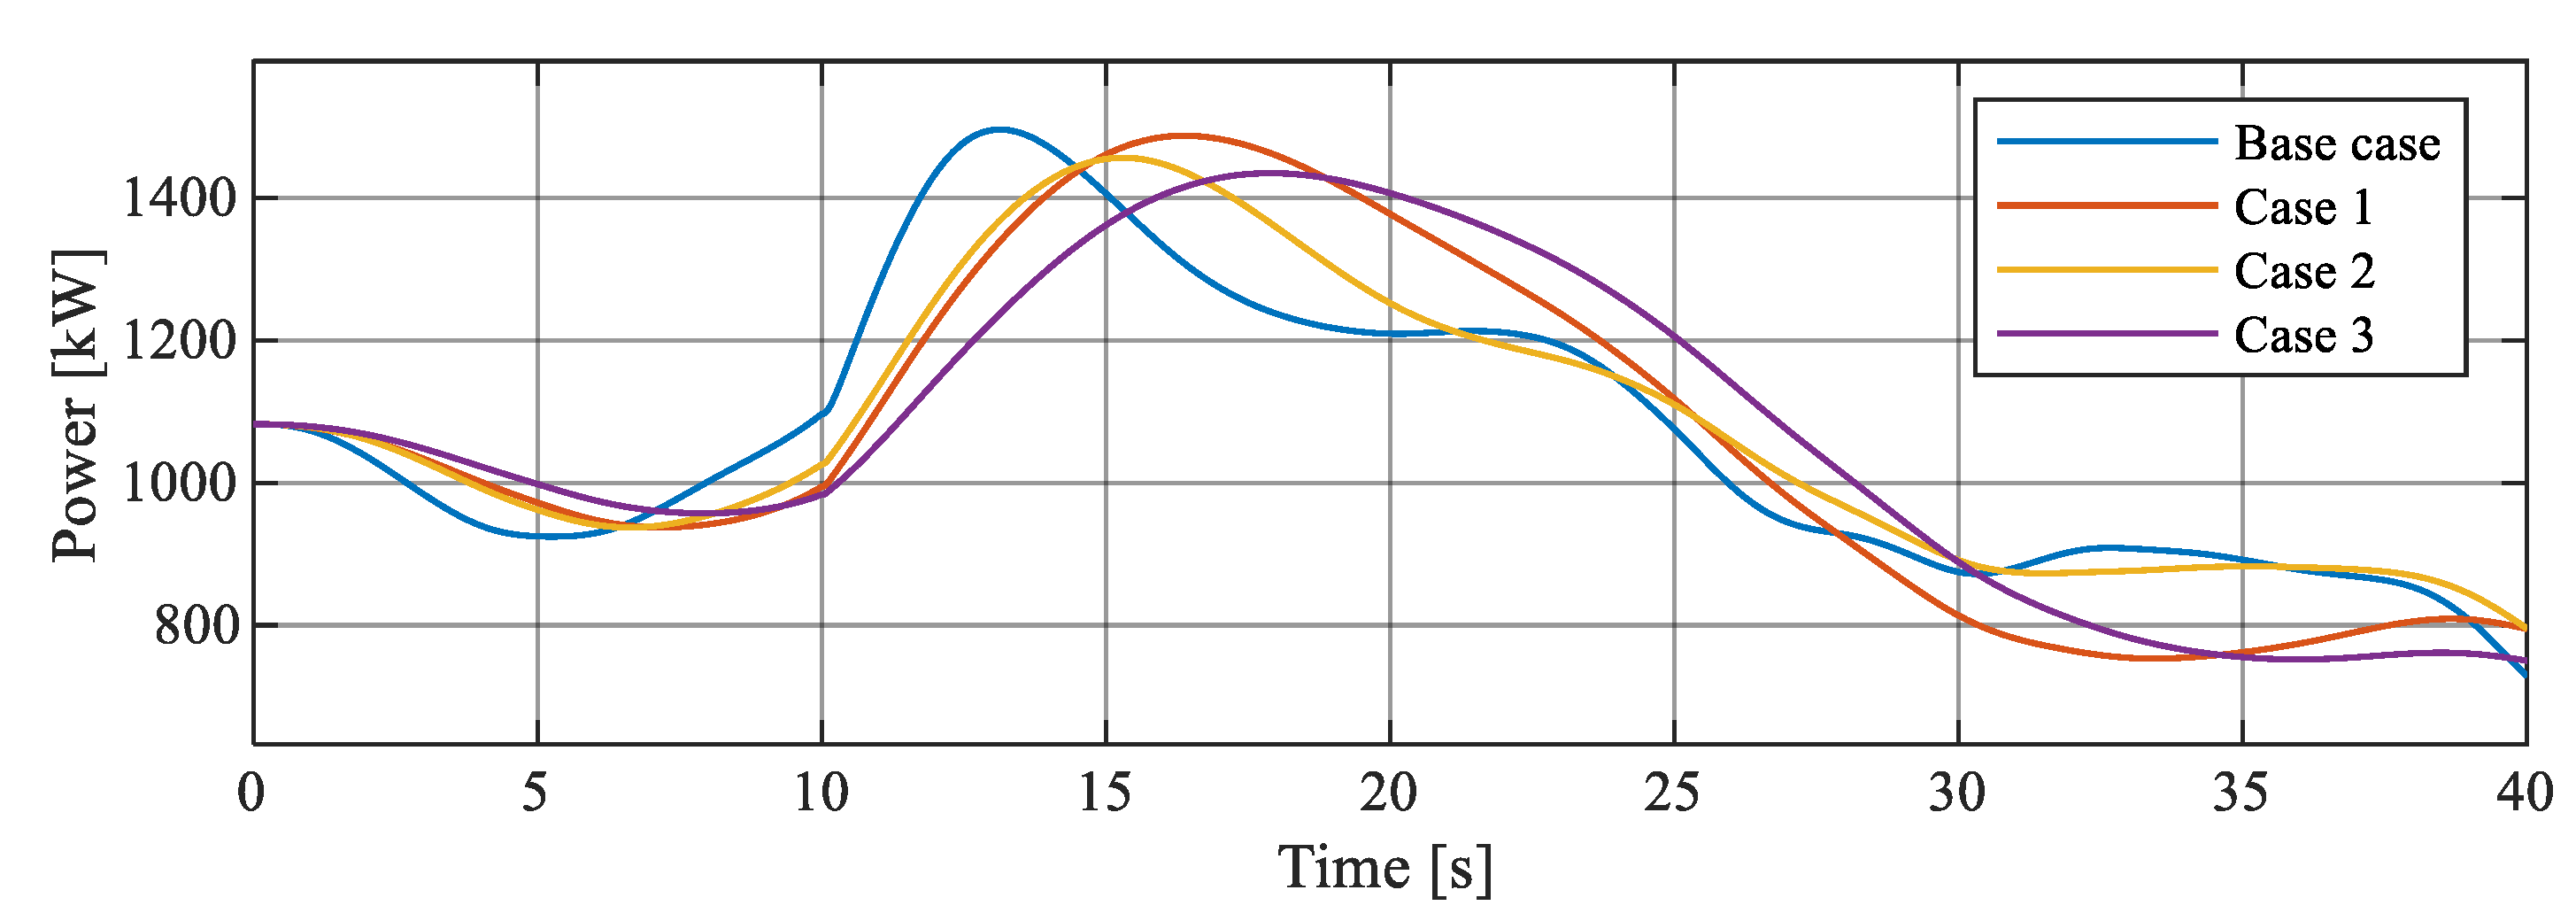
3. Results and Discussion

In this section, the performance of the control strategies designed to improve the effectiveness of the system frequency recovery actions in contingency situations are evaluated. The analysis has been divided into the following case studies:
  • Base case: Frequency control performed only by operating diesel synchronous generation.
  • Case 1: Frequency control performed by the diesel generation in cooperation with the virtual inertia control implemented in the wind turbines.
  • Case 2: Frequency control carried out by the diesel generation together with the BESS using the emulated inertia control.
  • Case 3: Frequency control carried out by the diesel generation together with the combined action of the wind turbines and the BESS in the provision of inertial response.
Next, the results obtained, with time domain simulations, for some variables that are of interest in this study, are illustrated: Δf and RoCoF are illustrated in Figure 11 and Figure 12 and are summarized in Table 2 and Table 3.
Figure 11 shows that, by promoting the participation of wind turbines and BESS in frequency control tasks by adding virtual inertia control schemes, a significant reduction in the peak of frequency variation following the disturbance is obtained, with values around 45% in case 1, 41% in case 2, and 57% in case 3.
Figure 12 shows a significant reduction of the RoCoF peak with respect to the value reached in the base case: 23%, 27%, and 48% for cases 1, 2, and 3, respectively. From these results it can be inferred that the participation, whether of wind generation or BESS, in the frequency control is beneficial for the system, the advantages being more evident when these two agents carry out their work in combination.
Figure 13 illustrates the active power response of the group of wind turbines in each of the scenarios. Note that the wind turbines respond with an increase in active power in the first moments of the contingency (in cases 1 and 3), which contributes to reduce the maximum frequency deviation and the maximum value of RoCoF (Figure 11 and Figure 12). In this figure, the curves that represent the base case and case 2 are overlapping, since in these cases the participation of the wind turbines in the frequency control tasks is not considered.
Figure 14 shows the active power response of the BESS for the scenarios studied. Given that in the base case and in case 1 the action of this agent in the frequency support is not expected, the resulting curves are overlapped at a zero level. However, in cases 2 and 3, the active power contribution of the BESS contributes to the frequency recovery efforts. The power injection value is lower when this unit acts in coordination with the wind generation (case 3) than when it does it alone (case 2).
In Figure 15, the temporal response of the synchronous generation (diesel groups) is presented, in terms of power, for the four simulated cases. In the base case, the frequency control actions are governed by synchronous generation through the actuation of their speed controllers in response to frequency deviations, Δf. With the participation of wind generation, BESS or both in frequency control tasks, the frequency stabilization and recovery process improves compared to the base case due to the extra contribution of active power provided by the other agents (Figure 11). It means slower performance of the speed controllers of the synchronous generation, since, by decreasing Δf, which is the control variable, their part of active power increase is now a shared task with the other participating agents. This situation is reflected, of course, in a process of restoring the frequency in a slightly longer time compared to the base case.
Next, the benefits offered by the frequency control strategies implemented in the different generation agents that make up the electrical test system (base case, cases 1, 2, and 3) when it is subjected to more realistic operating conditions, characterized by a high variability of the wind resource, are evaluated. To do this, a wind profile like the one shown in Figure 16 has been applied to the three wind turbines. This time series of wind speed has been obtained from real records taken in the San Cristóbal island wind farm in a windy day. As in the previous study, the contingency takes place 10 s after the start of the simulation.
The results presented in Figure 17 and Figure 18 show that, under a variable wind scenario, the injected wind power introduces continuous power imbalances in the system, which translates into high frequency fluctuations under normal operating conditions (base case). A similar thing happens with the dynamics of the RoCoF.
In these figures, the effect of the participation of the different generation agents in the frequency control (cases 1, 2, and 3) can be appreciated, which produces a notable reduction in the variability of the system frequency and the RoCoF following the contingency. This is because the control strategies implemented in the wind turbines, the BESS, and the speed controller of the synchronous generation itself are permanently acting due to the existence of a constant deviation of the system frequency, not only in contingency conditions.
This situation can be verified in Figure 19 and Figure 20, which show the active power injected into the system by the wind farm and by the BESS, respectively. The power curves shown in Figure 19 for the base case and case 2 are overlapped because the participation of the wind farm in the frequency control is not contemplated. A similar fact occurs in Figure 20 regarding the power injected by the BESS for the base case and case 1.
Note in Figure 17 that when the contingency occurs, the drop in frequency is successfully mitigated in all the cases studied. However, reducing both the frequency deviation and the maximum value of RoCoF is more effective in case study 3, which considers the combined participation of wind generation and BESS in the provision of this ancillary service. Similar conclusion is reached in the study under constant wind conditions (Figure 11 and Figure 12).
Finally, Figure 21 shows the dynamics of the power provided by synchronous generators, where it is possible to see how the demand for their participation in frequency control tasks is reduced when the other generation agents (wind, BESS or both) do too.

4. Conclusions

This work presents a study of the effect of two control strategies based on the concept of virtual inertia (through batteries and the incorporation of a virtual inertia algorithm in wind generation units) on the frequency regulation in an electric power system, within the time frame of primary frequency control under a scenario of high penetration of wind generation. By introducing each of the control strategies, significant improvements in the system’s frequency response can be evidenced in a disturbing event, mainly on the variables: frequency and RoCoF. The simulation results also reveal that such improvement is much more noticeable when the two strategies are applied in combination. This fact allows to corroborate the fulfillment of the research hypothesis.
The proposed model is outlined as an analysis and diagnostic tool that allows studying the dynamics of certain variables of interest of an electrical power system of these characteristics, offering the network operator a tool to study different scenarios that pose a risk to the network frequency stability and being able to take the necessary measures that lead to its prevention or correction.
It is important to note that this is only a first step of the analysis that aims at seeing the big picture of the interaction among different elements of a power system. The advantage of this load frequency control approach is that it allows the analysis of sensitivity issues and the drawing of general conclusions, allowing to define the general behavior of the system and to tune the controllers accordingly. However, this approach has some limitations related to the necessary simplifications, e.g., a unique frequency is considered, parts of the models are described as small-signal ones, and simplified controllers are used. This can lead to inaccuracies for some variables that can have an impact on the detailed description of the system behavior when subject to some particular disturbances. A second or complementary step of the analysis, out of the scope of this work because of its specificity, is based on the approach of detailed computational simulations, even including hardware-in-the-loop or real-time simulations. Although it is difficult to obtain general conclusions with this second approach, it allows a more accurate modeling and is adequate for studying specific situations of interest in a given case, thus complementing the load frequency control approach described in the paper.

Author Contributions

I.P.: Software, Validation, Formal Analysis, Investigation, Data Curation, Writing—Original Draft, Writing—Review & Editing, Visualization, Funding Acquisition. S.M.: Conceptualization, Methodology, Validation, Resources, Writing—Review & Editing, Supervision, Project Administration, Funding Acquisition. D.O.: Conceptualization, Methodology, Software, Validation, Investigation, Resources, Data Curation, Writing—Original Draft, Writing—Review & Editing, Visualization, Funding Acquisition. All authors have read and agreed to the published version of the manuscript.

Funding

This work was supported by the Secretaría de Educación Superior, Ciencia, Tecnología e Innovación (SENESCYT), Government of the Republic of Ecuador [grant numbers CZ02-000683-2018 and 2015-AR6C5141] and by the Spanish National Research Agency Agencia Estatal de Investigación [grant number PID2019-108966RB-I00/AEI/10.13039/501100011033].

Conflicts of Interest

The authors declare no conflict of interest.

Appendix A

Table A1. Technical data of the diesel generator [26].
CharacteristicValue and Unit
Rated active power650 kW
Rated apparent power813 kVA
Frequency60 Hz
Number of poles6
Synchronous speed1200 rpm
Motor-generator inertia constant (3 × 813 kVA base)0.4208 s

Appendix B

Parameters of the diesel generator governor [31]: T1 = 0.024 s, T2 = 0.1 s, T3 = 0.01 s, Tmax = 1.1 p.u., Tmin = 0 p.u., KP = 2.294, KI = 1.458.

Appendix C

Table A2. Parameters of the MADE A-59 wind turbine model [26].
ParameterSymbolValue and Units
Rated power (base power)PAG,base800 kW
Maximum/minimum generator powerPg,max/Pg,min1 pu/0.04 p.u.
Maximum/minimum electromagnetic torqueTem.max/Tem.min0.91 pu/0.08 p.u.
Wind speed at Pg = 0.8712 p.u.v10 m/s
Air densityρ1.225 kg/m3
Turbine effective radiusR29.5 m
Maximum pitch angle rate(dβ/dt) max10°/s
Turbine-generator inertia constantHAG4.18 s
Generator and converter time constant:τC20 ms
Blade pitch servo time constantτP0.3 s
Pitch controller gainsKPpc/KIpc150/25
Speed controller gainsKPsc/KIsc3/80

Appendix D

Parameters of the inertia emulation scheme and the BESS model [35]: P = 660 kW, K1 = 0.01, K2 = 0.04, R = 5%, TBESS = 0.1 s.

References

  1. Liu, C.; Cai, G. Power-oscillation evaluation in power systems with high penetration of renewable power generation based on network virtual inertia. IET Renew. Power Gener. 2019, 13, 138–145. [Google Scholar] [CrossRef]
  2. IEA International Energy Agency Renewable Power Report. Available online: https://www.iea.org/reports/renewable-power (accessed on 13 January 2021).
  3. Fernández-Guillamón, A.; Martínez-Lucas, G.; Molina-García, Á.; Sarasua, J.I. Hybrid Wind-PV frequency control strategy under variable weather conditions in isolated power systems. Sustainability 2020, 12, 7750. [Google Scholar] [CrossRef]
  4. Kundur, P. Power System Stability and Control, 2nd ed.; EPRI, Ed.; McGraw-Hill: New York, NY, USA, 1994; ISBN 0-07-035958-X. [Google Scholar]
  5. Blackstone, B.; Hicks, C.; Gonzalez, O.; Baghzouz, Y. Improved islanded operation of a diesel generator—PV microgrid with advanced inverter. IEEE Int. Symp. Ind. Electron. 2017, 4026, 123–127. [Google Scholar] [CrossRef]
  6. Nastasi, B.; Mazzoni, S.; Groppi, D.; Romagnoli, A.; Astiaso Garcia, D. Solar power-to-gas application to an island energy system. Renew. Energy 2021, 164, 1005–1016. [Google Scholar] [CrossRef]
  7. Martínez-Lucas, G.; Sarasúa, J.I.; Pérez-Díaz, J.I.; Martínez, S.; Ochoa, D. Analysis of the implementation of the primary and/or inertial frequency control in variable speed wind turbines in an isolated power system with high renewable penetration. Case study: El hierro power system. Electronics 2020, 9, 901. [Google Scholar] [CrossRef]
  8. Tamrakar, U.; Shrestha, D.; Maharjan, M.; Bhattarai, B.; Hansen, T.; Tonkoski, R. Virtual Inertia: Current Trends and Future Directions. Appl. Sci. 2017, 7, 654. [Google Scholar] [CrossRef]
  9. Dawei, Z.; Minhui, Q.; Ma, J.; Dajun, J.; Maosheng, D.; Xiang, L. A Decentralized frequency regulation strategy of PV Power Plant based on droop control. China Int. Conf. Electr. Distrib. 2018, 1824–1828. [Google Scholar] [CrossRef]
  10. Yang, M.; Wang, C.; Hu, Y.; Liu, Z.; Yan, C.; He, S. Load Frequency Control of Photovoltaic Generation-Integrated Multi-Area Interconnected Power Systems Based on Double Equivalent-Input-Disturbance Controllers. Energies 2020, 13, 6103. [Google Scholar] [CrossRef]
  11. Wang, X.; Xie, Z.; Chang, Y. Control of PMSG-Based Wind Turbine with Virtual Inertia. In Proceedings of the 2019 14th IEEE Conference on Industrial Electronics and Applications (ICIEA), Xi’an, China, 19–21 June 2019; pp. 1302–1306. [Google Scholar] [CrossRef]
  12. Ochoa, D.; Martinez, S. Frequency dependent strategy for mitigating wind power fluctuations of a doubly-fed induction generator wind turbine based on virtual inertia control and blade pitch angle regulation. Renew. Energy 2018, 128, 108–124. [Google Scholar] [CrossRef]
  13. Kumar, A.V.P.; Parimi, A.M.; Rao, K.U. A comparative analysis of Load Frequency Control Strategy of a Voltage Source Inverter for a stand-alone PV-Wind hybrid system. In Proceedings of the 2016 IEEE 6th International Conference on Power Systems (ICPS), New Delhi, India, 4–6 March 2016. [Google Scholar] [CrossRef]
  14. Alhejaj, S.M.; Gonzalez-Longatt, F.M. Impact of inertia emulation control of grid-scale BESS on power system frequency response. In Proceedings of the 2016 International Conference for Students on Applied Engineering (ICSAE), Newcastle upon Tyne, UK, 20–21 October 2016. [Google Scholar] [CrossRef] [Green Version]
  15. Zecchino, A.; Yuan, Z.; Sossan, F.; Cherkaoui, R.; Paolone, M. Optimal provision of concurrent primary frequency and local voltage control from a BESS considering variable capability curves: Modelling and experimental assessment. Electr. Power Syst. Res. 2021, 190, 106643. [Google Scholar] [CrossRef]
  16. Fernández-Guillamón, A.; Gómez-Lázaro, E.; Muljadi, E.; Molina-García, Á. Power systems with high renewable energy sources: A review of inertia and frequency control strategies over time. Renew. Sustain. Energy Rev. 2019, 115, 109369. [Google Scholar] [CrossRef] [Green Version]
  17. Yap, K.Y.; Sarimuthu, C.R.; Lim, J.M.Y. Virtual inertia-based inverters for mitigating frequency instability in grid-connected renewable energy system: A Review. Appl. Sci. 2019, 9, 5300. [Google Scholar] [CrossRef] [Green Version]
  18. Pourbeik, P.; Petter, J.K. Modeling and validation of battery energy storage systems using simple generic models for power system stability studies. Cigre Sci. Eng. 2017, 9, 63–72. [Google Scholar]
  19. Mongird, K.; Viswanathan, V.; Balducci, P.; Alam, J.; Fotedar, V.; Koritarov, V.; Hadjerioua, B. Energy Storage Technology and Cost Characterization Report. Dep. Energy 2019. [Google Scholar] [CrossRef]
  20. Efthymiou, V.; Yianni, C.; Georghiou, G. Economic viability of battery energy storage for the provision of frequency regulation service. J. Power Technol. 2018, 98, 403. [Google Scholar]
  21. Ochoa, D.; Martinez, S. Fast-Frequency Response Provided by DFIG-Wind Turbines and its Impact on the Grid. IEEE Trans. Power Syst. 2017, 32, 4002–4011. [Google Scholar] [CrossRef]
  22. Jin, X.; Xie, Z.; Zhang, X.; Niu, L.; Gao, X. A Control Strategy for DFIG-Based Wind Turbines Based on the Fulfilment of Virtual Inertia. In Proceedings of the 2018 IEEE International Power Electronics and Application Conference and Exposition (PEAC), Shenzhen, China, 4–7 November 2018; pp. 1–5. [Google Scholar] [CrossRef]
  23. Krishan, O.; Sathans. Frequency regulation in a standalone wind-diesel hybrid power system using pitch-angle controller. In Proceedings of the 2016 3rd International Conference on Computing for Sustainable Global Development (INDIACom), New Delhi, India, 16–18 March 2016; Volume 2016, pp. 1148–1152.
  24. Siniscalchi-Minna, S.; Bianchi, F.D.; De-Prada-Gil, M.; Ocampo-Martinez, C. A wind farm control strategy for power reserve maximization. Renew. Energy 2019, 131, 37–44. [Google Scholar] [CrossRef]
  25. Aziz, A.; Oo, A.T.; Stojcevski, A. Analysis of frequency sensitive wind plant penetration effect on load frequency control of hybrid power system. Int. J. Electr. Power Energy Syst. 2018, 99, 603–617. [Google Scholar] [CrossRef]
  26. Ochoa, D.; Martinez, S. Proposals for enhancing frequency control in weak and isolated power systems: Application to the wind-diesel power system of San Cristobal Island-Ecuador. Energies 2018, 11, 910. [Google Scholar] [CrossRef] [Green Version]
  27. Guizzo, E. Wind power in paradise. IEEE Spectr. 2008, 45, 38–45. [Google Scholar] [CrossRef]
  28. Benalcazar, P.; Suski, A.; Nski, J.K. Optimal Sizing and Scheduling of Hybrid Energy Systems: The Cases of Morona Santiago and the Galapagos Islands. Energies 2020, 13, 3933. [Google Scholar] [CrossRef]
  29. CONELEC Despacho y Operacion, Regulacion 006/00. Available online: https://www.regulacionelectrica.gob.ec/wp-content/uploads/downloads/2015/10/ProcedimientosDespacho.pdf (accessed on 16 July 2020).
  30. Ochoa, D.; Martinez, S. Frequency control issues in power systems: The effect of high share of wind energy. IEEE Lat. Am. Trans. 2018, 16, 1934–1944. [Google Scholar] [CrossRef]
  31. Willis, J.R. Modeling of emergency diesel generators in an 800 megawatt nuclear power plant. IEEE Trans. Energy Convers. 1993, 8, 433–441. [Google Scholar] [CrossRef]
  32. Mexis, I.; Todeschini, G. Battery energy storage systems in the United Kingdom: A review of current state-of-the-art and future applications. Energies 2020, 13, 3616. [Google Scholar] [CrossRef]
  33. Arsoy, A.; Liu, Y.; Johnson, B.K.; Ribeiro, P.F.; Crow, M.L. Energy storage systems for advanced power applications. Proc. IEEE 2002, 89, 1744–1756. [Google Scholar] [CrossRef]
  34. Kim, Y.J. Experimental study of battery energy storage systems participating in grid frequency regulation. Proc. IEEE Power Eng. Soc. Transm. Distrib. Conf. 2016, 2016, 1–5. [Google Scholar] [CrossRef]
  35. Toma, L.; Sanduleac, M.; Baltac, S.A.; Arrigo, F.; Mazza, A.; Bompard, E.; Musa, A.; Monti, A. On the virtual inertia provision by BESS in low inertia power systems. In Proceedings of the 2018 IEEE International Energy Conference (ENERGYCON), Limassol, Cyprus, 3–7 June 2018. [Google Scholar] [CrossRef] [Green Version]
Figure 1. Single-line diagram of the San Cristobal hybrid wind-diesel power system.
Energies 14 00698 g001
Figure 2. Load frequency control scheme of the test system.
Energies 14 00698 g002
Figure 3. Schematic representation of the thermal generation under study.
Energies 14 00698 g003
Figure 4. Speed governor model of the thermal generation used in the study.
Energies 14 00698 g004
Figure 5. General scheme of the variable speed wind turbine.
Energies 14 00698 g005
Figure 6. Maximum power point tracking curve for the wind turbine model MADE AE-59.
Energies 14 00698 g006
Figure 7. Maximum power point tracking (MPPT)-curve shifting process.
Energies 14 00698 g007
Figure 8. Scheme of the virtual inertia algorithm implemented in the variable speed wind turbine.
Energies 14 00698 g008
Figure 9. Basic components of the battery energy storage system (BESS).
Energies 14 00698 g009
Figure 10. Simplified model of virtual inertia controller implemented in the BESS.
Energies 14 00698 g010
Figure 11. Grid-frequency response to a sub-frequency event.
Energies 14 00698 g011
Figure 12. Rate of change of frequency during a sub-frequency event.
Energies 14 00698 g012
Figure 13. Active power delivered by the three wind turbines when a sub-frequency event occurs.
Energies 14 00698 g013
Figure 14. Active power deviation experienced by the BESS in a sub-frequency event.
Energies 14 00698 g014
Figure 15. Power generated by the thermal power plant.
Energies 14 00698 g015
Figure 16. Real wind speed profile used in the simulation.
Energies 14 00698 g016
Figure 17. Frequency behavior during a sub-frequency contingence under actual wind speed conditions.
Energies 14 00698 g017
Figure 18. Dynamics of RoCoF during a sub-frequency contingence under actual wind speed conditions.
Energies 14 00698 g018
Figure 19. Active power delivered by the three wind turbines under variable wind speed conditions.
Energies 14 00698 g019
Figure 20. Active power injected by the BESS in the variable wind speed scenario.
Energies 14 00698 g020
Figure 21. Power generated by the thermal power plant under variable wind speed conditions.
Energies 14 00698 g021
Table 1. Admissible frequency ranges in generator operation.
Range (Hz)Relay Operate Time
57.5–62Instantaneous
57.5–58 or 61.5–62<10 s
58–59 or 61–61.5<20 s
59–61Unlimited
Table 2. Reduction (%) of the frequency deviation compared to the base case.
Case123
Overfrequency39.8839.2955.36
Subfrequency44.8940.9157.39
Table 3. Reduction (%) of the maximum rate of change of frequency (RoCoF) compared to the base case.
Case123
Overfrequency22.9227.0847.92
Subfrequency22.9227.0847.92
Publisher’s Note: MDPI stays neutral with regard to jurisdictional claims in published maps and institutional affiliations.

