Review

Sediment and Cavitation Erosion in Francis Turbines—Review of Latest Experimental and Numerical Techniques

1
Department of Mechanical Engineering, FET. International Islamic University, Islamabad 44000, Pakistan
2
School of Mechanical Engineering & IEDT, Kyungpook National University, Daegu 41566, Korea
*
Author to whom correspondence should be addressed.
Energies 2021, 14(6), 1516; https://doi.org/10.3390/en14061516
Submission received: 14 January 2021 / Revised: 4 March 2021 / Accepted: 4 March 2021 / Published: 10 March 2021

Abstract

:
Sediment and cavitation erosion of the hydroelectric power turbine components are the fundamental problems in the rivers of Himalayas and Andes. In the present work, the latest research conducted in both the fields by various investigators and researchers are discussed and critically analyzed at different turbine components. Analysis shows that both types of erosion depends on flow characteristics, surface, and erodent material properties. Design optimization tools, coalesced effect (CE) of sediment and cavitation erosion and well conducted experiments will yield results that are beneficial for erosion identification and reduction. Although some researchers have done experimental work on the coalesced effect (CE) of sediment and cavitation erosion, very limited Computational Fluid Dynamics (CFD) work is available in literature. The present research work will be beneficial for practitioners and researchers in the future to address the erosion problem successfully.

1. Introduction

Hydroelectric power generation is one of the most important kinds of renewable energy which contributes 70% of the total energy production, but at the same time it requires substantial initial investment, rigorous management, and maintenance. Today’s inventory of non-sustainable reservoirs need to be converted to sustainable infrastructures for future generations. Sedimentation is a global problem which is found to exist in the rivers of Himalayan region, China in Asia, and the Andes in South America [1]. It is estimated that on average, 20 × 109 tons of sediment reach oceans in a year. Every year, reservoir sedimentation causes an estimated 1% reduction [2] in the total capacity of the reservoirs. Figure 1 shows the aerial view of a large dam located in Itaipu, Brazil.
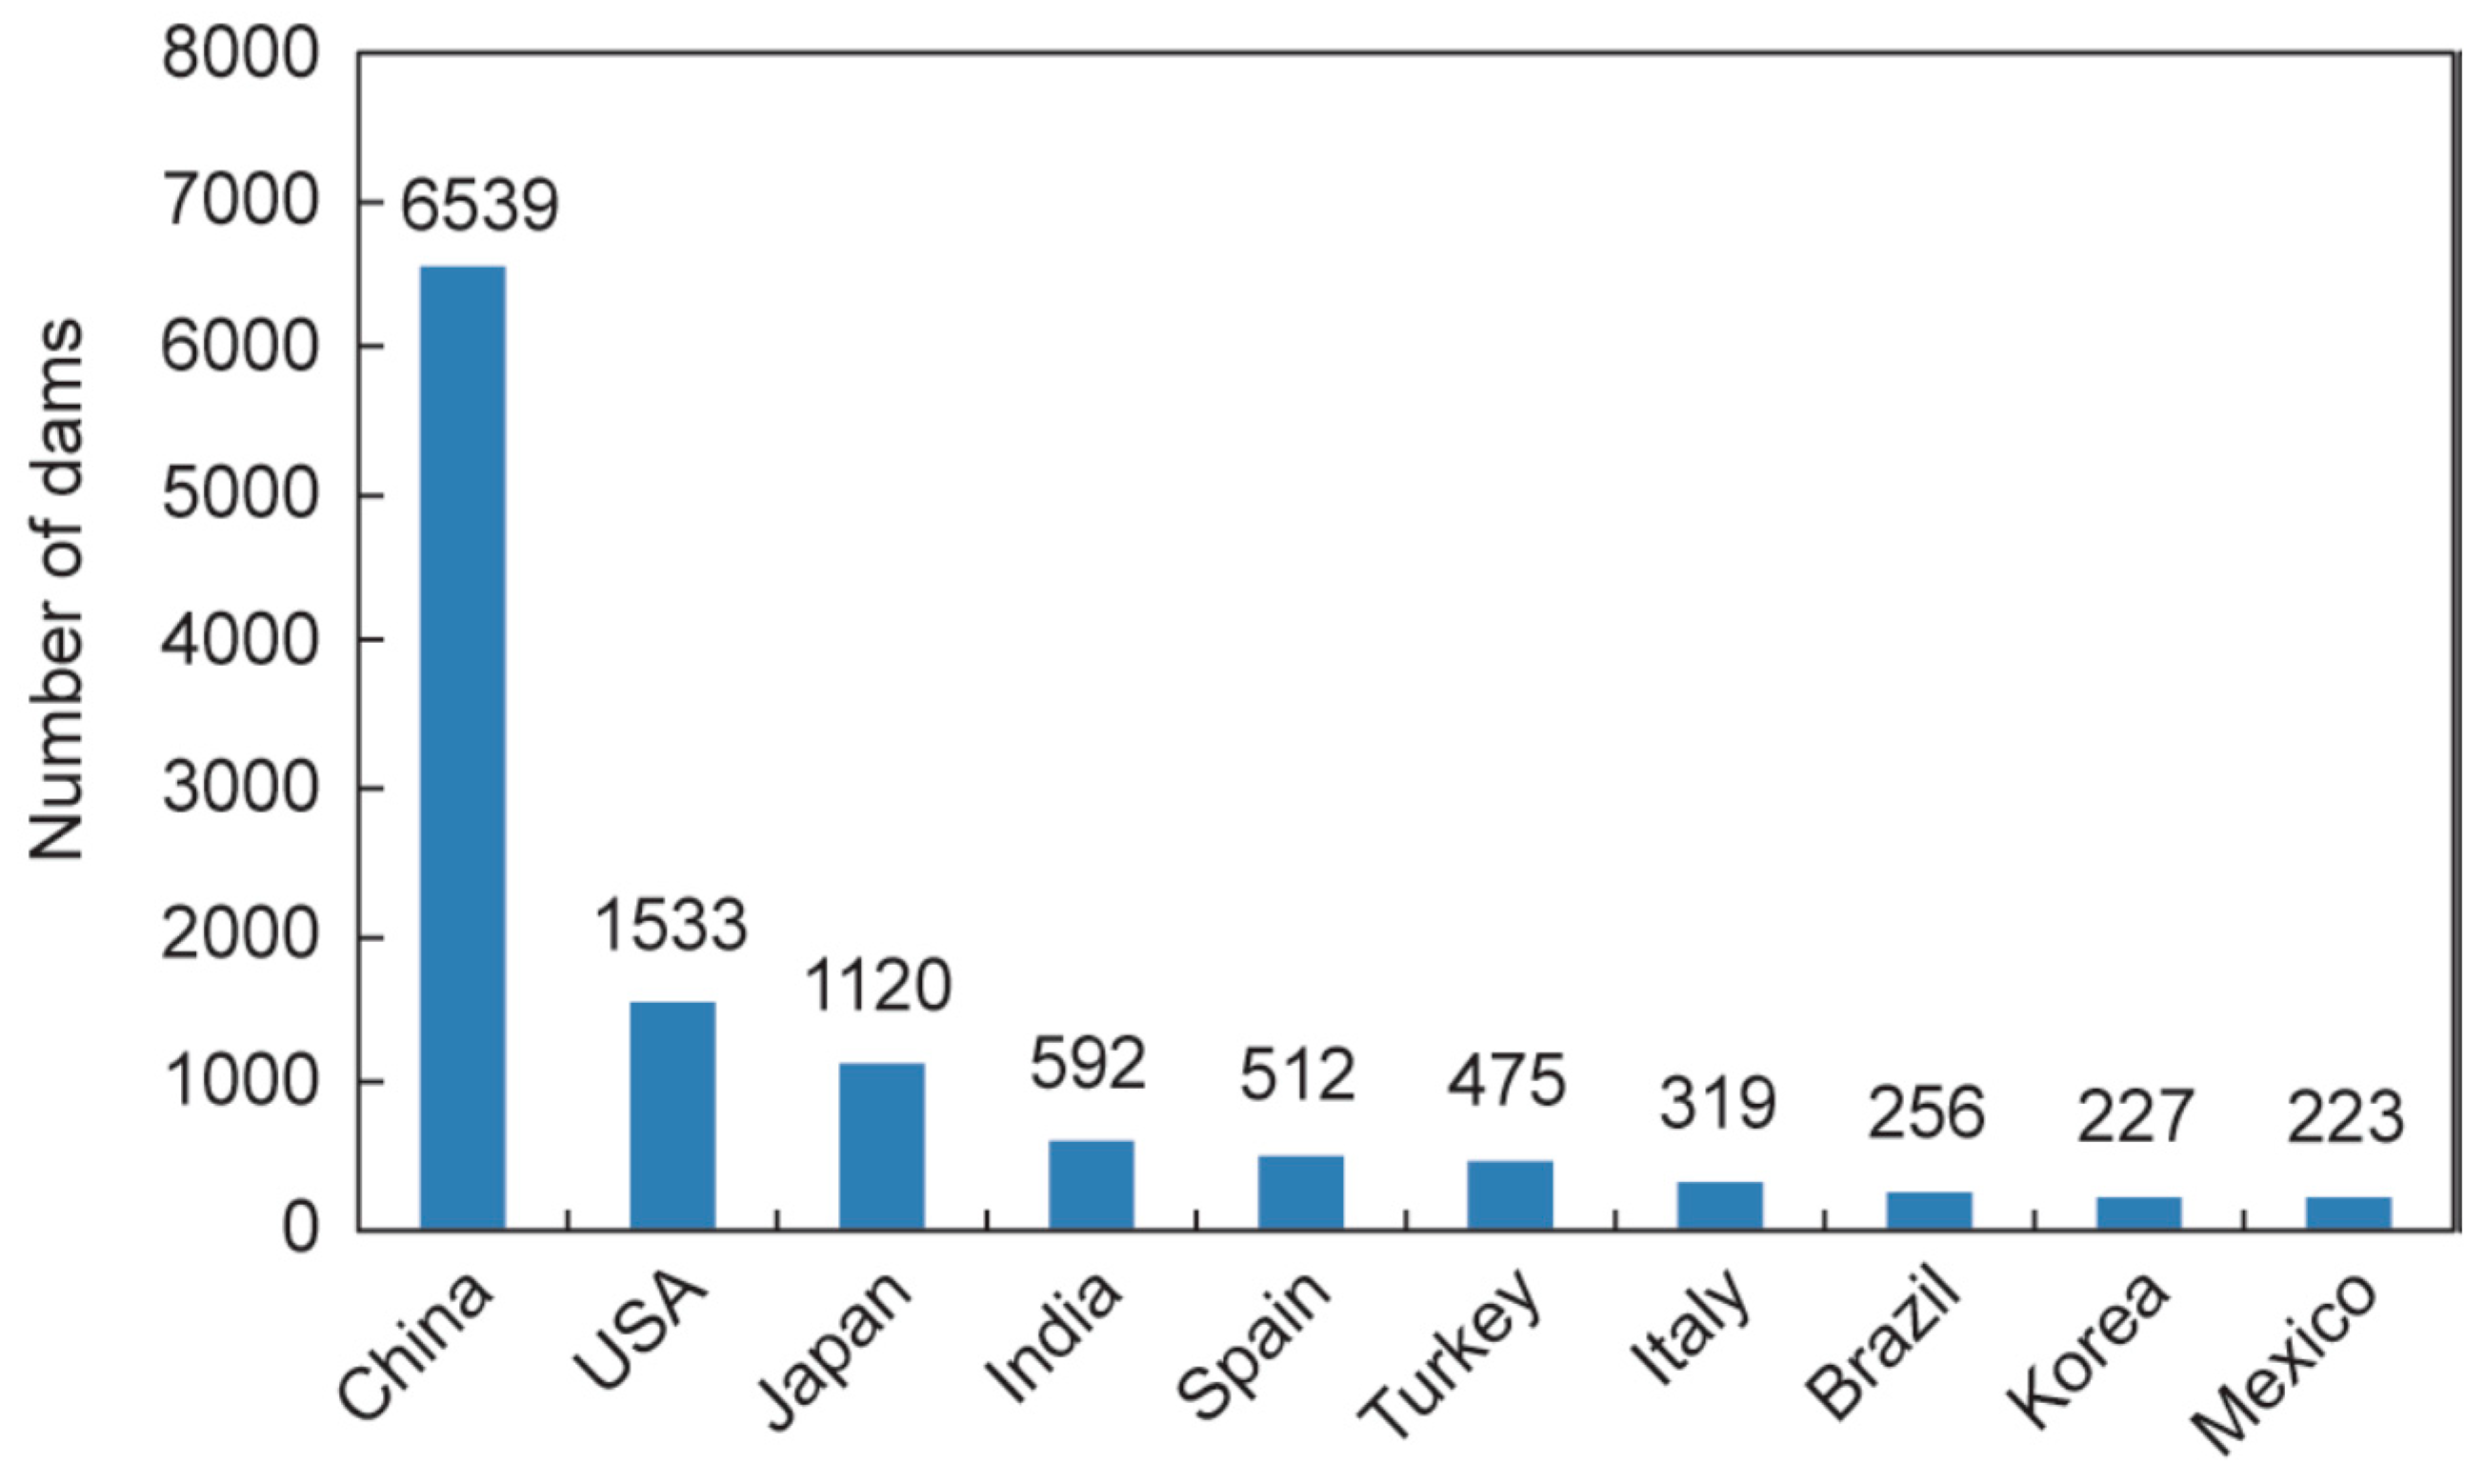
China, by constructing 6539 dams over 30 m height, has the highest hydro potential in the world and accounts for 43% of all dams worldwide. With installed hydropower capacity of 300 GW [3], accounting for 27% of such hydropower capacity worldwide, the length of water delivery canals has exceeded 13,800 km, and hydraulic tunnels are over 10,000 km in length. Figure 2 shows the comparison regarding number of dams between China and other countries of the world. Meanwhile, China is facing problems regarding sedimentation; its Three Gorges Dam (TGD) has encountered serious problems after its completion. The sediment erosion level has reached 21 × 104 m3/km2 a year [3]. The flushing of gravel and rocks carried through Sichuan in the Yangtze could not be removed because of their weight and size, and it is predicted that the reservoir would deposit up and become unusable within the next ten 10 years.
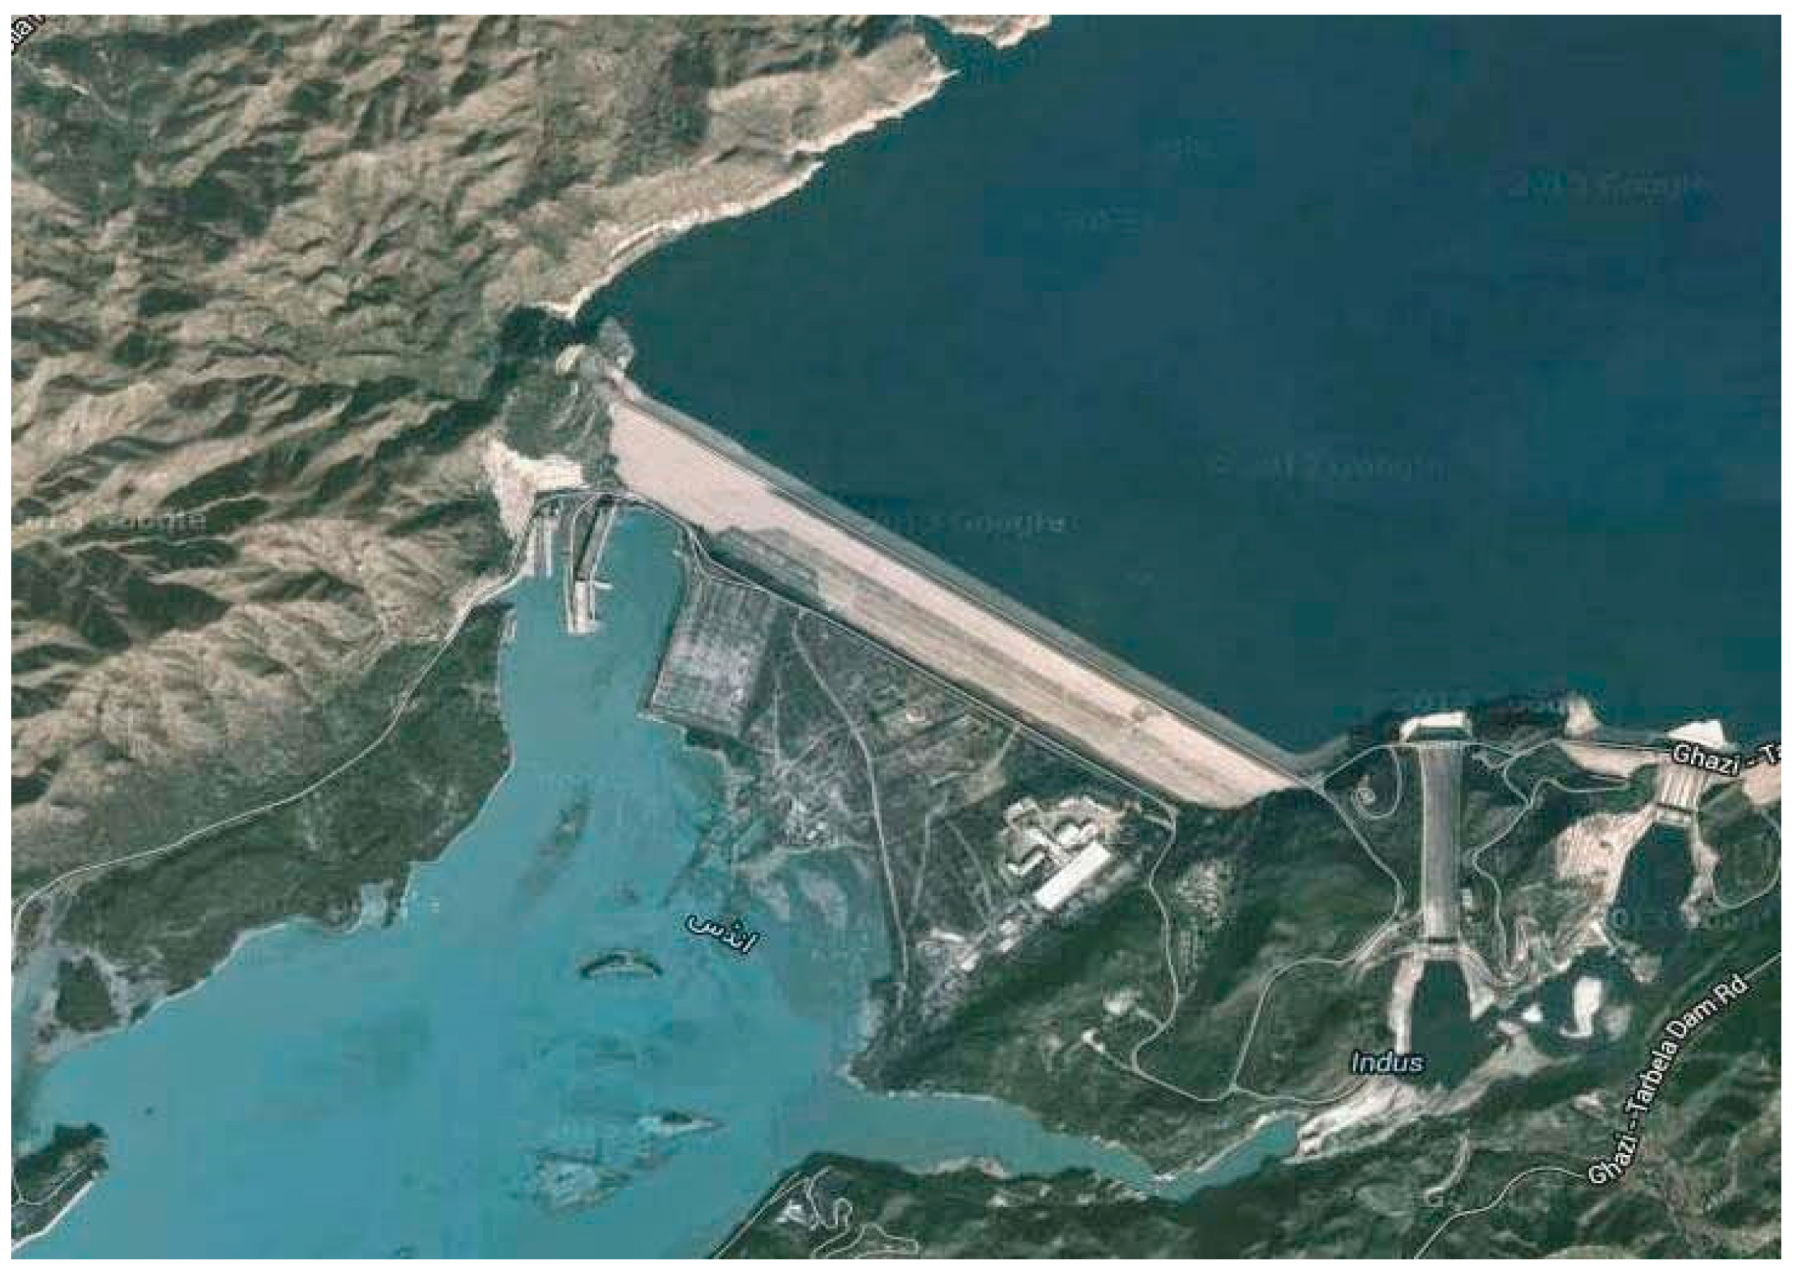
Tarbela dam hydroelectric project (TDHP) is built on river Indus and located north-west of Islamabad, Pakistan, which is the largest rock and earth filled dam in the world. The excessive sedimentation has resulted in about 35% reduction of the reservoir capacity [4] since its impoundment. The sediments contain sand, silt, and clay, which are the source of damage to the unit generating power, tunnels units, and ultimately to all the plant equipment [4]. Figure 3 shows the aerial view of the different features of the dam.
Abid and Siddiqi [4] had conducted numerical study to analyze the flow behavior for TDHP reservoir for the first time in 2010. Multiphase flow (water and air) analysis has been performed for maximum inflow through upland catchment assuming summer season and discharging water through different spillways. They have tried to address the critical problem of sedimentation. The sediments flowing along water have damaged the structure of tunnels and caused erosion at different turbine components, which were then analyzed by another researcher. Abid and Noon [5] investigated the damage occurred at the TDHP tunnels with and without considering the effect of sediment particles during summer, winter, and mid seasons. The results of velocity, erosion rate, and Pressure rate are discussed in detail. Numerically calculated erosion results were validated through the experimental data. It is concluded in their work that sediment particles are damaging the TDHP equipment extensively and suggested few techniques for the reduction in losses. Thapa et al. [6] showed that severe damage is observed at Jhimruk Hydro Plant JHP (3 × 12.6 MW) at edges of turbine near to band of outlet during the first 4000 h of operation. Drop in runner efficiency due to erosion wear at JHC was quantified by two thermodynamic efficiency measurements for a duration of 11 weeks of monsoon season. It was found that during the working period of a single monsoon season, the average loss of efficiency estimated at BEP (maximum efficiency location on efficiency vs. volume flowrate curve) was 4% and 2.5 mm loss was found in mean thickness of runner. A similar study was carried out by Koirala et al. [7] at a hydropower project in Nepal with a capacity of (3 × 48 MW). They analyzed the sediment samples and turbine materials. During 16,500 operational hours, the clearance gap had enlarged to 1.9 mm and 3.6 mm for leading and trailing edges, respectively. It was observed that the higher sediment load, impact velocity, quartz content, the higher the inefficiency of the flushing system, and operation at small guide vane angles are all main contributors to erosive wear in the system. Therefore, it is concluded that sediment erosion decreases the turbine efficiency as well as it damages the turbine structure.
Sediment erosion is a localized issue found in the Himalayan and Andes region but secondary flow phenomenon is a global problem and it causes cavitation erosion in hydraulic machinery. Cavitation is the phenomenon of pitting of metallic surface. It generates instability and highly erratic flow behavior producing excessive noise, vibrations, and drop in efficiency in Francis, Kaplan and other turbines. Both the Kaplan and Francis turbines are the reaction type turbines with Francis inward and Kaplan axial flow turbines. Francis Turbines (FT) are used worldwide due to their relatively compact structure, high efficiency, and working under water head ranging from 100 to 300 m with efficiency from 90% to 95%.
Goyal and Gandhi [8] presented the dynamic problems of FT in the present energy production development. The turbine suffered from various dynamic instabilities during transient and off-design operations. Numerous high-frequency and low pressure variations were observed during both transient and steady state conditions. Tomaz et al. [9] had performed various studies to locate the different features of cavitation phenomena such as pressure pulsation, cavitation bubble collapse, vapor volume fraction, cavitation vibration, noise, and rotating cavitation. Furthermore, it was discussed that cavitation visualization is going to be an important feature of scientific research in model testing. Chitrikar et al. [10] focused on developing a numerical model of the test rig for investigating the behavior of leakage flow and validated their results through experiments. It was observed from both Computational Fluid Dynamics (CFD) and experiment that the leakage flow generates a passage vortex, which drifts away from the wall while moving downstream. A non-dimensional term, “Leakage Flow Factor” (Lff), was used for the clearance gap of several hydrofoils to compare the possible leakage flow, starting from the reference case. It is shown that Lff is reduced by 4.45 times for the NACA-4412 profile and the average value of the circumferential velocity, at the runner inlet only by 1.31%, compared to the base case. The drop in intensity and size of leakage flow and passage vortex shows minimization of the coalesced impact of secondary flow and sediment erosion. Comparison of various studies show that efficiency of FT varies between 3% and 6% based on changes in sediment concentration and secondary flow phenomena. However, around 2 to 3.5 mm loss in thickness of runner is observed. In all of the discussed studies it is found that cavitation phenomena need the latest equipment for its detection and visualization. Moreover, a lot of work is needed to assess the cavitation numerically.
The current study reviews the possible ways of sediment and cavitation erosion detection and reduction for the hydroelectric power turbines in the Himalayan region in particular and the Andes, etc. in general. Both types of erosion depend on flow characteristics, surface, and erodent material properties. The latest CFD techniques have been used by many researchers, which are validated through experiments. The present work presents the comprehensive updates on sediment and cavitation, which causes wear in hydraulic turbines. This aspect has been rarely discussed in much detail in the previous studies. For future work, it is recognized that the design optimization tools, coalesced effect (CE) of sediment, and cavitation erosion and well organized experiments will produce results that will be beneficial for erosion identification and reduction.

2. Experimental and Numerical Investigation for Sediment Erosion

2.1. Introduction

The fundamental reason of erosion wear and energy loss is friction, and it is reported that one-third of the world’s energy resources are currently utilized to overcome friction in several ways. The presence of sediment in water is a common issue in hilly regions and most run-of-river plants. The hydro turbines experience severe problems of sediment erosion during their operation. Erosive wear is caused by the solid particle’s impact with a solid surface. The flow medium contains particles that have enough velocity to deface a metallic surface. Various studies have been conducted by different researchers to minimize the effect of sediment erosion at different locations of FT components. Field studies, experimental measurements, empirical modeling, CFD work, etc. are performed for this purpose. Various empirical models have been utilized to describe the erosion wear in terms of material and fluid properties. Rao and Buckley [11] presented a long term impingement erosion problem. They have proposed the modeling methods, which includes the curve fitting approach and a power law relationship. For ductile materials, it is found that the maximum erosion occurs at an impact angle of 30°, whereas for brittle materials, in the range of 80–90°.

2.2. Experimental Approaches

Different experimental techniques are used in the literature for slurry erosion quantification, such as rotating disc apparatus (RDA), slurry pot test, jet erosion test, rotating pipe test, etc. Rajkarnikar et al. [12] used the RDA setup for analyzing erosion wear in Francis runner blades. The blade is scaled down to 1/4 and the material used is aluminum plus 6% Copper and 4% Zinc, and they were fixed in the rotary disc. Due to the micro erosion from the high rotational motion of the sand particles, it was found that the erosion is dominant at the outer region. The experimental setup for this study is shown in Figure 4.
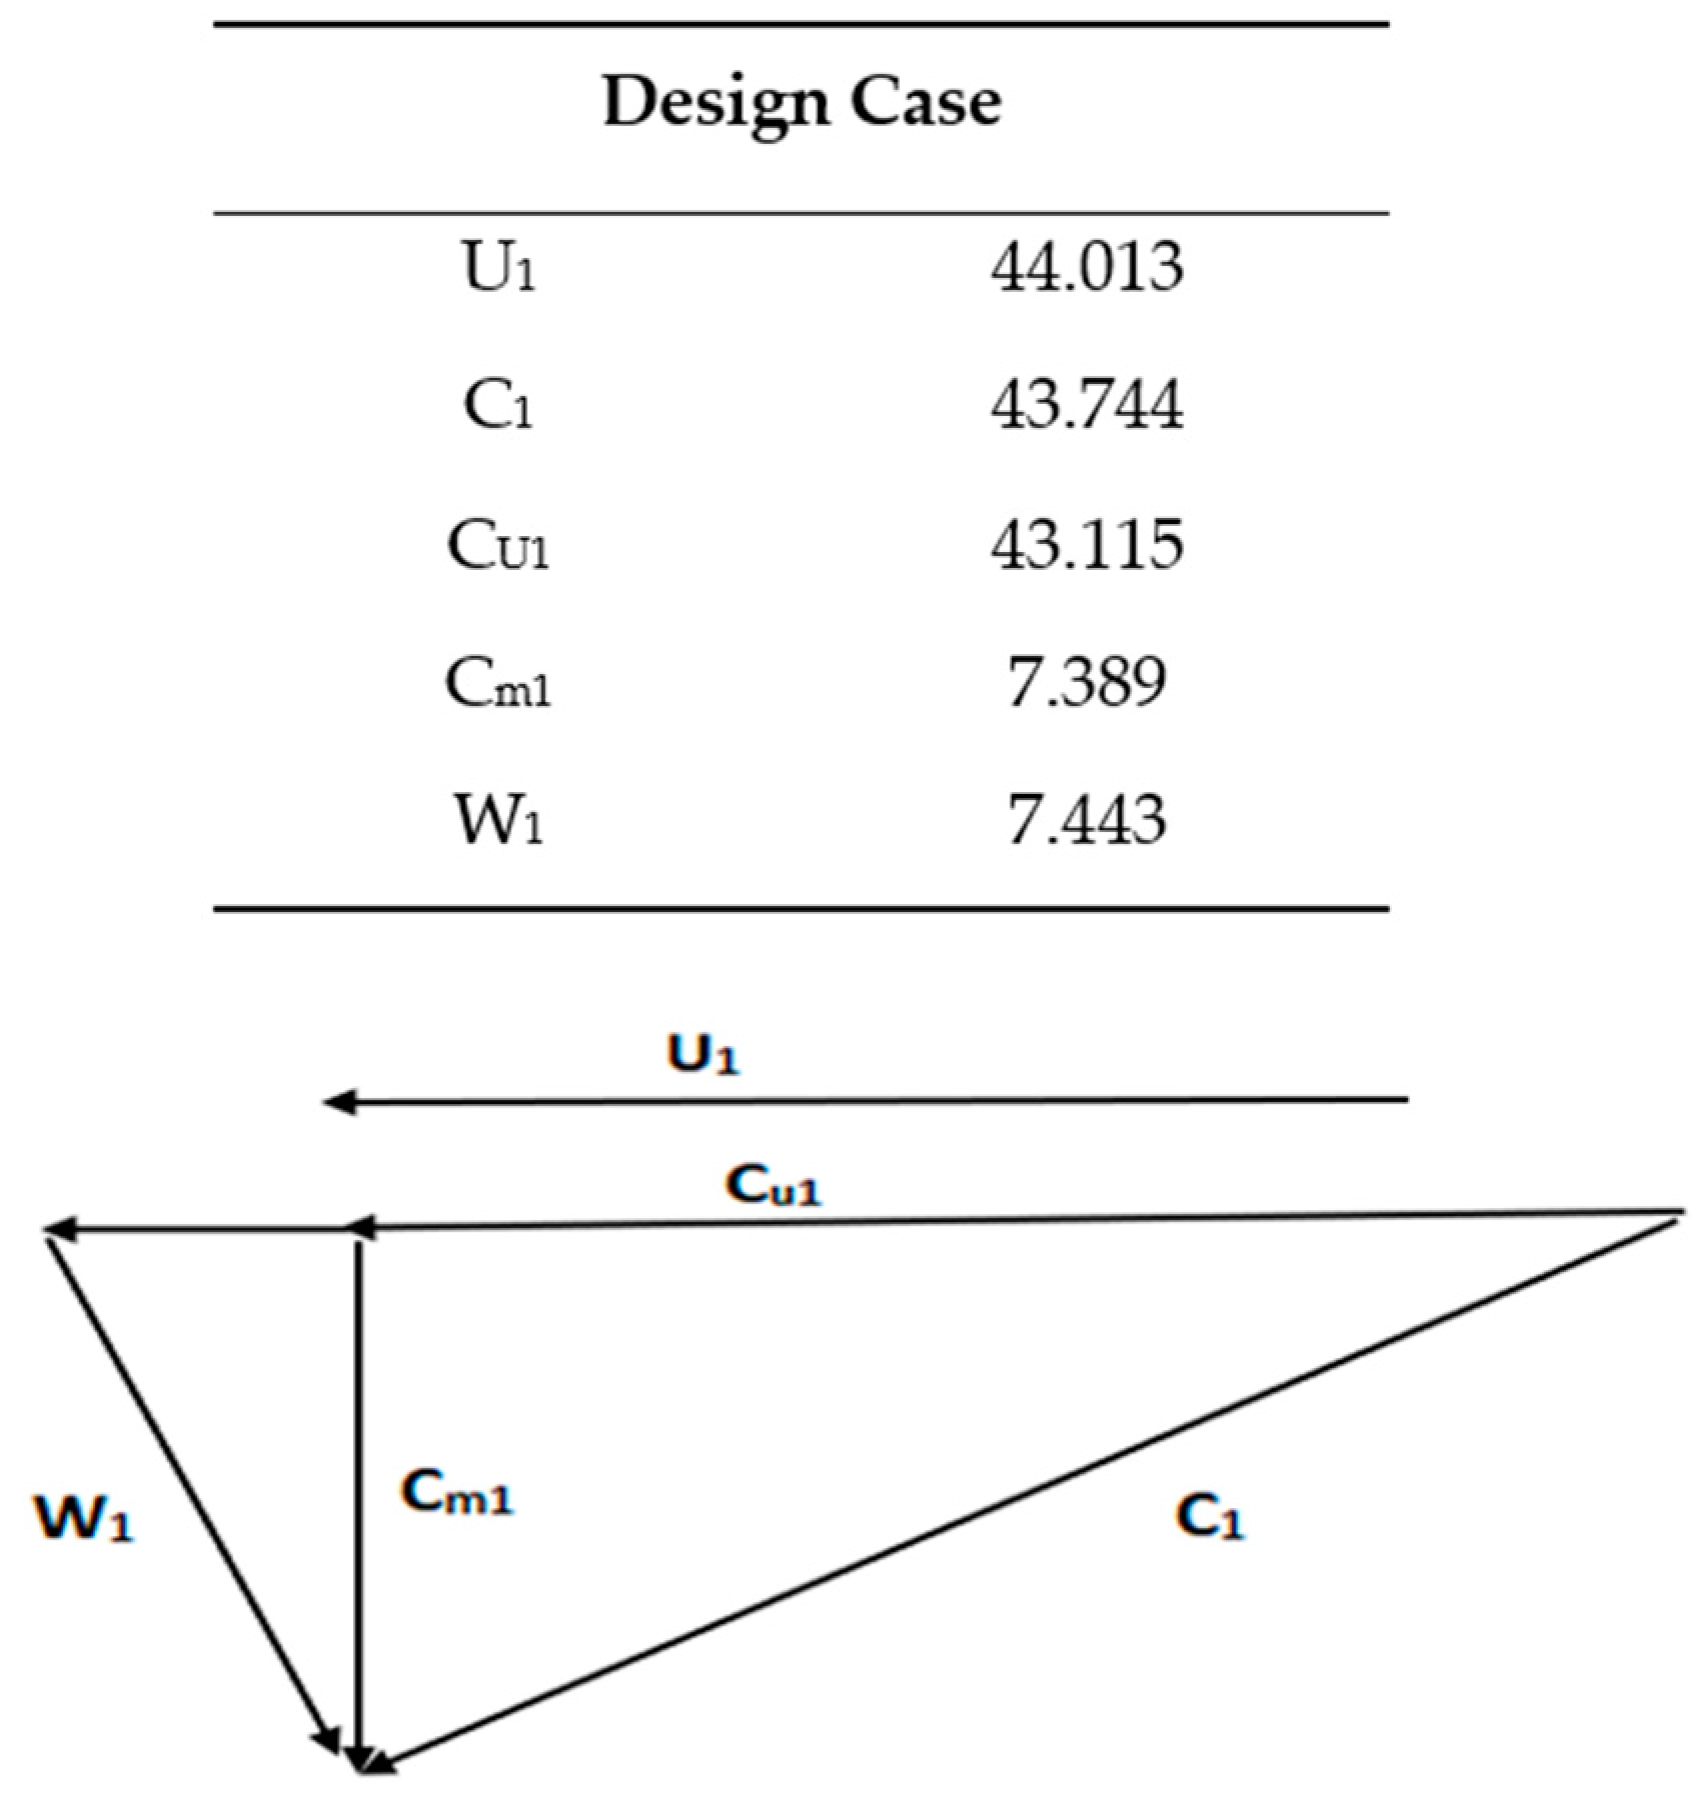
Chitrakar et al. [13] reported that the coalesced nature of the sediment and cavitation erosion enhances vibrations, fatigue, mass losses, and ultimately failure of the turbine. They emphasized that studying the relationship between the two phenomena is essential. The methods for the prediction and minimization of the combined effect are presented. Ghenaietet et al. [14] developed a semi empirical erosion model to assess the mass loss and the geometry degradation. Critical areas of erosion wear are identified Koirala et al. [15] discussed the hydraulic and mechanical effects due to sediment erosion in guide vanes and its presence in FT. The Guide Vane (GV) system in FT, flow phenomenon around it, and possible measures to find erosion under normal conditions are some of the important works done. An experimental study was conducted with a rotating disc apparatus for selecting a suitable profile. Unsymmetrical Guide Vane profiles were found to be effective in handling erosion, thus maintaining consistency in turbine overall performance. The GV inlet velocity triangle used in this study is shown in Figure 5. Javaheri et al. [16] reviewed the literature on some basic parameters causing the slurry erosion of steels, emphasizing on those developed for pipeline applications. They discussed the test rigs of erosion, the involved mechanism, and different microstructure behavior under slurry erosion conditions.

2.3. CFD Work

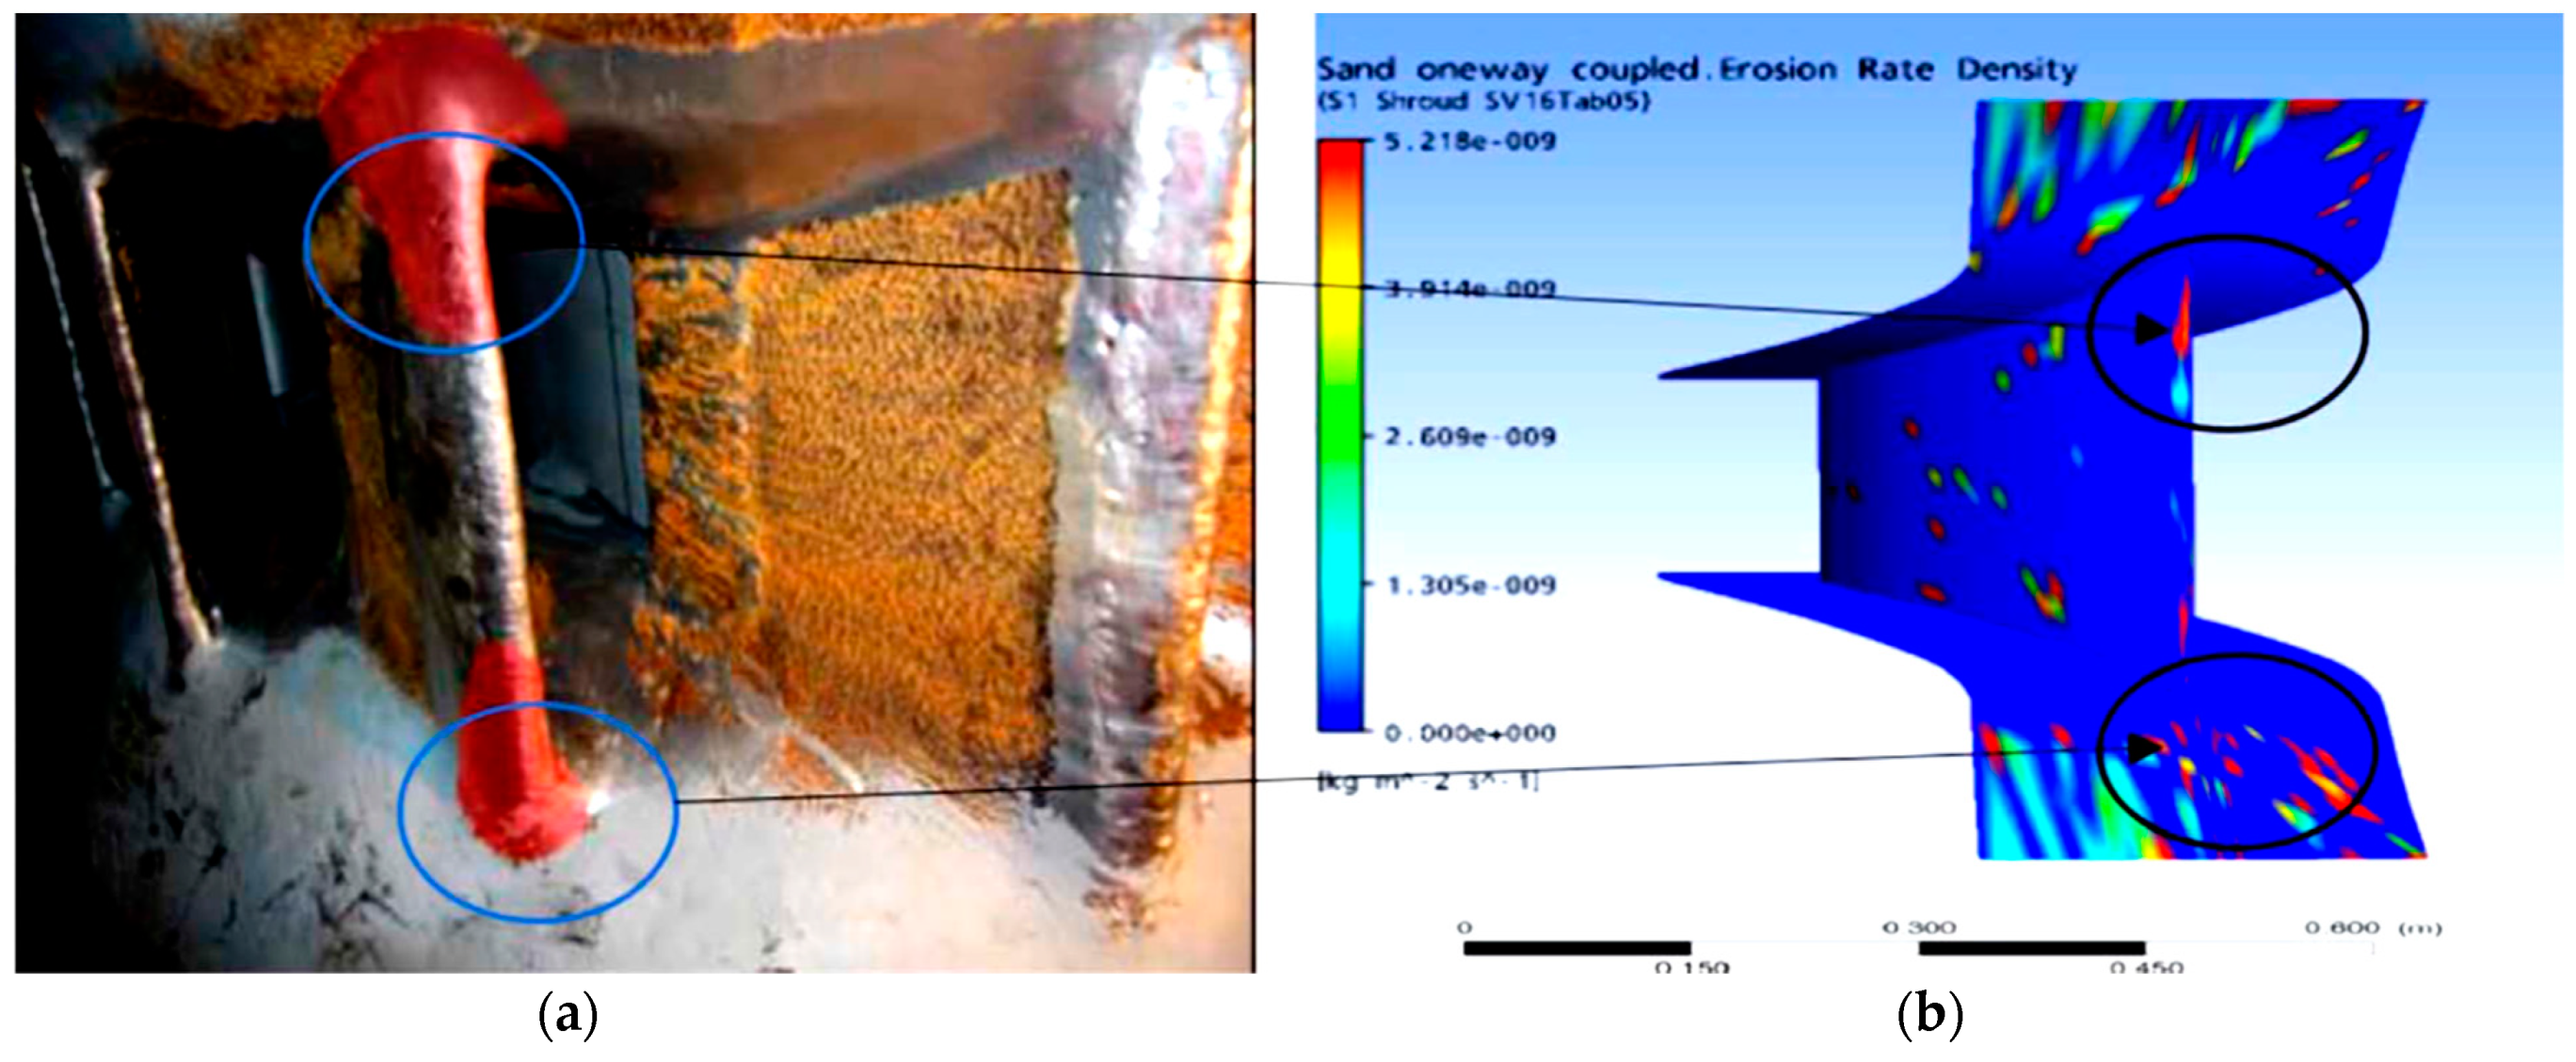
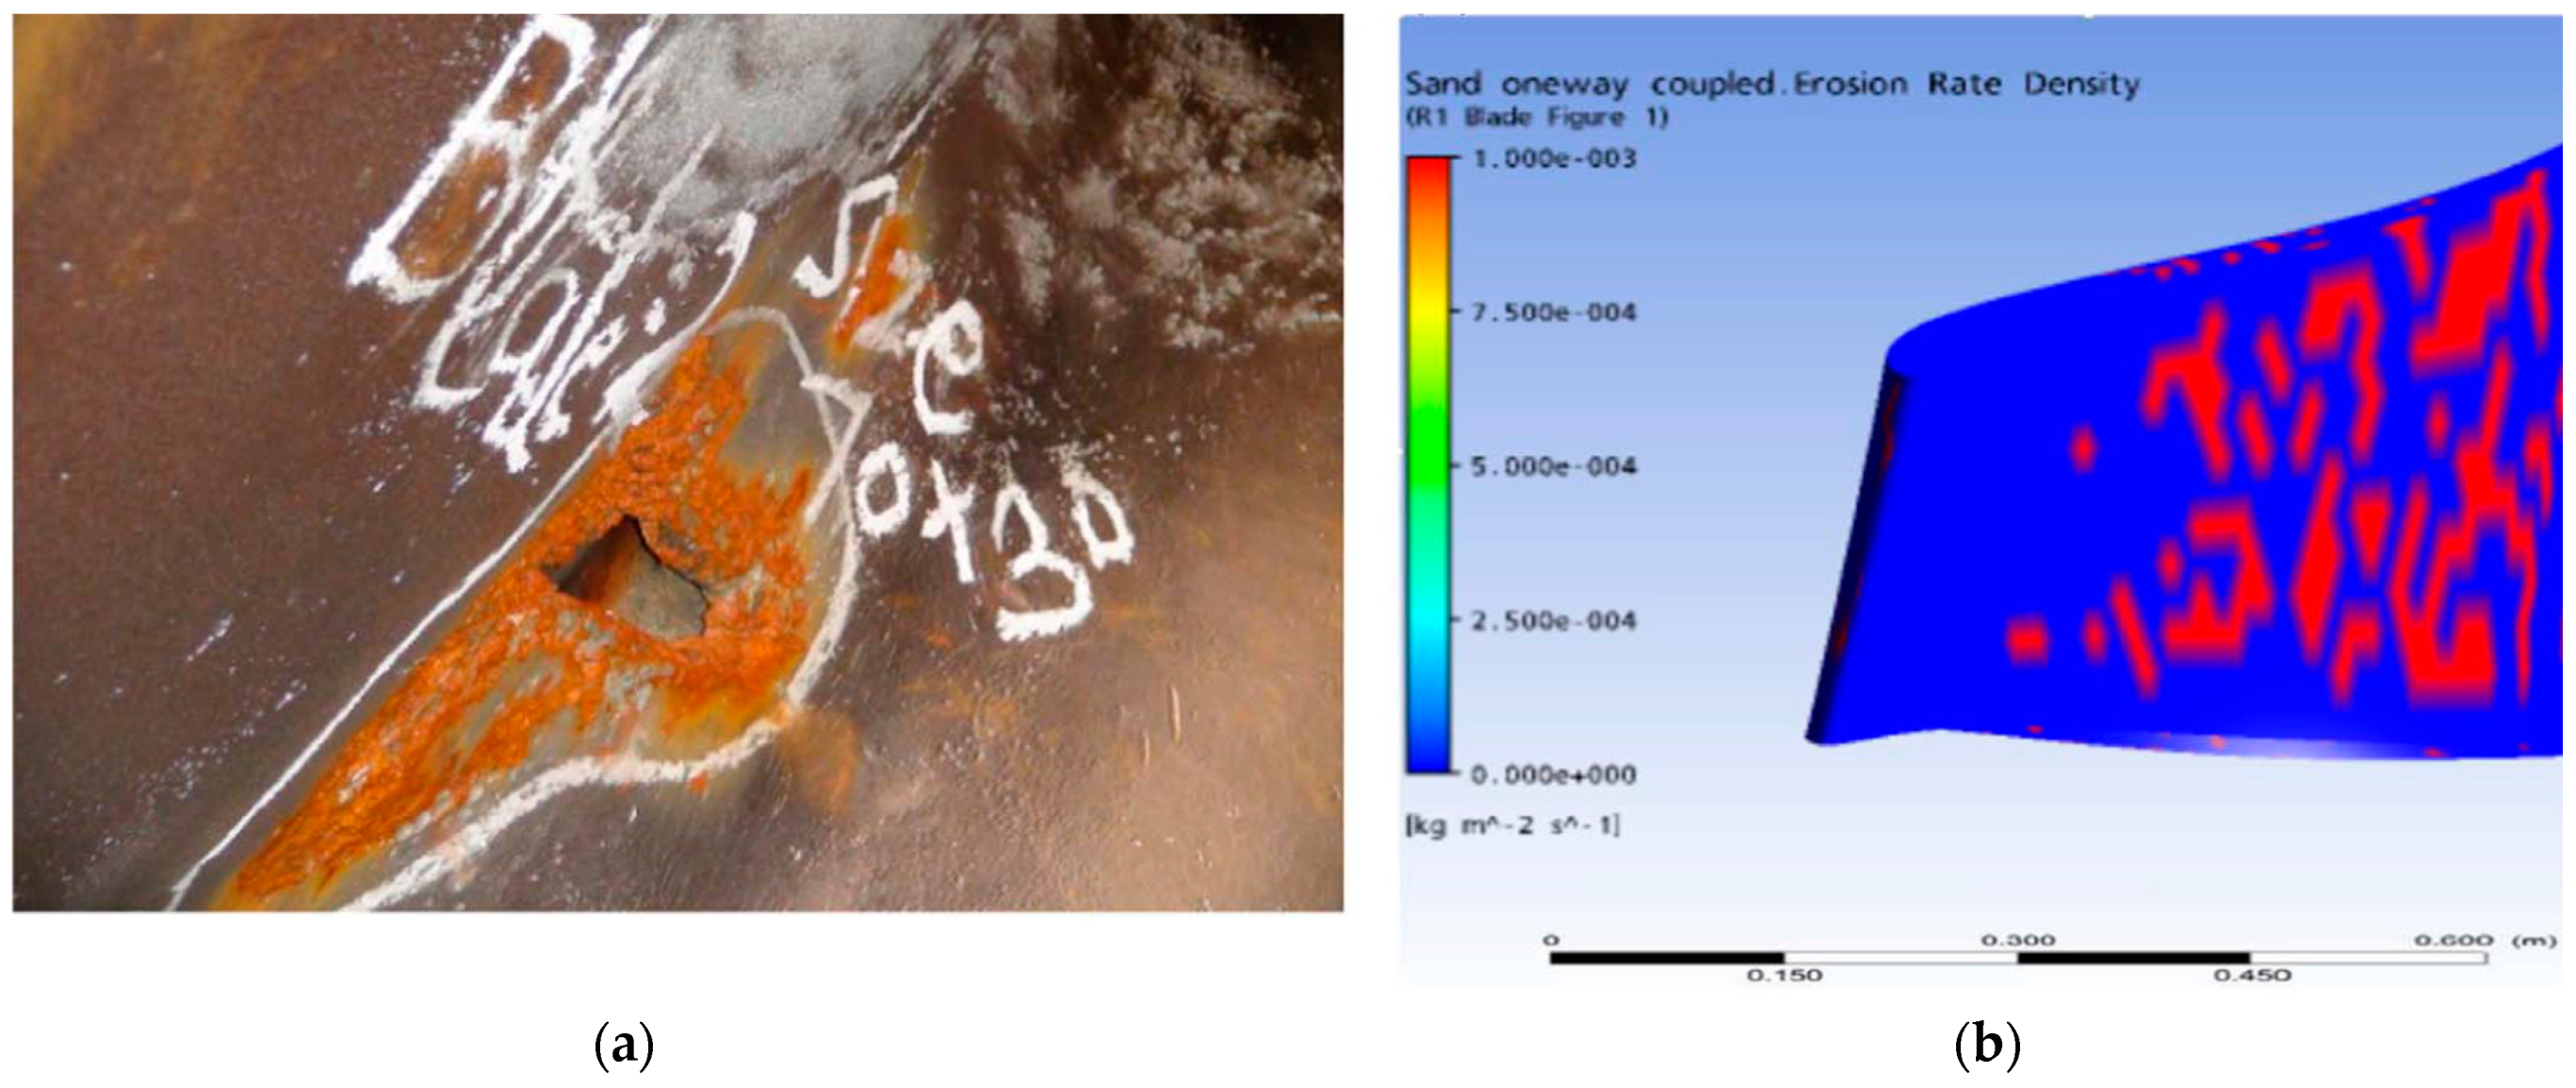
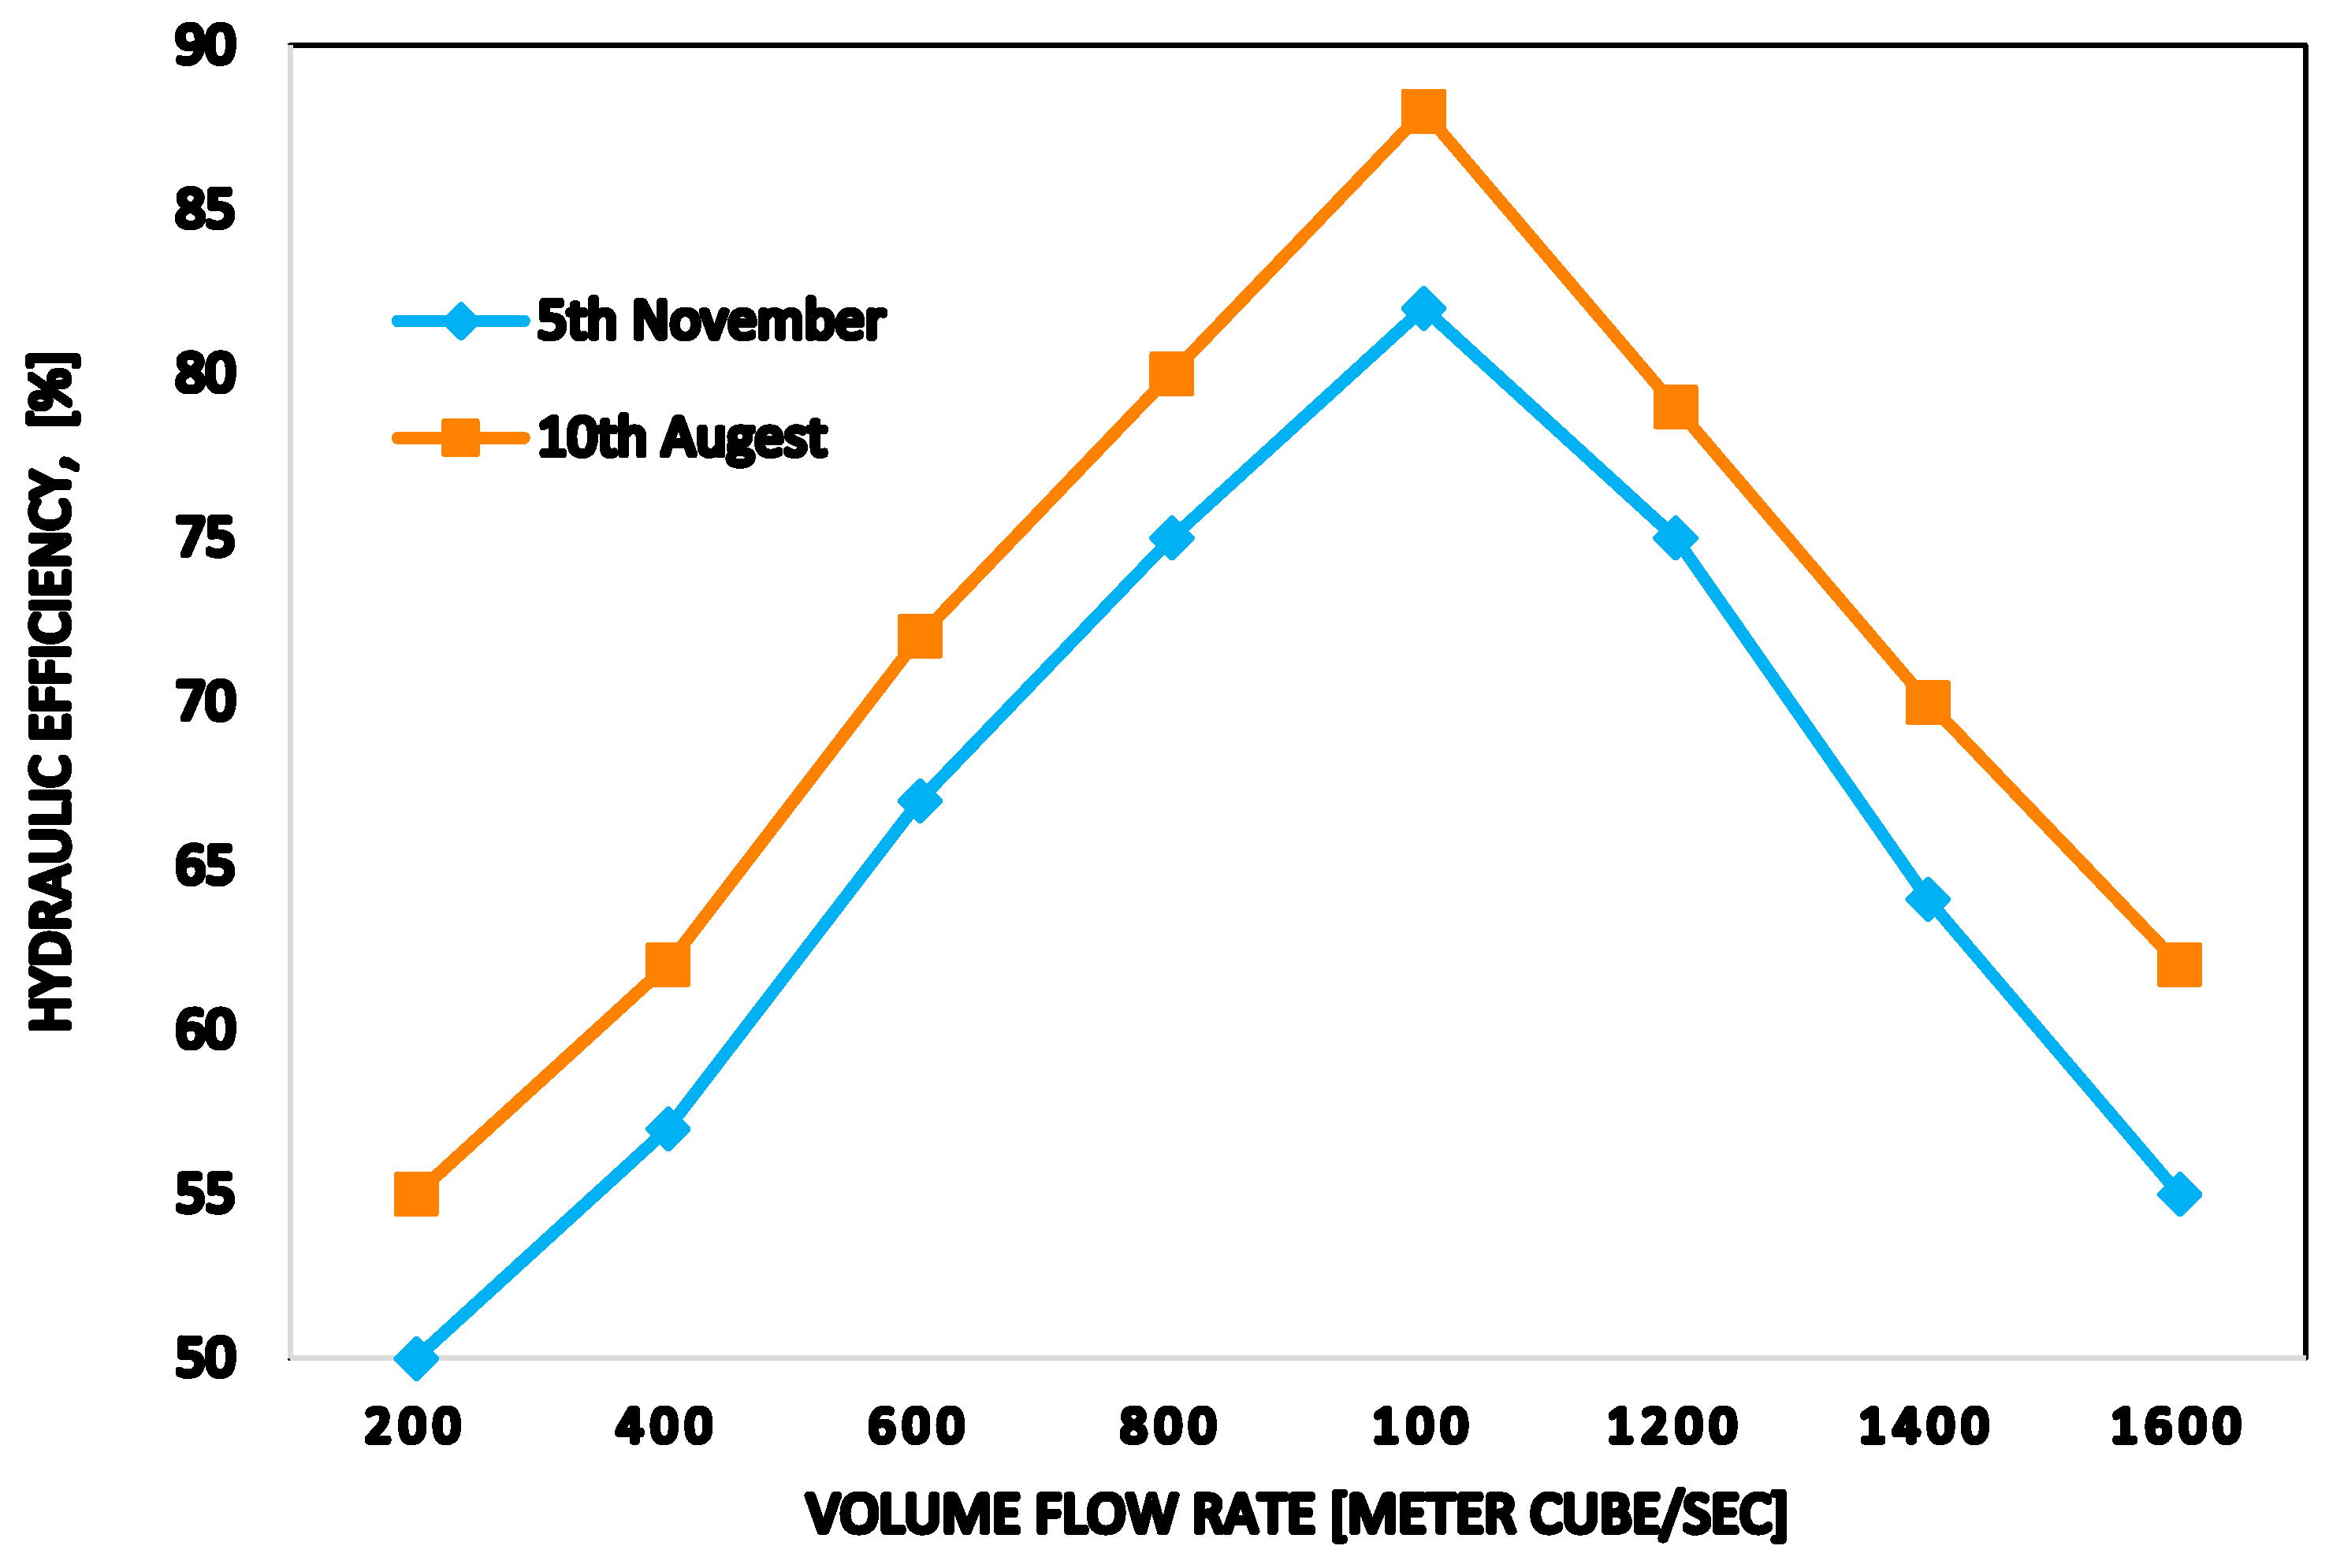
CFD has emerged as a new and useful tool in simulating the sediment flow as the water passes through turbine. Noon and Kim [17] conducted CFD analysis for erosion wear predictions and consequently the efficiency losses for FT components, especially at the runner. Gradual removal of the base material has changed the profile of two components: the guide vanes and the runner blades of the turbine as seen in Figure 6 and Figure 7. As a result of this degradation, the turbine structure becomes weak. Thermodynamic efficiency measurements are carried out on turbine unit number 11. Figure 8 shows the results of the efficiency at TDHP during 12 weeks of monsoon period (rainy season) to quantify the effect of erosion wear.
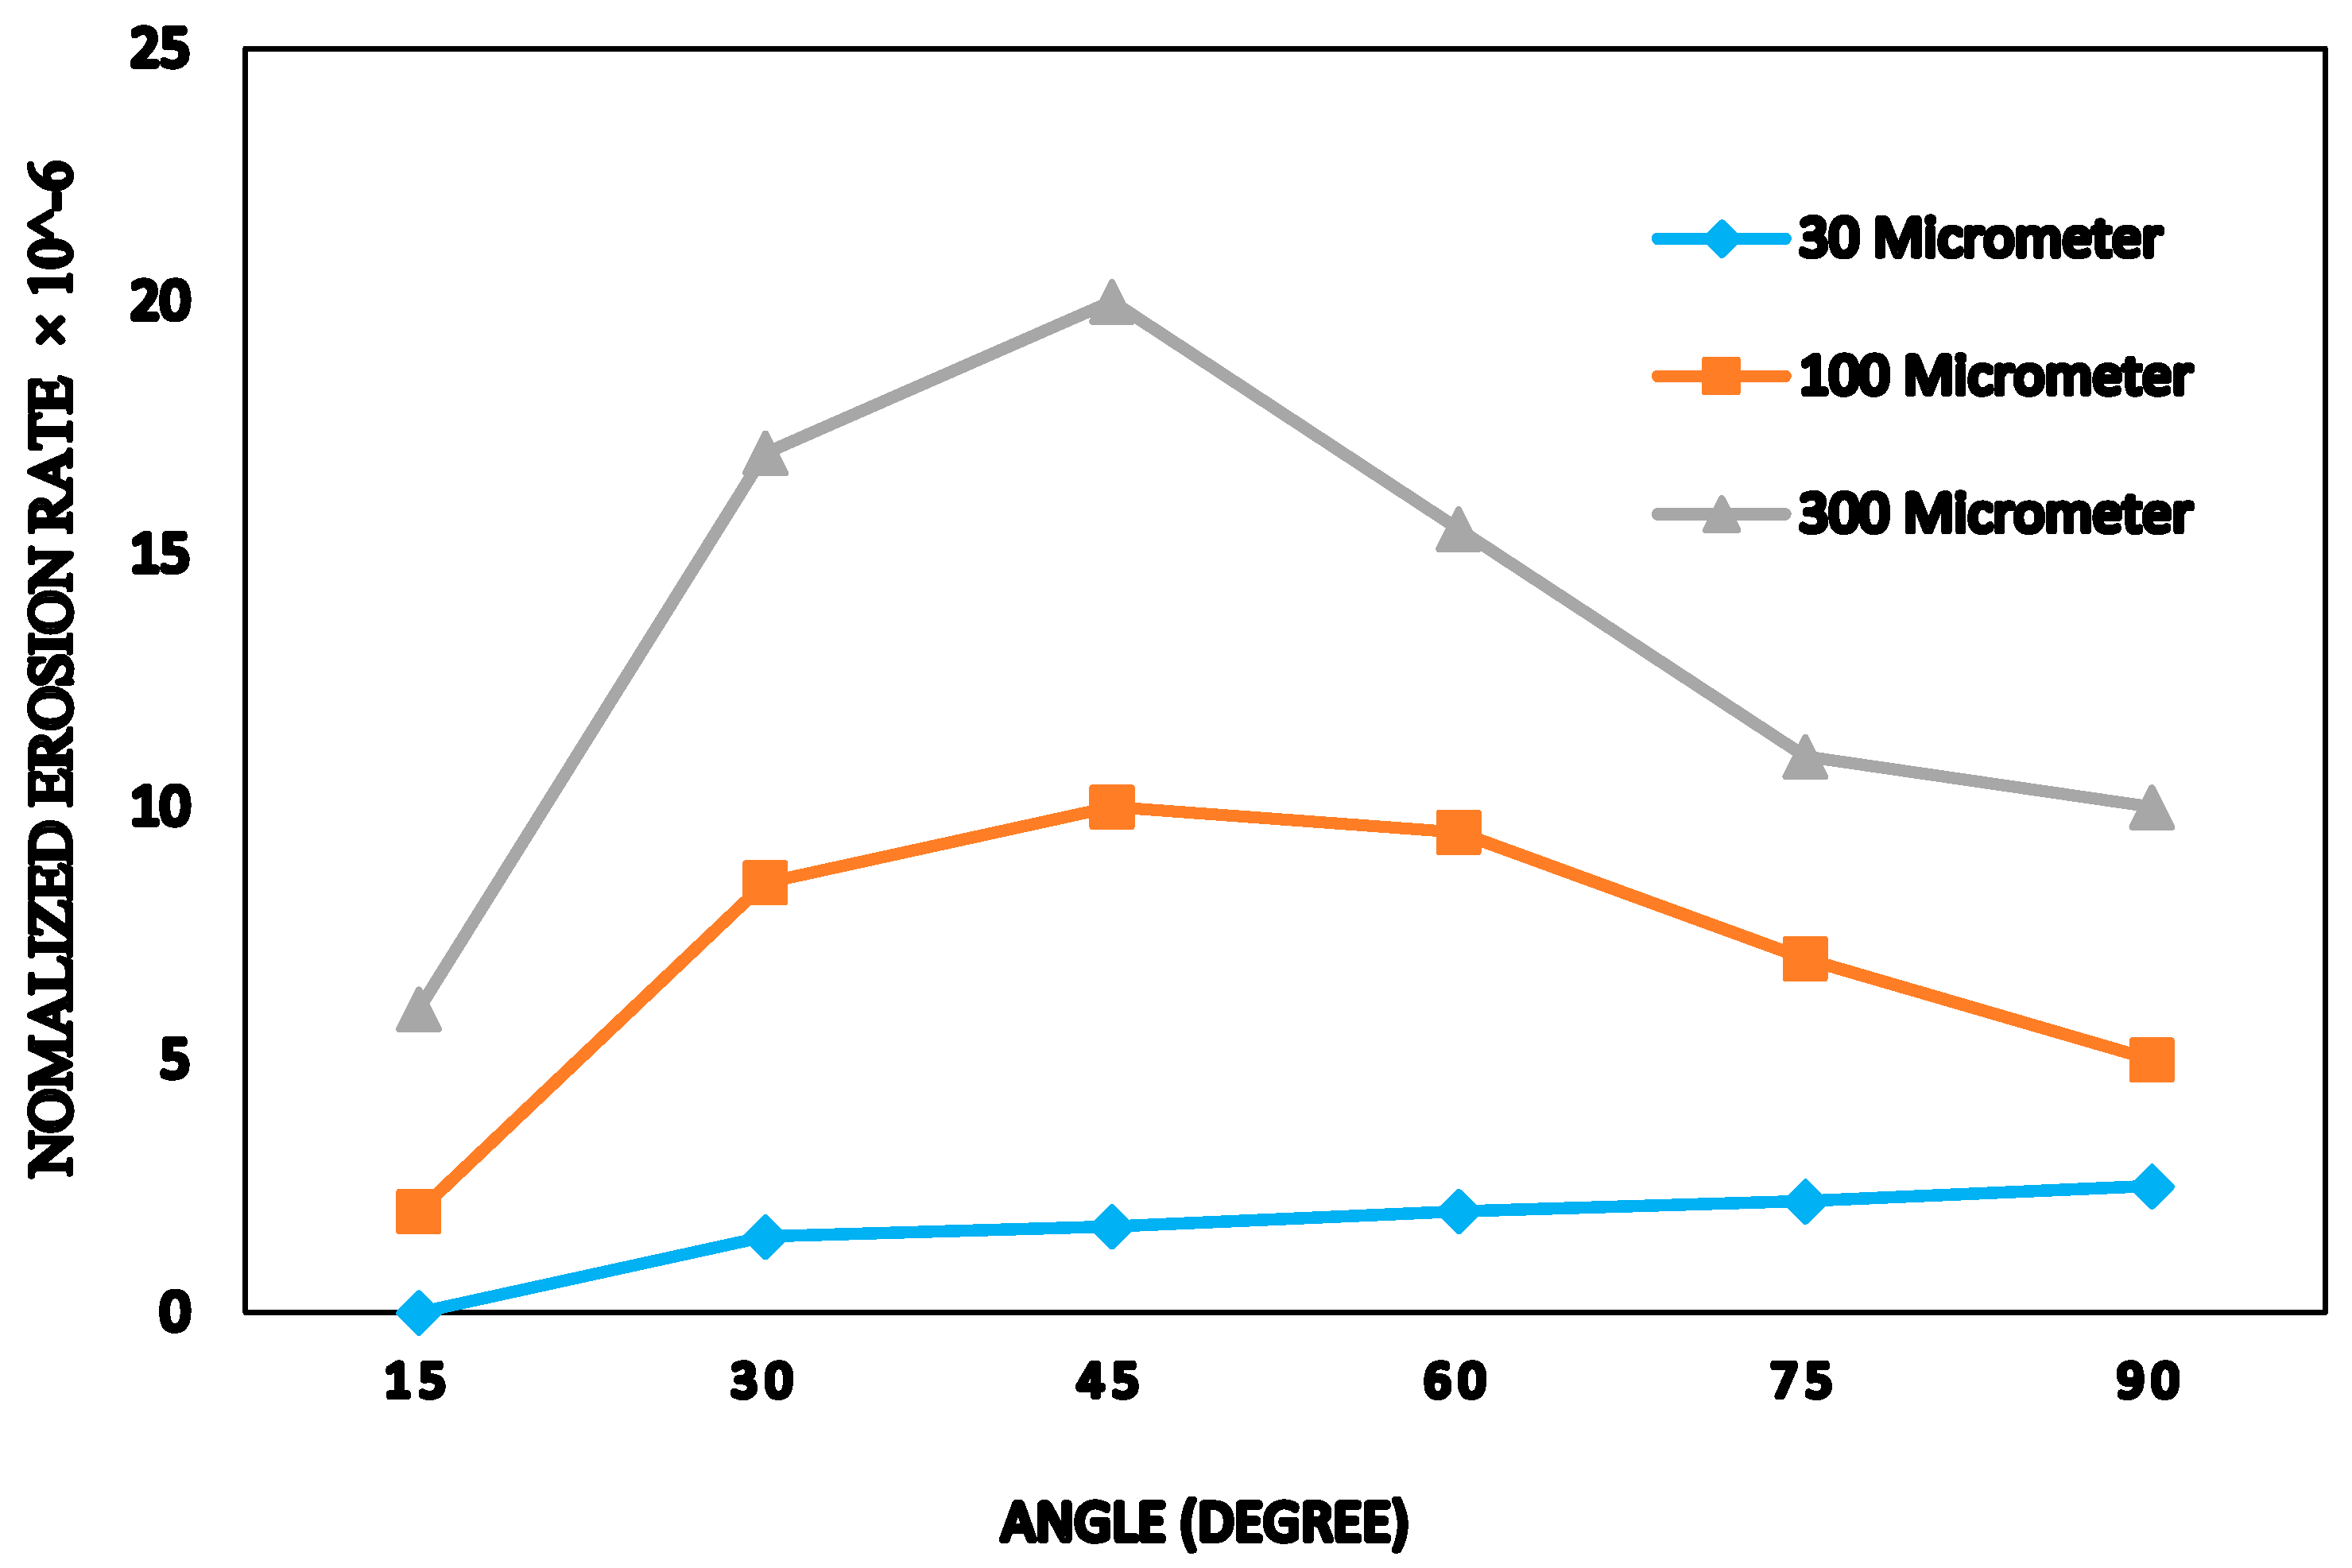
Noon et al. [17] found that during the working period of one monsoon season, the mean loss of efficiency recorded at Best Efficiency Point (BEP) is about 4%. Eltvik [18] preferred Tabakoff erosion model over Finnie’s erosion model as it indicates erosion tendency closer to the reality. They performed simulations which can be utilized to predict the location of severe erosion and to identify the maintenance intervals. Alveyro et al. [19] presented the case study of the small hydroelectric plant Rio Cali I, in Columbia, which was built about 100 years ago. The turbine efficiency in this power plant has reduced in the past few years due to the erosion of its components. CFD analysis were performed to gain improved geometry that provides elevated efficiency in a FT of 500-kW. The work was divided into two stages: The first stage of the work was to focus the covers, stay/guide vanes, and other parts of the unit. The second stage of the work was improving the profile of the runner blade. Aponte et al. [20] performed CFD analysis to predict erosion by hard particles. They used the experimental data to determine the coefficients for the Tabakoff-Grant erosion model. The model coefficients were validated to perform a computational study to consider the effect of particle size. Figure 9 shows a comparison of the erosion behavior among the particle sizes of 30, 100, and 300 µm.
It was found that the effective impingement angle against the surface for small particles is lower than the impingement angle for large particles. Kocak et al. [21] performed analytical computations and numerical simulations together to design an FT runner blade. Single blade was designed by using the Bovet approach. Net head and flow rate were chosen as 33.53 m and 1048 m3/s, respectively for design point.

2.4. Effect of Surface Roughness

Due to the manufacturing techniques used in the machining processes, the bare surface has some absolute roughness value, which is increased during machine operation through abrasion or erosion. Therefore, surface texture causes increased energy efficiency losses during its operation.
Liu et al. [22] studied the damage at the turbine runner through increased energy losses due to friction. It was suggested that friction losses should be given special consideration, mainly in the runner where the relative velocity is the maximum. The hydraulic energy efficiency of an FT against the sand grain roughness height and the discharge is plotted in Figure 10. It was found that efficiency losses are increased with increasing surface roughness. Maruzewski et al. [23] studied the specified losses in each component of an FT, which were quantified through CFD simulations. Different water passage surface roughness heights were used to obtain the results. Khanal et al. [24] obtained the optimum blade design in terms of erosion rate and efficiency. They discussed different techniques for designing the runner blade of Francis turbine, which includes the optimal outlet and blade angle distribution to get minimum possible erosion for a given volume flow rate, head, rpm. It is concluded that the optimum blade is a blade with profile curvature position of 0.25. Although the efficiency of an optimized blade is 0.25% less than reference design, but substantial decrease in rate of erosion has been observed; the erosion is 31.5 times less than the reference blade which is a significant reduction. They found that by varying the runner blade profile parameters, significant improvement in minimizing erosion can be made while maintaining the efficiency. The improved profile can also increase the runner blade life.

2.5. FSI as a Multiphysics Approach

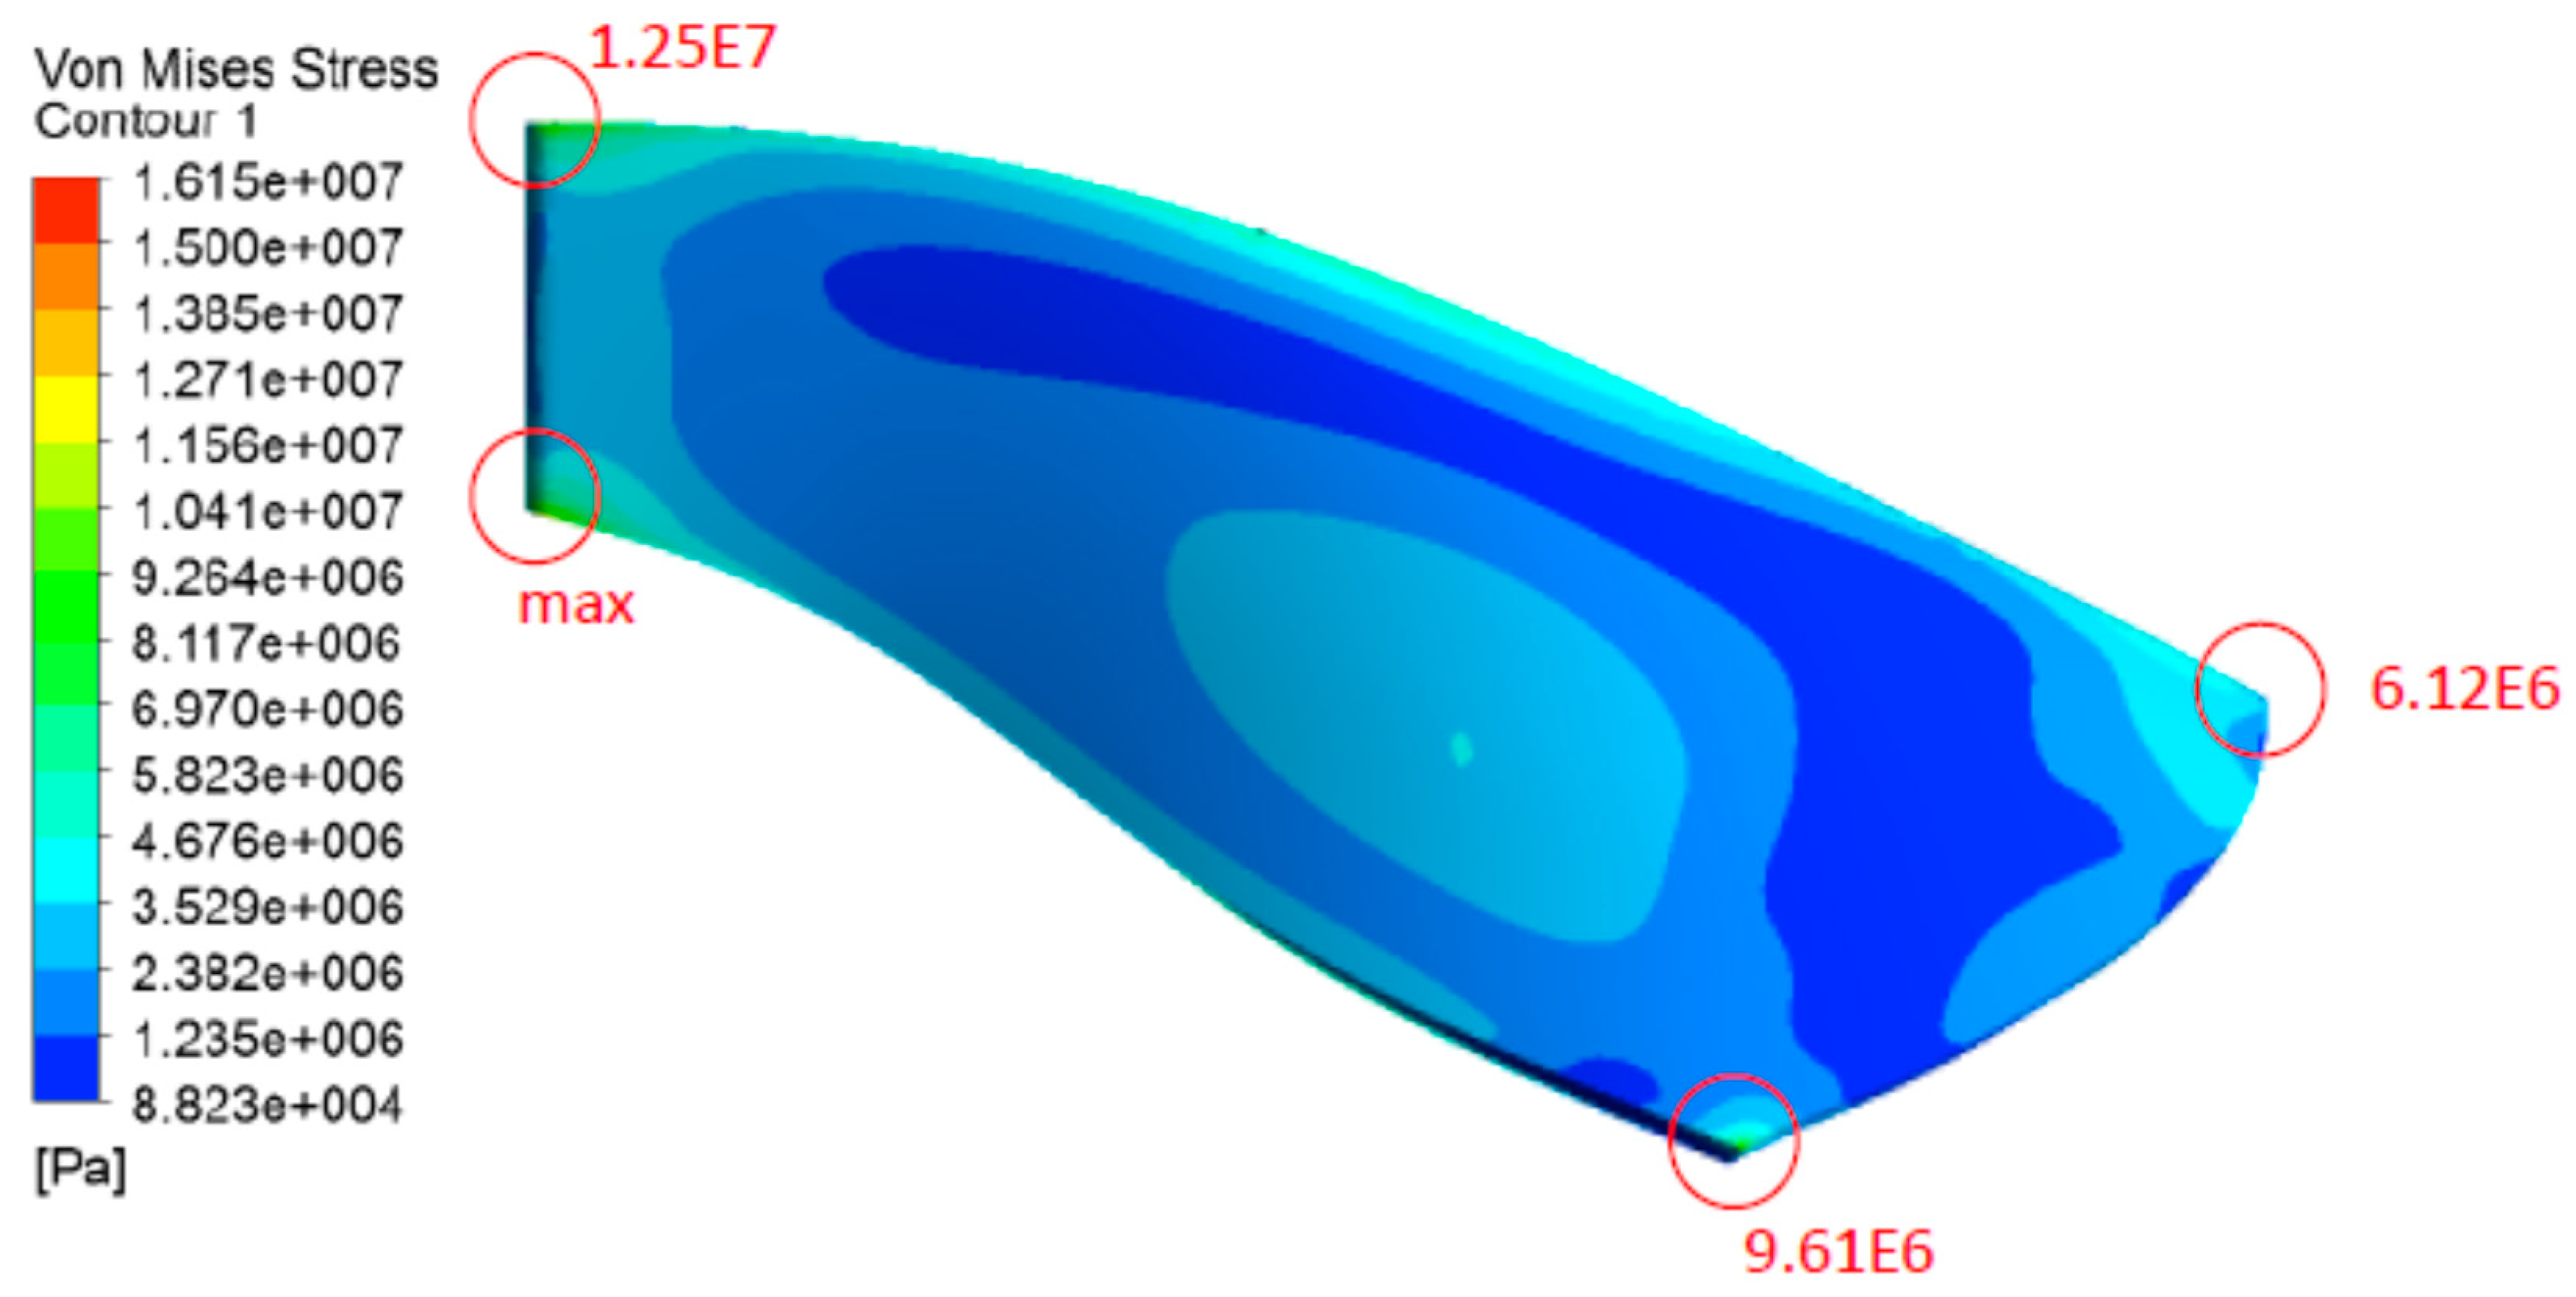
Fluid structure interaction (FSI) is a Multiphysics approach that is essential for obtaining accurate results. However, very few studies are found in literature solving sediments and cavitation erosion problems using FSI methodology. Chitrakar [25] conducted a study to assess the structural integrity of the turbine design through both one-way and two-way FSI. It was observed that the optimized design yields better results as far as the runner structural integrity is concerned. The maximum stress was enhanced by around 14% from the base design and approximately by 52% for the optimized design, as compared to the one-way FSI as shown in Figure 10. Muller et al. [26] worked on the two-phase flow field at the runner exit. The experimental techniques presented by Muller et al. utilized Laser Doppler Velocimetry (LDV) and high-speed visualizations to address the unstable fluid-structure interaction mechanisms between the unsteady draft tube flow and the runner shaft. Moreover, this approach was compared at the same time with measured wall pressure oscillations in the draft tube cone and the torque on the runner shaft.
Table 1 shows some of the erosion models which are considered in hydraulic machines. The review made in this part of the paper [11,12,13,14,15,16,17,18,19,20,21,22,23,24,25,26] concludes that sediment erosion severely damages the components of hydroelectric power plants. Surface damage and efficiency losses were examined through experimental and CFD techniques by various researchers. Numerical methods are gaining popularity. It is proposed that at the initial stage, the components such as runner stay and guide vanes, draft tube, etc. can be analyzed individually, and then the effect of combined components can be evaluated to determine erosion wear and efficiency losses.

3. Experimental and Numerical Investigation for Cavitation Erosion

3.1. Introduction

Formation of vapor bubbles due to decrease in static pressure below its vapor pressure at local temperature and then collapse of these bubbles due to sudden increase in the static pressure in a fluid is called cavitation. The phenomenon of cavitation leads to various problems such as noise and vibration at the trailing edges of turbine blades and in draft tubes, which eventually reduces the service of the components and consequently reduces the plant efficiency. The main types of cavitation that can occur in FT are leading edge, draft tube swirl, traveling bubble, and von Karman vortex cavitation.
Different experimental techniques are employed like tribometers configuration, Particle Image Velocimetry (PIV), Laser Doppler Velocimetry (LDV) measurements, etc. by different researchers. It is very critical to develop an appropriate shape and mounting position of the cavitation inducers (CIs) to study the cavitation phenomenon. From the last two decades, the CFD technique has been used to identify cavitation by examining the regions of pressure below vapor pressure with a single-phase model. In most of the studies, the influence of a cavitation bubble on the flow field is ignored. But they cannot provide detailed information such as the effect of cavitation on the efficiency or a more accurate prediction of the magnitude of a cavitation bubble. For this reason, the CFD method in two-phase simulation becomes necessary. The Rayleigh–Plesset model is the most effective tool for analyzing two-phase flow problems.
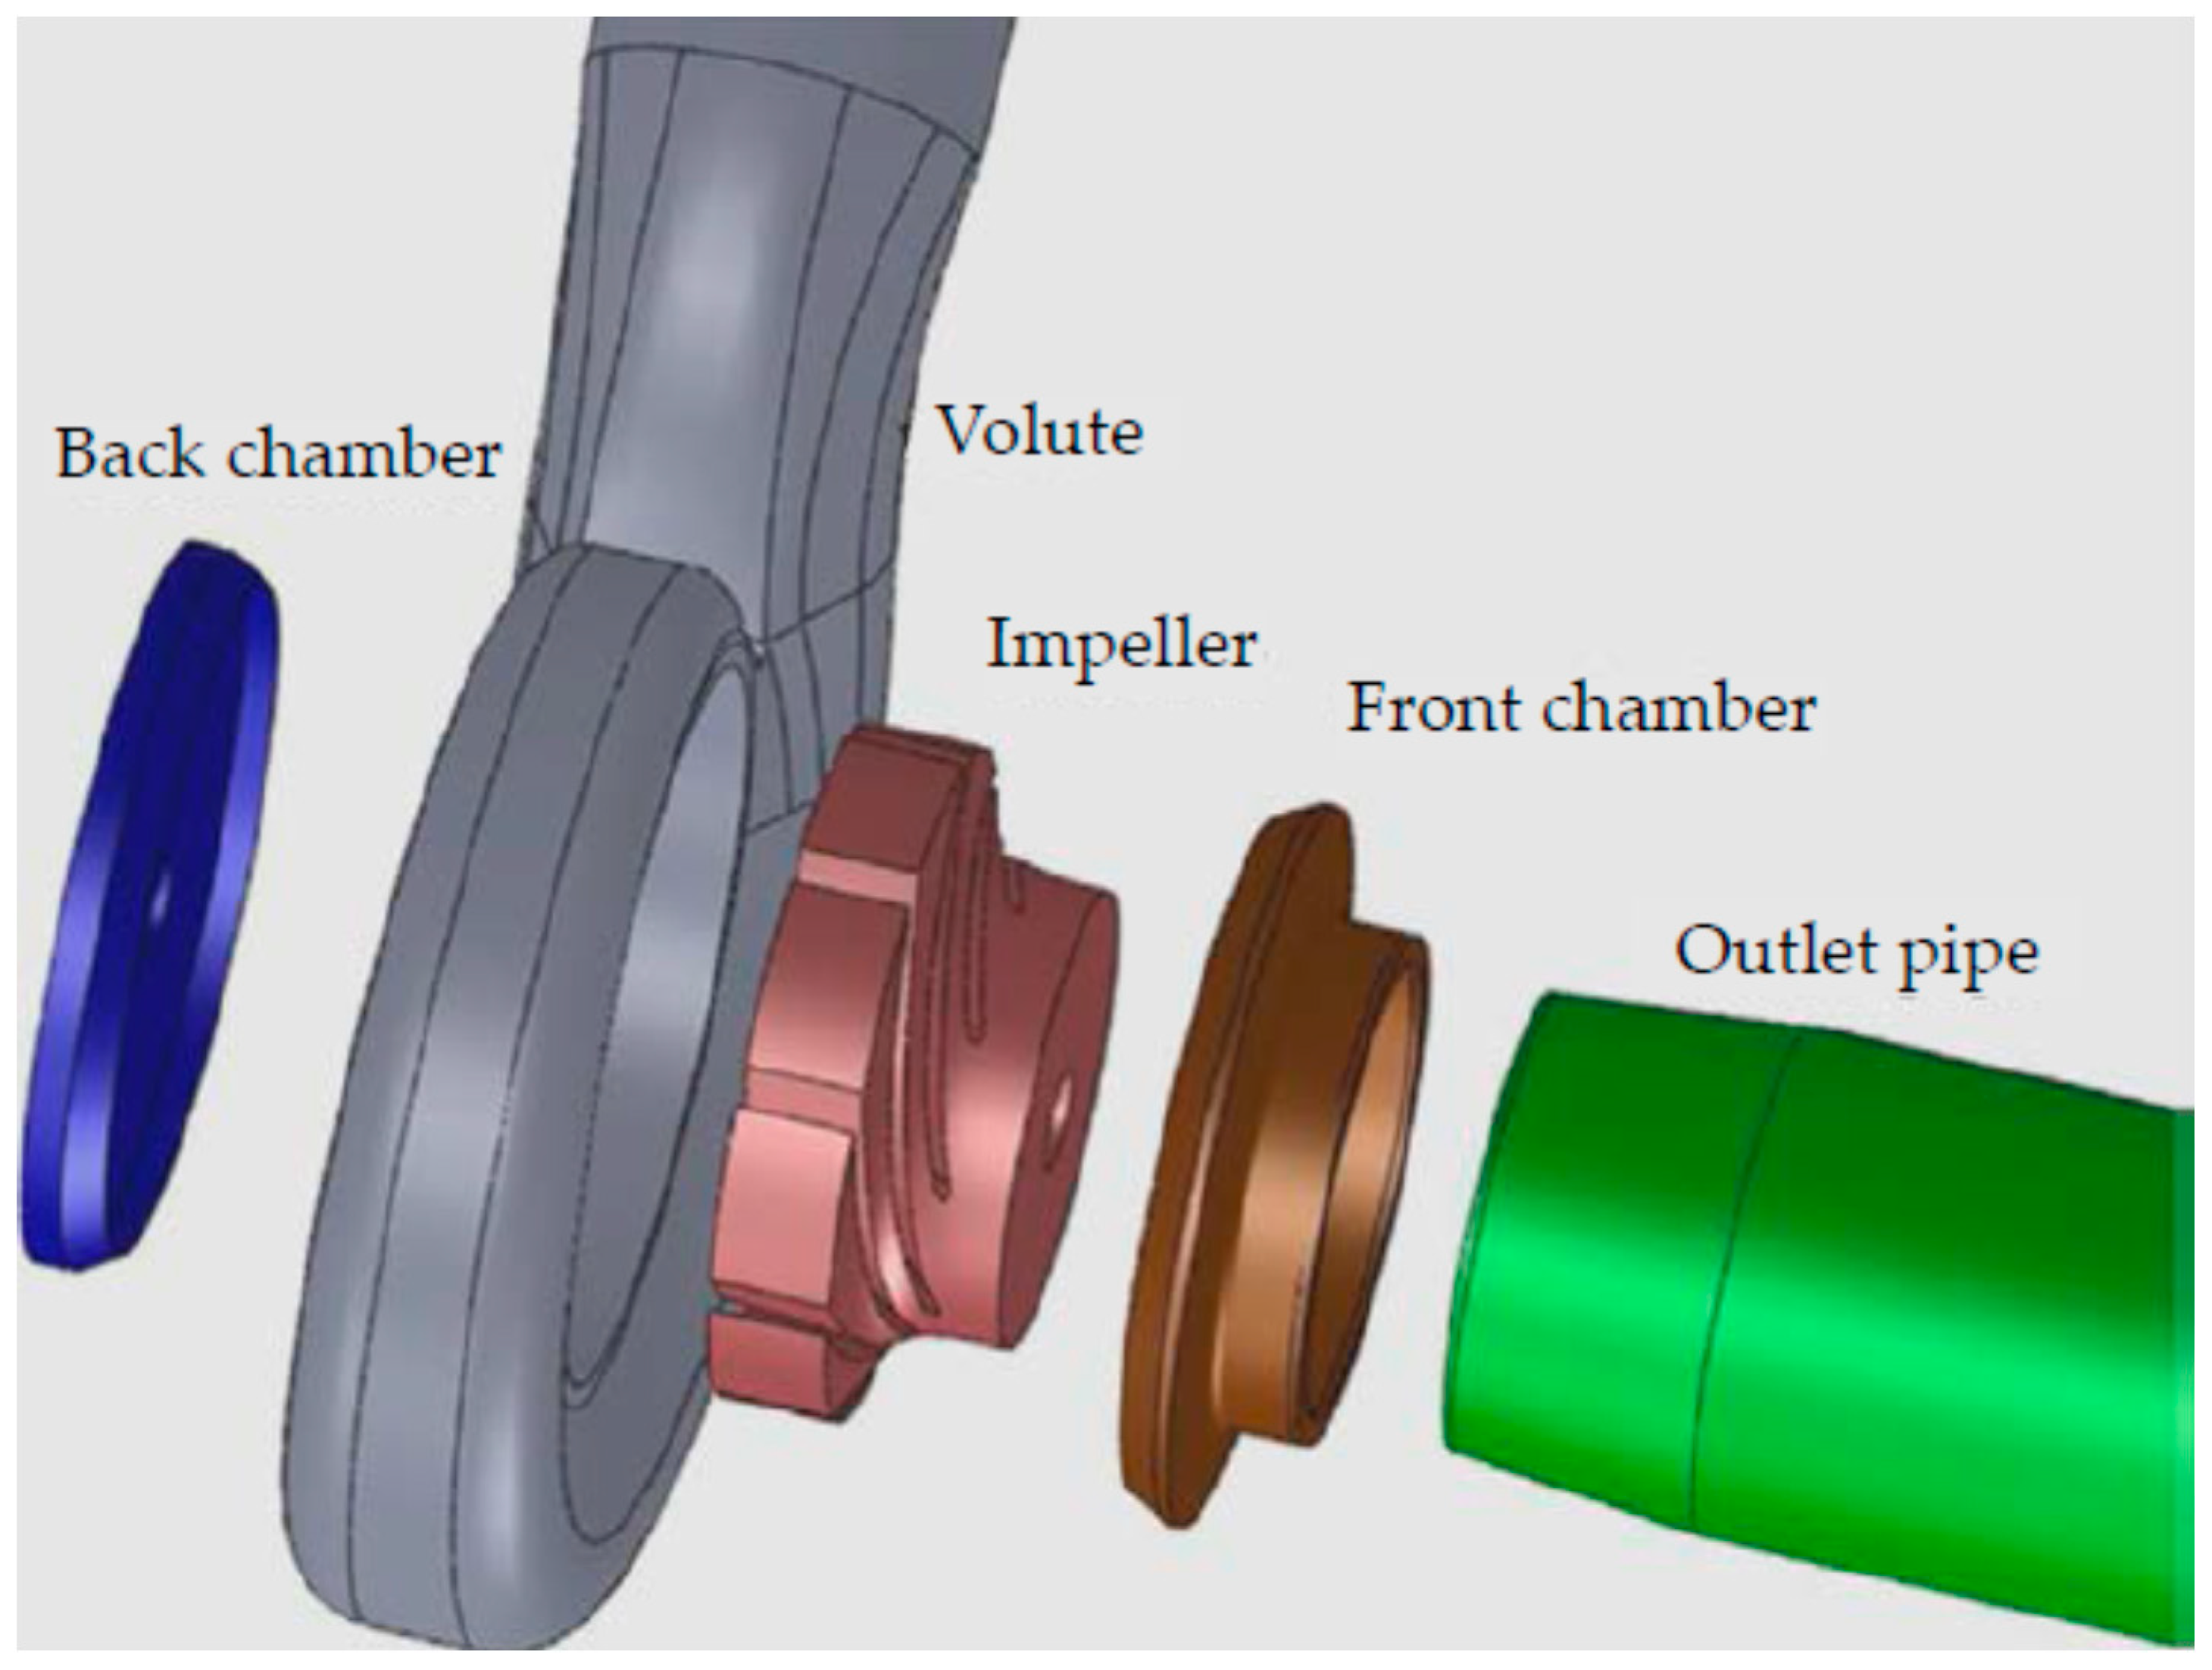
Jain et al. [27] have worked on various turbines appropriate for micro-hydropower plants: also gravity micro hydro turbines, e.g., Archimedes screws and gravity water wheels do not suffer about sediment erosion. The historical development of PAT (Pump as turbine) regarding theoretical investigations are discussed. Several pumps that were suitable to run in turbine mode in case of low capacity power production in micro-hydropower plants were analyzed. The flow path was divided into five parts, namely rear chamber, front chamber, volute, passage of pallor, and outlet pipe, as shown in Figure 11.
Jain et al. [27] concluded that in comparison to conventional turbines, PAT can payback in two years in the range of 1–500 kW. Ghiban et al. [28] studied the cavitation erosion and abrasive erosion developed in hydraulic machineries containing high resistant metallic material structure. The synergy of both cavitation erosion and abrasive erosion is also discussed.

3.2. Experimental Techniques

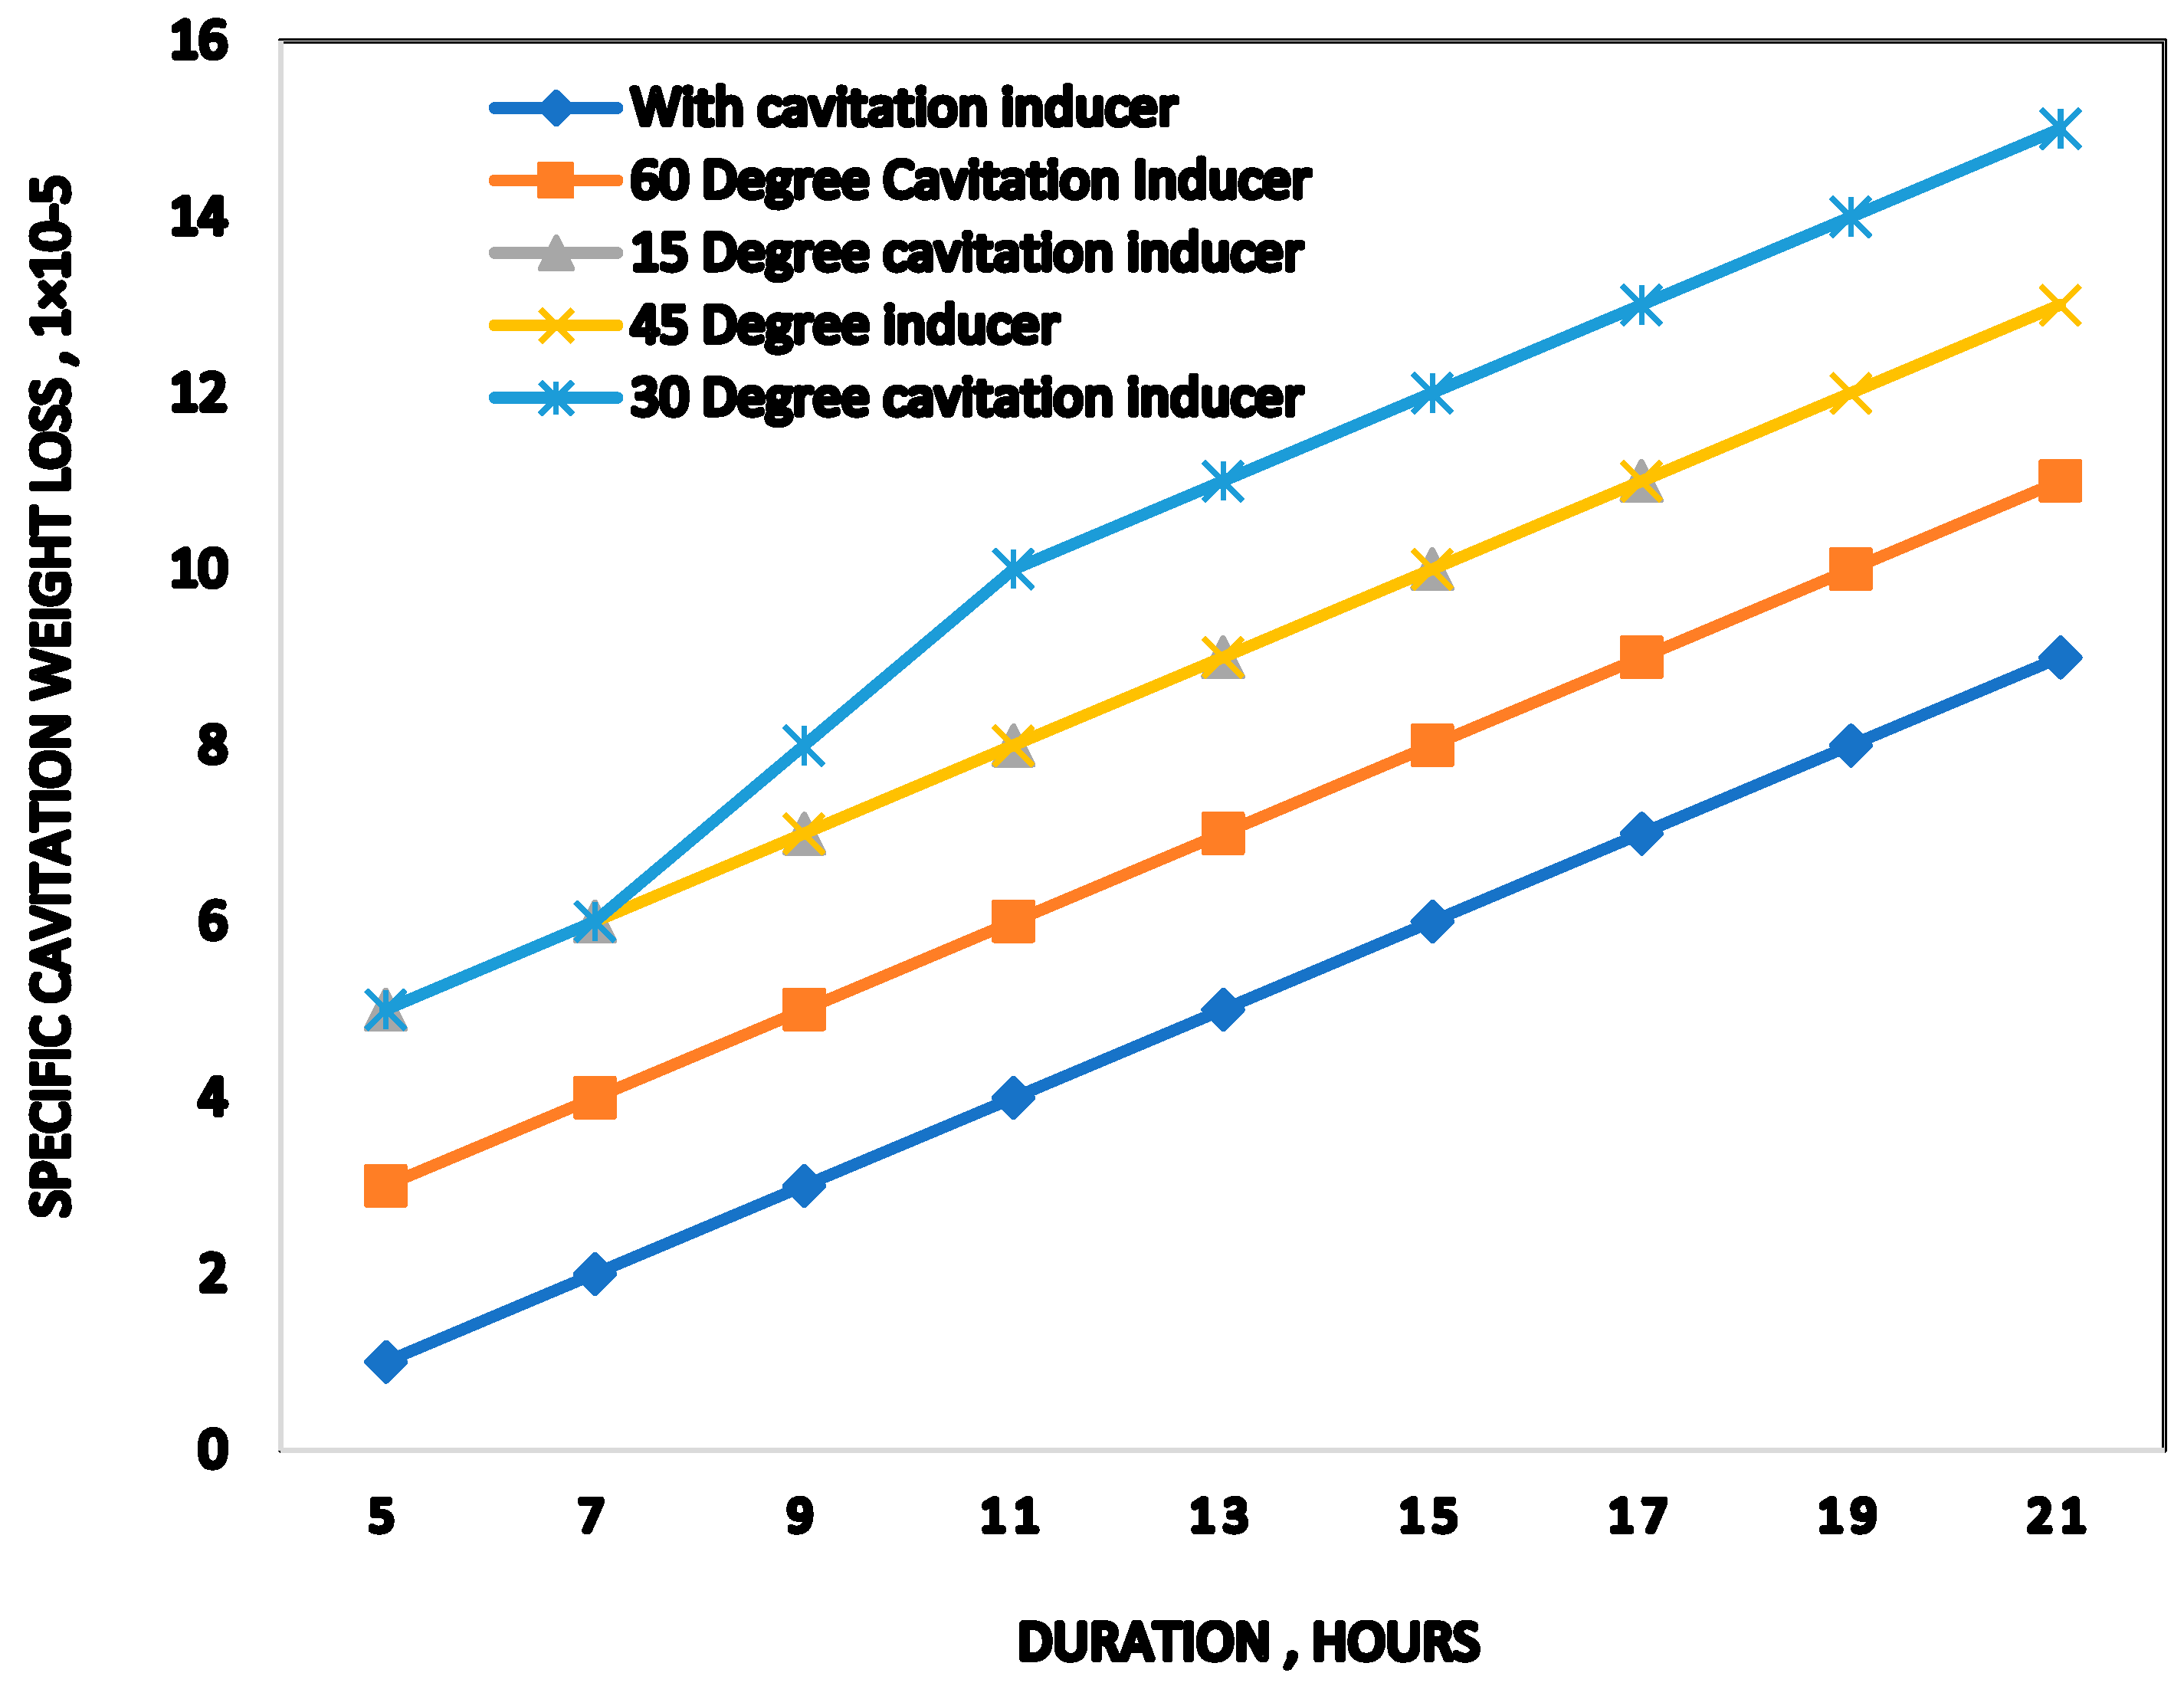
Amarendra et al. [29] have experimentally examined and compared the alpha-beta brass test material for cavitation induced erosion. Triangular bluff bodies are used as cavitation inducers which were utilized in a slurry pot of rotating disk tribometer at different angles and lengths. It was estimated that the cumulative mass loss is 250% higher for specimen tested in slurry with 30° CI than specimen tested without CI. Figure 12 shows the variation of mass loss with different types of cavitation inducers and without them.
It is concluded that the brass specimen placed at a distance of 8 mm with CI yields maximum cavitation erosion. Haosheng et al. [30] analyzed the effect of shape of sand particles on cavitation erosion and found that the irregular shape particles have a negligible effect on the number of the cavities, but it causes abrasion on the solid surface. Furthermore, it was observed that the suspended particles caused severe cavitation erosion than those without suspension. Franc et al. [31] studied the cavitation pitting by analyzing the incubation period. They used three different metals i.e., Nickel Aluminum Bronze alloy, Aluminum alloy, and a Duplex Stainless Steel to conduct pitting tests in a cavitation tunnel. The impact of flow velocity on a couple of parameters—characteristic diameter and coverage time—was studied, and a standard law of power was established for the effect of the flow velocity on the rate of pitting for all three metals. Pereira et al. [32] presented a test case with a turbine prototype of 444 MW rated power. They used polynomial bi-variate functions based on Hermite polynomials to build a hill chart that can calculate the power output, the discharge, the efficiency, and the cavitation parameters. Thapa et al. [33] conducted analysis along the chord plane, from wall of the guide vane to its mid-span. Flow velocity exceeding 35 m/s, at the runner intake of FT, is reported for the first time from such experimental studies. Venturini et al. [34] acquired the performance data experimentally from four different centrifugal pumps, running in both pump and PAT mode that are characterized by specific speed values in the range of 1.53–5.82. The model developed by Vinturini et al. showed in this paper shows a powerful and robust tool for predicting PAT performance curves over the whole range of operation based on pump parameters.

3.3. Cavitation Research by CFD

CFD has become an essential tool for cavitation research, but it needs validation against smartly designed and executed experiments as well as good knowledge of fluid mechanics. A lot of resources can be saved by using appropriate scaled down models and using symmetry.
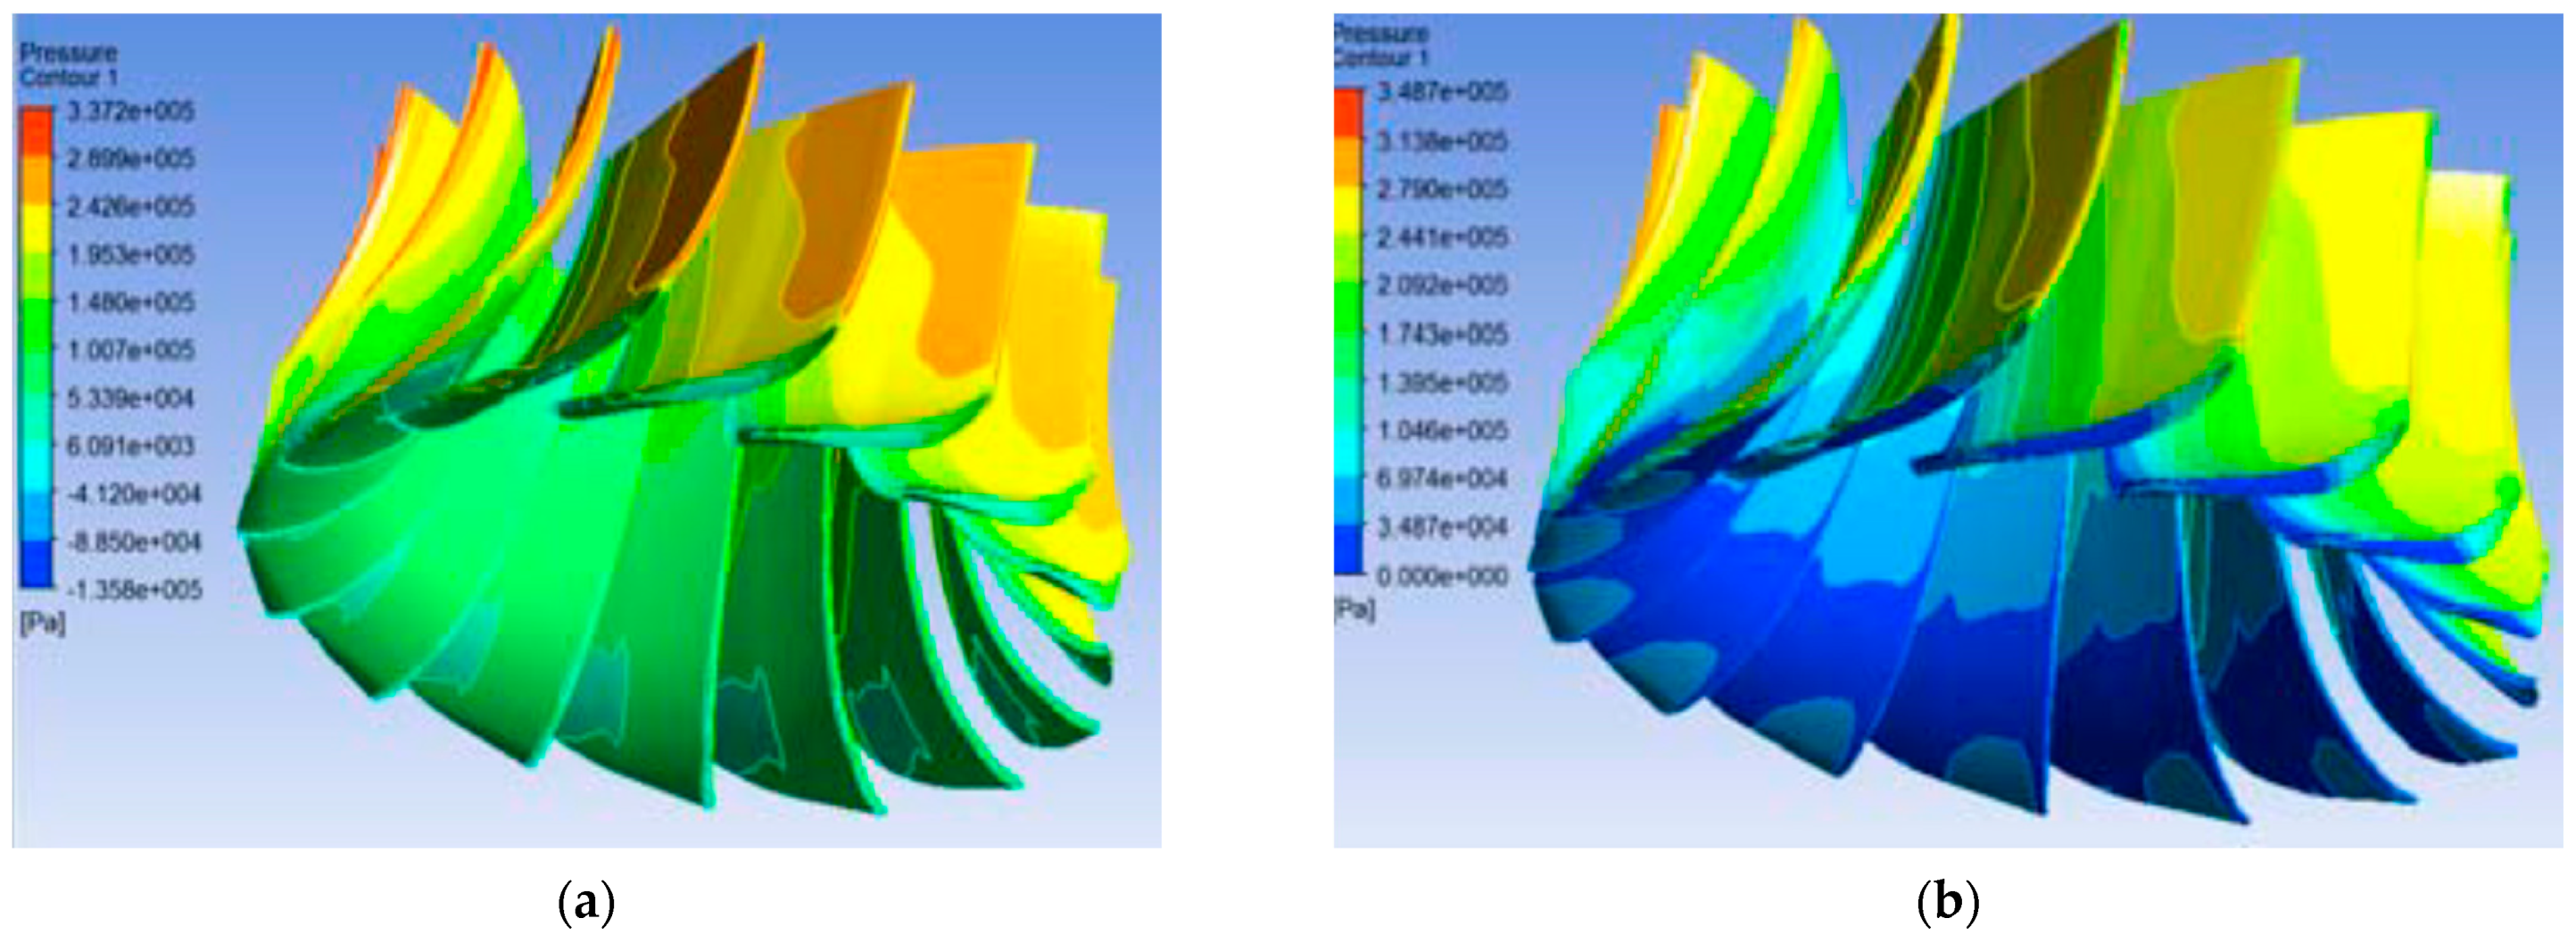
Gohil et al. [35] investigated the unsteady cavitation flow in FT at part load, rated load (BEP), and overload conditions. A small variation of pressure distribution was observed for the surface of the blade under part load condition. It was found that more pressure difference found at overload condition in comparison to rated load condition as shown in Figure 13.
Vapor bubbles formation and turbine efficiency loss towards suction side of the runner blade are found to be maximum under overload condition. Sreedhar et al. [36] reviewed the work done in the field of cavitation erosion research both in water and liquid sodium as these are important media in nuclear reactors. They formulated the cavitation bubble collapse and estimated the collapse pressure. The methods for measurement of cavitation damage were also discussed. Scliesu et al. [37] studied the vapor cavity rope and its centerline which depends on the turbine setting level. They conducted measurements for the velocity flow field and the volume of a compact unsteady vapor cavity through a PIV two-phase application. Filtering procedures and specific image acquisition techniques are implemented for the examination of cavity volume. It was the first time that they developed a rope in diffuser cone of FT model. Arispe et al. [38] improved the draft tube geometry to recover higher static pressure. The modified draft tubes has better efficiencies and lower coefficient of loss, corresponding to the original one. Mohanta et al. [39] analyzed the vibration condition by monitoring of the electrical and mechanical equipment used in the hydro power stations along with a brief explanation of vibration related defects considering previous literature in the past 30 years. Kang et al. [40] analyzed the incipient cavitation by using the method of wavelet time-frequency and wavelet packet decomposition to process the cavitation noise signals. The results showed that the characteristics of incipient cavitation can be found in the auditory frequency band.

3.4. Vortex Rope Formation

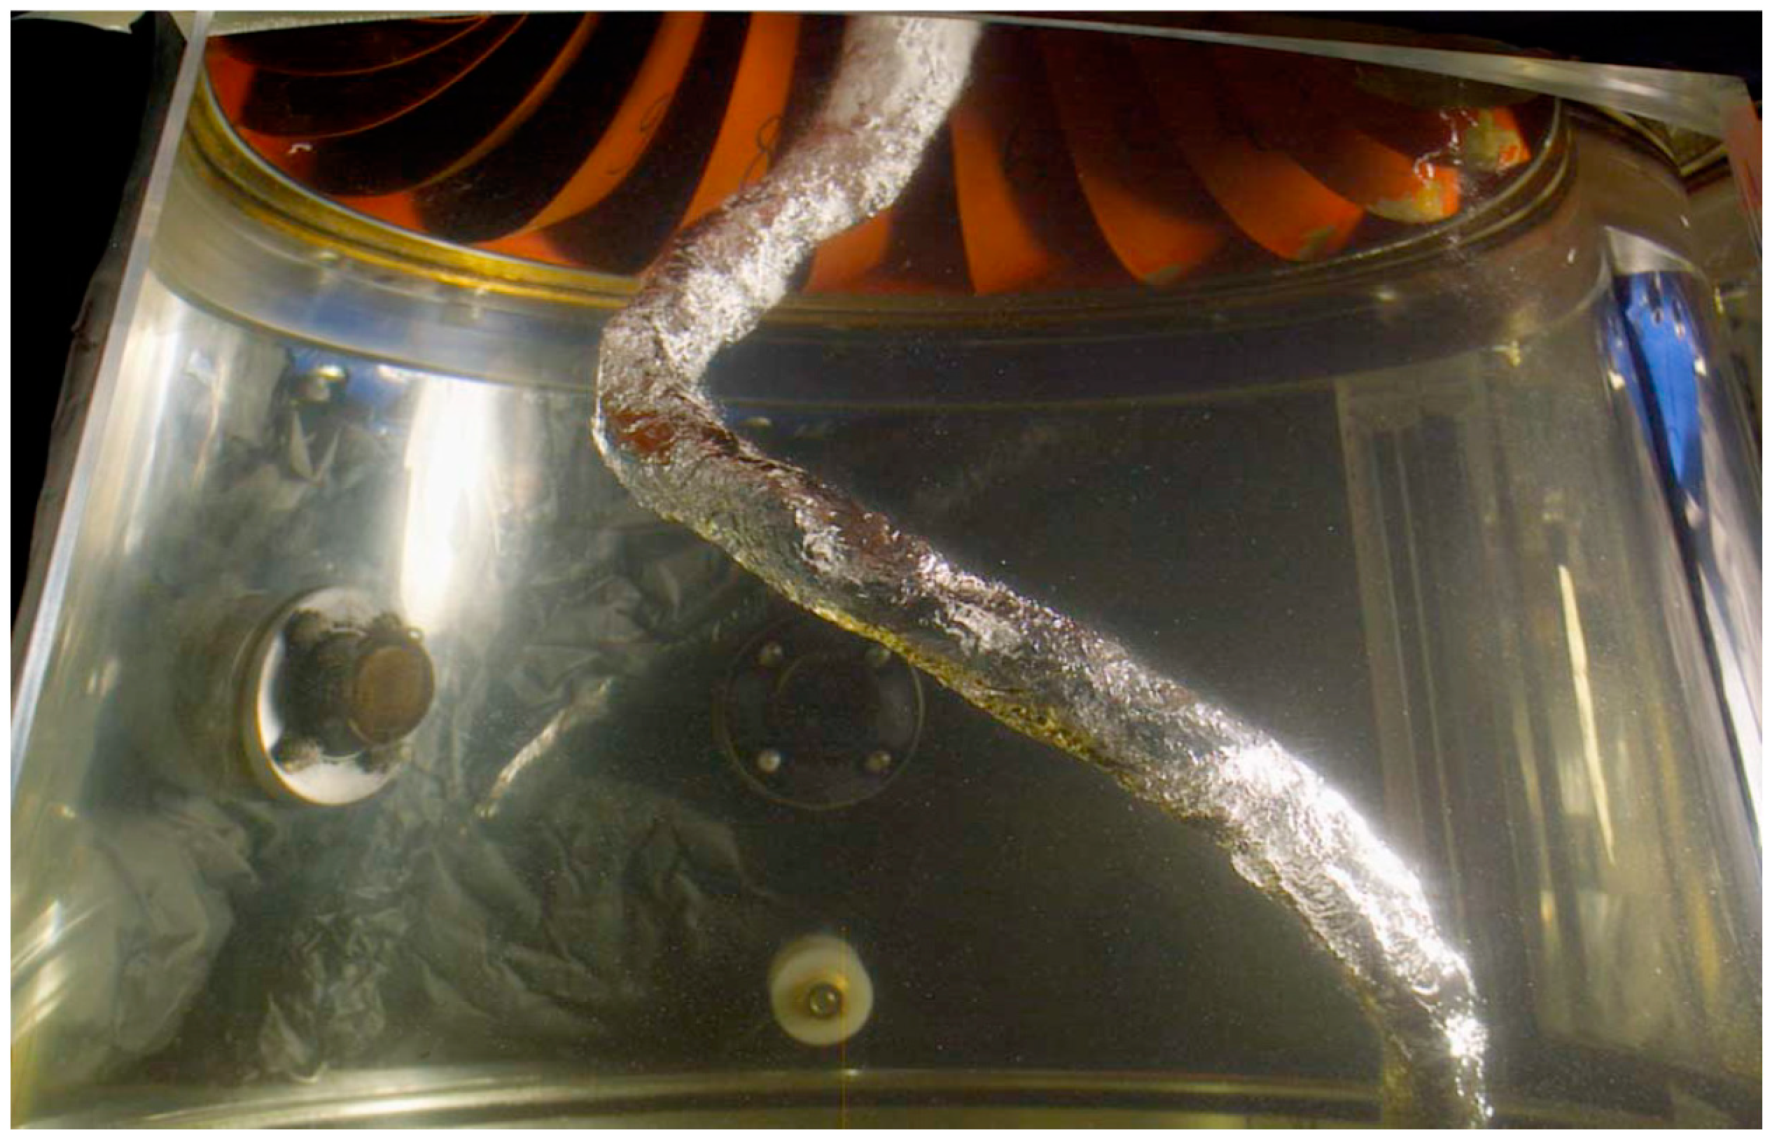
For hydraulic turbines, the operating points at partial flow rate are a source of vortex formation at the runner outlet in the draft tube cone [41]. Cavitation developed into the low-pressure zone of the vortex core (see Figure 14). The vortex rope is helical in shape, that is, cavitation in its core and the cavitation volume varies with the pressure variation.
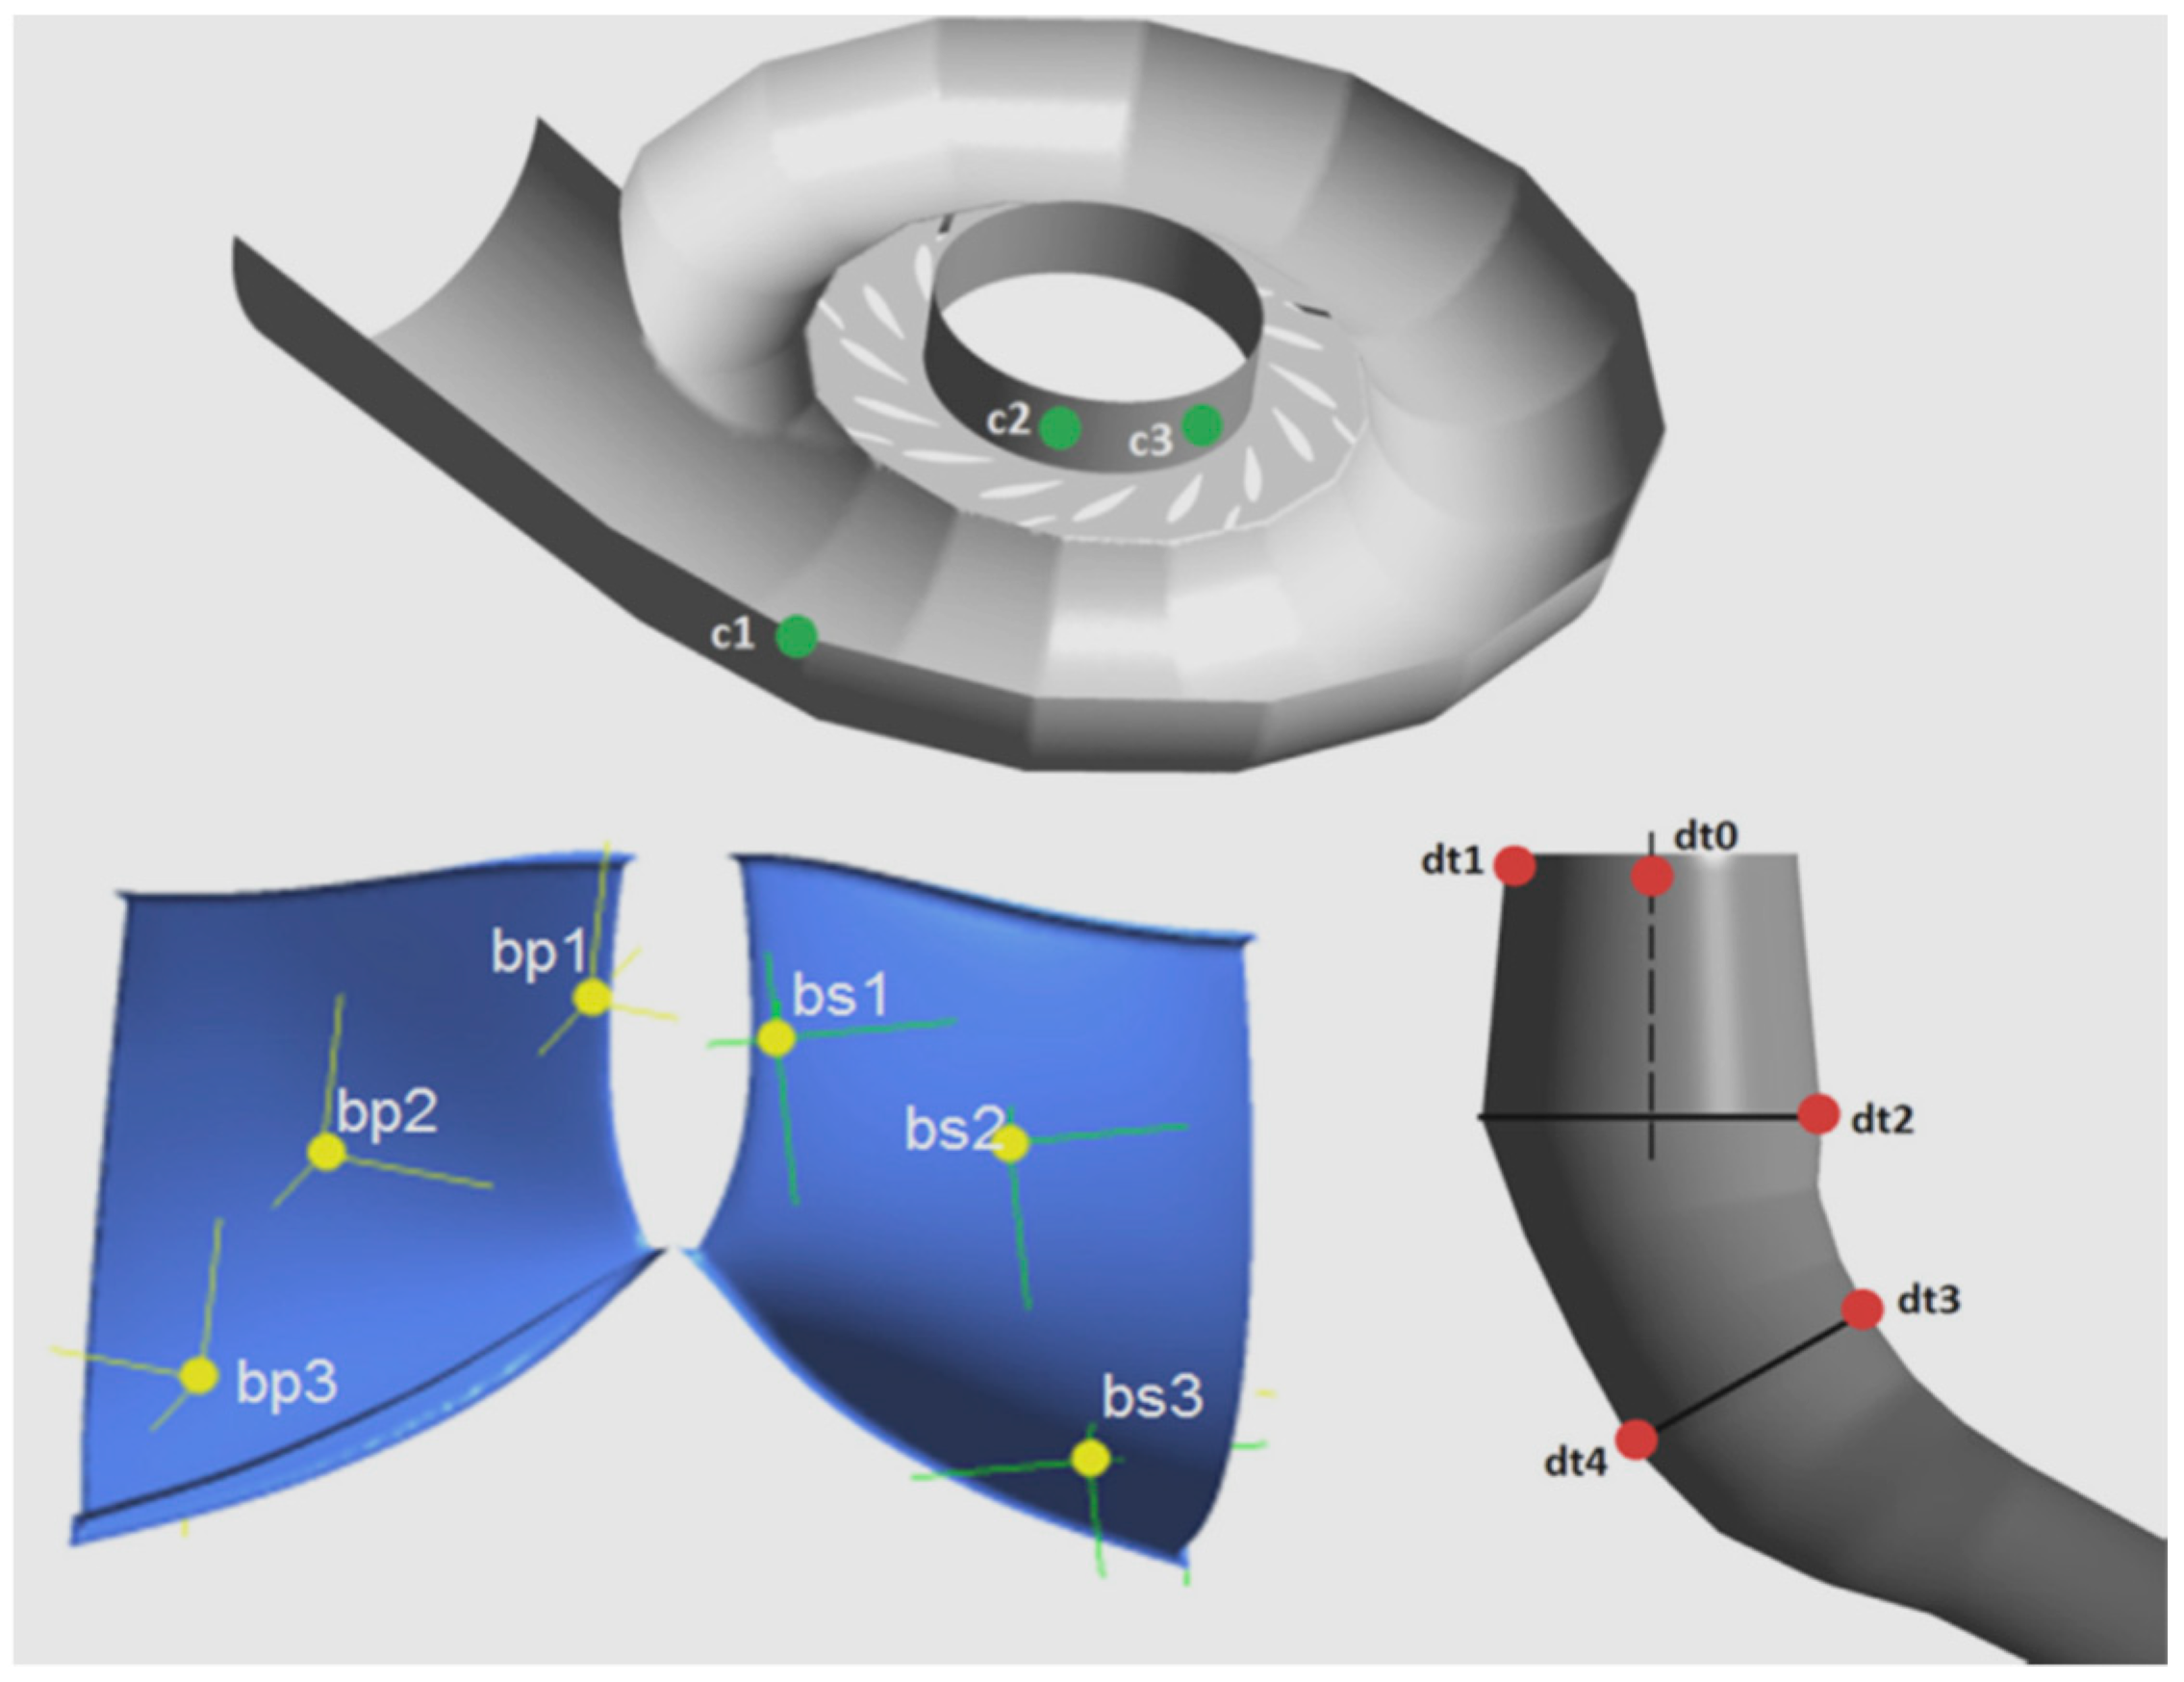
Zhang et al. [41] compared the various techniques for hydro turbines for vortex identification. They discussed and summarized plenty of theoretical and experimental works performed for vortex observation. The geometrical parameters, such as the inner flow swirling, types of turbine, condition of flow, etc., flow conditions, etc. are the influencing parameters for vortices in the hydro turbines. FT, vortex rope, was visible in the draft tube and inter-blade vortices were observed near the runner. Columnar vortices were appearing at the runner inlet and streamwise vortices were distributed in the inter-blade channels. Kc et al. [42] presented the results for FT designed for a small scale hydro-power plant through the simulation work of the unsteady flow field resulting from the rotor-stator interaction by taking full fluid passage. The time-dependent analysis shows the contact between the static and rotating domains and the effect of the fluid flow in different components. Fourteen locations were chosen, and time changing pressure fluctuations and vibration level in the components were recorded in spiral casing, runner blade, and draft tube. Three locations each were chosen on spiral casing and pressure-suction side of the runner blade and five were chosen in the draft tube were labeled as seen in Figure 15.
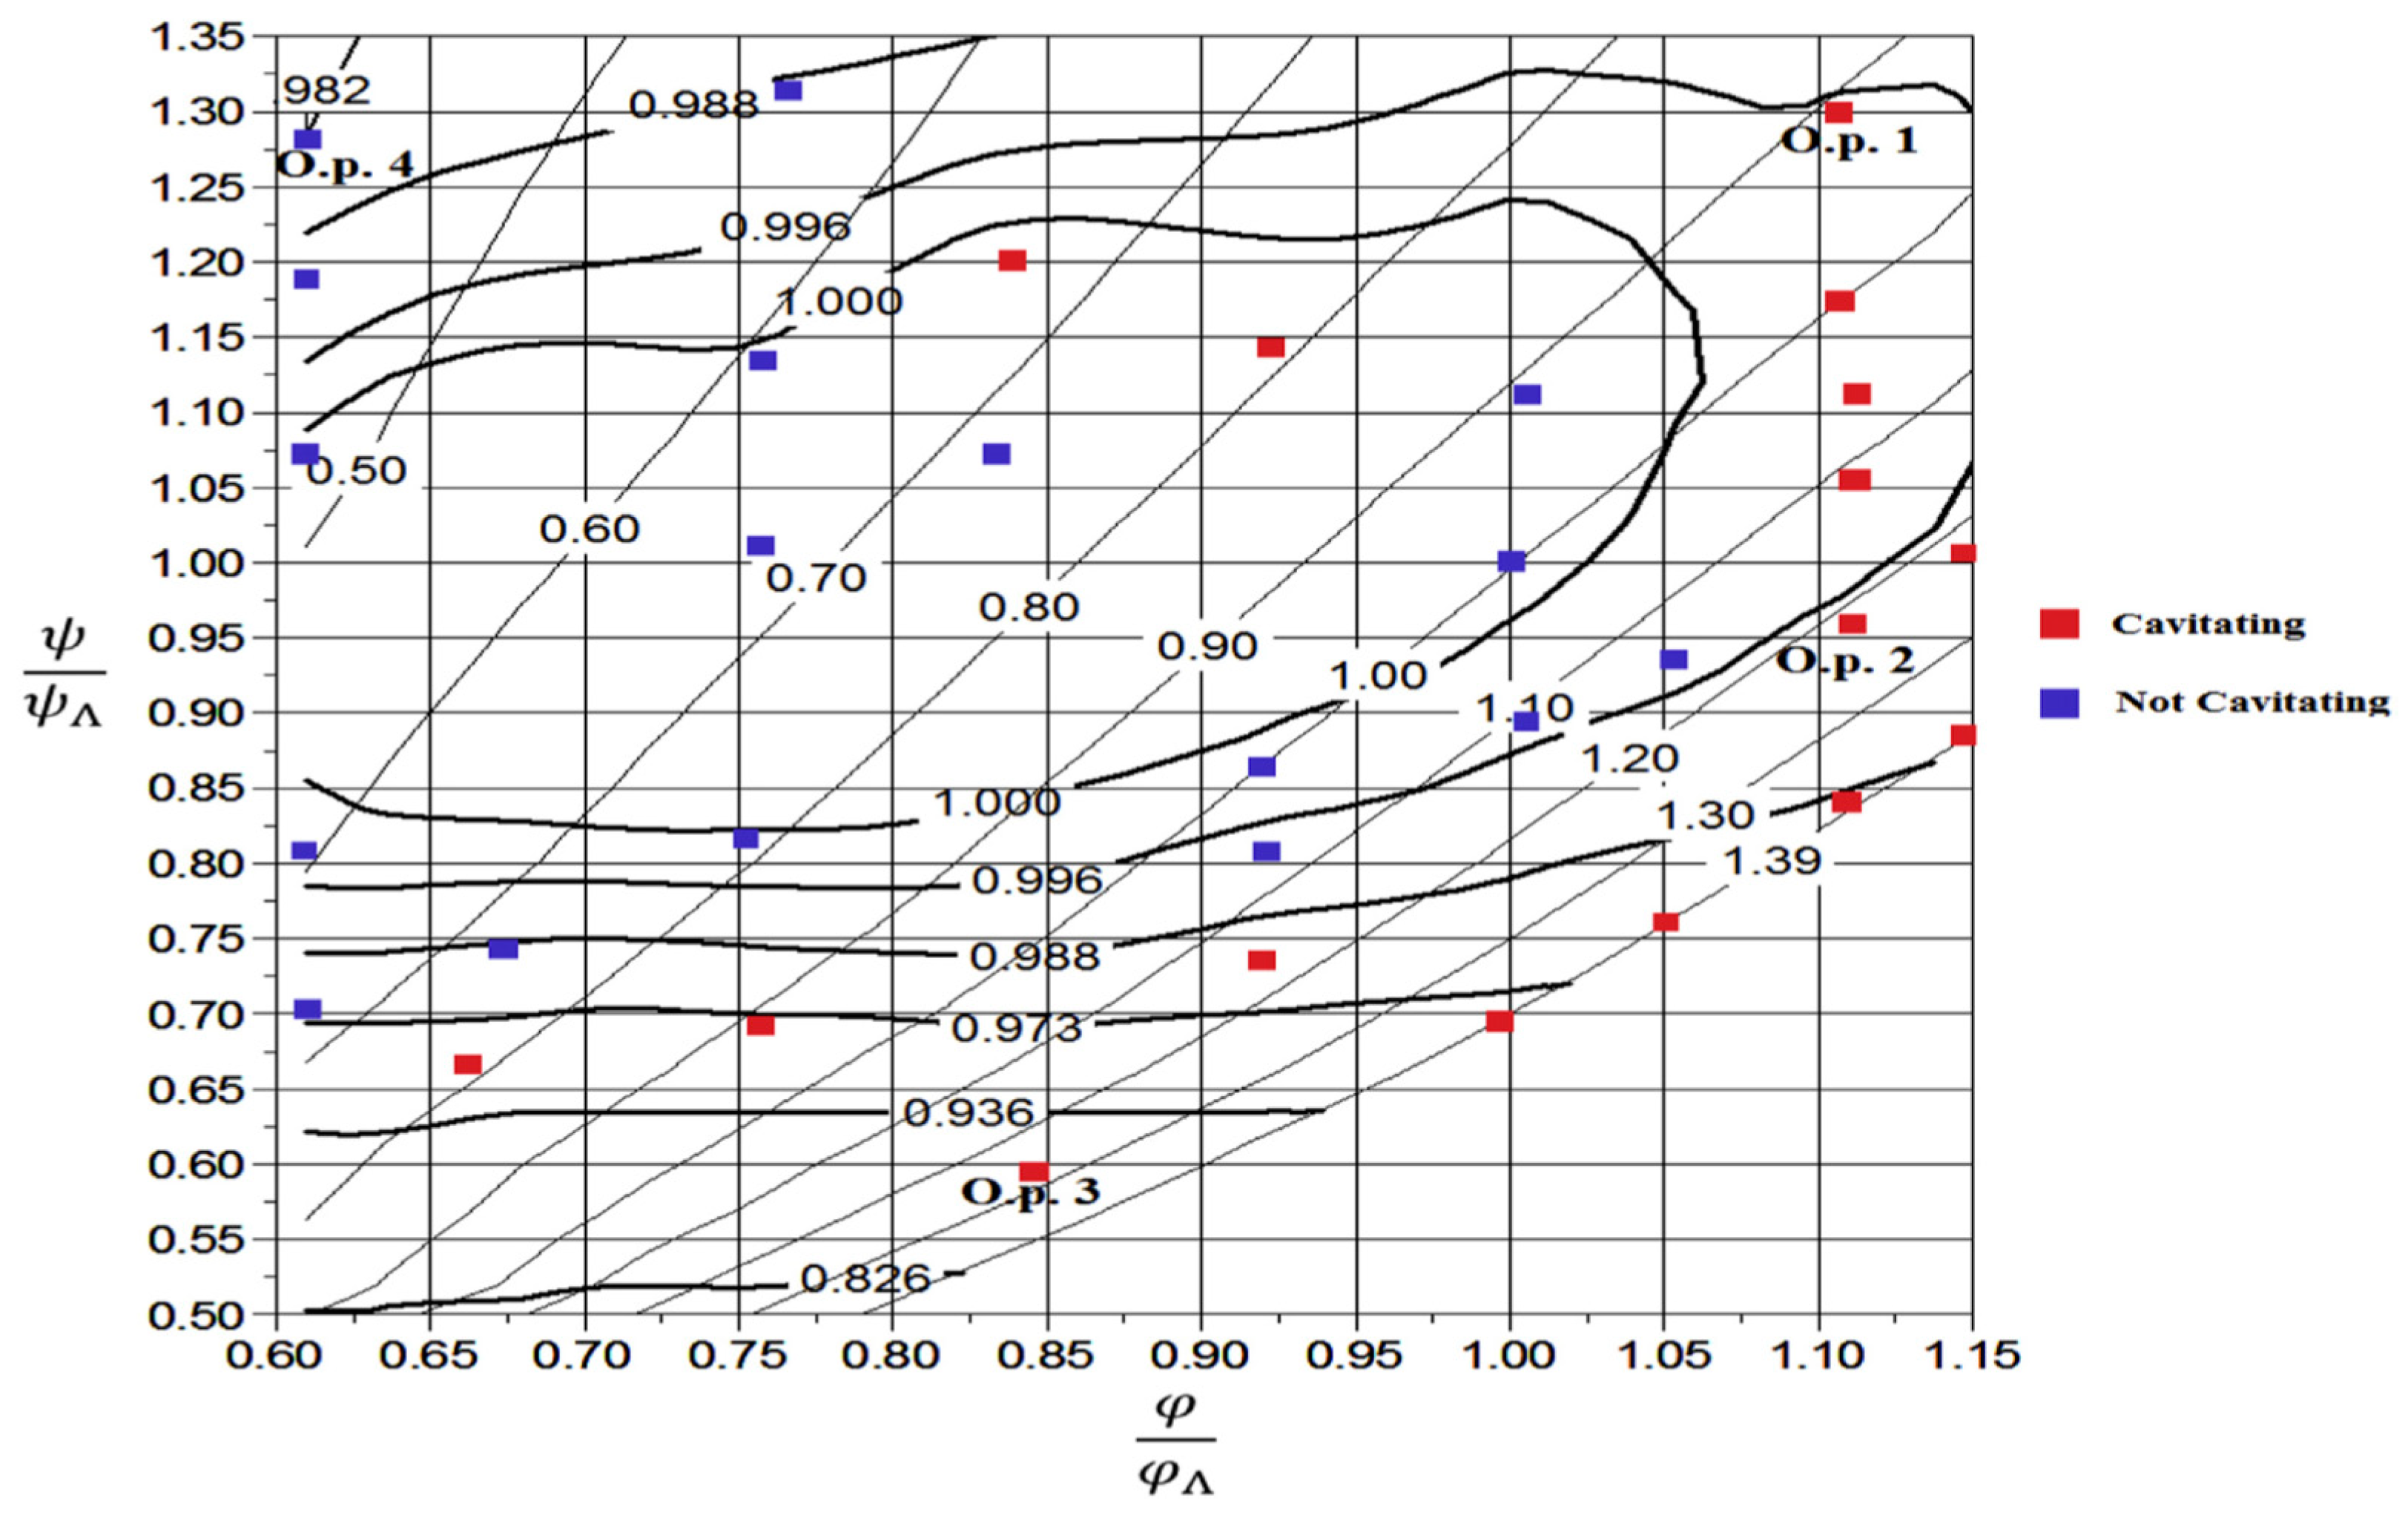
Celebioglu et al. [43] studied the various cavitation types, such as suction side, pressure side, leading edge, travelling bubble, draft tube swirl, and inter-blade vortex cavitation, etc. In order to prevent cavitation, runner blades must be designed, taking the flow characteristics into account. Cavitation caused erosion, reduction in efficiency, vibration, instability of operation, and noise. Simulations were performed for 33 operating points. Cavitation limits and the operating ranges were determined using numerical hill charts to observe the existing and newly designed turbines as shown in Figure 16. To conclude the review in this section [27,28,29,30,31,32,33,34,35,36,37,38,39,40,41,42,43], it is found that cavitation is a complex phenomenon. Table 2 shows summary of some cavitation erosion investigations.Many parameters and features remain to be studied and investigated. Cavitation inducers and some visualization methods like PIV, LDV, etc. are used by numerous researchers as experimental means to study the cavitation erosion phenomenon. In the past decade, CFD has been used extensively and reasonable results have been observed.

4. Experimental and Numerical Investigation for Coalesced Effect of Sediment and Cavitation Erosion

4.1. Introduction

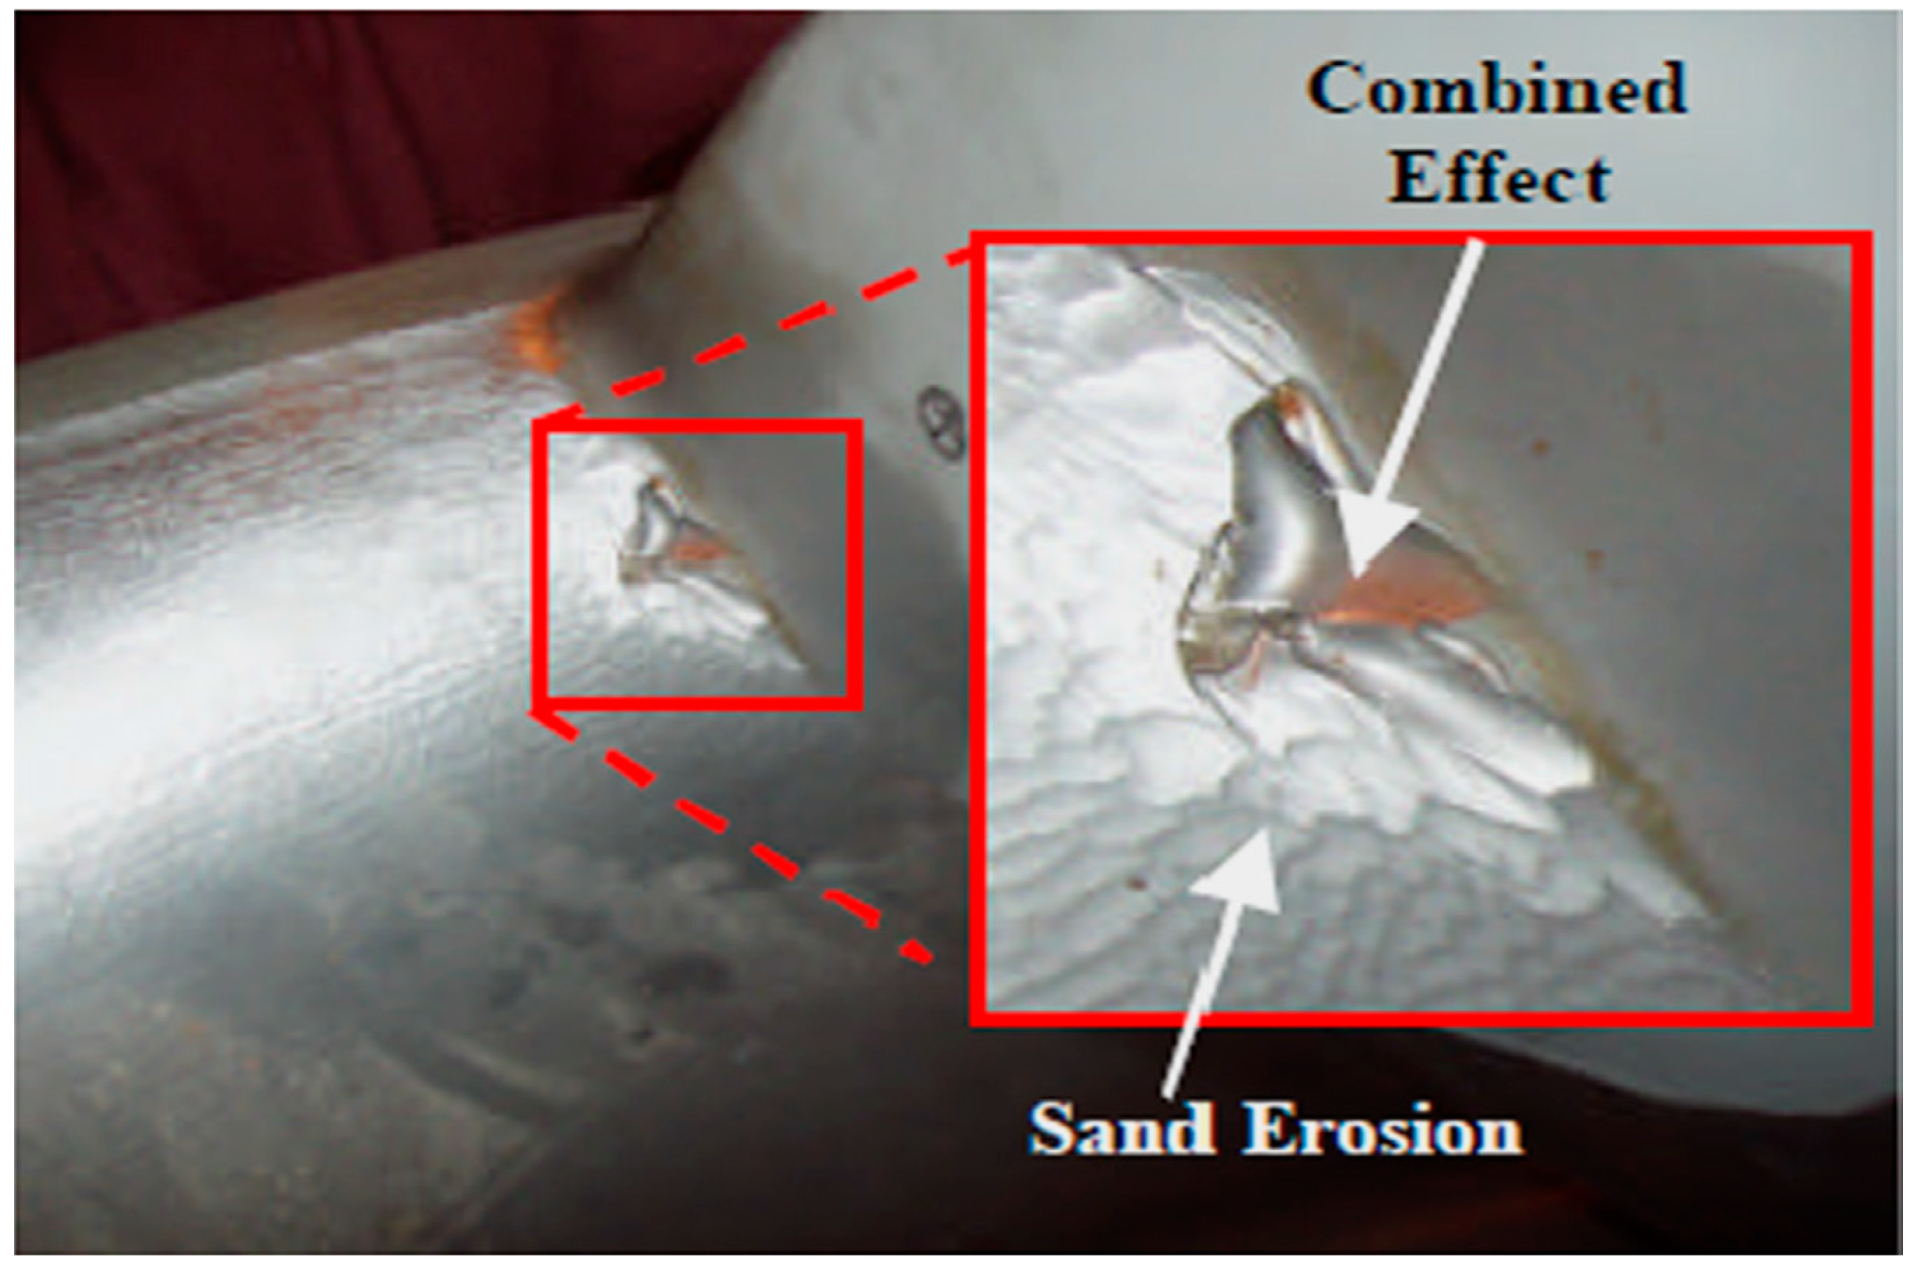
It is very important to identify the regions and components in FT where the coalesced effect of sediment and cavitation erosions take place simultaneously. It means that one problem is both the cause and the effect of another problem. Usually, it is observed at guide vanes and runner blades of a FT where flow velocity is high. As can be seen in Figure 17, the inlet area of FT is observed to be mostly damaged by the coalesced effect, where it touches with the hub and shroud.
Zhang et al. [44] worked on microscopic interactions of particles and cavitation bubbles. It is found that the number of pits is strongly dependent on the particle size. As the particle size increased from 100 nm to 1200 nm, the damage on the sample surface increases with a maximum at 500 nm, and then it decreases. Hu et al. [45] compared the cavitation erosion (CE) in pure water and cavitation-sediment erosion (CSE) in sand suspensions experimentally on 304 stainless steel. The damage was evaluated by mass loss, scanning electron microscopy, roughness, and surface residual stress. The effects of the particles shape and concentrations on the CSE were analyzed.

4.2. Use of Cavitation Inducers

Roa et al. [46] employed the slurry and cavitation erosion tribometers to get information about wear damage. Changes in rotational speed, particle concentration, shape and size of cavitation inducers, etc. were observed. CFD simulations were combined with particle tracking methods which provided an understanding about the contact between the hard particles and the surfaces tested, and its impact over erosion magnitude. Figure 18a shows the tribometer configuration for the conventional slurry pot tester with triangular prismatic bluff bodies as Cavitation Inducers (CIs). Figure 18b shows the boundary conditions for the cavitation and erosion simulations.
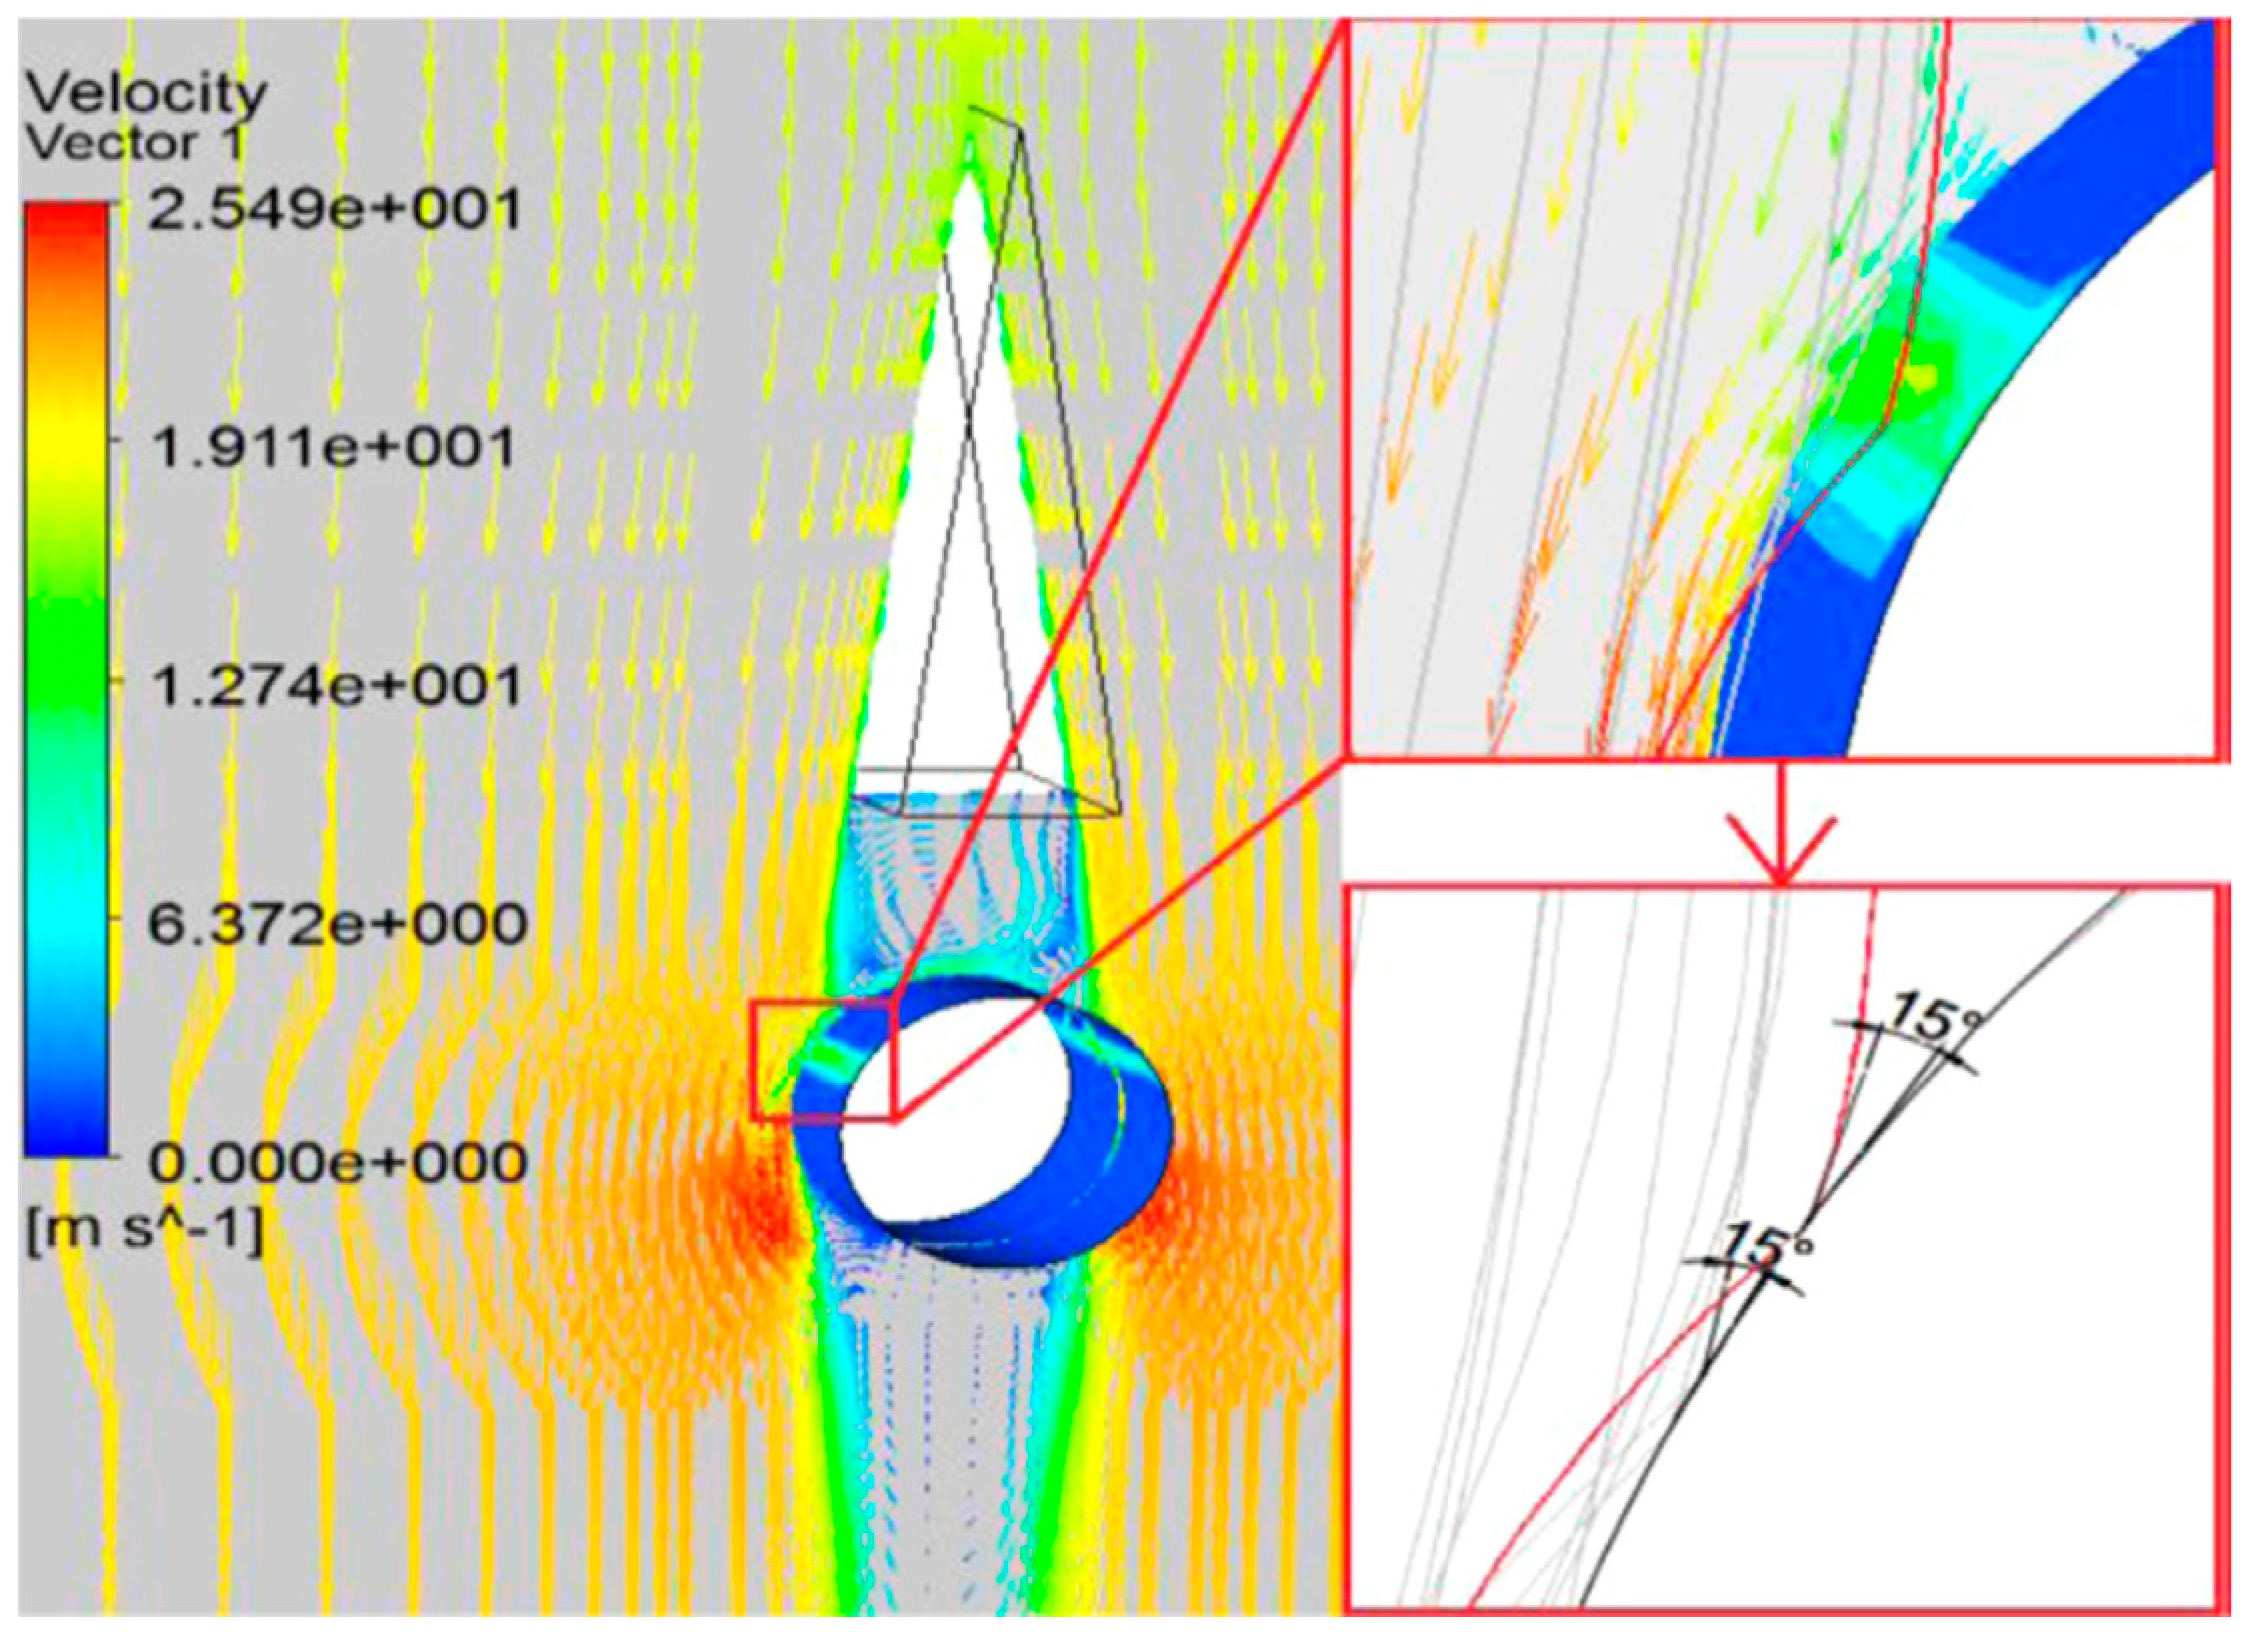
Roa et al. [46] concluded that the sample with a 15° CI and a rotation speed of 3500 rpm yielded wear very similar to wear conditions presented in the leading edge of the FT runner as shown in Figure 19.
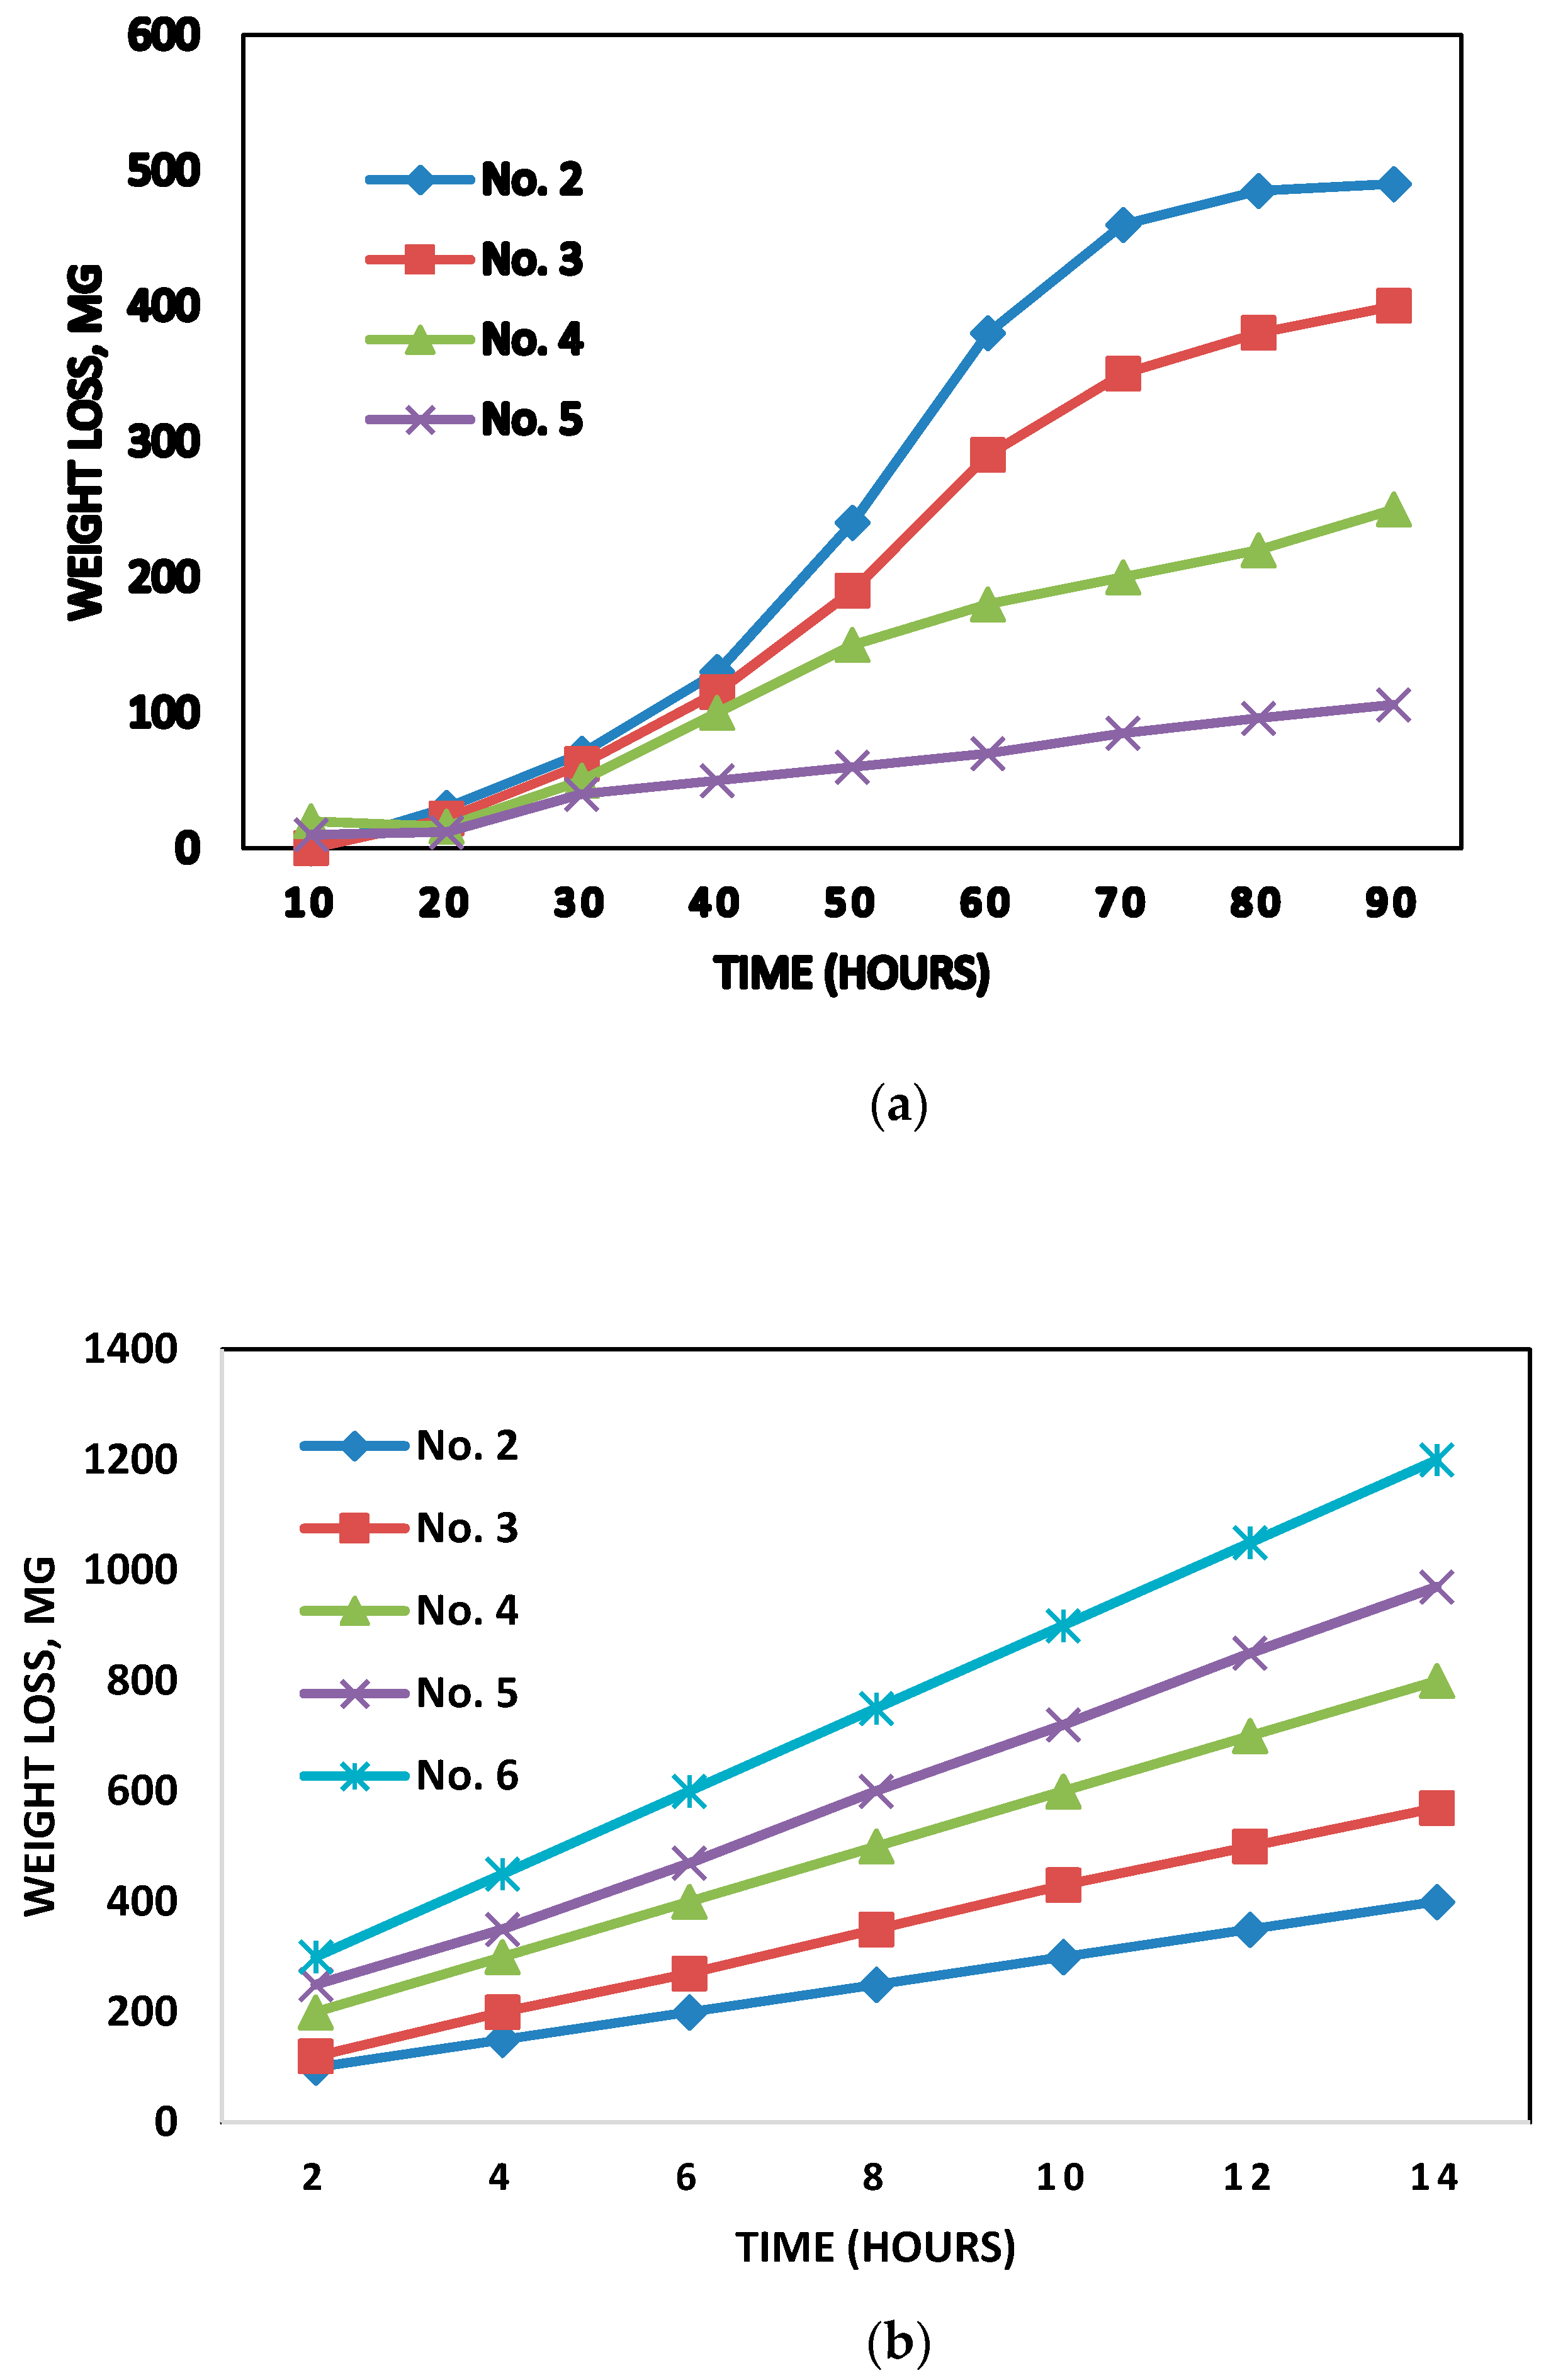
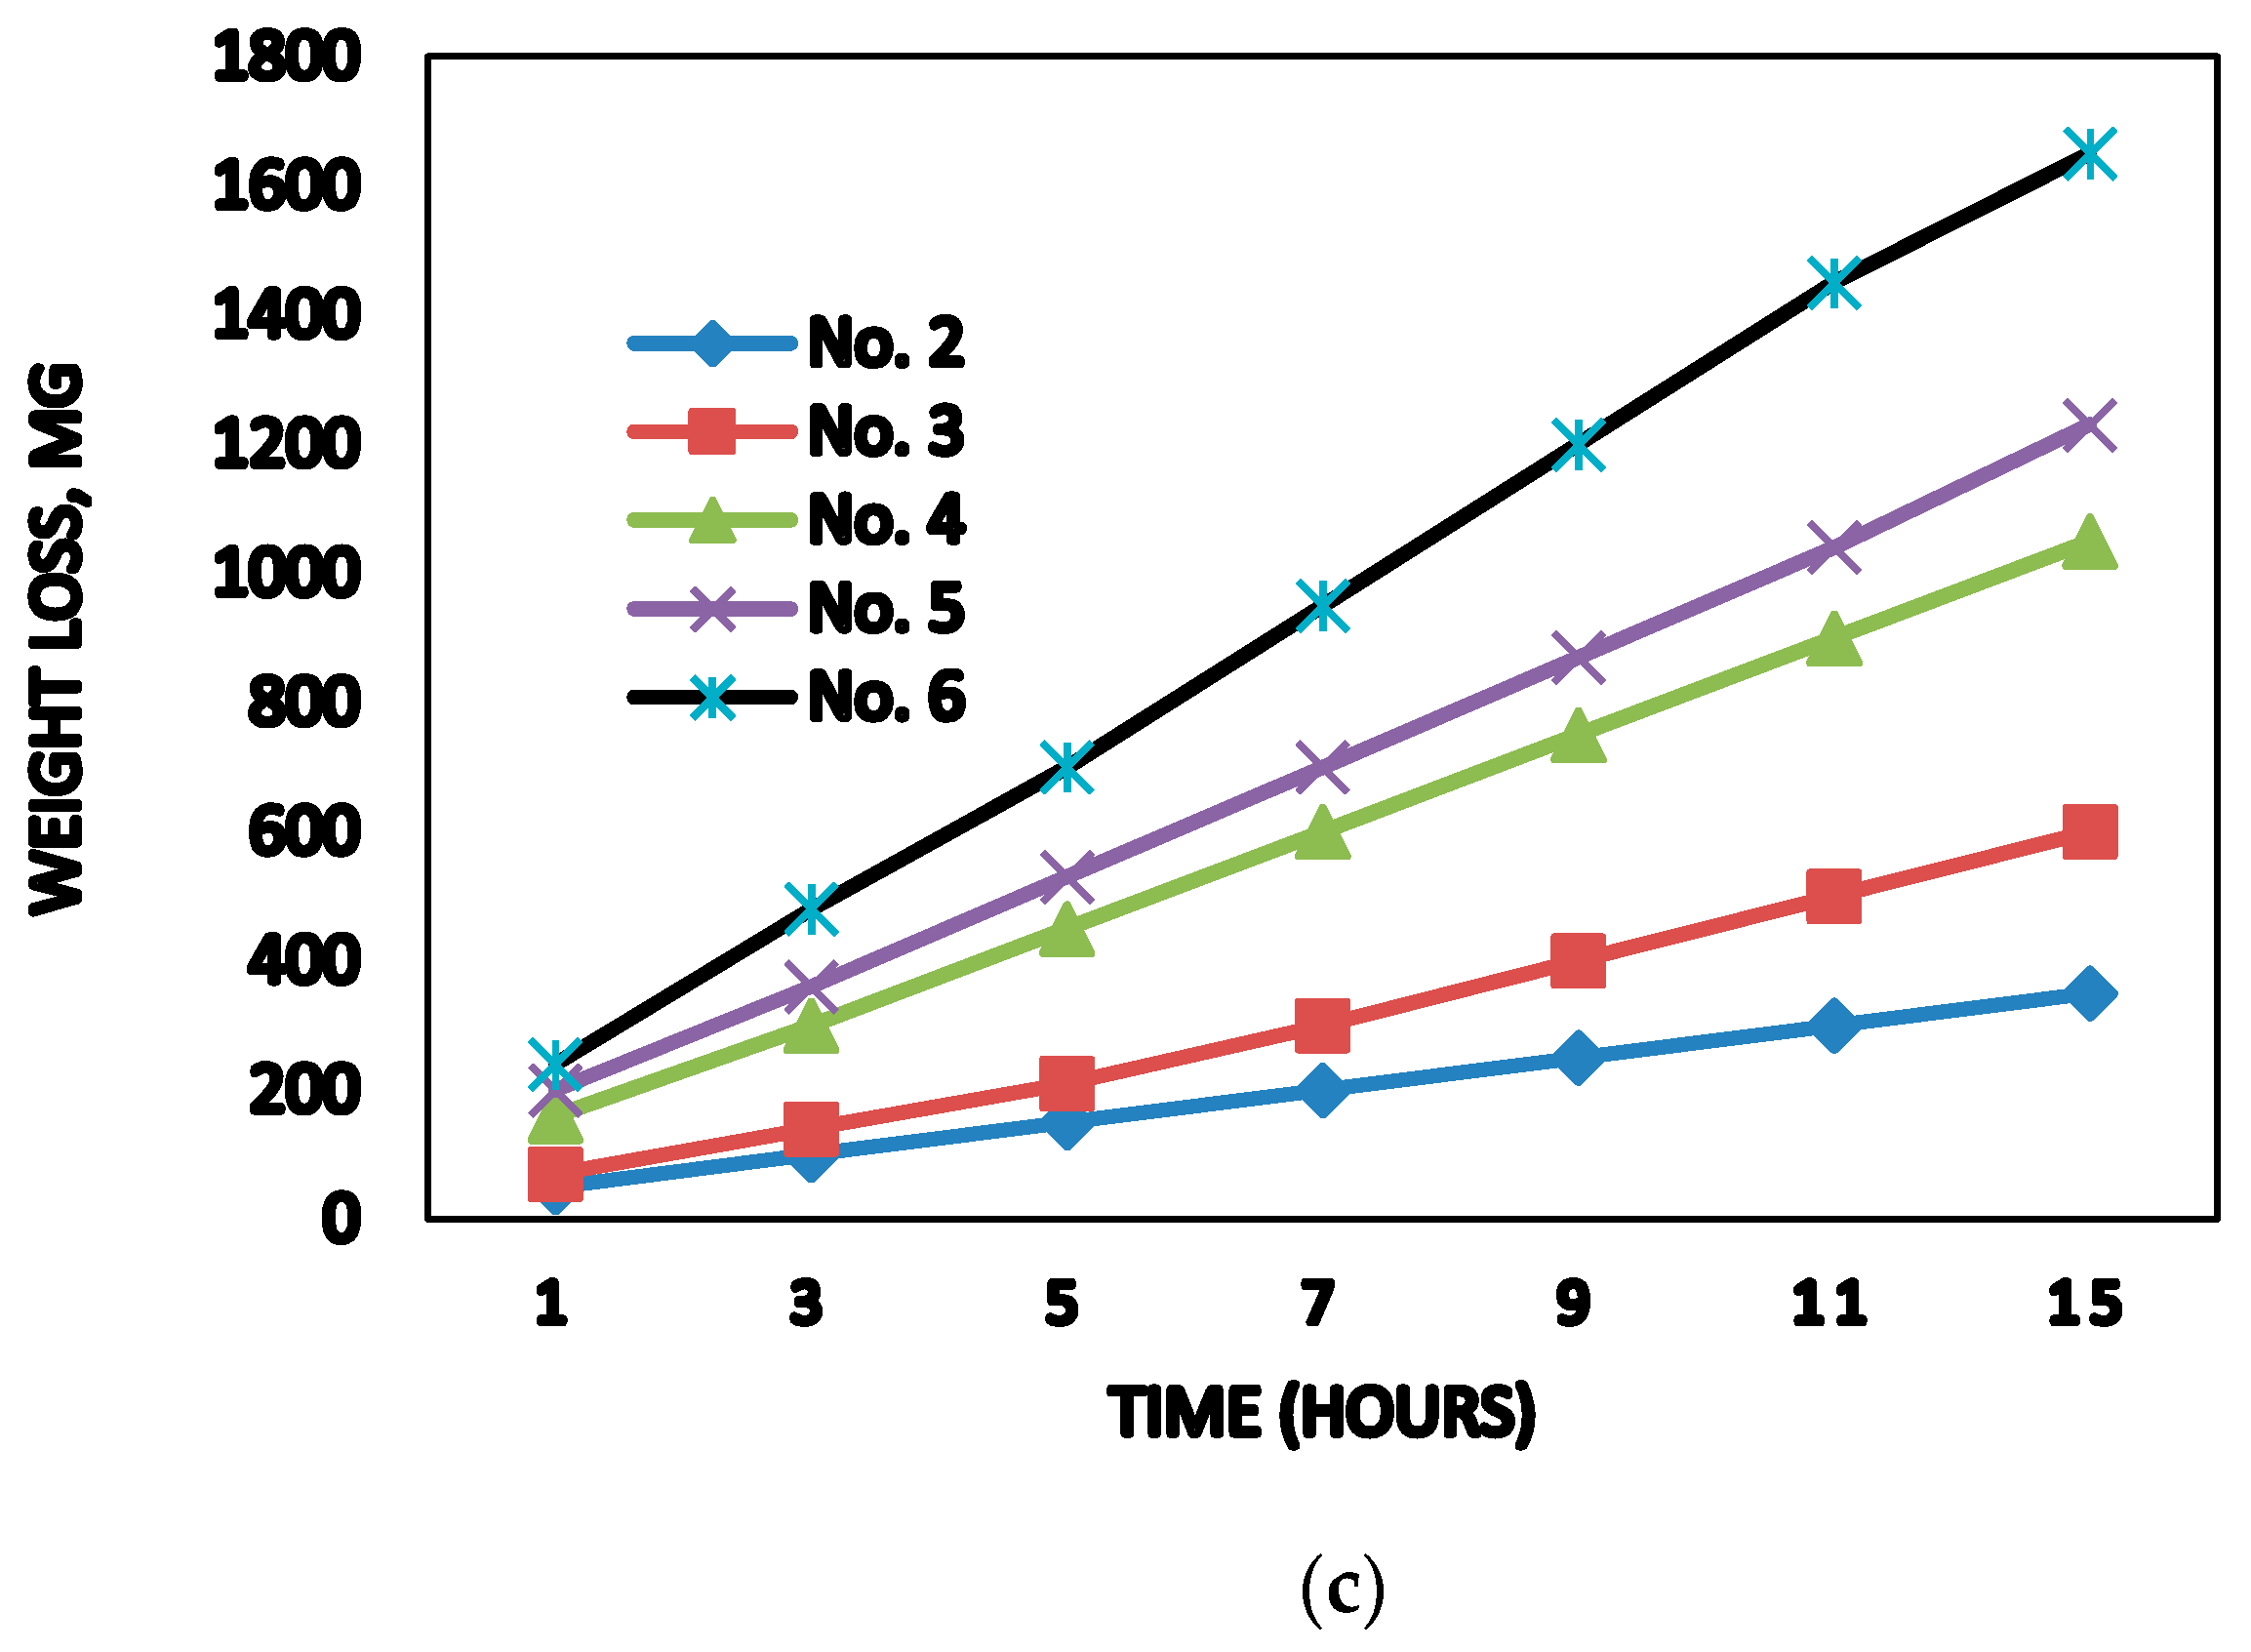
Gohil et al. [47] predicted the weight loss of turbine due to the combined effect of sediment and cavitation erosion in hydro turbines. The erosion wear caused problems in operation and maintenance as well as reduced the plant efficiency, which ultimately leads to financial losses. The curves showing the weight loss due to sediment, cavitation erosion, and coalesced action of sediment and test of erosion due to cavitation for various sample sizes of steel are shown in Figure 20 respectively.
It was observed by Gohil et al. [47] that weight loss was minimum in cavitation erosion, intermediate for the sediment erosion, and maximum for the coalesced effect.
The analysis of the combined and simultaneous effect of sediment and cavitation erosion in FT was a challenging problem for research [44,45,46,47]. There is an opportunity for researchers to work on this demanding area through appropriate CFD methodology supported with validation of experiments.
Trivedi1 and Dahlhaug1 [48] critically reviewed the verification and validation methods applied to the study of hydraulic turbines and they suggested future research directions for the CFD simulation work. Future CFD studies should be focused on dynamic mesh and variable speed. They also addressed that challenges will increase when a coupled research of the transient CFD and FSI (fluid-structure interaction) is required. A well-established guide to perform CFD studies for hydraulic turbines, including proper verification and validation for FSI, is an urgent need.

5. Current Status and Future Prospects

This paper covers research work done during last decade on the sediment and cavitation erosions by various researchers. For future work, following research areas can be addressed:
Coalesced Effect: It is essential to identify the locations where combined or simultaneous effect of sediment and cavitation erosion can occur. Comparison can be made on the basis of material degradation and efficiency losses between combined and individual effects.
Optimization studies: Operating parameters like head values, discharge values, best efficiency point, etc. and geometric parameters such as blade angles and blade thickness, hub, and shroud radii, etc. can be optimized through robust algorithms.
Experimental work:
  • Appropriate testing time should be utilized in which the true behavior of erosion can be obtained during the experiments. It is possible to “speed up” the events in the model which may occur over a relatively long time in the prototype by utilizing the time scales appropriately.
  • Selection of suitable similarity formulae and conditions, such as dynamic, kinematic, and geometric similarity requirements should all be satisfied.
  • Avoid using distorted models, and if they are utilized, interpretation of the results should be done carefully.

6. Conclusions

Both experimental and numerical studies for sediment and cavitation erosion have been critically analyzed. In some studies, the coalesced effect of both erosion phenomena are discussed. The following are the conclusions drawn in this review paper:
  • Sediment erosion severely damages turbine parts in hydroelectric power plants. It is observed that the size, shape, and concentration of sediment particles are important erosion parameters. Water flowrate and head are significant flow properties. Surface of the erodent is yet another important parameter. Sediment erosion not only deteriorates the surface of the turbine components, but it also causes efficiency loss and high maintenance cost is required periodically. The technology advancements have led to extensive use of computational tools for solving sediment erosion problems.
  • Cavitation inducers and some latest visualization techniques like PIV, LDV etc. are used by several researchers as experimental means to study the cavitation phenomena. In the last decade, numerical methodology has been used extensively and tangible results have been achieved.
  • Study of the coalesced effect of sediment and cavitation erosion in hydroelectric power turbines is a challenging issue for future research. Therefore, it is recommended to develop an appropriate CFD methodology validated through experimental techniques for the quantification of combined effect.

Author Contributions

Conceptualization, methodology, formal analysis, and original draft preparation by A.A.N., and M.-H.K. supervised the research and edited the manuscript. All authors have read and agreed to the published version of the manuscript.

Funding

This research received no external funding.

Institutional Review Board Statement

Not applicable.

Informed Consent Statement

Not applicable.

Data Availability Statement

Data are contained within the article.

Conflicts of Interest

The authors declare no conflict of interest.

References

  1. Khan, N.M.; Hameed, A.; Qazi, A.U.; Sharif, M.B.; Tingsanchali, T. Significance and sustainability of freshwater reservoirs: Case study of Tarbela dam. Pak. J. Sci. 2011, 63, 213–218. [Google Scholar]
  2. Petkovsek, G.; Roca, M. Impact of reservoir operation on sediment deposition. Proc. ICE Water Manag. 2014, 167, 577–584. [Google Scholar] [CrossRef] [Green Version]
  3. Jia, J. A Technical Review of Hydro-Project Development in China. Engineering 2016, 2, 302–312. [Google Scholar] [CrossRef] [Green Version]
  4. Abid, M.; Siddiqui, M. Multiphase Flow Simulations through Tarbela Dam Spillways and Tunnels. J. Water Resour. Prot. 2010, 2, 532–539. [Google Scholar] [CrossRef] [Green Version]
  5. Abid, M.; Noon, A.A. Turbulent Flow Simulations through Tarbela Dam Tunnel-2. J. Eng. 2010, 2, 507–515. [Google Scholar] [CrossRef]
  6. Thapa, B.S.; Thapa, B.; Dahlhaug, O.G. Empirical modelling of sediment erosion in Francis turbines. Energy 2012, 41, 386–391. [Google Scholar] [CrossRef]
  7. Koirala, R.; Thapa, B.; Neopane, H.P.; Zhu, B.; Chhetry, B. Sediment erosion in guide vanes of Francis turbine: A case study of Kaligandaki Hydropower Plant, Nepal. Wear 2016, 362–363, 53–60. [Google Scholar] [CrossRef]
  8. Goyal, R.; Gandhi, B.K. Review of hydrodynamics instabilities in Francis turbine during off-design and transient operations. Renew. Energy 2018, 116, 697–709. [Google Scholar] [CrossRef]
  9. Tomaz, R. An Investigation of the Relationship between Acoustic Emission, Vibration, Noise and Cavitation Structures on a Kaplan Turbine. J. Fluids Eng. 2007, 129, 1112–1122. [Google Scholar]
  10. Chitrakar, S.; Singh, B.; Gunnar, O.; Prasad, H. Numerical and experimental study of the leakage flow in guide vanes with different hydrofoils. J. Comput. Des. Eng. 2017, 4, 218–230. [Google Scholar] [CrossRef]
  11. Rao, P.; Buckley, D.H. Predictive capability of long-term cavitation and liquid impingement erosion models. Wear 1984, 94, 259–274. [Google Scholar] [CrossRef]
  12. Rajkarnikar, B.; Neopane, H.P.; Thapa, B.S. Development of rotating disc apparatus for test of sediment-induced erosion in francis runner blades. Wear 2013, 306, 119–125. [Google Scholar] [CrossRef]
  13. Chitrakar, S.; Neopane, H.P.; Dahlhaug, O.G. Study of the simultaneous effects of secondary flow and sediment erosion in Francis turbines. Renew. Energy 2016, 97, 881–891. [Google Scholar] [CrossRef]
  14. Ghenaiet, A. Prediction of Erosion Induced By Solid Particles in a Water Turbine. In Proceedings of the 11th European Conference Turbomachinery Fluids Daynamics and Thermodynamics, Madrid, Spain, 23–27 March 2015; pp. 1–13. [Google Scholar]
  15. Koirala, R.; Prasad, H.; Shrestha, O.; Zhu, B.; Thapa, B. Selection of guide vane pro file for erosion handling in Francis turbines. Renew. Energy 2017, 112, 328–336. [Google Scholar] [CrossRef]
  16. Javaheri, V.; Portera, D.; Kuokkalab, V.-T. Slurry erosion of steel—Review of tests, mechanisms and materials. Wear 2018, 408–409, 248–273. [Google Scholar] [CrossRef]
  17. Noon, A.A.; Kim, M.-H. Erosion wear on Francis turbine components due to sediment flow. Wear 2017, 378–379, 126–135. [Google Scholar] [CrossRef]
  18. Eltvik, M. Sediment Erosion in Francis Turbines. Ph.D. Thesis, NTNU, Trondheim, Norway, 2013. [Google Scholar]
  19. Alveyro, L.; Jose, F.; Aida, S. Performance improvement of a 500-kW Francis turbine based on CFD. Renew. Energy 2016, 96, 977–992. [Google Scholar]
  20. Aponte, R.; Teran, L.; Ladino, J.; Larrahondo, F.; Coronado, J.; Rodríguez, S. Computational study of the particle size effect on a jet erosion wear device. Wear 2017, 374–375, 97–103. [Google Scholar] [CrossRef]
  21. Kocak, E.; Karaaslan, S.; Yucel, N.; Arundas, F. A Numerical Case Study: Bovet Approach to Design a Francis Turbine Runner. Energy Procedia 2017, 111, 885–894. [Google Scholar] [CrossRef]
  22. Liu, X.; Luo, Y.; Karney, B.W.; Wang, W. A selected literature review of efficiency improvements in hydraulic turbines. Renew. Sustain. Energy Rev. 2015, 51, 18–28. [Google Scholar] [CrossRef]
  23. Maruzewski, P.; Hasmatuchi, V.; Mombelli, H.-P.; Burggraeve, D.; Iosfin, J.; Finnegan, P.; Avellan, F. Surface Roughness Impact on Francis Turbine Performances and Prediction of Efficiency Step Up. Int. J. Fluid Mach. Syst. 2009, 2, 353–362. [Google Scholar] [CrossRef]
  24. Khanal, K.; Neopane, H.P.; Rai, S.; Thapa, M.; Bhatt, S.; Shrestha, R. A methodology for designing Francis runner blade to find minimum sediment erosion using CFD. Renew. Energy 2016, 87, 307–316. [Google Scholar] [CrossRef]
  25. Chitrakar, S. FSI Analysis of Francis Turbines Exposed to Sediment Erosion FSI Analysis of Francis Turbines Exposed to Sediment Erosion. Master’s Thesis, KTH, Stockholm, Sweden, July 2013. [Google Scholar]
  26. Müller, A.; Favrel, A.; Landry, C.; Avellan, F. Fluid–structure interaction mechanisms leading to dangerous power swings in Francis turbines at full load. J. Fluids Struct. 2017, 69, 56–71. [Google Scholar] [CrossRef]
  27. Jain, S.V.; Patel, R.N. Investigations on pump running in turbine mode: A review of the state-of-the-art. Renew. Sustain. Energy Rev. 2014, 30, 841–868. [Google Scholar] [CrossRef]
  28. Ghiban, B.; Safta, C.-A.; Ion, M.; Crângașu, C.E.; Grecu, M.-C. Structural Aspects of Silt Erosion Resistant Materials Used in Hydraulic Machines Manufacturing. Energy Procedia 2017, 112, 75–82. [Google Scholar] [CrossRef]
  29. Amarendra, H.J.; Chaudhari, G.P.; Nath, S.K. Synergy of cavitation and slurry erosion in the slurry pot tester. Wear 2012, 290–291, 25–31. [Google Scholar] [CrossRef]
  30. Haosheng, C.; Jiadao, W.; Darong, C. Cavitation damages on solid surfaces in suspensions containing spherical and irregular microparticles. Wear 2008, 126, 1–4. [Google Scholar] [CrossRef]
  31. Franc, J.-P.; Riondet, M.; Karimi, A.; Chahine, G.L. Material and velocity effects on cavitation erosion pitting. Wear 2012, 274-275, 248–259. [Google Scholar] [CrossRef]
  32. Pereira, J.G.; Andolfatto, L.; Avellan, F. Monitoring a Francis turbine operating conditions. Flow Meas. Instrum. 2018, 63, 37–46. [Google Scholar] [CrossRef]
  33. Thapa, B.S.; Dahlhaug, O.G.; Thapa, B. Flow measurements around guide vanes of Francis turbine: A PIV approach. Renew. Energy 2018, 126, 177–188. [Google Scholar] [CrossRef]
  34. Venturini, M.; Manservigi, L.; Alvisi, S.; Simani, S. Development of a physics-based model to predict the performance of pumps as turbines. Appl. Energy 2018, 231, 343–354. [Google Scholar] [CrossRef]
  35. Gohil, P.; Saini, R. Indian Institute of Technology Roorkee Numerical Study of Cavitation in Francis Turbine of a Small Hydro Power Plant. J. Appl. Fluid Mech. 2016, 9, 357–365. [Google Scholar]
  36. Sreedhar, B.; Albert, S.; Pandit, A. Cavitation damage: Theory and measurements—A review. Wear 2017, 372–373, 177–196. [Google Scholar] [CrossRef]
  37. Iliescu, M.S.; Ciocan, G.D.; Avellan, F. Analysis of the Cavitating Draft Tube Vortex in a Francis Turbine Using Particle Image Velocimetry Measurements in Two-Phase Flow. J. Fluids Eng. 2008, 130, 1–10. [Google Scholar] [CrossRef]
  38. Arispe, T.M.; Oliveira, W.; Ramirez, R.G. Francis turbine draft tube parameterization and analysis of performance characteristics using CFD techniques. Renew. Energy 2018, 127, 114–124. [Google Scholar] [CrossRef]
  39. Mohanta, R.K.; Chelliah, T.R.; Allamsetty, S.; Akula, A.; Ghosh, R. Sources of vibration and their treatment in hydro power stations—A Review. Eng. Sci. Technol. Int. J. 2017, 20, 637–648. [Google Scholar] [CrossRef] [Green Version]
  40. Kang, Z.; Feng, C.; Liu, Z.; Cang, Y.; Gao, S. Analysis of the incipient cavitation noise signal characteristics of hydroturbine. Appl. Acoust. 2017, 127, 118–125. [Google Scholar] [CrossRef]
  41. Zhang, Y.; Liu, K.; Xian, H.; Du, X. A review of methods for vortex identification in hydroturbines. Renew. Sustain. Energy Rev. 2018, 81, 1269–1285. [Google Scholar] [CrossRef]
  42. Kc, A.; Thapa, B.; Lee, Y. Transient numerical analysis of rotor e stator interaction in a Francis turbine. Renew. Energy 2014, 65, 227–235. [Google Scholar] [CrossRef]
  43. Celebioglu, K.; Altintas, B.; Aradag, S.; Tascioglu, Y. Numerical research of cavitation on Francis turbine runners. Int. J. Hydrogen Energy 2017, 43, 1–11. [Google Scholar] [CrossRef]
  44. Zhang, Y.; Qian, Z.; Ji, B.; Wu, Y. A review of microscopic interactions between cavitation bubbles and particles in silt-laden flow. Renew. Sustain. Energy Rev. 2016, 56, 303–318. [Google Scholar] [CrossRef]
  45. Hu, H.X.; Zheng, Y.G. The effect of sand particle concentrations on the vibratory cavitation erosion. Wear 2017, 384–385, 95–105. [Google Scholar] [CrossRef]
  46. Roa, C.; Munoz, J.; Teran, L.; Valdes, J.; Rodriguez, S.; Coronado, J.; Ladino, A. Effect of tribometer configuration on the analysis of hydromachinery wear failure. Wear 2015, 332–333, 1164–1175. [Google Scholar] [CrossRef]
  47. Gohil, P.P.; Saini, R. Coalesced effect of cavitation and silt erosion in hydro turbines—A review. Renew. Sustain. Energy Rev. 2014, 33, 280–289. [Google Scholar] [CrossRef]
  48. Trivedi, C.; Dahlhaug, O. A Comprehensive Review of Verification and Validation Techniques Applied to Hydraulic Turbines. Int. J. Fluid Mach. Syst. 2019, 12, 345–367. [Google Scholar] [CrossRef]
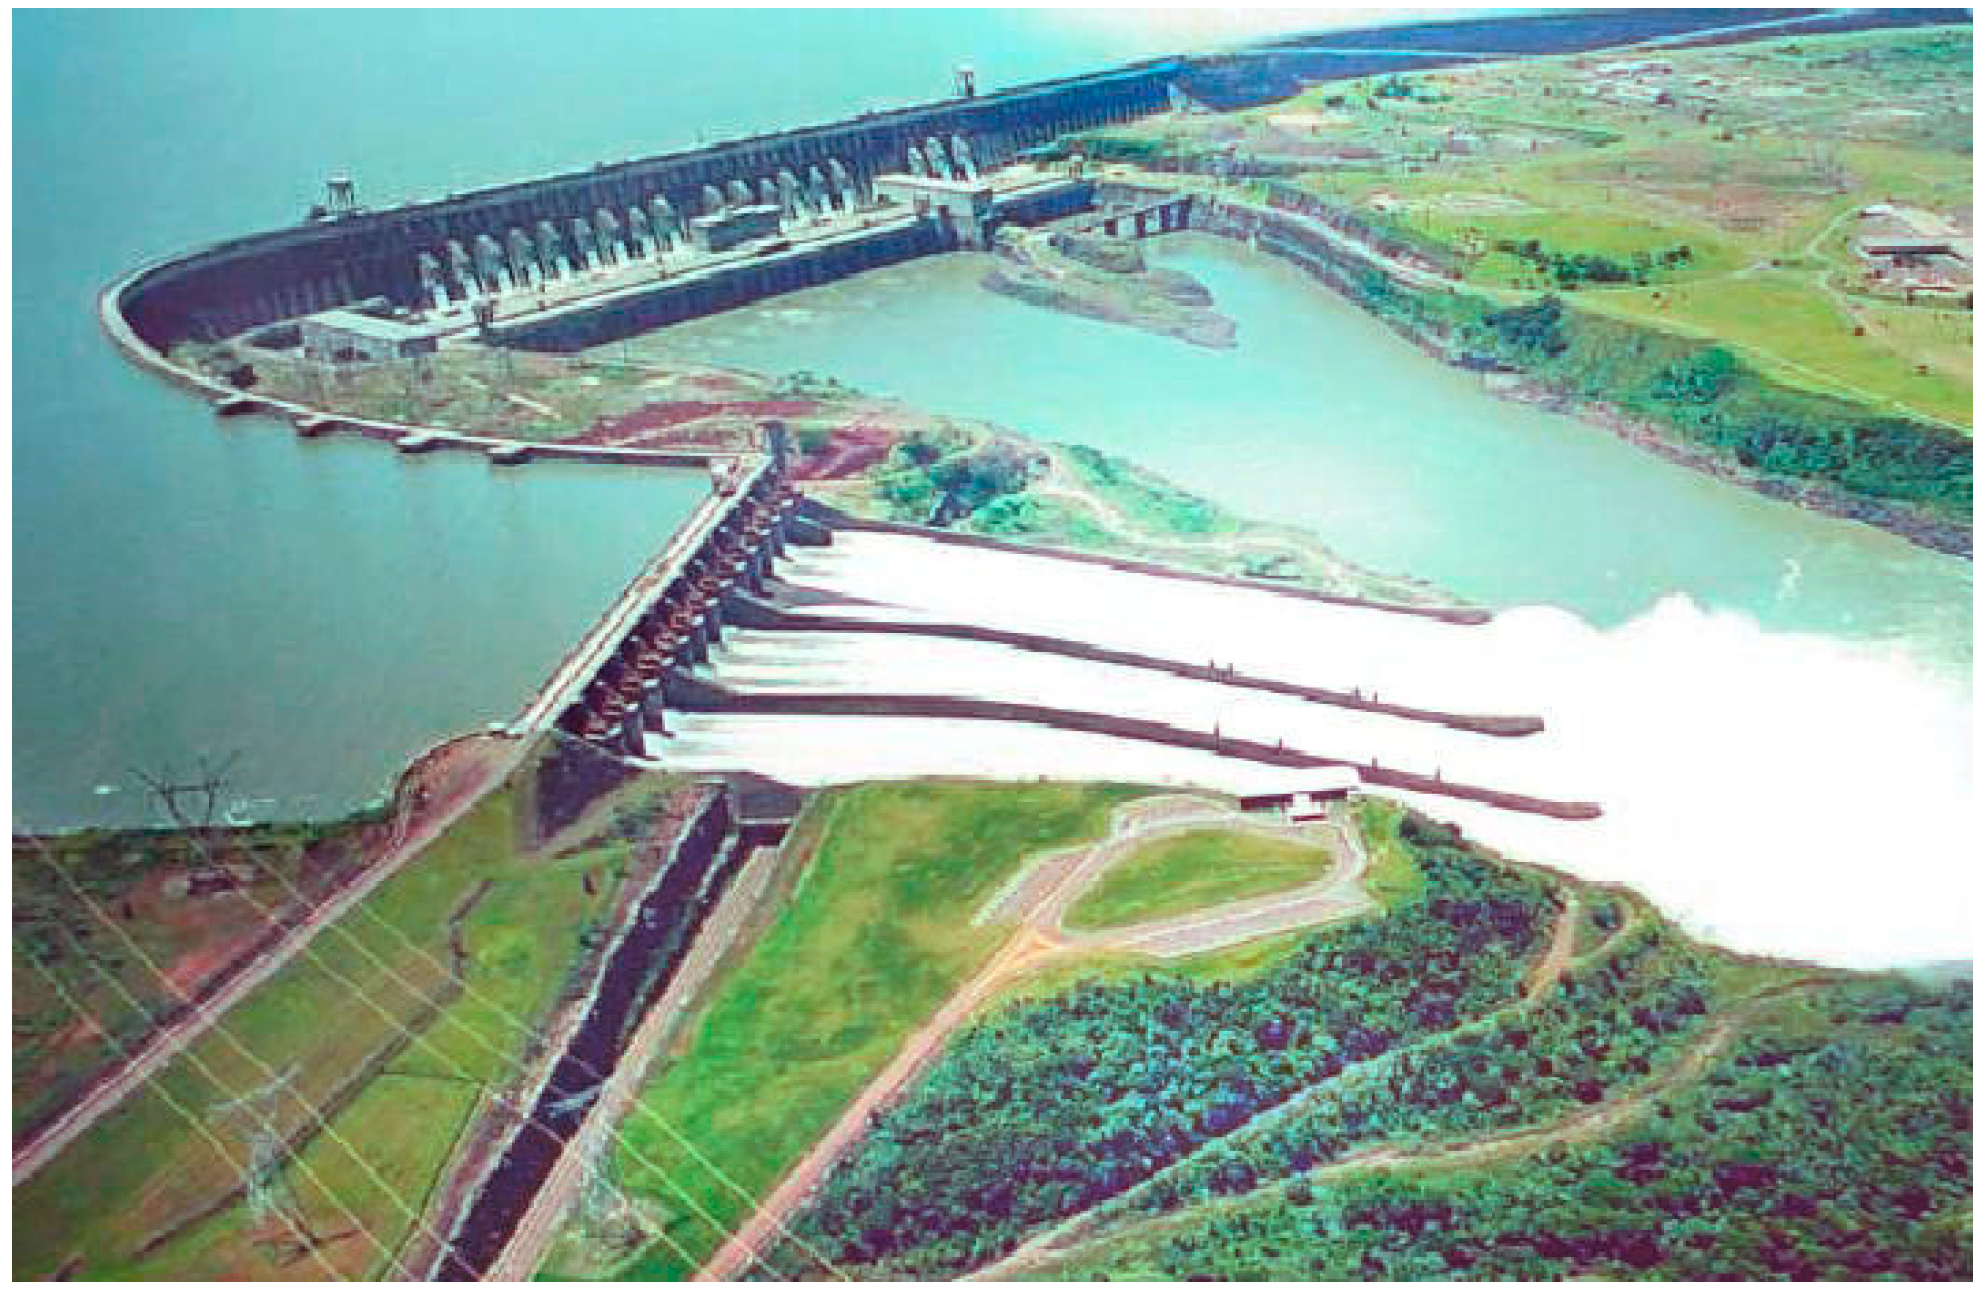
Figure 1. Itaipu Dam, Brazil.
Energies 14 01516 g001
Figure 2. Number of dams higher than 30 m in major countries [3].
Energies 14 01516 g002
Figure 3. Aerial view of Tarbela Dam Hydroelectric Project [5].
Energies 14 01516 g003
Figure 4. (a) Rotating disc apparatus (RDA) apparatus; (b) apparatus components; (c) erosion behavior observed on the blade [13].
Energies 14 01516 g004
Figure 5. Inlet velocity triangle at Best Efficiency Point (BEP) [15].
Energies 14 01516 g005
Figure 6. Guide vanes with covers, (a) at actual site, (b) erosion rate density profile [13].
Energies 14 01516 g006
Figure 7. Runner at Tarbela dam hydroelectric project (TDHP), (a) at actual site, (b) erosion rate density profile [17].
Energies 14 01516 g007
Figure 8. Turbine efficiency measurements at TDHP [17].
Energies 14 01516 g008
Figure 9. Erosion rate behavior for different particle sizes [20].
Energies 14 01516 g009
Figure 10. Stress distribution on the blade from two-way FSI [25].
Energies 14 01516 g010
Figure 11. Different flow domains of PAT.
Energies 14 01516 g011
Figure 12. Cumulative mass loss as a function of test duration without and with the cavitation inducers [29].
Energies 14 01516 g012
Figure 13. Pressure variation on runner (a) for rated load, (b) for overload condition [35].
Energies 14 01516 g013
Figure 14. Vapor core rope development for σ = 0.380 [41].
Energies 14 01516 g014
Figure 15. Pressure recording locations in spiral casing, runner blade, and draft tube [42].
Energies 14 01516 g015
Figure 16. Hill chart for showing cavitation and non-cavitation operating points [43].
Energies 14 01516 g016
Figure 17. Damaged location of turbine runner with sand erosion and combined influence demarcated.
Energies 14 01516 g017
Figure 18. (a) Tribometer configuration, (b) boundary conditions: slurry pot tester cavitation and erosion simulation [46].
Energies 14 01516 g018
Figure 19. Velocity profile and sand particles angle of attack on the sample with 15° Cavitation Inducers (CI) and 3500 rpm in the tribometer [46].
Energies 14 01516 g019
Figure 20. (a) Weight loss curves for the cavitation; (b) weight loss curves of the sediment erosion; (c) weight loss curves for the coalesced effect [47].
Energies 14 01516 g020aEnergies 14 01516 g020b
Table 1. Erosion models list for hydroelectric power turbines developed by various researchers.
ModelEquationParameters
Thapa et al. [6] E r = C . K h a r d n e s s K s h a p e K m K f . a ( s i z e ) b Km = the material factor and Kf = the flow factor
C = silt concentration kg/m3
Kshape and Khardness = shape and hardness factors respectively.
Rajkarnikar et al. [12] e = W 0 W i W 0 × 100 ei = cumulative erosion after test i in mg/gm, W0 is weight of test specimen at the beginning of the experiment in gm, Wi is weight of test specimen after test i in gm.
Teran et al. [16] E r = E   N   m p E = Dimensionless mass loss, N is the rate of number of particles, mp is average particle mass.
Aponte et al. [20] N E = E r V j A 0 ρ H 2 O ( C 1 C ) NE is the dimensionless normalized erosion, Er is the erosion rate in kg/s, Vj is the average velocity of jet in m/s, A0 is the jet outlet cross-sectional area, C is concentration of sand, and ρH2O is density of water in kg/m3.
Table 2. Summary of some investigations on cavitation erosion.
InvestigatorsDetails of Tests/ModelsMajor Conclusions
Franc et al. [31] N = 8 π δ 2 τ e ( 2 D / δ ) Cavitation rate depends on: pitting rate, coverage rate, and depth of deformation rate
Gohil et al. [35] m c a v ˙ = 0.0081536   T 0.9726 H s 0.3573 V 4.9927 η l o s s c a v = 1.4550   T 0.2247 H s 0.1724 V 5.1779 e [ 3.2497   ( l n V ) 2 ] Correlations developed for cavitation rate and normalized efficiency loss, useful for the plant operators. To predict the degradation rate of performance.
Celebioglu et al. [43] ψ = 2 g H ω 2 R 2 φ = Q π ω R 3 Head coefficient and discharge coefficients are used to plot a numerical hill chart. The methodology developed for the minimization of cavitation at off-design. The cavitation limit is determined by using the cavitating and non-cavitating operating points.
Publisher’s Note: MDPI stays neutral with regard to jurisdictional claims in published maps and institutional affiliations.