Article

Studies on the Impact of Hydrogen on the Results of THT Measurement Devices

Oil and Gas Institute—National Research Institute, ul. Lubicz 25a, 31-503 Kraków, Poland
*
Author to whom correspondence should be addressed.
Energies 2022, 15(1), 221; https://doi.org/10.3390/en15010221
Submission received: 26 November 2021 / Revised: 23 December 2021 / Accepted: 27 December 2021 / Published: 29 December 2021

Abstract

:
An essential prerequisite for safe transport and use of natural gas is their appropriate odorization. This enables the detection of uncontrolled gas leaks. Proper and systematic odorization inspection ensures both safe use of gas and continuity of the process itself. In practice, it is conducted through, among others, measuring odorant concentrations in gas. Control devices for rapid gas odorization measurements that are currently used on a large scale in the gas industry are equipped with electrochemical detectors selective for sulfur compounds like tetrahydrothiophene (THT). Because the selectivity of electrochemical detector response to one compound (e.g., THT), the available declarations of manufacturers show that detector sensitivity (indirectly also the quality of the measurement result) is influenced by the presence of increased e.g., sulfur or hydrogen compound content in the gas. Because of the lack of sufficient source literature data in this field, it was necessary to experimentally verify this impact. The results of studies on experimental verification of suspected influence of increased amounts of hydrogen in gas on the response of electrochemical detector was carried out at the Oil and Gas Institute—National Research Institute (INiG—PIB). They are presented in this article. The data gathered in the course of researching the dependence between THT concentration measurement result quality and hydrogen content in gas composition enabled a preliminary assessment of the threat to the safety of end users of gaseous fuels caused by the introduction of this gas into the distribution network. Noticing the scope of necessary changes in the area of odorization is necessary to guarantee this safety.

1. Introduction

The dynamics of the gas odorization process and the need to ensure its continuity mean that gas system operators have to be able to rapidly detect odorant concentration responsible for gas odorization. The detection devices currently used on a large scale in the gas industry are equipped (apart from laboratory chromatographs) with electrochemical detectors selective for the sulfur compounds, e.g., tetrahydrothiophene (THT), that are commonly used in odorization.
The perfect detector should be characterized not only by high sensitivity and a detection limit that enables recording minor quantities of the measured substance, but also by high selectivity. Moreover, it should exhibit a low level of baseline “noise”, hence the high indication stability. Industrial-scale detectors never exhibit any features of a perfect detector, which is why the knowledge of their individual types is important for selecting one appropriate for a given application [1,2,3,4,5,6,7].
One of the main advantages of applying gas chromatography (GC) for monitoring purposes is the availability of a large number of sensitive detectors, both universal and selective. The application of selective detectors is common in the gas industry–particularly for taking on-line measurements. The main reason is that they eliminate the need for labor-consuming and time-consuming sampling. Selective detection enables measuring desired compounds and ignoring the presence of other compounds. Sulfur is detected selectively by using, among others, flame photometric detectors (FPDs), sulfur chemiluminescence detectors (SCDs), photoionization detectors (PIDs), electron capture detectors (ECDs), or detectors operating based on electrochemical techniques (EDs). The emergence of selective and specific detectors have significantly simplified analyzing sulfur compounds in gas, since their use enabled eliminating the impact of responses originating from individual hydrocarbons (especially C4–C8). Specific detectors, such as FPDs, enable to selectively distinguish between individual elements, providing a high degree of certainty among analysis results. The application of its enhanced version a PFPD (pulsed flame photometric detector) enables determining the concentration of sulfur compounds in gas at the ppb level. However, it has limited applicability in chromatographic analyzers used for rapid analysis of odorants (including THT) in gas, especially in process applications. The source literature on selective detectors for use in laboratory gas chromatographs is rather extensive [8,9]. However, the publications addressing the detection methods applied in chromatographic and indicator analyzers primarily cover application examples in commercial products (measuring devices of various classes) e.g., [7,10,11,12,13,14,15].
Electrochemical detectors or sensors (EDs) are used for monitoring the gaseous fuel odorization process on a large scale, in portable, mobile, and process devices. These detectors are mainly used within direct detection methods (portable detectors), where measuring gas is introduced to an analyzer, directly onto the sensor. The analyzer-measuring system is not protected against exposure to external factors (such as air humidity or temperature) that can impact measurement quality. No separation of sample components may lead to the appearance of interference originating from such sample components that undergo electrochemical reactions in the electrolyte medium that fills the detector. This last factor is particularly important from the perspective of potential changes in the composition of gases distributed through a distribution network and the possible increase of hydrogen concentration therein [16,17]. Quite often, the desired application of the sensor and its parameters is a compromise between its sensitivity and resistance to interferences at the same time. So, it cannot be expected that all electrochemical sensors will be the same. In fact, each item can have a different sensitivity [18,19,20]. Nevertheless, gas chromatography by means of the use of an electrochemical sensor is characterized by indication of the presence of a wider range of determined sulfur compounds, when compared to the aforementioned detectors (e.g., 0.1 ÷ 100 mg/m3 for THT).
Although the appearance of electrochemical sensors used to detect various gas types can be similar, their functionalities differ [18,19,20]. In consequence, differences in sensitivity, selectivity, response time, and lifetime may be expected from each of them. All sensor elements are crucial in determining its general characteristics. The characteristics and a comparison of the parameters exhibited by detectors of different types used in analyzing sulfur-based odorants are presented in Table 1.
The detector review presented above includes detectors in laboratory chromatographs used in the gas industry to measure tetrahydrothiophene (THT; gas odorant commonly used in Europe [11]) concentration in gas. In the event of demonstrating that methods utilizing selected detector types are resistant to the presence of hydrogen, they can act as reference methods for THT measurements in studying the impact of hydrogen on the operation of analyzers with electrochemical detectors.

1.1. Detectors Used for Routine Checks of Natural Gas Odorization

Electrochemical gas detectors (alternative name: “sensors”) most often used in the gas industry are galvanic cells, the operating principle of which is described above. Compared to such techniques as optical [21], acoustic [22], or chromatographic [23] methods, “electrochemical” detection (in the sense of direct detection) is the most popular when it comes to monitoring odorized natural gases. The electrolyte in the cells can be in both liquid (liquid electrolyte sensors-application limited to laboratory measurements) and solid (solid-state electrochemical sensors-possible field or process applications) forms.
The key advantages of electrochemical detection, which determine its popularity, are high (for direct methods) resolution, selectivity, ppm-level detection, wide measurement range for the concentrations of the determined sample element, and low investment costs when compared to other techniques [19]. The basic disadvantage of an electrochemical sensor is the gradual loss of sensitivity over time. This is associated with the deposition of solid electrochemical reaction products on the surface of the working electrode (reducing available electrode surface). These changes lead to degraded effectiveness of the reaction ongoing on the electrode, and limited sensor service life.
Humidity and temperature are the main factors restricting the application of electrochemical sensors. The porous diffusion barrier allows the passage of water vapor molecules that are absorbed in the electrolyte under conditions of their high partial pressure. Sudden gas humidity changes lead to sensor signal interference. The water vapor penetration degree depends on ambient temperature and relative humidity conditions. No signal interference should be experienced under constant humidity from 15 to 90% RH (permissible relative ambient humidity). Electrochemical sensors are also very sensitive to temperature fluctuations. The operating temperature is maintained as constant as possible, in order to achieve best sensor performance. Extreme ambient temperature changes lead to sensor temperature fluctuations, which impacts the baseline waveform (at zero point) of the signal.
For many years, the Institute of Oil and Gas—National Research Institute (INiG—PIB) has been studying the impact of different factors on the correct operation of electrochemical sensors. Experiments therein have verified a hypothesis that the level of the baseline, recorded as the response of a selective electrochemical sensor to sulfur compounds, increases exponentially together with increasing temperature. It doubles upon a temperature increase of 10 °C, thus, the need to stabilize the temperature of the entire measuring system, which utilizes an electrochemical sensor.
The high sensitivity of electrochemical sensors may cause practical problems with their use, providing the same response to the presence of various gases within the studied matrix. Reports by manufacturers of selective sensors for sulfur compounds regarding the impact of interferents in measured gas on their sensitivity are not comparable. The varying sensitivity to interference probably depends on the design of the sensor itself. Exemplary data of one of the manufacturers of selective sensors of THT regarding the impact of selected compounds found in gas on their response (determined by their manufacturers as “cross sensitivity”) are listed in Table 2.
The manufacturer-declared sensor indication in the form of an interferent (Table 2) leads to a device equipped with such a sensor misreading the THT result and generating a distorted indicated value. The recorded interferent signal is attributed to THT and recorded in the form of, e.g., mass concentration of this compound. This effect results in a so-called “negative positive measurement result”. A positive result for an interferent (recorded despite the lack of THT) arises from electrochemical reactions that involve molecules on the surface of the working electrode.
The declarations of sensor manufacturers in terms of their sensitivity to hydrogen in the tested gas are not consistent. Depending on the manufacturer, hydrogen content in a gas within a range from 0.1% (V/V) to 1% (V/V) may hypothetically not cause a misread THT result (in accordance with the value declared in Table 2) or it might inflate the actual situation by 10 mg/m3, and in some cases even by several hundred mg/m3. An inflated THT concentration result may pose a threat to the safe use of gaseous fuels in situations of monitoring odorization only based on monitoring THT level in gas. At an average concentration level of this odorant in gas at 25 mg/m3, inflating this result by mg/m3 leads to a 40% measurement error. Such a situation results in a misinterpretation of a seemingly correct network gas “odorization level”. However, most manufacturers of measuring devices fitted with electrochemical sensors (as in Table 2) do not draw users’ attention to the potential issue associated with the “accuracy” of the obtained result, which arises from, among others, increased hydrogen content in gas (probably because such a problem has not been previously observed with methane-rich gases). Hence the need for an experimental verification of the potential problem for specific device types, resulting from projected gas composition changes. Exactly such verification was the subject matter of the research discussed in this paper.

1.2. Methods for THT Concentration Monitoring that Are Applied within the Gas Industry

A reliable analysis of odorant content in gas, which enables obtaining credible results is a challenging analytical task. In the case of measuring odorant concentration in gas, the results characterized by the highest possible precision or repeatability degree can only be obtained using chromatographic methods. For example, routing measurements of THT concentration in gas utilize both laboratory chromatographs and chromatographic analyzers equipped with detectors/sensors that enable selective determination of a given sulfur compound [23].
However, indicator analyzers that operate based on electrochemical detection, without chromatographic separation of components in an analyzed sample constitute a large group of monitoring devices. Process chromatographic analyzers have come to be particularly useful in the case of facility on-line measurements. Their use has become popular over the recent years (data applies to Poland and the period of 2015–2021), since they are adapted to remotely transmit measurement results in real-time, which significantly streamlines the gas odorization monitoring process [25]. This is confirmed by Marcogaz data [26] from 2020. The data concern gaseous fuels in Europe, used to identify three groups of odorant concentration detection methods used by the surveyed European countries (mainly for monitoring organic sulfur compounds in gas). These methods include laboratory chromatography with selective detectors for sulfur compounds (mainly FPD), chromatographic analysis with devices usually called microGC, and direct chemical detection. Therefore, the assessments are based on analytical measurements of odorant concentration in gas conducted:
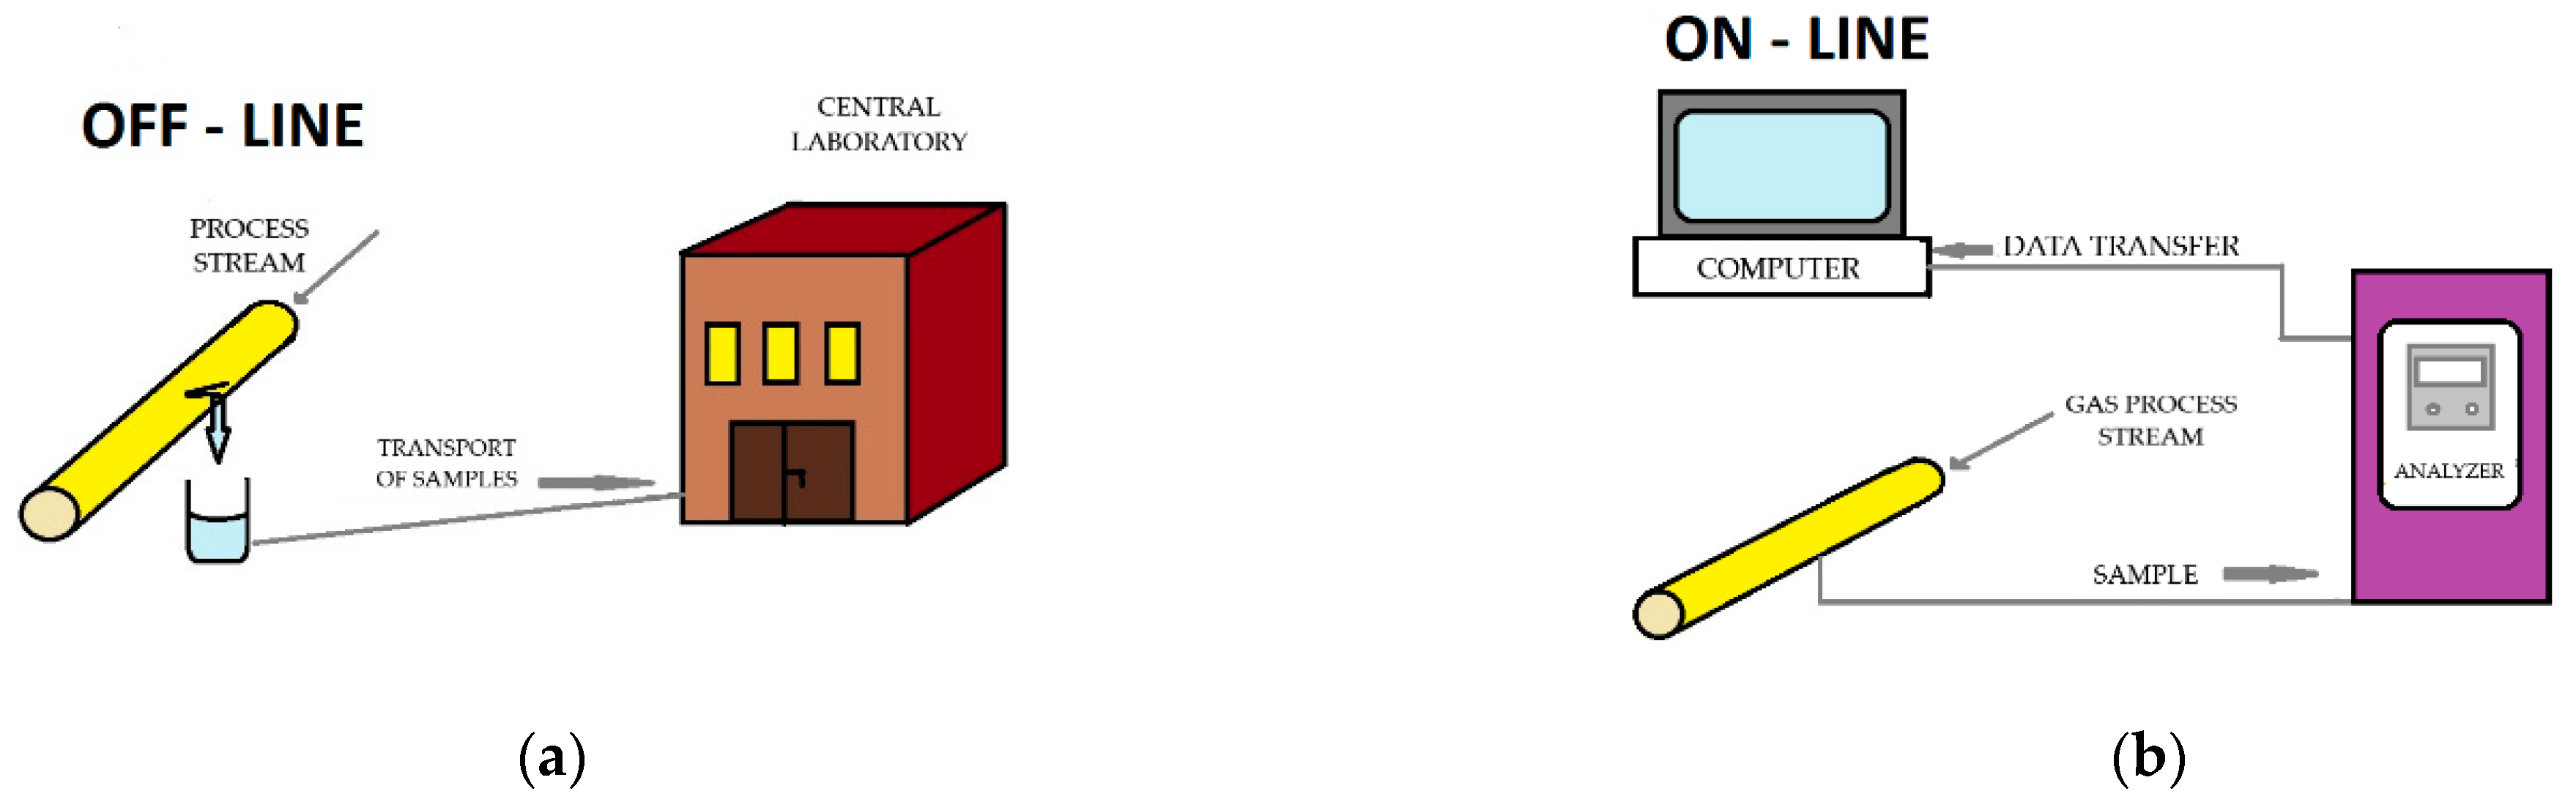
  • Off-line using gas chromatography (executed in Poland and other countries by gas laboratories)—Figure 1,
  • On-line with the direct detection method (usually used by operating services), and also with process chromatographic analyzers operating automatically (based on the gas chromatography method-similarly to laboratory equipment)—Figure 1.
All technical solutions currently applied in practice are based on the aforementioned detection methods and measurement procedures. An illustrative distribution of all individual types of devices for measuring THT concentration in gas that are used by the largest Polish Distribution System Operator, i.e., Polska Spółka Gazownictwa Sp. z o.o. (PSG), taking into account process analyzers, is shown in Figure 2.
Table 3 lists the parameters (determined at INiG—PIB) of three selected devices for chromatographic measurement of THT concentration in natural gas that satisfy the requirements of the standard ISO 19739:2010 [27]. These devices were tested for the impact of elevated hydrogen content in gas on the correctness of their indications. Study results are described in Chapter 8. They take into account the exemplary solutions for the following device types:
Type I.
Stationary chromatographs adapted to measure sulfur compound content in gas (primarily THT) and equipped with PFPDs or PIDs, as a device operating off-line, in a laboratory (implemented THT measurement method constituted a reference method in studying the impact of hydrogen on the operation of chromatographic THT analyzers, including on-line devices, in particular);
Type II.
Chromatographic mobile analyzers equipped with EDs for periodic field control measurements of THT concentration, manifesting devices operating on-line (implemented only 1 selective THT measurement method);
Type III.
Chromatographic process analyzers with maintenance-free operating modes and EDs, for continuous monitoring measurement of THT concentrations within a gas network, as a device operating on-line (implemented only 1 selective THT measurement method)
Type IV.
Portable analyzers with EDs, for interim measurements of THT concentrations, as a device operating on-line (implemented only 1 selective THT measurement method-100% THT selective sensor).
Direct-detection analyzers are a large group of instruments, in addition to the measuring devices listed in Table 3, that are applied for measuring odorant concentration in gas. They are used by, e.g., technical services for quick, most usually preliminary analyses of gas odor presence. These analyses are conducted periodically on-line, with a fixed frequency or on an ad hoc basis. The selectivity of such analyzers is based only on the selectivity of the used detector. The names “indicator” or “gauge” are often used alternatively for these analyzers. The device has an internal, built-in electrochemical detector (ED), which reacts directly (without chromatographic separation) to molecules, e.g., THT, within the tested gas. Therefore, according to the manufacturer’s declaration, the device is sensitive to other gas ingredients, e.g., hydrogen (>0.1%), methanol (>0.13%), hydrogen sulfide (>0.002%), and other sulfur compounds (>0.0005%). Its application limitations are illustrated by the device’s technical and performance parameters, which are as follows for a large group of such instruments:
  • Measuring range: 0 to 200 mg/m3 for THT;
  • Measurement accuracy, e.g., for THT: ±10% in the range of THT concentrations of 5–25 mg/m3 > ±20% beyond the a/m range;
  • Resolution: 1 mg/m3;
  • Detector service lifetime ca. 1 year or 3000 measurements.
Because the device is not, as such, protected against exposure to potential interferents impacting its sensitivity (indirectly and on measurement result quality), it is expected that increased hydrogen content will have an even significant impact on the obtained measurement results. It was therefore concluded that experimental verification of this suspicion is also required for this device.

1.3. Projected Hydrogen Content in Natural Gas

Increased demand for “clean” energy generates interest in using hydrogen for energy-related purposes, as a potential and long-term solution of the issue associated with the growing energy crisis [16,17]. The Institute of Oil and Gas—National Research Institute (INiG—PIB) has been conducting research in the field of the possible introduction of hydrogen into a gas network, the assumptions of which result directly from accumulated own experience. The objective of the studies is to identify limitations for this process attributable to individual gas system elements [28]. They translate to the indication of permissible hydrogen content in natural gas flowing through a distribution network that is safe for the network itself, as well as for the gas user. The maximum hydrogen levels determined so far by INiG—PIB that can be “safely” added to methane-rich natural gas are [28,29,30,31,32,33,34,35,36]:
  • 36% for gas from LNG regasification and 26% for 2E group gas-in terms of gas quality (maintaining legally required energy parameters of gas),
  • 23%—in terms of combustion safety in end devices,
  • 15%—in terms of combustion efficiency in end devices,
  • 10%—in terms of the method for converting the compressibility coefficient,
  • 8%—in terms of explosion safety of devices operation in Ex-zones.
The authors of the aforementioned research [28,30] emphasize that the obtained results exhaust the possibilities of further limitations in terms of permissible safe levels of hydrogen content in network gas. The forecasts regarding further restrictions arise from the expected sensitivity of monitoring and measurement instruments to hydrogen. Some of the elements in a monitoring and measurement infrastructure of a gas distribution network are analyzers to measure the odorant concentration in gas (only THT in Poland [25]). Their distorted operation or unreliable results of their measurements, induced by, e.g., increased hydrogen content in gas, will directly impact gas user safety.
As mentioned in previous article [33] preceding the current research there are still lack of reports on the verified possibilities of odorizing mixtures of natural gas with hydrogen without threatening the safety of end users. There is also no information on the performance of proper analytical examinations of the concentration of odorants in such mixtures. This results in a need for experimental verification of e.g., the magnitude of the measurable impact of hydrogen on the operations of measurement devices used in the odorization of fuel gases, with particular emphasis on process analyzers, which are becoming increasingly popular in the gas industry [14,18]. Control devices with electrochemical detectors for rapid gas odorization measurements are currently used on a large scale in the gas industry. The composition of gaseous fuels may affect the correctness of their readings; however, there is no information in the literature on the measurable impact of individual compound changes in gas composition on the quality of the obtained results. Because of the lack of sufficient source literature data in this field, it was necessary to experimentally verify this impact. The possibilities of performing such verification include checking analytical methods and apparatus for odorization gas monitoring.
The Department of Gaseous Fuel Odorization (INiG—PIB) has conducted studies on the correct operation of devices used to measure THT in gas containing increased hydrogen amounts (up to 15%, according to the assumptions). They are the next stage [33] of an entire block of tasks implemented currently by INiG—PIB in the field of odorizing gaseous fuels with added hydrogen.

2. Materials and Methods

2.1. Assumption for the Study

The basis to select gas compositions used within the studies on the impact of hydrogen on the response of the detectors employed in routine THT analyses was previous INiG—PIB experience [28,30] regarding, among others, permissible hydrogen content in network gas. It served the authors of the research to prepare mixtures of methane and hydrogen, as well as methane-rich natural gas and hydrogen with content in the following ranges:
  • Methane with added hydrogen in the amount from 0.1 to 15% (V/V),
  • Methane-rich natural gas of the 2E group, with a hydrogen content of 1 and 15% (V/V).
Higher hydrogen concentrations in the tested mixtures were not taken into account due to the tendency to confine its upper permissible content in network gas [28]. Moreover, it was assumed that for higher hydrogen concentrations, their impact on the operation, especially of electrochemical detectors, will be unobservable (the authors assumed potential detector “poisoning” due to its sensitivity to hydrogen, despite the fact that the manufacturer did not declare such impact). On the other hand, extreme content concentrations in mixtures from within the adopted content range (i.e., up to 15%) were selected for testing in the case of natural gas. Pursuant to the study objective, the obtained mixtures of methane and natural gas with hydrogen were odorized using tetrahydrothiophene. The research was limited only to a single odorant, which is the most commonly used in European practice and the only one applied in Poland. THT concentration in mixtures corresponded to its average values in the distribution network, i.e., it fell within a range of 15.0 ÷ 30.0 mg/m3 (approx. 4.0÷8.0 ppm). The composition of all initial gas mixtures prepared for the purposes of research objectives are listed in Table 4.
The mixtures were obtained by employing the manometric method [37], a static volumetric technique [38]. This optimized manometric method has been used at the Department of Gaseous Fuel Odorization at INiG—PIB for a year, so as to develop THT working standards for the purposes of calibrating electrochemical analyzers measuring the concentration of this odorant within the gas network. It is characterized by low degree of complexity and satisfactory repeatability. It also enables creating large amounts of gas mixtures (including standard gases) under high pressure. The technique and manner of developing mixtures were described in the previous publication by the same authors [33]. The preparation accuracy for a specific mixture containing ingredients of a given concentration may vary depending on its type. Because the methods used to calculate the composition of mixtures obtained with the manometric method are not very accurate, the end composition of such a mixture (ingredient concentration values) is usually determined using the comparative method [39]. In consequence, the odorant (THT) content in the gases obtained for the purposes of the research (containing elevated hydrogen concentrations) was determined by way of applying the gas chromatography method [37], as per the recommendations of standard ISO 6143 [39].
The entire research was divided into the following blocks:
A.
Preliminary studies of the impact of hydrogen on the response of electrochemical and other detectors used in the gas industry for monitoring odorization of gas within the distribution network—comparisons of hydrogen sensitivity of measuring devices used to test THT; the studies were conducted using methane/hydrogen mixtures diluted to H2 content of 5% and 8%, without added THT (Table 4) and for selected M/H + THT mixtures;
B.
Main studies of the impact of hydrogen on the quality of THT concentration measurement in various devices used in the gas industry, employing methane and hydrogen mixtures odorized with THT, with hydrogen content of: 1, 2, 8, 10, and 15%, and odorized methane-rich natural gas mixtures with hydrogen concentration of 2% (baseline mixture composition listed in Table 4)—selection of reference methods;
C.
Long-term studies on the impact of hydrogen on the quality of the THT concentration in gas measurement result, for two chosen devices with electrochemical detectors used in the gas industry for odorization monitoring; the research employed 2E methane-rich natural gas mixtures with hydrogen, odorized with THT in concentrations of: 1 and 15% (Table 4).
The research conducted in blocks were aimed at determining the THT selective detector sensitivity to hydrogen in gas, for measurements taken in the following mode:
  • off-line (laboratory gas chromatograph with PFPD and PID, Type I as per the list in Section 1.2);
  • on-line (mobile and portable analyzers with ED, Type II and IV, respectively, as per the list in Section 1.2);
  • on-line/process (chromatographic analyzers with ED, Type III as per the list in Section 1.2).
The devices are characterized in the further part of this paper.

2.2. Gas Mixtures for Testing

The gas mixtures were prepared at the Department of Gaseous Fuel Odorization at INiG—PIB, using the following ingredients:
  • Liquid tetrahydrothiophene (THT) (by Chevron Phillips Chemical, The Woodlands, TX, USA),
  • Certified hydrogen/methane mixtures (M/H15, M/H10 and M/H8 with a purity of 15.009 ± 0.450% (mol/mol), 10.002 ± 0.300% (mol/mol) and 8.013 ± 0.240% (mol/mol), respectively) (by AirProducts, Allentown, PA, USA),
  • Aforementioned hydrogen/methane mixtures and pure methane as make-up gas with a purity of 5.5 (99.9995%) (AirProducts), M/H01, M/H02, M/H05, M/H1 and M/H2,
  • Natural gas (methane content > 96% (mol/mol)) and hydrogen (purity 5.0 (99.999%) mixtures) (by Air Products), 2E/H1 and 2E/H15.
The purity of each non-certified ingredient was chromatographically (GC) confirmed at the Department of Gaseous Fuel Odorization at INiG—PIB, prior to use. The M/H01, M/H02, M/H05, M/H1, and M/H2, as well as 2E/H1 and 2E/H15 mixtures were prepared using the successive dilutions method with chromatographic (GC) monitoring of their composition.
THT gas mixtures were prepared in 10 liter aluminum pressure cylinders (by Luxfer, Milwaukee, WI, USA) with Teflon-passivated internal surfaces that eliminate the effect of mixture ingredients adsorbing on the cylinder’s internal walls. A detailed mixture preparation method is described in [33].
THT concentrations in the mixtures take into account its content after the composition of each blend stabilizes. All obtained mixtures were stored under constant pressure and temperature conditions (T = 20 ± 2 °C, P = 101.325 kPa) to eliminate the effect of storage conditions leading to composition changes (potential mixture ingredient condensation prevented).

2.3. Reference Standards, Reference Method and Applied Measuring Devices

THT concentration in developed gas mixtures (xn,THT) was determined analytically through a comparison with certified reference materials (Primary Standard Gas Mixture (PSM)) for THT, pursuant to standard ISO 6143 [39]. Standard expanded uncertainty (NPL) was ±2.0% for k = 2, p = 95. THT concentration (expressed as a mole fraction ppm (mol/mol) and mass concentration (mg/m3); T = 20 °C and P = 101.325 kPa) was determined using gas chromatography, as per standard ISO 19739 [27].
The reference method for all studies was gas chromatography with a pulsed flame photometric detector (PFPD-Varian 450 GC, Table 3), due to no influence of hydrogen on measurement result quality. The method’s detection limit is 0.03 ppm (approx. 0.1 mg/m3; T = 20 °C and P = 101.325 kPa). Ingredients were separated using a capillary column of fused Wcot silica with CP Sil 5CB filling (60 m long, internal diameter 0.32 mm, filling film thickness 8.00 μm) (by Varian). The column and detector were heated up to 200 °C. The temperature was kept at a constant level throughout the entire analysis. Gas mixture samples were fed from the pressure cylinders directly to the GC–dosing rate approx. 60 mL/min.
The tested devices are described below:
  • Stationary chromatographic analyzer with a photoionization detector (PD), lamp with ionization energy of 10.6 eV–Type I, with implemented THT concentration determination method, operating off-line; factory-set THT measurement method parameters—not subject to change;
  • Mobile chromatographic analyzer with an electrochemical sensor (ED)—Type II, with implemented only 1 selective THT determination method for periodic on-line measurements; factory-set THT measurement method parameters—not subject to change (Table 3);
  • Process chromatographic analyzer with an electrochemical sensor (ED)—Type III, with implemented only 1 selective THT determination method, for on-line measurements directly on the gas network; factory-set THT measurement method parameters—subject to slight modification only by an authorized service (Table 3);
  • Portable indicator analyzer with an electrochemical sensor (ED)—Type IV, with implemented only 1 selective THT determination method for ad hoc on-line measurements (direct detection); factory-set THT measurement method parameters—not subject to change (Table 3).
The resistance of the THT analysis conducted using a laboratory chromatograph with a PFPD and a chromatographic analyzer with a PID (Type I) was verified through taking measurements comparative to the indications of these devices for the same THT mixture. The indication quality, hence, quality of the obtained THT measurement results, for a Type I chromatographic analyzer was determined by comparing the obtained THT concentrations with the results obtained with the use of a Varian 450 GC chromatograph. The measurements were taken for three levels of hydrogen content in methane: 8, 10, and 15%. Mixtures were odorized using THT, and three measurement series were conducted for each mixture. Each series consisted of 9–10 repetitions for the same sample. The results were averaged for each mixture and each measuring device. The means were rounded with up to 0.1 mg/m3. Tests were repeated after 4 weeks, obtaining means for the 4th measurement series.
The sensitivity of analyzers with electrochemical detection (ED) to increased hydrogen content in gas was verified similarly to the comparisons of the indications of the laboratory chromatograph and Type I analyzer. The used test mixtures were:
  • For the Type II.1 analyzer-M/H15 + THT, M/H10 + THT and M/H8 + THT,
  • For the Type II.2 analyzer-M/H2 + THT and M/H8 + THT,
  • For the Type III analyzer-M/H1 + THT.
The results of the aforementioned tests are presented in Chapter 3, point B.
Long-term analyzer tests utilized mixtures of 2E natural gas with hydrogen, odorized with THT at a concentration level of: 1% (for Type III) and 15% (for Type II). THT concentration for the 3-point mixtures prepared for the study was chromatographically determined using the reference method (Varian 450 GC chromatograph), pursuant to standard ISO 19739 [27]. They were, respectively:
  • 27.75 ± 1.25 mg/m3 (7.56 ± 0.34 ppm) for the 2E/H15 + THT mixture,
  • 45.26 ± 2.39 mg/m3 (12.33 ± 0.65 ppm) for the 2E/H1 + THT mixture.
The stage of studying long-term impact of hydrogen on the correctness of the analyzer indication involved continuous tests conducted in two series for each analyzer. Each of the series lasted approximately 30 days. Long-term test results are shown in Section 3.3.

3. Results

3.1. Preliminary Studies

A preliminary assessment involved a graphical reading of the measuring devices, i.e., a chromatogram after adding a methane/hydrogen mixture without THT. A minimum of three measurement series at several-day intervals were conducted for each tested measuring device to confirm the obtained results.
Figure 3 and Figure 4 demonstrate the results of verifying sensitivity to hydrogen (understood as sensitivity of the detector therein) of two measuring devices:
  • A stationary Type I chromatographic analyzer (reference device; PID)–Figure 3, red color marks the THT-originating signal;
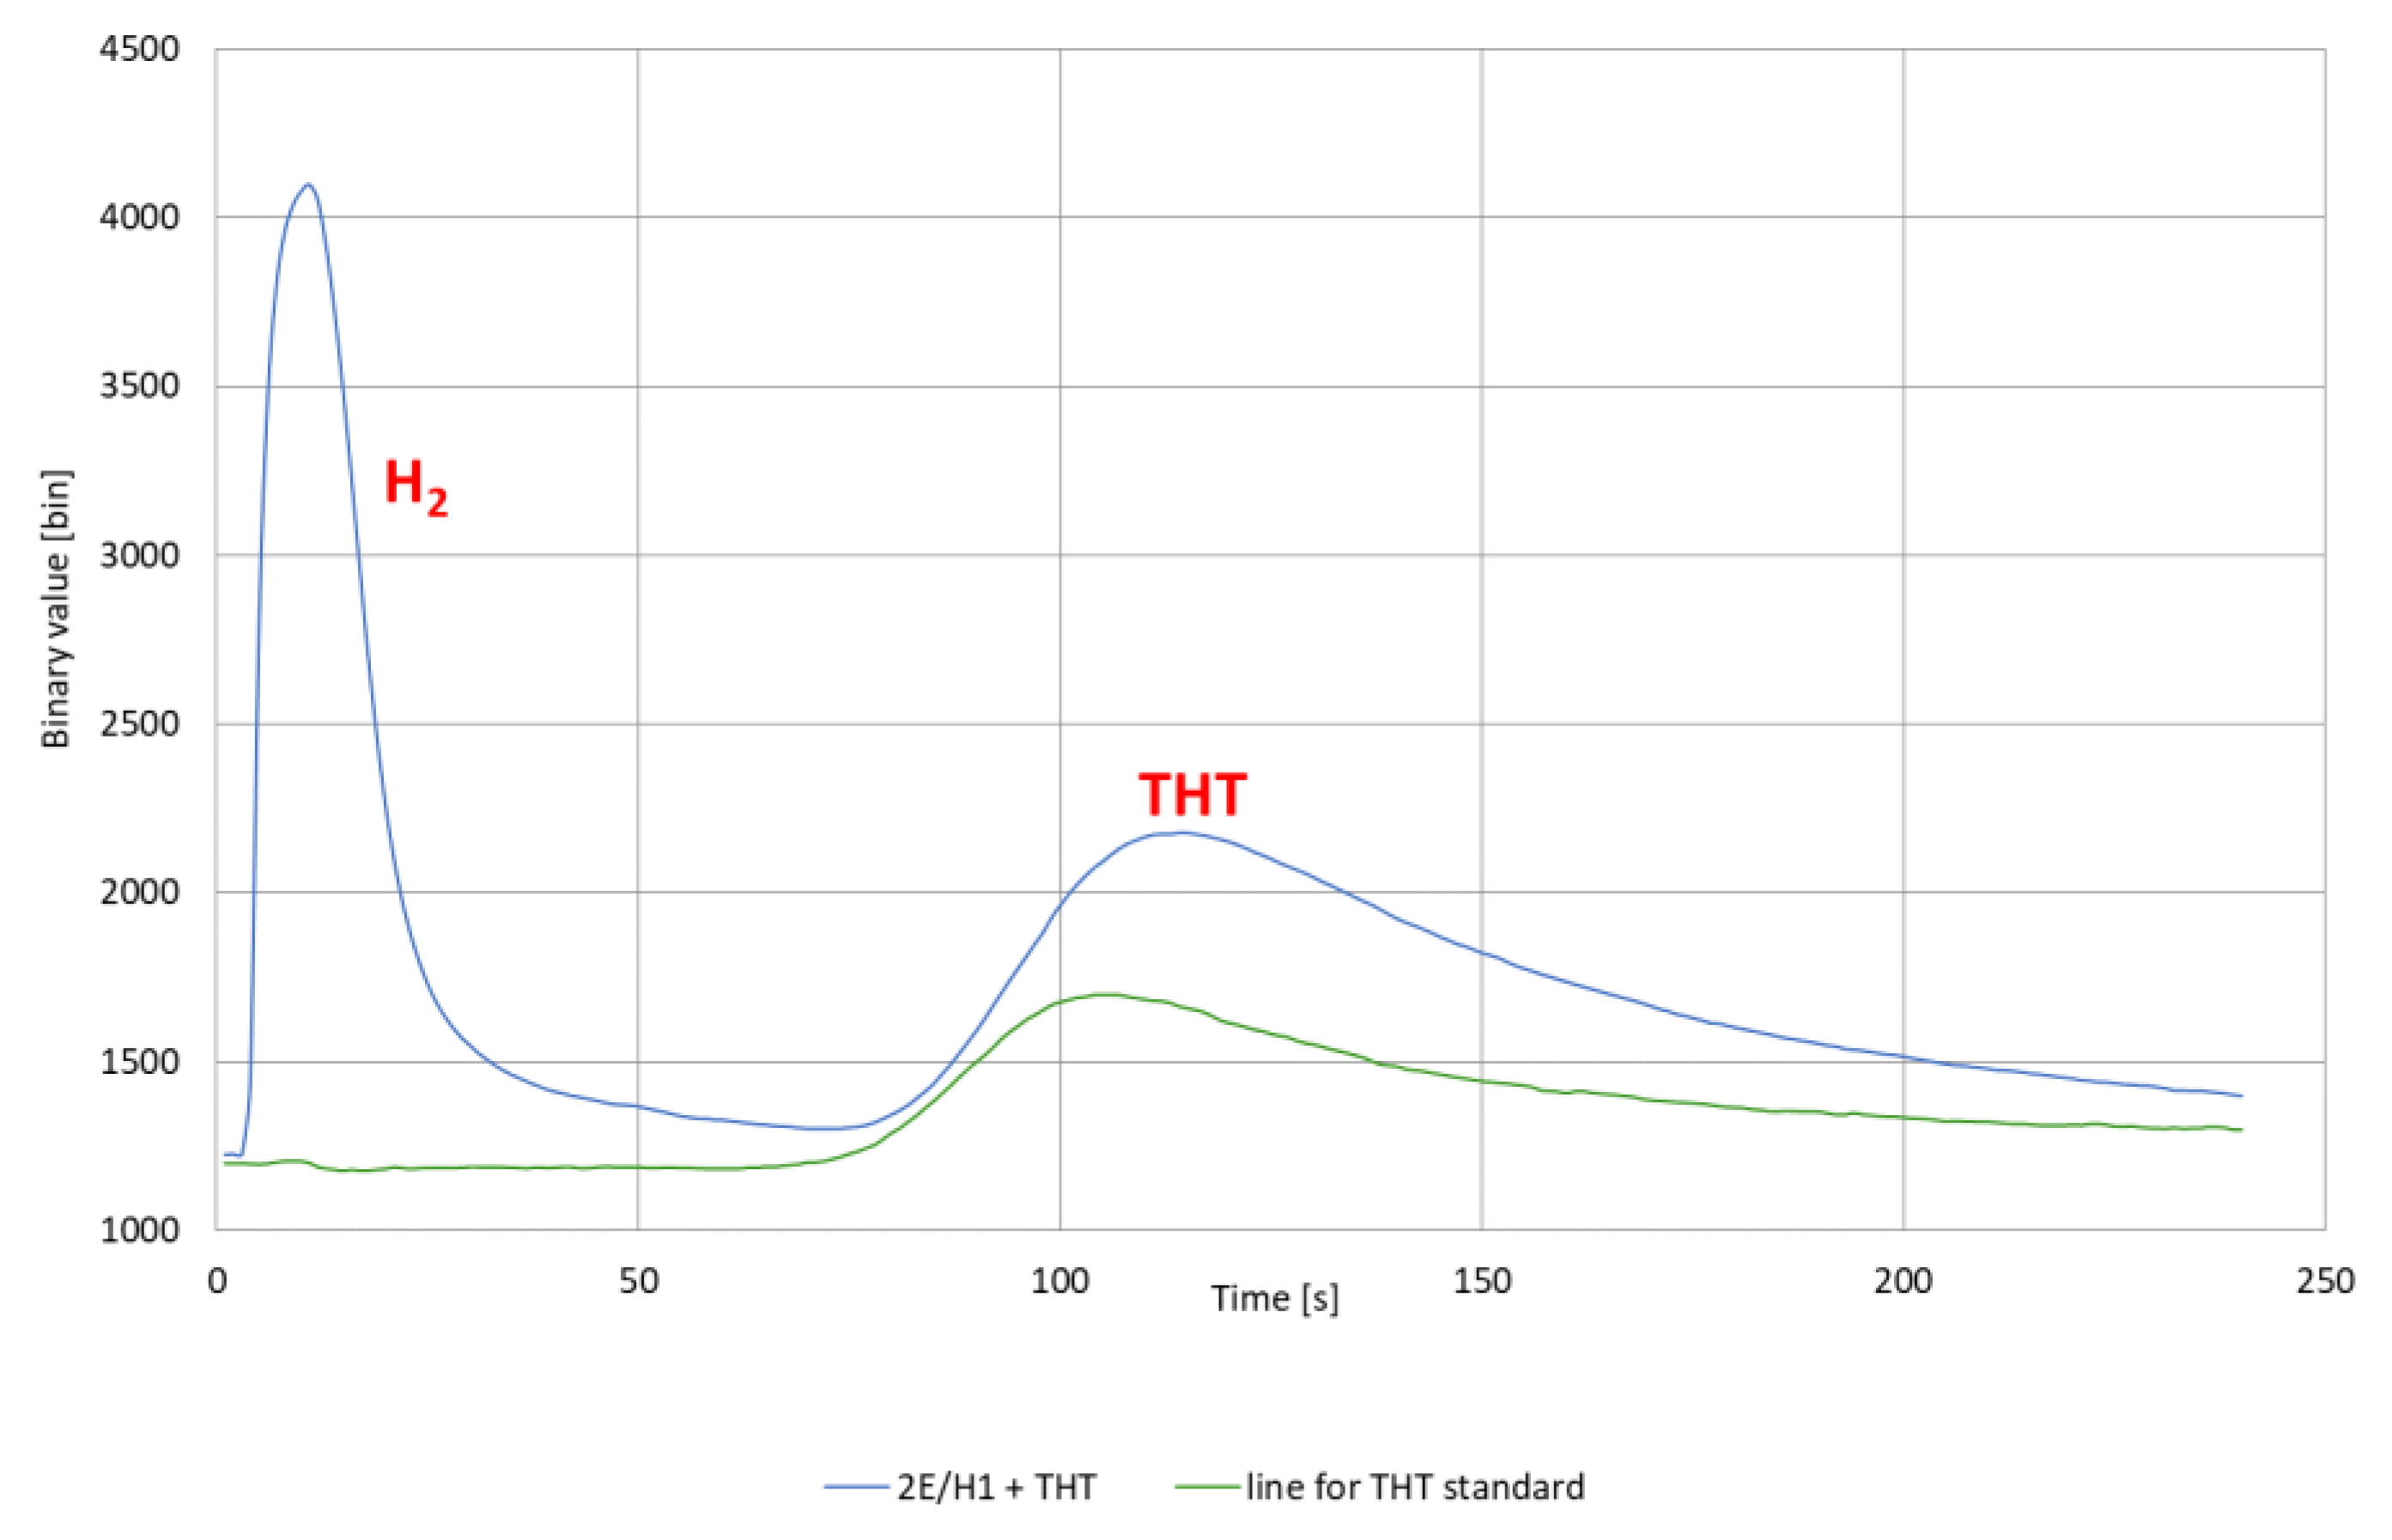
  • A process Type III chromatographic analyzer (ED)—Figure 4. In order to trace the impact of baseline interference on the graph recorded by the analyzer, the red color in the graph marks the chromatogram waveform recorded for a THT standard (THT in nitrogen).
Based on the waveform analysis (Figure 4) of chromatograms recorded with a Type III analyzer for M/H mixtures of varying hydrogen concentration, it was concluded that the optimal hydrogen concentration in a mixture with methane that enables conducting further tests of the impact of hydrogen on the quality of THT concentration measurement results was 1%. The hydrogen peak recorded by the device at that time does not distort the THT analysis waveform. Test results in the form of a chromatogram as a response of a Type III analyzer sensor to a M/H1 + THT mixture are shown in Figure 5.
Table 5 summarizes the results regarding responses of an ED electrochemical sensor installed in a Type IV indicator analyzer (direct detection) to the presence of hydrogen in a mixture with methane. These measurements were taken for a hydrogen content in the range of 0.1 to 2% only, since the sensor got poisoned at higher concentrations, and its indications did not change.

3.2. Main Studies

The results of THT Type I device analyses resistance test waveforms are shown in Table 6, which summarizes the obtained mean values, together with the percentage difference between them. In each case, the reference value was the THT concentration obtained using a Varian 450 GC chromatograph (method supervised within the accreditation process).
Both methods of conducting chromatographic THT concentration measurements were selected as reference methods for the research.
Table 7 lists the sensitivities of analyzers with electrochemical detection (ED) to elevated hydrogen content in gas. In the case of Type II analyzers, the table lists results for two different devices (marked as Type II.1 and Type II.2). This is due to their contrasting response to THT concentration in the hydrogen-spiked natural gas. The method that utilizes a Type I analyzer was selected as the reference method. The obtained results constituted reference values for checking individual analyzers.
Table 7 lists the mean values and standard deviations that were obtained for the individual devices in three independent measurement series.

3.3. Long-Term Studies

The last stage of the research on the impact of hydrogen on the devices used in monitoring gaseous fuel odorization involved studying the way hydrogen affects the quality of THT concentration measurement result. The tests were conducted for two selected devices with electrochemical sensors. The verification involved the performance and results obtained using analyzers that were assigned the following symbols: Type II.1 and Type III. Devices that turned out to be more sensitive to hydrogen-originating interference during previous stages were tested. Test focus was on the Type III analyzer due to the scale of application of such devices in remote monitoring of the odorization process (for Poland–Figure 2).
THT concentration measurement uncertainty was estimated according to ISO 6143 [39] as expanded uncertainty (U for k = 2, p= 95%), based on standard uncertainties and GC analyses repeatability. The uncertainty budget took into account uncertainty components resulting from uncertainties of certified gaseous standard mixtures, calibration stage uncertainty, uncertainty associated with method precision, and uncertainty resulting from measuring device accuracy.
The aforementioned mean values were adopted as reference values and used to assess long-term study results. Test results are listed in Table 8.
In order to assess the accuracy of measurements taken with analyzers fitted with an ED, the authors determined the deviation from actual value, as a difference between the obtained result (xn) and the reference value (x0), and a relative error-as a ratio between the mean value (d) and the reference value (x0).

4. Discussion

4.1. Preliminary Studies

According to the results listed in Figure 3, it should be stated that hydrogen does not impact the quality of THT analysis conducted with a chromatographic analyzer fitted with a Type I PID. Readings from this device for M/H mixtures provided zero values, regardless of the hydrogen concentration therein.
Limited possibilities for performing THT analyses in gas containing a hydrogen additive were observed in the case of Type III analyzers equipped with electrochemical sensors (ED). These devices exhibited sensitivity to hydrogen content in a mixture with methane of several percent. The graphs in Figure 4 show a significant hydrogen peak. Type III analyzers do not read a hydrogen peak as THT, which is why the indicated measurement result is 0 (a Type III analyzer only records a THT measurement result). However, with increasing hydrogen concentration in the mixture, the peak enlarges and overlaps the THT measurement window, preventing odorant concentration measurement. Based on the waveforms of Type III analyzer sensor responses in the form of chromatograms shown in Figure 4 and Figure 5, it can be concluded that the limit content of hydrogen in gas is 1%. In such a case, the hydrogen peak recorded by the device will not distort THT analysis. Higher hydrogen content values make it impossible to measure THT concentration.
High sensitivity to even the lowest hydrogen content in gas was exhibited by Type IV indicator devices. The measurement results summarized in Table 5 indicate that these devices responded to hydrogen content in gas of 0.1% with a reading attributable to THT concentration, despite its absence in the tested sample. The obtained results were considered random and were not averaged. It was observed that hydrogen content in gas of 1% leads to a positive result of THT concentration of >100 mg/m3. This is induced by the high sensitivity of their electrochemical sensor to these compounds, which easily undergo oxidation and reduction, as hydrogen. Such sensitivity is also a consequence of a significant simplification of the measurement chain in devices operating under the direct detection principle.
The obtained results indicate that Type IV devices with electrochemical sensors operating under the direct detection principle cannot be used in monitoring gaseous fuels with added hydrogen.

4.2. Main Studies

The main studies on the impact of hydrogen on the quality of analyses conducted using individual types of devices confirmed no impact of added hydrogen, regardless of its concentration, on the analyses conducted with a Varian 450 GC (PFPD) laboratory chromatograph and a Type I chromatographic analyzer with a PID. The data in Table 6 indicate that such devices provide consistent THT concentration measurement results in the presence of hydrogen, regardless of its content. Percentage differences between mean values obtained for the same compositions of odorized methane/hydrogen mixtures did not exceed 5%.
The adopted acceptance criterion for the study, in accordance with the technical guidelines DVGW [40] was:
  • For verifications of the sensitivity of analyzers with electrochemical detection that are intended for measuring odorant content in gas, to gaseous pollutants, the maximum permissible measurement result difference relative to the reference value was ±20% of the minimum odorant warning concentration in gas (i.e., ± 2 mg/m3 for THT).
With regard to the conducted comparisons, the results of which are listed in Table 6, it can be concluded that the criterion for the tested devices was fulfilled. The THT concentration measurement results obtained with the Type I chromatographic analyzer with a PID do not differ by more than 2 mg/m3 from the results obtained with the reference device (Varian 450 GC). Both methods can be considered reference for THT concentration measurements in methane/hydrogen mixtures.
The THT concentration measurement results in Table 7 indicate the possible different hydrogen sensitivity of analyzers of the same type and with the same detector type. This may be a consequence of sensors originating from different manufacturing batches or slight modifications introduced by the analyzer manufacturer in the measurement chain of the devices (analyzers designated as Type II.2 were the successors of Type II.1, with exactly the same parameters declared by the manufacturer). The measurement results obtained with the Type II.2 analyzer listed in Table 7 confirm its sensitivity to hydrogen concentration ≥2%—the THT concentration measurement results obtained with the Type II.2 chromatographic analyzer differ by more than 2 mg/m3 from the results obtained with the reference device for mixtures M/H8 + THT. Higher hydrogen quantities in gas led to the analyzer providing an unreliable THT measurement result. THT concentration results consistent with the adopted reference value and satisfying the aforementioned acceptance criterion were obtained using Type II.2 and Type III analyzers, but only for hydrogen content in the mixture at a level of approx. 1%.
Adopting the aforementioned DVGW criterion [40] for the purposes of verifying the sensitivity of the analyzers with electrochemical detection to gaseous pollutants, the data in Table 7 can be interpreted as follows:
  • Measurement results for Type I and Type II analyzers indicate high consistency of their indications (THT concentration) in methane/hydrogen mixtures, regardless of the hydrogen content. The percentage difference between the results ranged from –3.25 to –4.59% for a hydrogen content of ≥8% and amounted to –5.96% for a content of 2%;
  • THT concentration results obtained with the Type II.2 analyzer for a hydrogen content in the mix at a level of 8% deviated by as much as 28% from the reference value. This confirms the previous conclusions that this analyzer is sensitive to higher hydrogen concentrations that induce distortions in the recorded chromatograph (baseline drift caused by the appearance of a significant hydrogen peak just prior to a THT peak), leading to obtaining an unreliable THT measurement;
  • For very low hydrogen content values of approx. 1%, all verified Type II.1, Type II.2, and Type III analyzers provided results consistent with the reference value, thus satisfying the adopted criterion.

4.3. Long-Term Studies

DVGW guidelines [40] in the following categories were adopted as criteria to facilitate assessing the results of long-terms studies on the impact of hydrogen on the quality of measurement results obtained using Type III and Type II.1 analyzers with EDs:
(1)
Long-term stability: a device is stable provided its indications do not differ by more than ± 10% from the lowest odorant concentration in gas (MS-determined based on an odor curve of a give gas type) relative to the reference value; permissible difference for THT measurements is ±1 mg/m3;
(2)
Sensitivity to such gas components as biogas, hydrogen, LPG: other gas components that the standard ones in a methane-rich gas shall not induce a measurement error beyond ±20% of the MS value (i.e., ±2 mg/m3 for THT).
The collective data in Table 8 indicate that both the tested analyzers behaved stably under the assumed experimental conditions. Mean THT concentration values in the tested mixtures as calculated in both cases, did not differ by more than 1.2 mg/m3 from the adopted reference values. Therefore, the DVGW criterion regarding device operating stability and the quality of obtained THT measurement results was satisfied. Hence, long-term studies confirmed the possibility of using the devices under adopted test conditions regarding hydrogen content in gas not distorting their readings.
It should be noted that the research is of investigative nature. This means that the results should be verified for a wider range of determined gas THT concentration.

5. Conclusions

The research described in the paper enabled determining the limits for hydrogen content in gas that are tolerated by individual types of devices employed for measuring gas THT concentrations. The studies involved strictly defined individual devices, but their results can be applied to entire types of devices following a given method for detecting THT concentration in gas. Therefore, based on the obtained results, it was concluded that:
  • Hydrogen, regardless of its concentration, does not impact the waveform and quality of THT analyses conducted with laboratory chromatographs with sulfur compound selective detectors (PFPDs in this case) and chromatographic analyzers with photoionization detectors (PIDs);
  • The impact of hydrogen on the quality of analyses with mobile and process on-line analyzers equipped with electrochemical sensors (EDs) is strictly related to the individual sensitivity of the sensor and the measurement line technical solution applied within such a device; such sensitivity cannot be predicted only based on manufacturer’s data, e.g., a hydrogen concentration of 2% does not influence result quality and the waveform of THT concentration analyses conducted with mobile Type II.2 chromatographic analyzers, while in the case of Type III process analyzers, the adequate hydrogen limit in gas is 1%;
  • Total lack of resistance to hydrogen may be indicated by mobile indicator-type THT analyzers used for ad hoc on-line measurements of gas samples collected directly from gas pipelines and following a direct electrochemical detection (ED) method; under the conditions of the described experiment, hydrogen content at a level of 0.1% was identified by such devices as THT, despite the lack of this odorant in the tested gas.
Long-term studies confirmed the lack of impact of selected hydrogen concentrations on the quality of results obtained using two types of chromatographic analyzers with electrochemical detection (Type III process analyzer and Type II.1 mobile analyzer). No deterioration of the THT concentration measurement result quality was observed under the adopted experimental results and hydrogen concentrations in gas of:
  • 1% for Type III chromatographic process THT analyzers, and
  • 15% for Type II.1 mobile analyzers.
The results of conducted research enable a general conclusion that the currently applied methods for monitoring the gaseous fuel odorization process implemented within gas facilities in an on-line manner (especially mobile and process devices with ED) are not fully adapted to continue failure-free operation in the event of introducing even minimum amounts of hydrogen to the gas distribution network. This is due to the fact that the lack of changes in the monitoring and measurement field may have serious consequences for the safety of the gas network and for end users of the gas. The research has shown that the operational resistance to hydrogen within the same group of measuring devices using detectors sensitive to hydrogen (with an ED sensor) is an individual matter. The readiness of control and measuring infrastructure used within the gaseous fuel odorization process that follows analytical methods must be determined by the network operator in each case. The decision should be based on monitoring implementation practices and the type of measuring devices that are employed.

Author Contributions

Conceptualization, A.H. and J.J.; formal analysis, A.H. and J.J.; funding acquisition, J.J.; investigation, A.H.; methodology, A.H. and J.J.; supervision, A.H. and J.J.; validation, A.H. and J.J.; visualization A.H. and J.J.; writing—original draft, A.H. and J.J.; writing—review and editing, A.H. and J.J. All authors have read and agreed to the published version of the manuscript.

Funding

The research received funding as a part of the statutory work commissioned by the Ministry of Science and Higher Education; order no. 0088/WN/19, archival number: DK-4100-0088/19 and no. 0089/WN/19, archival number DK-4100-0089/19.

Institutional Review Board Statement

Not applicable.

Informed Consent Statement

Not applicable.

Data Availability Statement

Not applicable.

Conflicts of Interest

The authors declare no conflict of interest.

Nomenclature

cTHTTetrahydrothiophene concentration in gas, [mg/m3] or [ppm]
ddeviation from standard value, [mg/m3]
erelative error, [%]
sstandard deviation value
Uconcentration uncertainty, [mg/m3] or [ppm]
x0reference value for THT concentration, [mg/m3] or [ppm]
xn,THTmeasured THT concentration, [mg/m3] or [ppm]

Abbreviations

INiG—PIBOil and Gas Institute—National Research Institute
CEN European Committee for Standardization
2Enatural gas of group E of the second gas (high-methane) described in EN 437
2E/H12E natural gas mixture with a 1% hydrogen content (V/V)
2E/H152E natural gas mixture with a 15% hydrogen content (V/V)
GCgas chromatography
EDelectrochemical detector
Mpure methane
M/Hmethane gas mixture with hydrogen
M/H01methane gas mixture with a 0.1% hydrogen content (V/V)
M/H02methane gas mixture with a 0.2% hydrogen content (V/V)
M/H05 methane gas mixture with a 0.5% hydrogen content (V/V)
M/H1 methane gas mixture with a 1% hydrogen content (V/V)
M/H2 methane gas mixture with a 2% hydrogen content (V/V)
M/H5 methane gas mixture with a 5% hydrogen content (V/V)
M/H8methane gas mixture with a 8% hydrogen content (V/V)
M/H10methane gas mixture with a 10% hydrogen content (V/V)
M/H15methane gas mixture with a 15% hydrogen content (V/V)
MSminimum concentration of odorant in gas necessary to obtain the odor of required intensity
NPLNational Physical Laboratory
PFPDpulsed flame photometric detector
PIDphotoionization detector
PSGPolska Spółka Gazownictwa Sp. z o.o.
THTTetrahydrothiophene

References

  1. Szczepaniak, W. Metody Instrumentalne w Analizie Chemicznej; Wydawnictwo Naukowe PWN: Warszawa, Poland, 2011; pp. 255–384. ISBN 978-83-01-14210-0. [Google Scholar]
  2. Pham Tuan, H.; Janssen, H.-G.; Cramers, C.A.; Smit, A.L.C.; van Loo, E.M. Determination of sulfur components in natural gas: A review. J. High Resolut. Chrom. 1994, 17, 373–389. [Google Scholar] [CrossRef]
  3. Pham Tuan, H.; Janssen, J.G.M.; Cramers, C.A.M.G.; Kuiper-Van Loo, E.M.; Vlap, H. Evaluation of the performance of various universal and selective detectors for sulfur determination in natural gas. J. High Resolut. Chrom. 1995, 18, 333–342. [Google Scholar] [CrossRef] [Green Version]
  4. Stradiotto, N.R.; Yamanaka, H.; Zanoni, M.V.B. Electrochemical Sensors: A Powerful Tool in Analytical Chemistry. J. Braz. Chem. Soc. 2003, 14, 159–173. [Google Scholar] [CrossRef] [Green Version]
  5. Hayward, T.C.; Thurbide, K.B. Characteristics of Sulfur Response in a Micro-flame Photometric Detector. J. Chrom. A 2006, 1106, 66–70. [Google Scholar] [CrossRef]
  6. Boczkaj, G.; Kamiński, M.; Przyjazny, A. Process Control and Investigation of Oxidation Kinetics of Postoxidative Effluents Using Gas Chromatography with Pulsed Flame Photometric Detection (GC-PFPD). Ind. Eng. Chem. Res. 2010, 49, 12654–12662. [Google Scholar] [CrossRef]
  7. Report Emerson Automation Solutions Electrochemical vs. Semiconductor Gas Detection—A Critical Choice, 00870-0200-4928, Rev AA, 2019. Available online: https:// emersonexchange365.com/products/measurement-instrumentation/f/analytical-discussions-questions/7791/electrochemical-vs-semiconductor-gas-detection-a-critical-choice (accessed on 15 October 2021).
  8. Poole, C.F.; Riffenburgh, R.H. The Essence of Chromatography; Elsevier: Amsterdam, The Netherlands, 2003; ISBN 9780444501981. [Google Scholar] [CrossRef]
  9. Nollet, L.M.L. Chromatographic Analysis of the Environment, 3rd ed.; CRC Press: Boca Raton, FL, USA, 2005; ISBN 9781420027983. [Google Scholar]
  10. Sielemann, S.; Teepe, M.; Vautz, W.; Baumbach, J.I. Bestimmung des Odorierungsgehaltes in Erdgas mittels Ionenbeweglichkeitsspektrometrie. Gas Erdgas 2004, 145, 642–646. [Google Scholar]
  11. Pritsching, K. Odorierung, 3rd ed.; Vulkan Verlag: Essen, Germany, 2010; pp. 68–86. [Google Scholar]
  12. Tenkrat, D.; Hlincik, T.; Prokes, O. Natural Gas Odorization; IntechOpen: London, UK, 2010; Available online: https://www.intechopen.com/books/natural-gas/natural-gas-odorization (accessed on 15 October 2020).
  13. GDS Corp Sensors for Gas Odorants Sensor Selection for GDS-68SXP Natural Gas Odorant Monitors. Available online: http://www.gdscorp.com/Products/download/others_1532539416Sensors%20for%20Odorant%20Monitors_updated.pdf (accessed on 15 October 2020).
  14. Juszczak, M.; Szyłak-Szydłowski, M. Chromatographic Examinations in the Gas Network Odourised by Tetrahydrothiophene. Ecol. Chem. Eng. S 2019, 26, 265–277. [Google Scholar] [CrossRef] [Green Version]
  15. Advertising materials (application note) PAC L.P.: Analysis of Ultra low Sulfur Compounds in Natural Gas and Gaseous Fuels by Gas Chromatography and Chemiluminescence according to ASTM D5504. Available online: http://www.paclp.com/lab-instruments/application/gases/product/83/sense-sulfur-selective-detector (accessed on 15 October 2020).
  16. De Santoli, L.; Paiolo, R.; Lo Basso, G. An overview on safety issues related to hydrogen and methane blend applications in domestic and industrial use. Energy Procedia 2017, 126, 297–304. [Google Scholar] [CrossRef]
  17. Parra, D.; Gillott, M.; Walker, G.S. The role of hydrogen in achieving the decarbonization targets for the UK domestic sector. Int. J. Hydrog. Energy 2014, 39, 4158–4169. [Google Scholar] [CrossRef]
  18. Huszał, A. Nawanianie paliw gazowych gwarancją ich bezpiecznego użytkowania [Odorization of gaseous fuels as a guarantee of their safe use]. Naft. Gaz 2017, 11, 878–886. [Google Scholar] [CrossRef]
  19. Yunusa, Z.; Hamidon, M.N.; Kaiser, A.; Awang, Z. Gas Sensors: A Review. Sens. Transducers 2014, 168, 61–75. [Google Scholar]
  20. Karthikeyan, S.; Pandya, H.M.; Sharma, M.U.; Gopal, K. Gas Sensors—A Review. J. Environ. Nanotechnol. 2015, 4, 1–14. [Google Scholar] [CrossRef]
  21. Levitsky, I.A. Porous Silicon Structures as Optical Gas Sensors. Sensors 2015, 15, 19968–19991. [Google Scholar] [CrossRef] [PubMed]
  22. Hök, B.; Blückert, A.; Löfving, J. Acoustic gas sensor with ppm resolution. Sens. Rev. 2000, 20, 139–142. [Google Scholar] [CrossRef] [Green Version]
  23. Szlęk, M.; Holewa, J. Optymalizacja metody oznaczania zawartości związków siarki występujących w paliwach gazowych. Naft. Gaz 2015, 5, 308–313. [Google Scholar]
  24. Manufacturer’s Data Sheet. Available online: https://www.citytech.com/en-gb (accessed on 15 October 2020).
  25. Huszał, A. Nadzór nad poziomem nawonienia paliw gazowych świetle obowiązujących uregulowań prawnych i normatywnych. Naft. Gaz 2016, 11, 953–960. [Google Scholar] [CrossRef]
  26. Natural Gas Odorisation practices in Europe. Marcogaz Report 2020, GI-OD-09-04. Available online: https://www.marcogaz.org/wp-content/uploads/2021/04/GI-OD-09-04.pdf (accessed on 15 June 2020).
  27. ISO 19739; Natural Gas. Determination of Sulfur Compounds Using Gas Chromatography. Technical Committee ISO/TC 193/SC 1. International Organization for Standardization: Geneva, Switzerland, 2004.
  28. Jaworski, J.; Kukulska-Zając, E.; Kułaga, P. Wybrane zagadnienia dotyczące wpływu dodatku wodoru do gazu ziemnego na elementy systemu gazowniczego. Naft. Gaz 2019, 10, 625–632. [Google Scholar] [CrossRef]
  29. Jaworski, J.; Dudek, A. Study of the Effects of Changes in Gas Composition as Well as Ambient and Gas Temperature on Errors of Indications of Thermal Gas Meters. Energies 2020, 13, 5428. [Google Scholar] [CrossRef]
  30. Jaworski, J.; Kułaga, P.; Blacharski, T. Study of the Effect of Addition of Hydrogen to Natural Gas on Diaphragm Gas Meters. Energies 2020, 13, 3006. [Google Scholar] [CrossRef]
  31. Schuster, T.; Holewa-Rataj, J.; Kukulska-Zając, E. Ocena jakości paliw gazowych w kontekście wprowadzania wodoru do sieci gazu ziemnego. Gaz Woda I Tech. Sanit. 2019, 2, 42–46. [Google Scholar] [CrossRef]
  32. Wojtowicz, R. Analiza wpływu dodatku wodoru do gazu ziemnego na pracę urządzeń gazowych [Analysis of the impact of adding hydrogen to natural gas on the operation of gas equipment]. Naft. Gaz 2019, 8, 465–473. [Google Scholar] [CrossRef]
  33. Huszal, A.; Jaworski, J. Studies of the Impact of Hydrogen on the Stability of Gaseous Mixtures of THT. Energies 2020, 13, 6441. [Google Scholar] [CrossRef]
  34. Szewczyk, P.; Jaworski, J. Analiza wpływu dodatku wodoru do gazu ziemnego na szczelność połączeń wybranych elementów sieci i instalacji. Pr. Nauk. Inst. Naft. I Gazu 2020, 231, 1–134. [Google Scholar] [CrossRef]
  35. Jaworski, J.; Kułaga, P.; Ficco, G.; Dell’Isola, M. Domestic Gas Meter Durability in Hydrogen and Natural Gas Mixtures. Energies 2021, 14, 7555. [Google Scholar] [CrossRef]
  36. Łach, M. The accuracy of determining the compressibility factor for gas with increased hydrogen content—comparison of the calculation methods. Naft. Gaz 2016, 5, 329–338. [Google Scholar] [CrossRef]
  37. ISO 6146; Gas Analysis. Preparation of Calibration Gas Mixtures. Manometric Method. Technical Committee ISO/TC 158. International Organization for Standardization: Geneva, Switzerland, 1979.
  38. ISO 6144; Gas Analysis. Preparation of Calibration Gas Mixtures. Static Volumetric Method. Technical Committee ISO/TC 158. International Organization for Standardization: Geneva, Switzerland, 2003.
  39. ISO 6143; Gas Analysis. Comparison Methods for Determining and Checking the Composition of Calibration Gas Mixtures. Technical Committee ISO/TC 158. International Organization for Standardization: Geneva, Switzerland, 2001.
  40. DVGW G 5902(P); Odoriermittel-Messgeräte Ohne Gaschromatographische Trennung Des Analyten in Seine Einzelkomponenten. DVGW Deutscher Verein des Gas- und Wasserfaches e. V.: Bonn, Germany, 2012.
Figure 1. The operating principle of the: off-line measurements carried out away from the gas pipeline, using a sample taken from the gas stream to the laboratory (a) and on-line measurement system with a measuring device installed permanently or periodically at the sampling point (b).
Energies 15 00221 g001
Figure 2. Degree of utilization of various types of devices for monitoring THT concentration in gas within the PSG Sp. z o.o. area.
Energies 15 00221 g002
Figure 3. Chromatogram obtained using a Type I analyzer for M/H15 + THT, cTHT = 7.74 ± 0.38 ppm.
Energies 15 00221 g003
Figure 4. Graph showing the dependence between Type III analyzer response and hydrogen concentration, recorded for M/H01 to M/H8 mixtures.
Energies 15 00221 g004
Figure 5. A sample chromatogram obtained using a Type I analyzer for M/H1 + THT, cTHT = 9.40 ± 0.47 ppm.
Energies 15 00221 g005
Table 1. Characteristics of detectors used in chromatographic analyses of sulfur compounds [2,3].
DetectorSensitivitySelectivityDetection LimitLinearityApplication
TCD5–20 ngall compounds400 pg/mL
(propane)
105–106universal
PID25–50 pg
(aromatic compounds)
depends on lamp energy0.2 pg/s105–106mainly environmental analyses, e.g., air
FPD10–100 pg (S)
1–10 pg (P)
>105 (S)
>106 (P)
<20 pg (S/s)
<0.9 pg (P/s)
non-linear (S)
103–105 (P)
sulphur compounds
(393 nm)
phosphorous compounds (526 nm)
PFPD10 pg S/s (signal/noise)
S/N > 300
(peak/noise)
>106 S/s (S)
>106 (P)
<1 pg S/s (S)
<100 fg P/s (P)
sulfur–quadratic relationshipsulfur compounds
phosphorous compounds
EDusually not determined100%
for selected compounds,
e.g., THT
for THT
<0.03 ppm
sulfur-linear dependence on concentration orders
of magnitude
mainly toxic gases,
in gas industry: odorants
Table 2. Cross-sensitivity to gaseous pollutants at a temperature of 20 °C—as declared by a THT detector manufacturer [24].
Type of Gas TestedConcentration in SampleDetector Reading
(Identified as THT)
[mg/m3]
Carbon dioxide
CO2
5000 ppm0
Carbon oxide
CO
100 ppm2
Carbon sulfide
CS2
1%10
Ethylene
C2H4
1%Yes
numeric value not determined
Hydrocarbonsorder of magnitude%0
Hydrogen
H2
1%0
Hydrogen sulfide
H2S
20 ppm0 1
Isopropanol
C3H8O
200 ppm400
Methane
CH4
100%0
Nitrogen
N2
100%0
Tert-butyl mercaptan
(CH3)3CSH
10 mg/m310
1 With a built-in filter; constant exposure to a high interferent level may reduce filter performance. Notes: The table is not complete. The sensor may also detect other gases.
Table 3. Parameters of devices used in Poland for chromatographic measurement of THT concentration in distribution gas network.
Measurement
Method
Laboratory/
Off-Line
Periodic Measurements/
On-Line
Process Measurements/
On-Line
DeviceLaboratory Chromatograph (Type I)Mobile Analyzer
(Type II)
Process Analyzer
(Type III)
DetectorPFPDEDED
Detector specificityselective for sulfur comp.selective for THTselective for THT
Response linearity103 for sulfur comp.throughout the entire range of measured concentrationsthroughout the entire range of measured concentrations
Accuracydeclared:
±5%
determined *:
±1%
declared and determined *:
±5%
declared and determined *:
±7%
Precisiondetermined *:
1.5 ÷ 2%
determined *:
2%
determined *:
2 ÷ 3%
Result repeatabilitydetermined *:
<5%
determined *:
<5%
determined *:
<5%
Expanded uncertaintydetermined *:
±9.0%
determined *:
±8.2%
determined *:
±9.9%
Measurement rangemethod application range in THT analyses:
0 ÷ 200 mg/m3
0 ÷ 100 mg/m35 ÷ 100 mg/m3
Sample dispensing methodmanualmanual or
automatic
automatic
* Applies to the value determined at INiG—PIB.
Table 4. Listed compositions of the studied gas mixtures.
No.Mixture DesignationComposition of Tested Gas Mixture
1M/H0199.9% Methane + 0.1% H2 (V/V)
2M/H0299.8% Methane + 0.2% H2 (V/V)
3M/H0599.5% Methane + 0.5% H2 (V/V)
4M/H199% Methane + 1% H2 (V/V)
5M/H298% Methane + 2% H2 (V/V)
6M/H595% Methane + 5% H2 (V/V)
7M/H892% Methane + 8% H2 (V/V)
8M/H1090% Methane + 10% H2 (V/V)
9M/H1585% Methane + 15% H2 (V/V)
102E/H199% Group 2E natural gas + 1% H2 (V/V)
112E/H1585% Group 2E natural gas + 15% H2 (V/V)
Table 5. List of test results regarding the sensitivity of a Type IV electrochemical sensor on methane/hydrogen mixtures.
Measuring Device Mean THT Concentration in a M/H Mixture, d
[mg/m3]/[ppm]
M/H8 + THTM/H10 + THTM/H15 + THT
Varian 450 GC20.6 ± 0.4/
5.61 ± 0.11 *
23.5 ± 0.7/
6,.0 ± 0.19 *
25.2 ± 0.3/
6.87 ± 0.08 *
* Reference values (x0)
Type I device19.6 ± 0.7/
5.34 ± 0.19
24.6 ± 0.3/
6.70 ± 0.08
25.1 ± 0.7/
6.84 ± 0.19
Difference in mean values−4.85%+4.68%−0.40%
* Probable sensor poisoning; regeneration required. Reference conditions: T = 20 °C and P = 101.325 kPa-for each measuring point.
Table 6. List of quality test results involving THT concentration determination in M/H + THT mixtures.
Device Reading in the Form of THT Concentration
[mg/m3]
Hydrogen
Concentra-
tion
0.1%
(V/V)
0.2%
(V/V)
0.5%
(V/V)
1%
(V/V)
2%
(V/V)
Series
I24.5
35.0
40.0
91.1
60.0
70.0
90.7
80.5
85.9
97.2
(no further reaction *)
94.6
(no further reaction *)
II35.0
40.0
42.2
65.0
72.0
95.0
74.2
83.0
92.2
96.8
(no further reaction *)
101.0
(no further reaction *)
III26.0
24.8
37.0
93.1
65.7
68.4
91.0
82.5
74.7
99.0
(no further reaction *)
105.0
(no further reaction *)
* Probable sensor poisoning; regeneration required. Reference conditions: T = 20 °C and P = 101.325 kPa-for each measuring point.
Table 7. List of comparative test results regarding the quality of THT concentration measurements in M/H + THT mixtures, for analyzers with an electrochemical sensor.
Measuring DeviceMeasured Mean THT Concentration in a M/H + THT Mixture, d
[mg/m3]
M/H15 + THTM/H10 + THTM/H8 + THTM/H2 + THTM/H1 + THT
Type I25.1 ± 0.7 *24.6 ± 0.3 *19.6 ± 0.7 *21.8 ± 0.8 *12.3 ± 0.5 *
* Reference values (x0)
Type II.124.2 ± 0.323.8 ± 0.2 18.7 ±0.420.5 ± 0.7not tested
Difference relative to reference value−3.58%−3.25%−4.59%−5.96%-
Type II.2testing not possibletesting not possible14.1 ± 0.219.7 ± 0.511.1 ± 0.2
Difference relative to reference value--−28.06%−9.63%−9.76%
Type IIItesting not possibletesting not possibletesting not possibletesting not possible11.5 ± 0.7
Difference relative to reference value----−6.50%
Reference conditions: T = 20 °C and P = 101.325 kPa-for each measuring point.
Table 8. Results of long-term studies on the impact of hydrogen on the quality of THT concentration measurements in methane-hydrogen mixtures, for analyzers with an electrochemical sensor (ED).
Measuring Device Hydrogen
Content
Mean THT
Concentration
xn
Standard
Deviation
s
Measurement Accuracy *
Deviation from Actual Value
d
Relative Error
e
[%][mg/m3][mg/m3][mg/m3][%]
Type II.11526.710.68−1.0−3.5
Type III146.421.591.22.6
* Values calculated in relation to THT concentrations in tested mixtures determined with the reference method (laboratory chromatograph). Reference conditions: T = 20 °C and P = 101.325 kPa-for each measuring point.
Publisher’s Note: MDPI stays neutral with regard to jurisdictional claims in published maps and institutional affiliations.

