Article

Study of the Accelerated Degradation of the Insulation of Power Cables under the Action of the Acid Environment

by
Marius Florian Preduș
1,*,
Cristinel Popescu
2,
Eugen Răduca
1 and
Cornel Hațiegan
1,*
1
Department of Engineering Sciences, Faculty of Engineering, Babeș-Bolyai University, 320085 Cluj-Napoca, Romania
2
Department of Engineering Sciences, Faculty of Engineering, Constantin Brâncusi University, 210135 Târgu-Jiu, Romania
*
Authors to whom correspondence should be addressed.
Energies 2022, 15(10), 3550; https://doi.org/10.3390/en15103550
Submission received: 29 March 2022 / Revised: 23 April 2022 / Accepted: 9 May 2022 / Published: 12 May 2022
(This article belongs to the Special Issue Control and Monitoring of Renewable Energy Power Systems)

Abstract

:
Over operation time, there are a number of internal and external factors that change the characteristics of dielectric materials that are part of the electrical equipment. In areas with high pollution, an important requirement is the acidic chemical compounds in the soil in which the power cables are laid, which penetrate the insulation by infiltration, resulting in changes in the parameters of electrical insulation and causing a decrease in operating time. The paper is focused on the analysis, through a series of experimental determinations, of the effects of stresses to which the power cables laid in acidic environments are subjected, by simulating the operating conditions in the laboratory, obtaining concrete results. It also describes the direct current test installation used in the laboratory and presents the two stages of testing the cable sample inserted in the electrolyte, the first being a stage of accelerating the degradation of the insulation by supplying higher voltages to require insulation, and the second stage being the testing in the absence of the electric field, under the direct action of the chemical compounds from the installation tank. Given that in alternating current, the electric field causes an additional heating of the dielectric due to energy losses by electric polarization, the test is performed in direct current, precisely to be able to monitor the variation of insulation resistance in relation to temperature and losses through conduction currents, as a result of the Joule–Lenz effect and not as a result of the dielectric polarization process. At the same time, the power of the direct current source used is lower compared to that of an alternative current test source and does not contribute to the generation of electrical discharges during testing.

1. Introduction

During operation, electrical equipment is influenced by a number of internal and external factors, which cause degradation of its insulation over time [1]. Humidity, chemicals, salinity on the one hand, but also the influence of the electric field, accelerate the aging process of insulation, the final effect being its penetration and decommissioning [2,3,4,5,6].
Because in operation the power cables are supplied at different voltages, research has been carried out on the behavior of insulation at low voltages, using different methods to highlight the degradation of insulation in these conditions [7]. At the same time, electrical discharges precede the breakthrough phenomenon and generally occur in electric fields of lower intensity rather than those indicated by electrical equipment manufacturers. In most cases, electrical discharges occur only on small portions of the insulation, using the term “partial discharge”. Monitoring of partial discharges of electrical equipment in operation is important in assessing the actual state of insulation [8,9,10,11,12].
In order to investigate the mechanisms of degradation of the electrical insulation of electricity cables in operation, measurements were performed in the laboratory at predetermined intervals on samples of cables with insulation made of PVC, XLPE [13,14,15].
In the experimental study, the cable sample was placed in a rigid PVC pipe filled with an electrolyte solution, the composition of which comprised a series of chemical compounds, in order to simulate the environmental conditions in operation [4,14,15].
For testing, a monopolar cable was chosen with the following characteristics: type NA2XSY; Uo/Un = 12/20 kV; section 185 mm2; compacted aluminum conductor and copper wire screen. The cable, with a length of 4 m, was inserted into the vat in such a way that its two ends were located outside of it, at a height of more than 30 cm from the extremities, in order to avoid the phenomenon of contouring.
The test was performed in two stages. In the first phase, the cable was tested at the rated voltages above the recommended voltage, and the conduction currents, insulation resistance and electrolyte temperature were monitored at 24 h intervals.
The cable was tested for DC electric fields, where the values of the running currents are relatively low compared to those resulting in the case of AC electric fields, also taking into account the protection of the test equipment during the monitoring period.
At the same time, the direct current testing avoided the occurrence of losses caused by the phenomenon of dielectric polarization due to manufacturing defects, only monitoring the losses due to conduction currents following the Joule–Lenz effect [16,17].
In the second stage, the same cable sample was tested for a period of time in the absence of the supply voltage, being subjected only to the corrosive action of the electrolyte in the installation’s vat [18], and in the following time intervals, it was refueled at different voltage values until the penetration of the insulation occurred.

2. Description of the Experimental Equipment

The experiment was carried out for the cable during the two stages with the help of a high-voltage test installation, type HPG 70 D SEBAKMT (Figure 1), consisting of a high-voltage transformer, coupling capacitor, rectifier diodes, command, and control (Figure 2).
The developed principal scheme of the experimental installation for testing electrical insulation is presented in Figure 3.
The components of the experimental test installation with increased voltage in direct current:
  • 1—Voltage regulation autotransformer;
  • 2—Safety of protection of the installation;
  • 3—Transformer voltage lifter;
  • 4—Coupling capacitor;
  • 5/6—Recovery and multiplication diodes;
  • 7—Tertiary winding of measure;
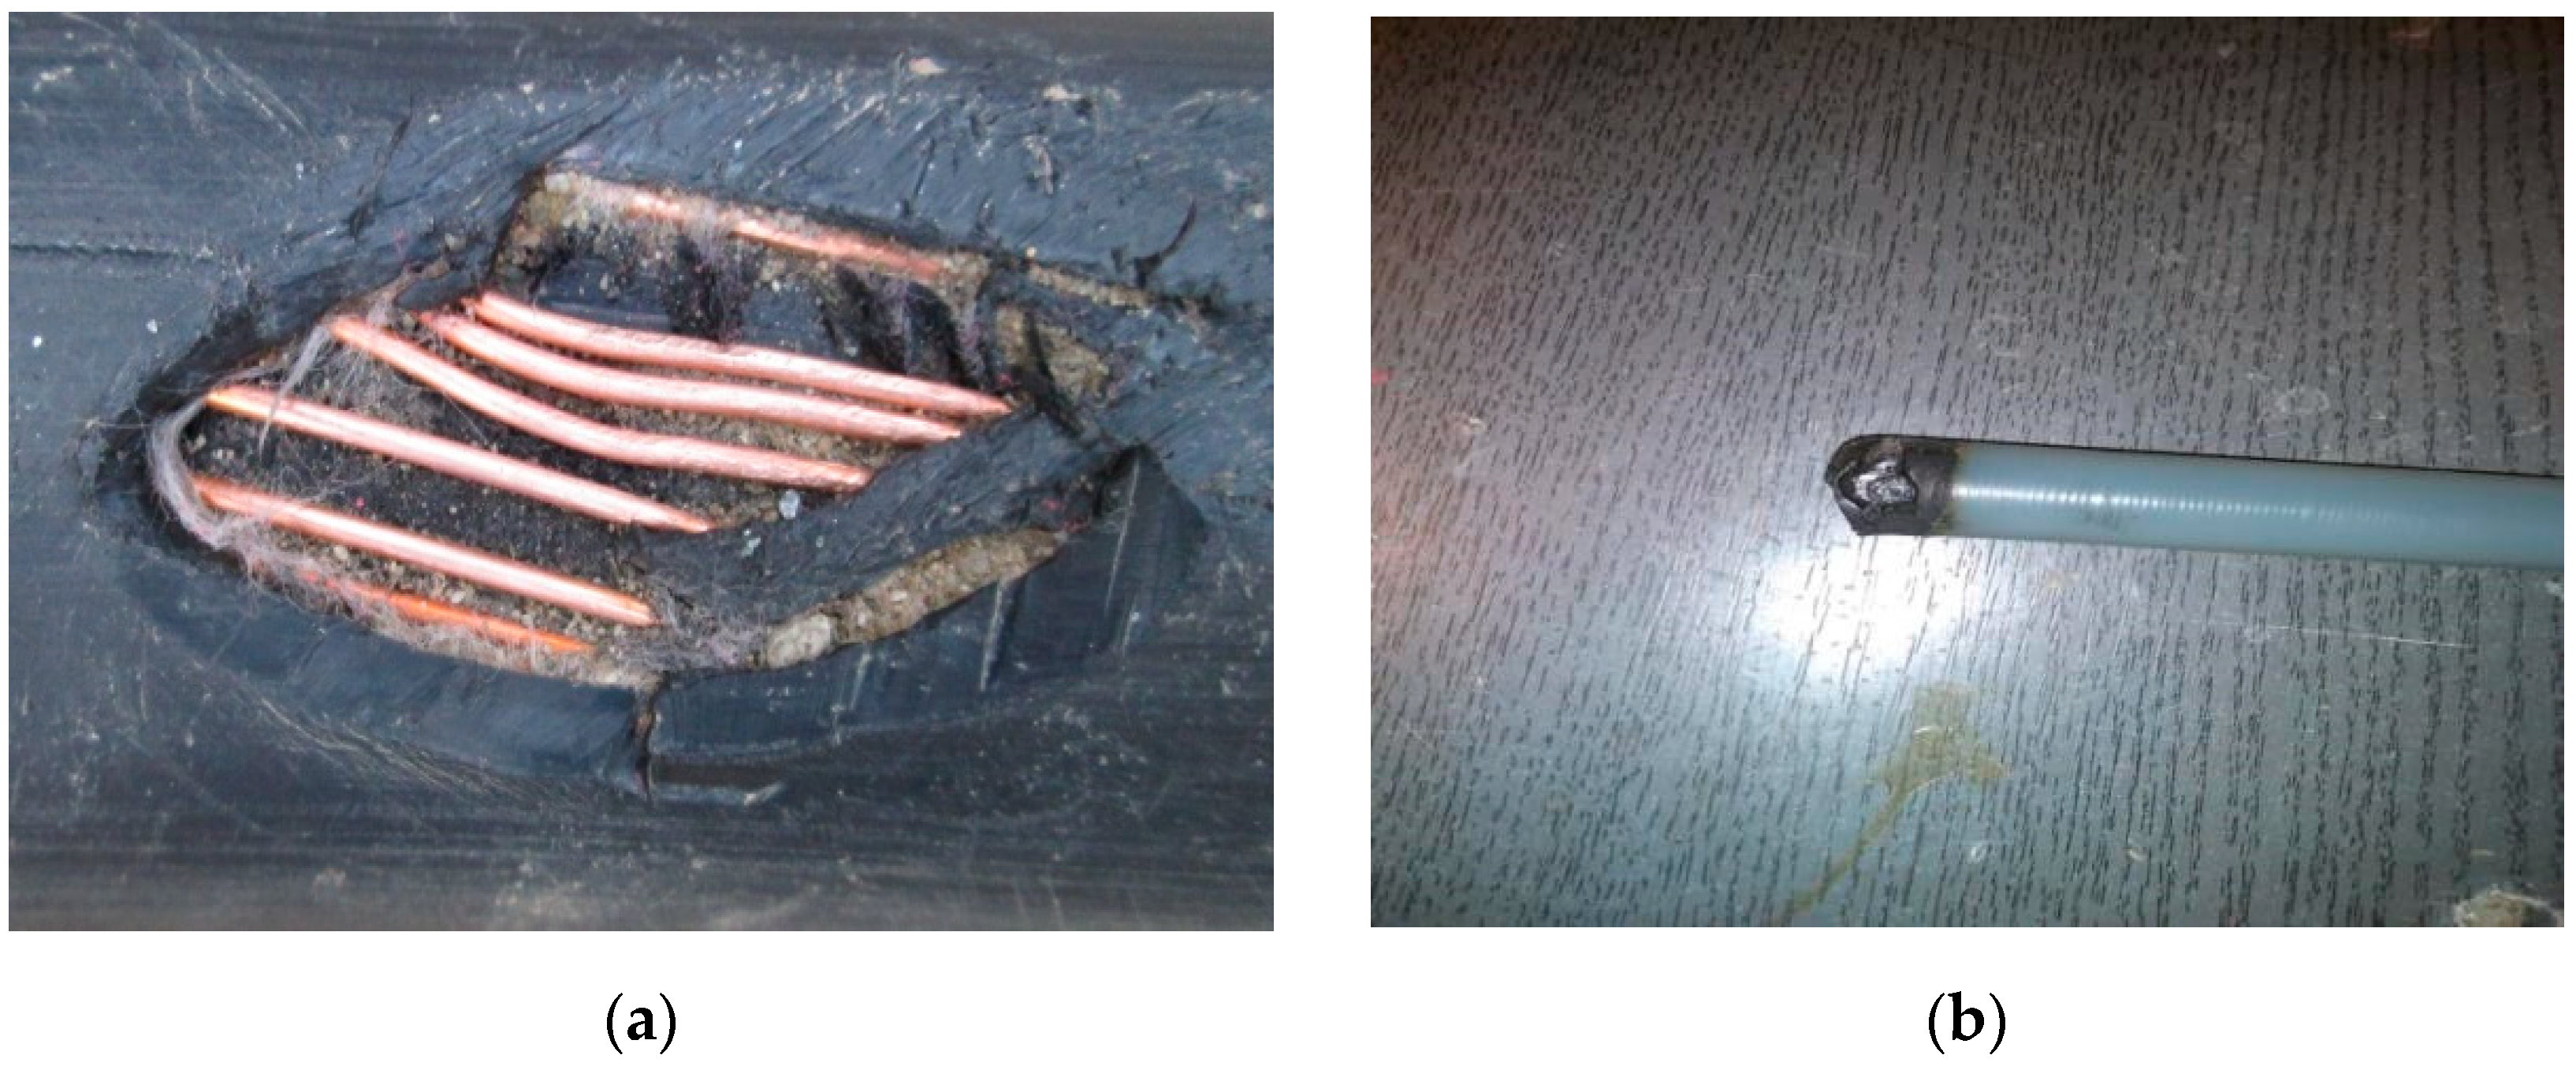
  • 8—Main conductor;
  • 9—Cable screen;
  • 10—PVC pipe;
  • 11—Graphite counter electrode;
  • 12—IsolatorIT.
High voltage is not measured directly but by means of the tertiary winding (7) of the transformer. For example, an alternating output voltage of 230 V AC, will mean a voltage of 70 kV DC applied to the power cable [19]. For a high (infinite) charge, at the capacitor terminals (4), the voltage will remain constant and equal to the voltage in the transformer’s secondary. The voltage applied to the diode (5) is equal to the sum of the voltage of the transformer’s secondary and the voltage drop on the coupling capacitor (US+UC). The resulting voltage is filtered and multiplied by a coefficient of 2.0 from the output voltage of the transformer [4,19].
The desired voltage level was obtained by varying the voltage applied to the transformer (3) using the autotransformer (1), the output voltage being read directly in kilovolts at the analog kilovoltmeter located on the control panel of the command and control unit [19]. The rigid PVC pipe was mounted in a horizontal position and fixed on IT (high voltage) ceramic insulators for the purpose of insulation from the ground. At the ends, there were mounted two PVC bends with an inclination of 87°. For the fixation of the insulator tube, perforated metal tape and barrel-type insulators were used, with the role of insulating the metal tape from its insulators (Figure 4). A mixture of electrolytic substances was introduced into the pipe, and at one end of the PVC pipe, a counter electrode made of inert material (graphite) was mounted, fixed on the insulating support [4].
In terms of chemical composition, the liquid substance introduced into the PVC tube was obtained by combining sulphuric acid (H2SO4) and nitric acid (HNO3), both diluted with water (H2O), in order to obtain a composition similar to that of the acid rain existing in the atmosphere, with oxidizing properties [15,20,21,22].The acidity of the resulting electrolyte was measured using a digital pH meter with a thermometer, in the measuring range 0–14 pH (accuracy ±0.01 pH). This temperature-compensating device of Extech PH 220-C type, produced by Cole-Parmer, allows measurements to be recordedfor any temperature in the range 0–100 °C (accuracy ±0.5 °C) [23].
From the experimental research in the field, it has been shown that water has the neutrality point for a pH = 7. Below this value, water becomes acidic. In view of this, a concentration with a pH of 3.9 was obtained, a value frequently recorded in the composition of acid rains near industrial areas with high pollution [20,21,22,23].

3. Experimental Research

The laboratory installation was designed to create the necessary conditions for the electrochemical corrosion process [15,22], namely the existence of an anode and a cathode, the electrolytic solution and the conductor. For this purpose, a cable sample was chosen to contain in its structure metal materials of different potentials, which could be connected galvanically.
In the present case, the aluminum conductor of the test cable, being a more electronegative metal than copper, became the cathode of the installation, while the copper wire screen became the positive pole (anode).
The conduction current, which circulates between the anode and the cathode through the electrolytic solution (leakage current), is the one that causes the degradation of the insulation by electrochemical corrosion [4].
In the preparation of the electrolyte, a series of protective measures were undertaken, taking into account the avoidance of direct contact with the skin, eyes, inhalation, etc., so that the preparation of the solution was carried out carefully by gradually pouring the concentrated acid into the water and its continuous agitation until homogenization. Measures were taken to ventilate the room, given the possibility of gas emanation during the preparation and use of chemicals [16,24].
Before the installation was put into operation, the isolation resistance of the test cable inserted into the PVC tube, respectively, of the main conductor, to the screen connected to the graphite counter electrode, in contact with the acidic substance, was measured. The insulation resistance was metered at 5 kVDC, for 60” by using a digital megohmmeter of MI 2077 type [24,25].
Additionally, during the tests, measurements were taken on the humidity degree of the electrical insulation in depth using, for this purpose, a humidity meter for materials, type T660. This digital instrument works on the principle of capacitive measurement and can measure the degree of humidity(%) of a material by simply approaching, at a depth of up to 40 mm, with an accuracy of ±0.1%.
The installation was put under voltage only after ensuring all the conditions of protection against electric shock were met. The direct touch of the cable was performed only after removing the installation from the voltage and unloading it with the help of the insulating stick.

3.1. Analysis of the Behavior of Insulation in the Acidic Environment at Different Voltages and in the Absence of Voltage

The experimental research was carried out in two distinct stages. In the first stage of the experimental study, the cable was subjected to different voltages, in a time interval of 168 h, being initially supplied to the voltage of 72 kV DC.
Before the start of the test phase, the values of the insulation resistance and the conduction current were measured according to the norm [24], which stipulates that the value of the test voltage of medium voltage cables must be 6Uo (nominal phase voltage), at 20 °C, for a time interval of 15 min.
The values resulting from these verifications were the basis of reference throughout the experimental study, also showing that the cable sample corresponds in terms of insulation status to be inserted into the electrolyte in the tank.
At intervals of 24 h, the power supply of the tested cable was interrupted for a short time in order to measure the Rins insulation resistance and the electrolyte temperature, after which the reinitialization maneuver was performed, starting, each time, from the voltage measured Um before the disconnection.
By maintaining a high voltage level, the cable was subjected to an accelerated aging process, under the action of the electrolyte, resulting in significant decreases in the values of the insulation resistance compared to the initial ones.
The test was carried out until the measured values of the conduction currents Ic and insulation resistance Rins had stabilized (Table 1).
In the second stage of the experimental study, the cable was devoltaged (Us = 0) for 120 h, where the only request was from the acidic medium caused by the electrolyte in the plant’s vat. After this time interval, the cable was refueled at different voltages(Us= 12; 20; 30 kV DC) until the moment of penetration of the insulation (Table 2).
The humidity measurement in the insulation was carried out only after the time intervals in which the gradient of the conduction current Ic was the highest and in those of lack of voltage, each time applying the contact blade of the luminometer directly on the surface outer sheath (previously cleaned of the electrolyte), at one of the two ends of the bowl. In Figure 5, the place and mode of penetration of the insulation produced during the insulation tests are shown. To visualize the penetration, the external shell of the cable and the semiconductor layer was removed up to the area of the main conductor.

3.2. Interpretation of Results

In range I, the cable was supplied at the voltage of 72 kV DC, observing at the end of the range a significant increase in the value of the conduction current through insulation, which heated the electrolyte in the vat to the temperature of about 48 °C. Under these conditions, the value of the insulation resistance decreased significantly, the percentage decrease being about 44% compared to the initial value.
In intervals II–IV, due to losses from the dielectric, the values of the supply voltage measured at the end of each interval continued to decrease from one interval to another, simultaneously with smaller variations in the other electrical quantities, until the moment (intervals V–VII) in which they began to stabilize.
The absorption of insulation electrolyte in the intervals I, II, III was low, with a degree of humidity in the range of 2–6%.
The variations in the monitored size values during the first stage of the experimental study are shown in Figure 6.
In the second step, the sample of the cable submerged in the electrolyte was also tested in the absence of supply voltage for 120 h (I–V intervals). As a result of the measurements taken, the insulation resistance values measured at intervals of 24 h recorded the largest percentage decrease, of approximately 95% compared to the reference values at the beginning of this step, indicating an accelerated degradation process (Figure 7). At the same time, humidity measurements at the insulation level, in intervals II and V, showed a high degree of absorption, respectively, 62% and 88%.
After reenergizing at different voltages, the insulation resistance values continued to decrease, while the values of the conduction current far exceeded the permissible value, eventually causing the insulation to break down at the voltage of 42 kVDC (Figure 8).

4. Conclusions

In conclusion, the experimental research highlights the stresses to which the electrical power cables in operation are subjected, resulting in the following aspects:
  • Under operating conditions at voltages close to the nominal value (Uo/Un = 12/20 kV), the conduction current circulating through the insulation determines normal heating, keeping the insulation at a positive temperature, in principle higher in relation to the temperature in the installation tank. The absorption of the electrolyte, in this case, is a reduced one;
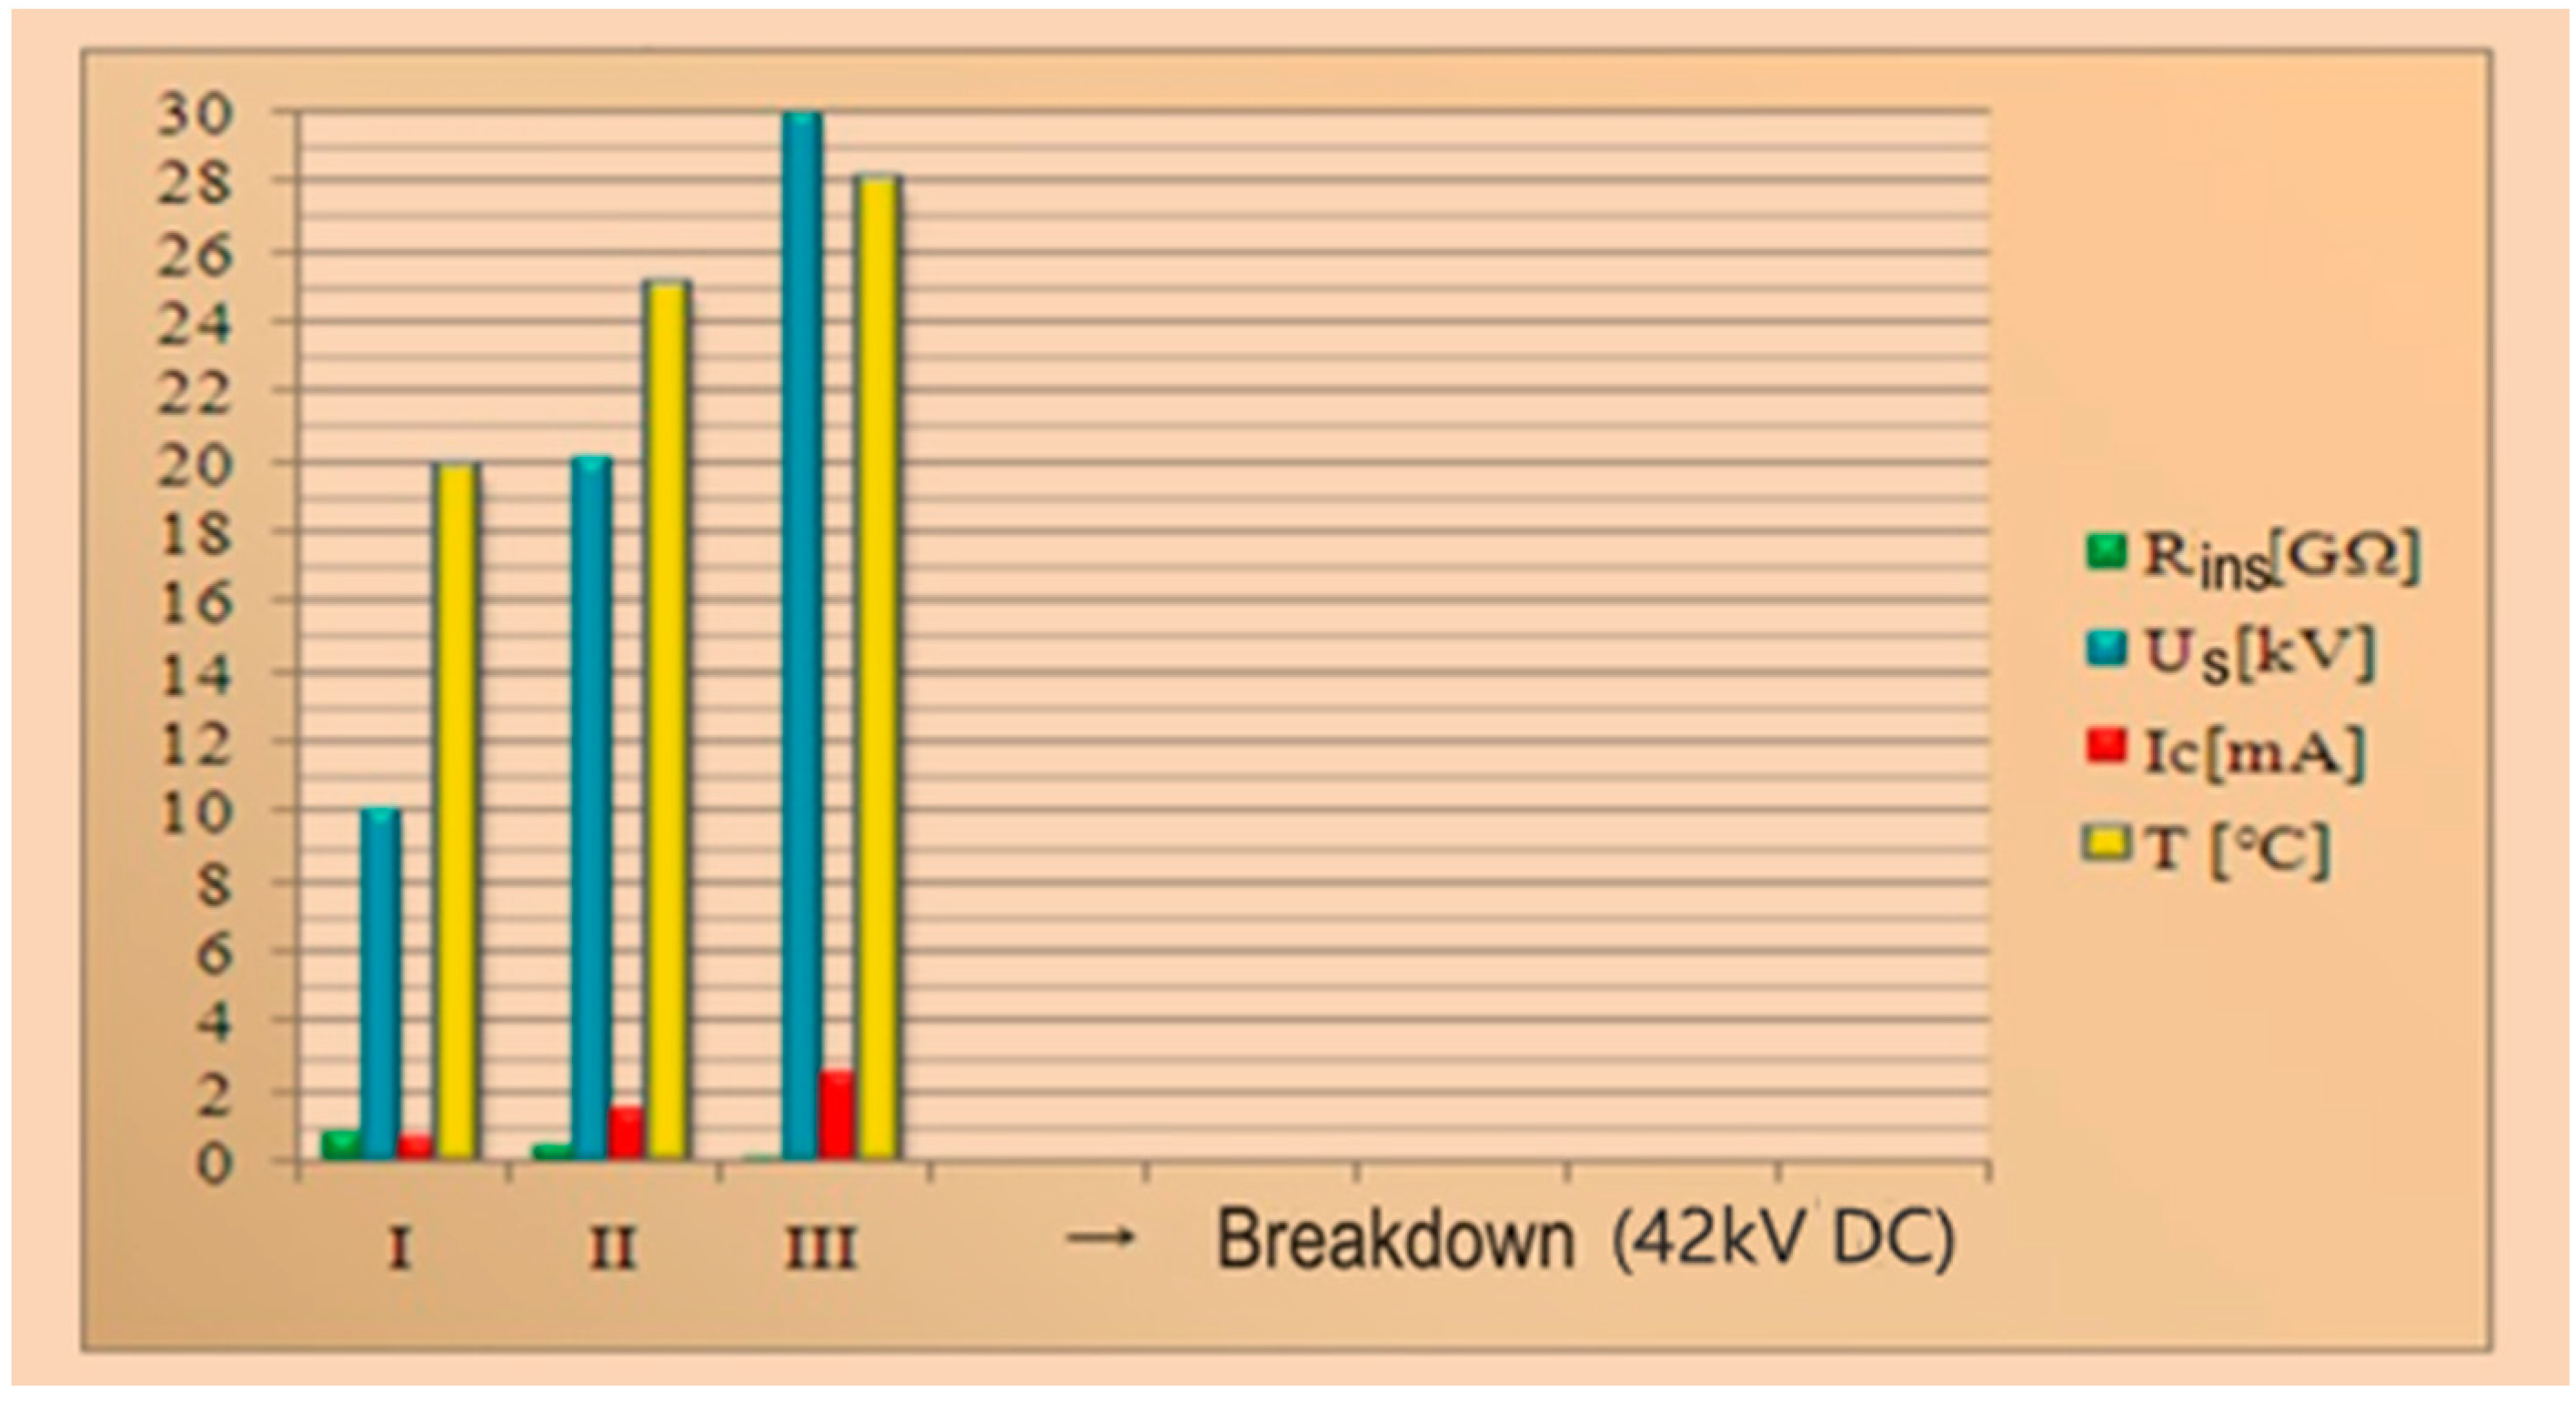
  • In the time interval in which the supply voltage has high values in relation to the nominal voltage of the cable sample, the insulation enters a process of continuous degradation as a result of heating, losing its insulating properties and generating a rapid decrease in the value of insulation resistance;
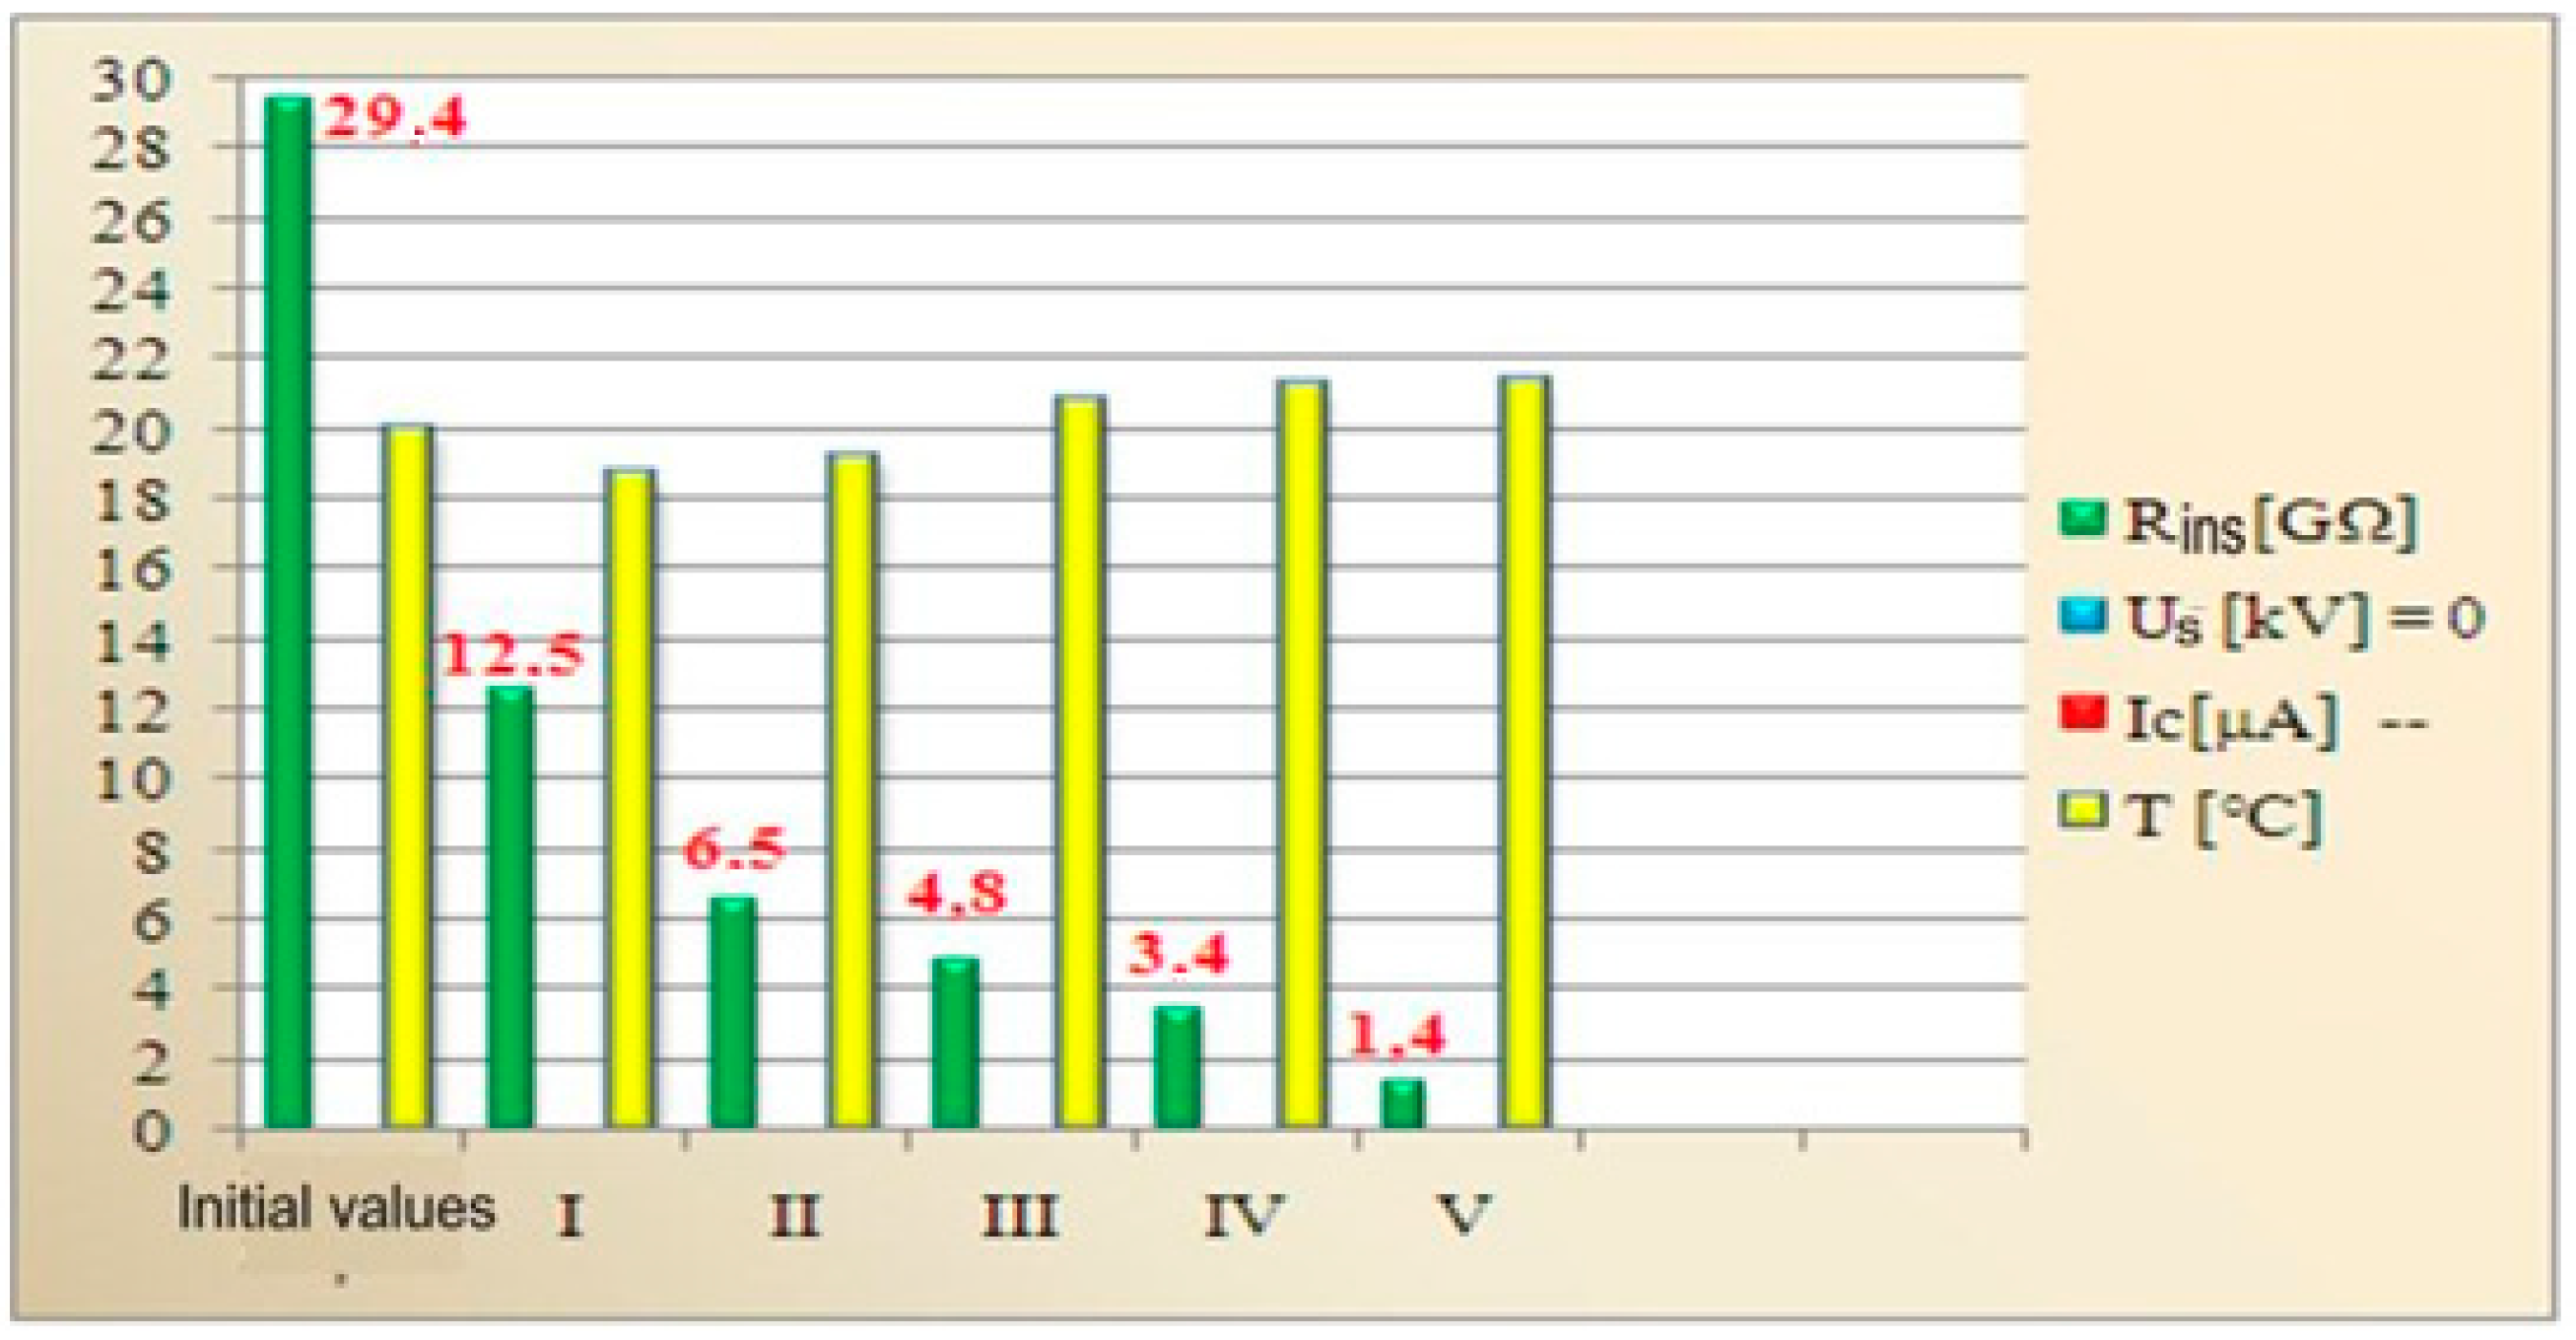
  • In the absence of supply voltage, the internal temperature of the cable decreases with the temperature of the electrolyte in the vat, and the process of degradation of the insulation increases, since the insulation absorbs a greater amount of electrolyte from the installation’s vat, causing significant decreases in the value of insulation resistance.
The experimental results were validated to confirm the severe deterioration of the insulation of cables buried in mining areas, near industrial areas, or in areas where water pH measurements in the vicinity of cable routes indicated high acidity.
The insulation defects of the cables laid in these environmental conditions are characterized by breakdowns of the insulation caused by the aggressive action of the acid substance, which turned the outer electrical insulating layer into a gelatinous mass, especially next to the joint sleeves.
In order to limit incidents in the acid environment, it is recommended to use electric cables and connection sleeves with higher chemical resistance, designed for the acid environment.
Based on these considerations, it is recommended to avoid situations where unused electricity cables in operation are left unpowered for long periods of time. In this case, because a conduction current (leakage) does not circulate through the insulation, the insulation contracts and allows water and corrosive agents to penetrate inside the cable, especially in the area of the sleeves or terminal ends. This phenomenon occurs mainly in periods of low temperatures and high humidity.
At the same time, the use of electricity cables at voltages other than nominal ones should be avoided, as they accelerate the aging process of the insulation and cause the premature appearance of the dielectric penetration phenomenon.
We conclude that this experimental study is important in understanding the mechanisms of degradation of cable insulation in operation, to identify the causes of possible defects and to prevent premature penetration of electrical cables.
At the same time, the results obtained experimentally are confirmed by the reports of findings obtained in operation, on the occasion of the processes of locating the defects in the environment with high acidity.

Author Contributions

Conceptualization: M.F.P. and C.H., Methodology: M.F.P., C.P., E.R. and C.H., Validation: M.F.P., C.P., E.R. and C.H., Formal analysis: M.F.P. and C.H., Investigation: M.F.P. and C.H., Resources: M.F.P., C.P., E.R. and C.H. All authors have read and agreed to the published version of the manuscript.

Funding

This research received no external funding.

Institutional Review Board Statement

Not applicable.

Informed Consent Statement

Informed consent was obtained from all subjects involved in the study.

Data Availability Statement

Not applicable.

Conflicts of Interest

The authors declare no conflict of interest.

References

  1. Chengke, Z.; Huajie, Y.; Xiang, D. Review of Recent Research towards Power Cable Life Cycle Management. High Volt. 2017, 2, 179–187. [Google Scholar]
  2. Munteanu, L.; Gurguiatu, G.; Bălănuță, C. Reliability and Quality in Electrical Engineering; Galați University Press: Galaţi, Romania, 2009. [Google Scholar]
  3. Preduș, M.F.; Spunei, E.; Roșu, M. Diagnostic of Defects at Electric Lines in Cable. In Proceedings of the 10th International Conference on Electromechanical and Power Systems SIELMEN 2015, Chişinău, Moldova, 8–9 October 2015. [Google Scholar]
  4. Yuan, J.; Feng, J.; Zhu, H.; Luo, J. Study on Mechanism of Water Tree Caused in XLPE Power Cable Dielectric. High Volt. Eng. 2002, 28, 8–9. [Google Scholar]
  5. Zhou, K.; Huang, M.; Tao, W.; He, M.; Yang, M. A possible water tree initiation mechanism for service-aged XLPE cables: Conversion of electrical tree to water tree. IEEE Trans. Dielectr. Electr. Insul. 2016, 23, 1854–1861. [Google Scholar] [CrossRef]
  6. Preduș, M.F. Research on Increasing Efficiency of Defect Diagnose in Cable Electric Lines. Master’s Thesis, Polytechnic University of Bucharest, Bucharest, Romania, 2020. [Google Scholar]
  7. Kang, S.D.; Kim, J.H. Investigation on the Insulation Resistance Characteristics of Low Voltage Cable. Energies 2020, 13, 3611. [Google Scholar] [CrossRef]
  8. Hațiegan, C.; Padureanu, I.; Jurcu, M.R.; Biriescu, M.; Răduca, M.; Dilertea, F. The evaluation of the insulation performances of the stator coil for the high power vertical synchronous hydro-generators by monitoring the level of partial discharges. Electr. Eng. 2017, 99, 1013–1020. [Google Scholar] [CrossRef]
  9. Bordeasu, D.; Prostean, O.; Hațiegan, C. Contributions to Modeling, Simulation and Controlling of a Pumping System Powered by a Wind Energy Conversion System. Energies 2021, 14, 7696. [Google Scholar] [CrossRef]
  10. Haţiegan, C.; Răduca, E.; Popescu, C.; Hamat, C.O.; Băra, A.; Anghel, D.; Pîrşan, D.A. Experimental Measurements Concerning the Stator Insulation Partial Discharge Level of a Hydro-Generator of High Power. In Proceedings of the IOP Conference Series: Materials Science and Engineering, Hunedoara, Romania, 20–22 October 2017; Volume 294. [Google Scholar]
  11. Gușă, M. Electrical Discharges in the Insulation of High Voltage Installations; Technical University Gheorghe Asachi Iași: Iași, Romania, 2015. [Google Scholar]
  12. Dumitran, L.M. Electrical Insulation Systems; Printech Publishing House: Bucharest, Romania, 2008. [Google Scholar]
  13. Ionita, I.; Radulescu, C.; Stihi, C.; Popescu, I.V.; Poinescu, A.A.; Bunghez, I.R. The Behavior of Underground Power Cables under the Action of Stress Factors. Rom. J. Phys. 2014, 59, 1150–1159. [Google Scholar]
  14. Hedir, A.; Moudoud, M.; Loucif, A. Degradation Study of Power Cables Insulation under AC Electric Field, Based on Electrical Measurements and Physico-Chemical Analysis. In Proceedings of the 1st Algerian Multi-Conference on Computer, Electrical and Electronic Engineering (AMCEEE'17), Algiers, Algeria, 24–27 April 2017. [Google Scholar]
  15. Lingvay, I.; Lingvay, C. Corrosion Degradation of Power Lines; Printech Publishing House: Bucharest, Romania, 2008. [Google Scholar]
  16. Hațiegan, C.; Predus, M.F.; Popescu, C. Effects of Acidic Water Containing Tailings on the Insulation of Electrical Cables. In Proceedings of the Scientific Conference with International Participation “CONFERENG 2021”, Targu-Jiu, Romania, 25–27 November 2021. [Google Scholar]
  17. Zhou, K.; Tao, W.; Zhao, W.; Yang, D.; Yang, M. Toward Understanding the Characteristics of Water Tree Growth at Different Temperatures in XLPE Based on the Theory of Molecular Orientation. High Volt. Eng. 2014, 40, 3665–3673. [Google Scholar]
  18. Mao, W.P. Investigation of Installation and Type Selection of Cables at Low Temperatures. Electr. Wire Cable 2009, 5, 38–40. [Google Scholar]
  19. SebaKMT—High Voltage Command and Control Equipment Operation Manual, Type HSW 3-2. 2001. Available online: www.sebakmt.com (accessed on 4 April 2008).
  20. Dumitrescu, I. Environmental Pollution; Universitas Publishing House: Petroșani, Romania, 2005. [Google Scholar]
  21. Sabău, N.C. Genesis, Degradation and Soil Pollution—Part II; University of Oradea Publishing House: Orade, Romania, 2017. [Google Scholar]
  22. Lazăr, M. Research on the Stability and Ecological Reconstruction of Lands Affected by Mining. Ph.D. Thesis, University of Petroșani, Petroșani, Romania, 2016. [Google Scholar]
  23. Extech pH Meter Model PH220, User Manual. 2021. Available online: http://www.extech.com/products/resources/PH220_UM-en.pdf (accessed on 10 March 2022).
  24. PE116/94. Energy Research and Modernization Institute, PE116/94—Standard for Tests and Measurements on Electrical Equipment and Installations. Icemenerg Publishing House: Bucharest, Romania, 1994.
  25. Pispiris, S. Technological Procedure 3.2.FT4-93, Methods for Checking Power Lines in 1–35kV Cable; Icemenerg Publishing House: Bucharest, Romania, 1993. [Google Scholar]
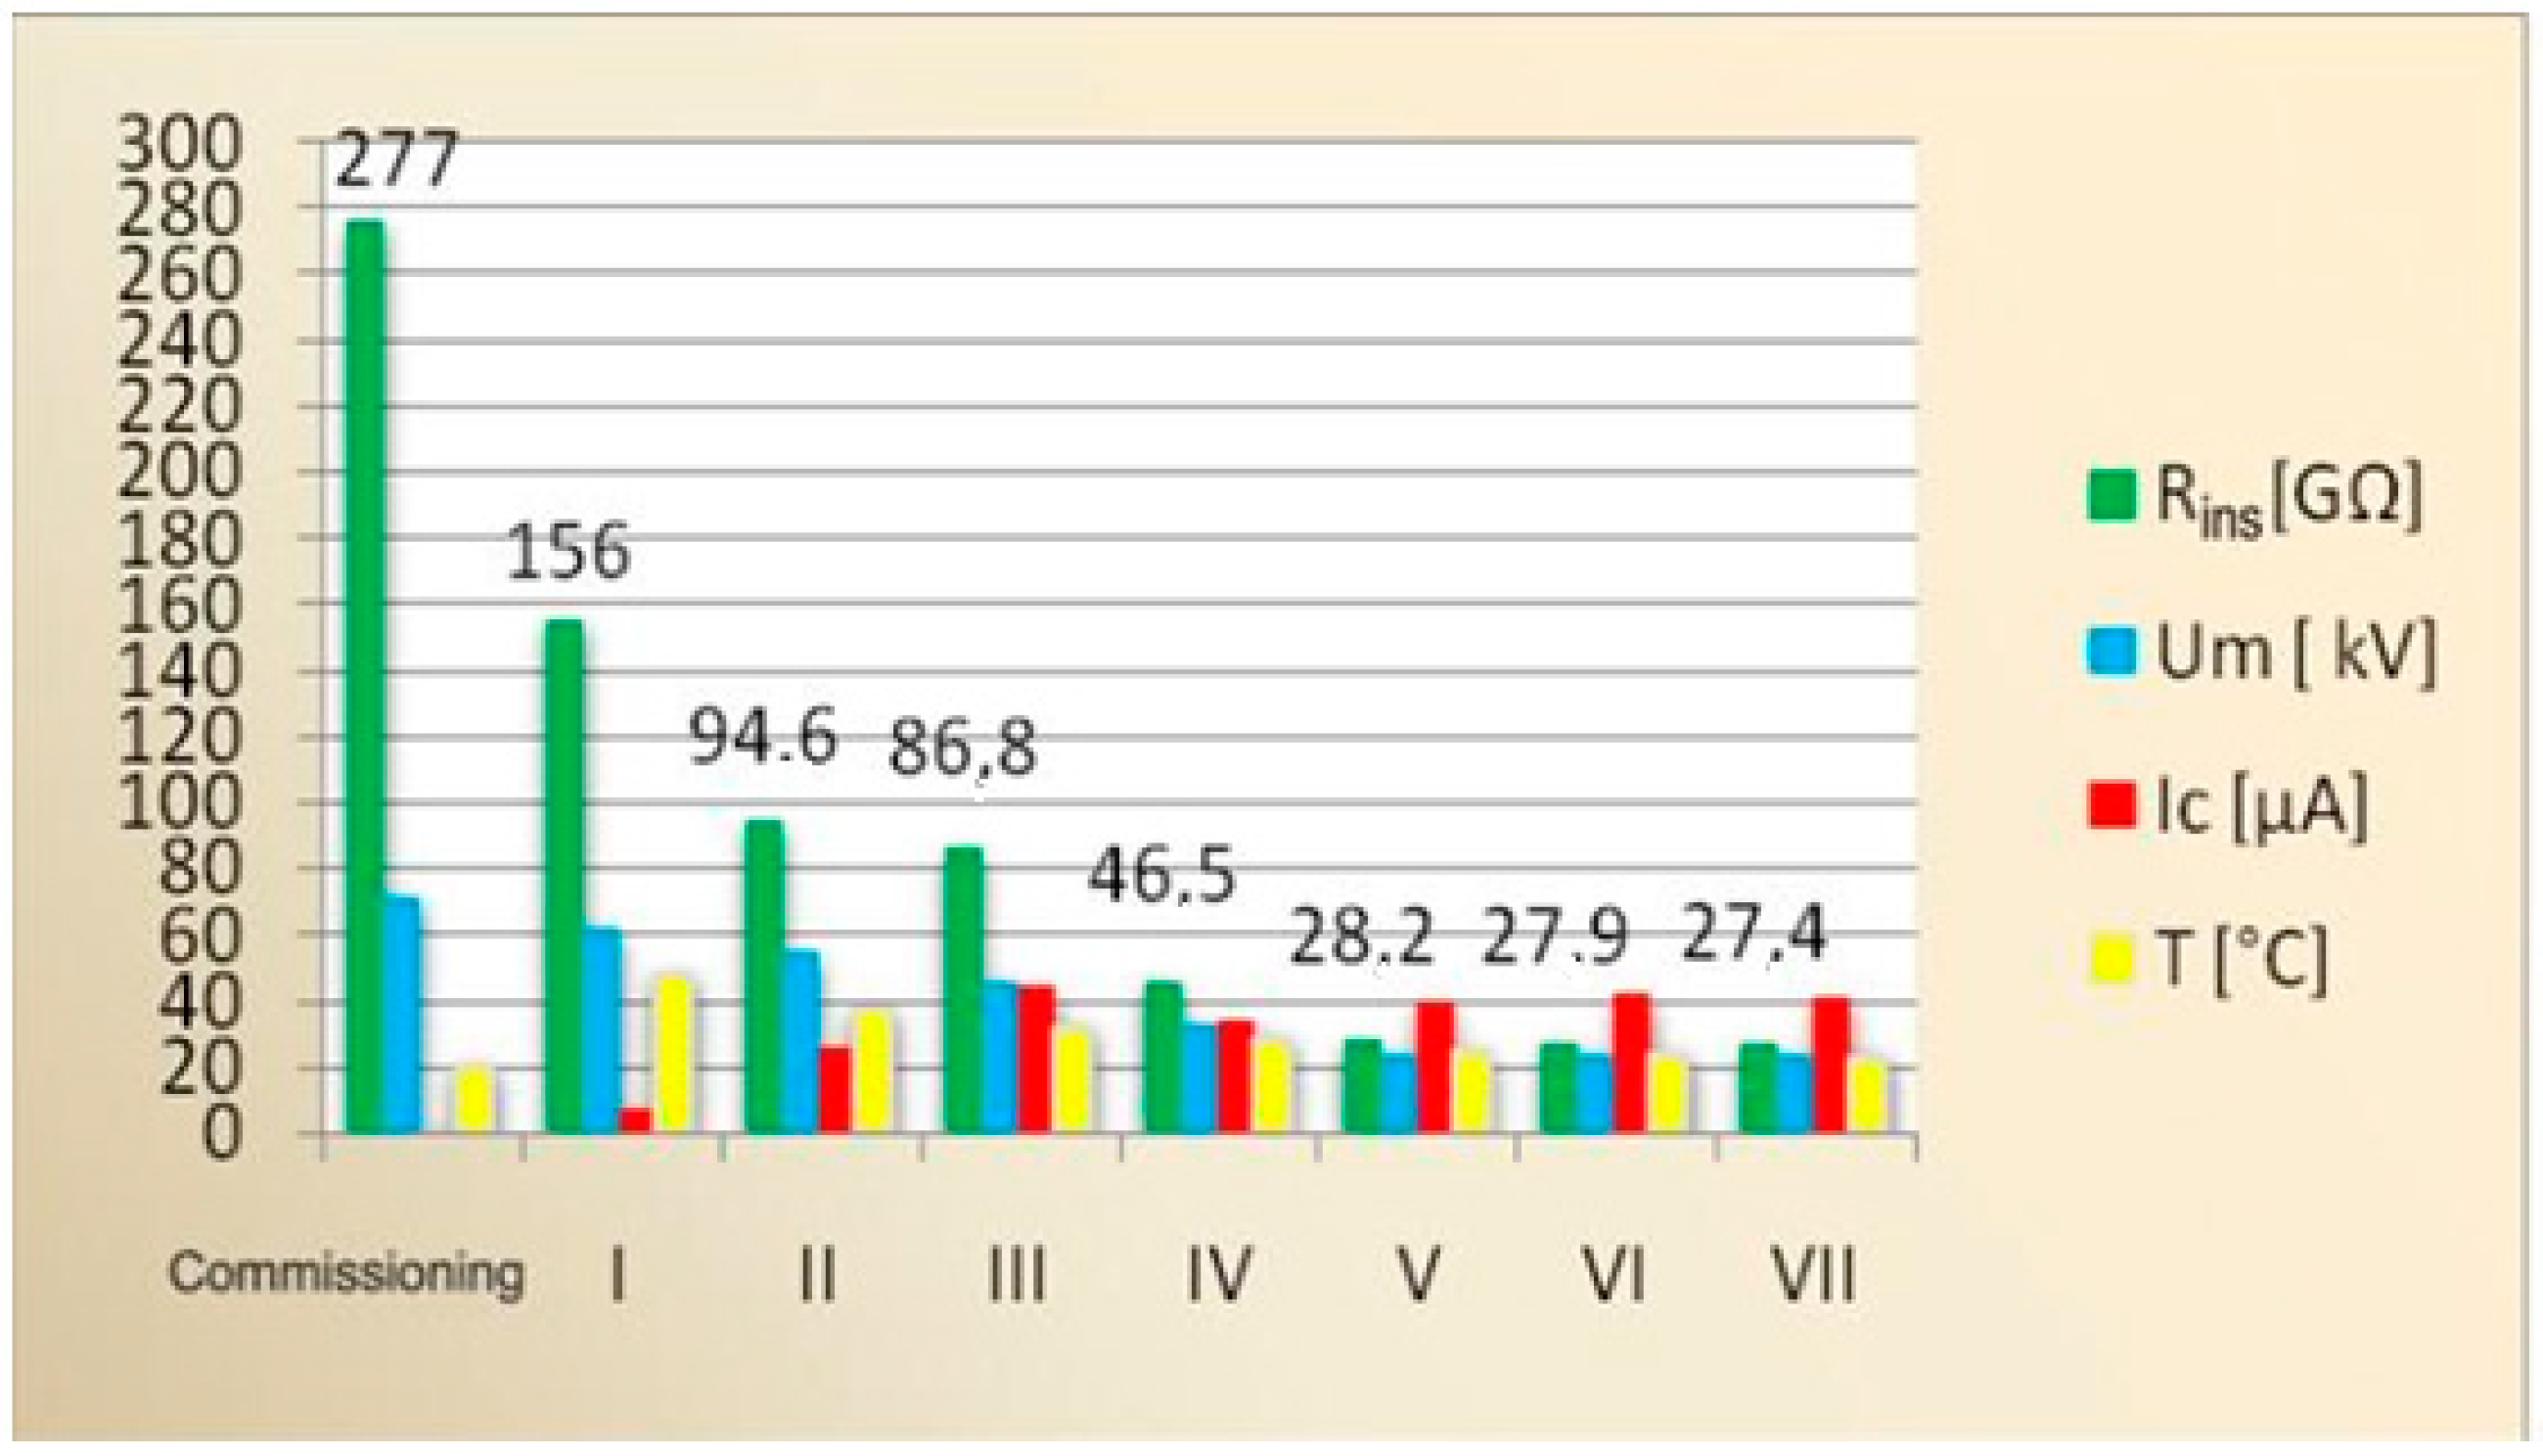
Figure 1. High-voltage test installation type HPG 70 D: (1) IT transformer; (2) Capacitor coupling and multiplication; (3) Multiplier rectifier diodes; (4) Connection cables; (5) Connection box.
Energies 15 03550 g001
Figure 2. The interface of the command and measuring panel.
Energies 15 03550 g002
Figure 3. Components of the experimental installation for testing with high voltage using DC current. 1—Voltage regulating autotransformer; 2—Safety protection of the installation; 3—Voltage transformer; 4—Coupling capacitor; 5/6—Rectification and multiplication diodes; 7—Tertiary winding of measurement; 8—Main conductor; 9—Cable screen; 10—PVC tub; 11—Graphite counter electrode; 12—IT isolator.
Energies 15 03550 g003
Figure 4. (a)Assembly of the multilayer PVC pipe, fireproof type SN4-125×3.2, PVC elbow type D125 87°; (b) Method used for fixing the tube on the IT insulating support.
Energies 15 03550 g004
Figure 5. Visualization of the place of breakdown of the insulation: (a) after the removal of the outer shell; (b) after the removal of the semiconductor layer.
Energies 15 03550 g005
Figure 6. Graphical representation of the sizes during each test interval.
Energies 15 03550 g006
Figure 7. Graphic representation of sizes in the absence of supply voltage.
Energies 15 03550 g007
Figure 8. Graphic representation of the dimensions until the moment of penetration of the insulation.
Energies 15 03550 g008
Table 1. Constant measured size values in the first stage of the experimental study.
Time IntervalsUm
[kVcc]
Ic
[μA]
Rins
[GΩ]
Telectrolyte
[°C]
Insulation test before the testing stage15″72.02.0277.020.0
I24 h62.216.8156.047.8
II48 h54.826.594.638.0
III72 h46.545.086.832.4
IV96 h32.934.546.528.5
V120 h24.040.028.224.5
VI144 h23.842.327.923.7
VII168 h23.441.827.423.2
Table 2. Constant measured size values in the second stage of the experimental study.
Time IntervalsUs
[kVcc]
Ic
[μA]
Rins
[GΩ]
Telectrolyte
[°C]
----29.420.0
I24 h--12.518.7
II48 h--6.519.2
III72 h--4.820.8
IV96 h--3.421.2
V120 h--1.421.4
Reenergisation
I24 h12690.50.819.8
II48 h201450.00.425.0
III72 h302480.00.128.0
IV-42→ breakdown
Publisher’s Note: MDPI stays neutral with regard to jurisdictional claims in published maps and institutional affiliations.

