Article

A Proper-Orthogonal-Decomposition (POD) Study of the Wake Characteristics behind a Wind Turbine Model

1
Department of Physics and Engineering, Central College, Pella, IA 50219, USA
2
School of Aeronautics and Astronautics, Shanghai Jiao Tong University, Shanghai 200240, China
3
Department of Aerospace Engineering, Iowa State University, Ames, IA 50012, USA
*
Author to whom correspondence should be addressed.
Energies 2022, 15(10), 3596; https://doi.org/10.3390/en15103596
Submission received: 29 March 2022 / Revised: 7 May 2022 / Accepted: 8 May 2022 / Published: 13 May 2022

Abstract

:
A comprehensive study was performed to analyze turbine wake characteristics by using a Proper-Orthogonal-Decomposition (POD) method to identify the dominant flow features from a comprehensive experimental database. The wake flow characteristics behind a typical three-bladed horizontal-axis wind turbine (HAWT) were measured in a large-scale wind tunnel with a scaled turbine model placed in a typical offshore Atmospheric Boundary Layer (ABL) wind under a neutral stability condition. A high-resolution Particle Image Velocimetry (PIV) system was used to achieve detailed flow field measurements to characterize the turbulent flows and wake vortex structures behind the turbine model. Statistically averaged measurements revealed the presence of the characteristic helical-tip vortex filament along with a unique secondary vortex filament emanating from 60% of the blade span measured from the hub. Both filaments breakup in the near-wake region (~0.6 rotor diameter downstream) to form shear layers, contrary to previous computational and experimental observations in which vortex filaments break up in the far wake. A Proper-Orthogonal-Decomposition (POD) analysis, based on both velocity and vorticity-based formulations, was used to extract the coherent flow structures, predominantly comprised of tip and midspan vortex elements. The reconstructions showed coherence in the flow field prior to the vortex breakup which subsequently degraded in the turbulent shear layer. The accuracy of the POD reconstructions was validated qualitatively by comparing the prediction results between the velocity and vorticity-based formulations as well as the phase-averaged PIV measurement results. This early vortex breakup was attributed to the reduced pitch between consecutive helical turns, the proximity between midspan filaments and blade tips as well as the turbulence intensity of the incoming boundary layer wind.

1. Introduction

A better understanding of the wake characteristics behind a horizontal-axis wind turbine (HAWT) is very essential for optimizing the power output of an individual turbine or in windfarm siting [1]. As described in Sanderse [
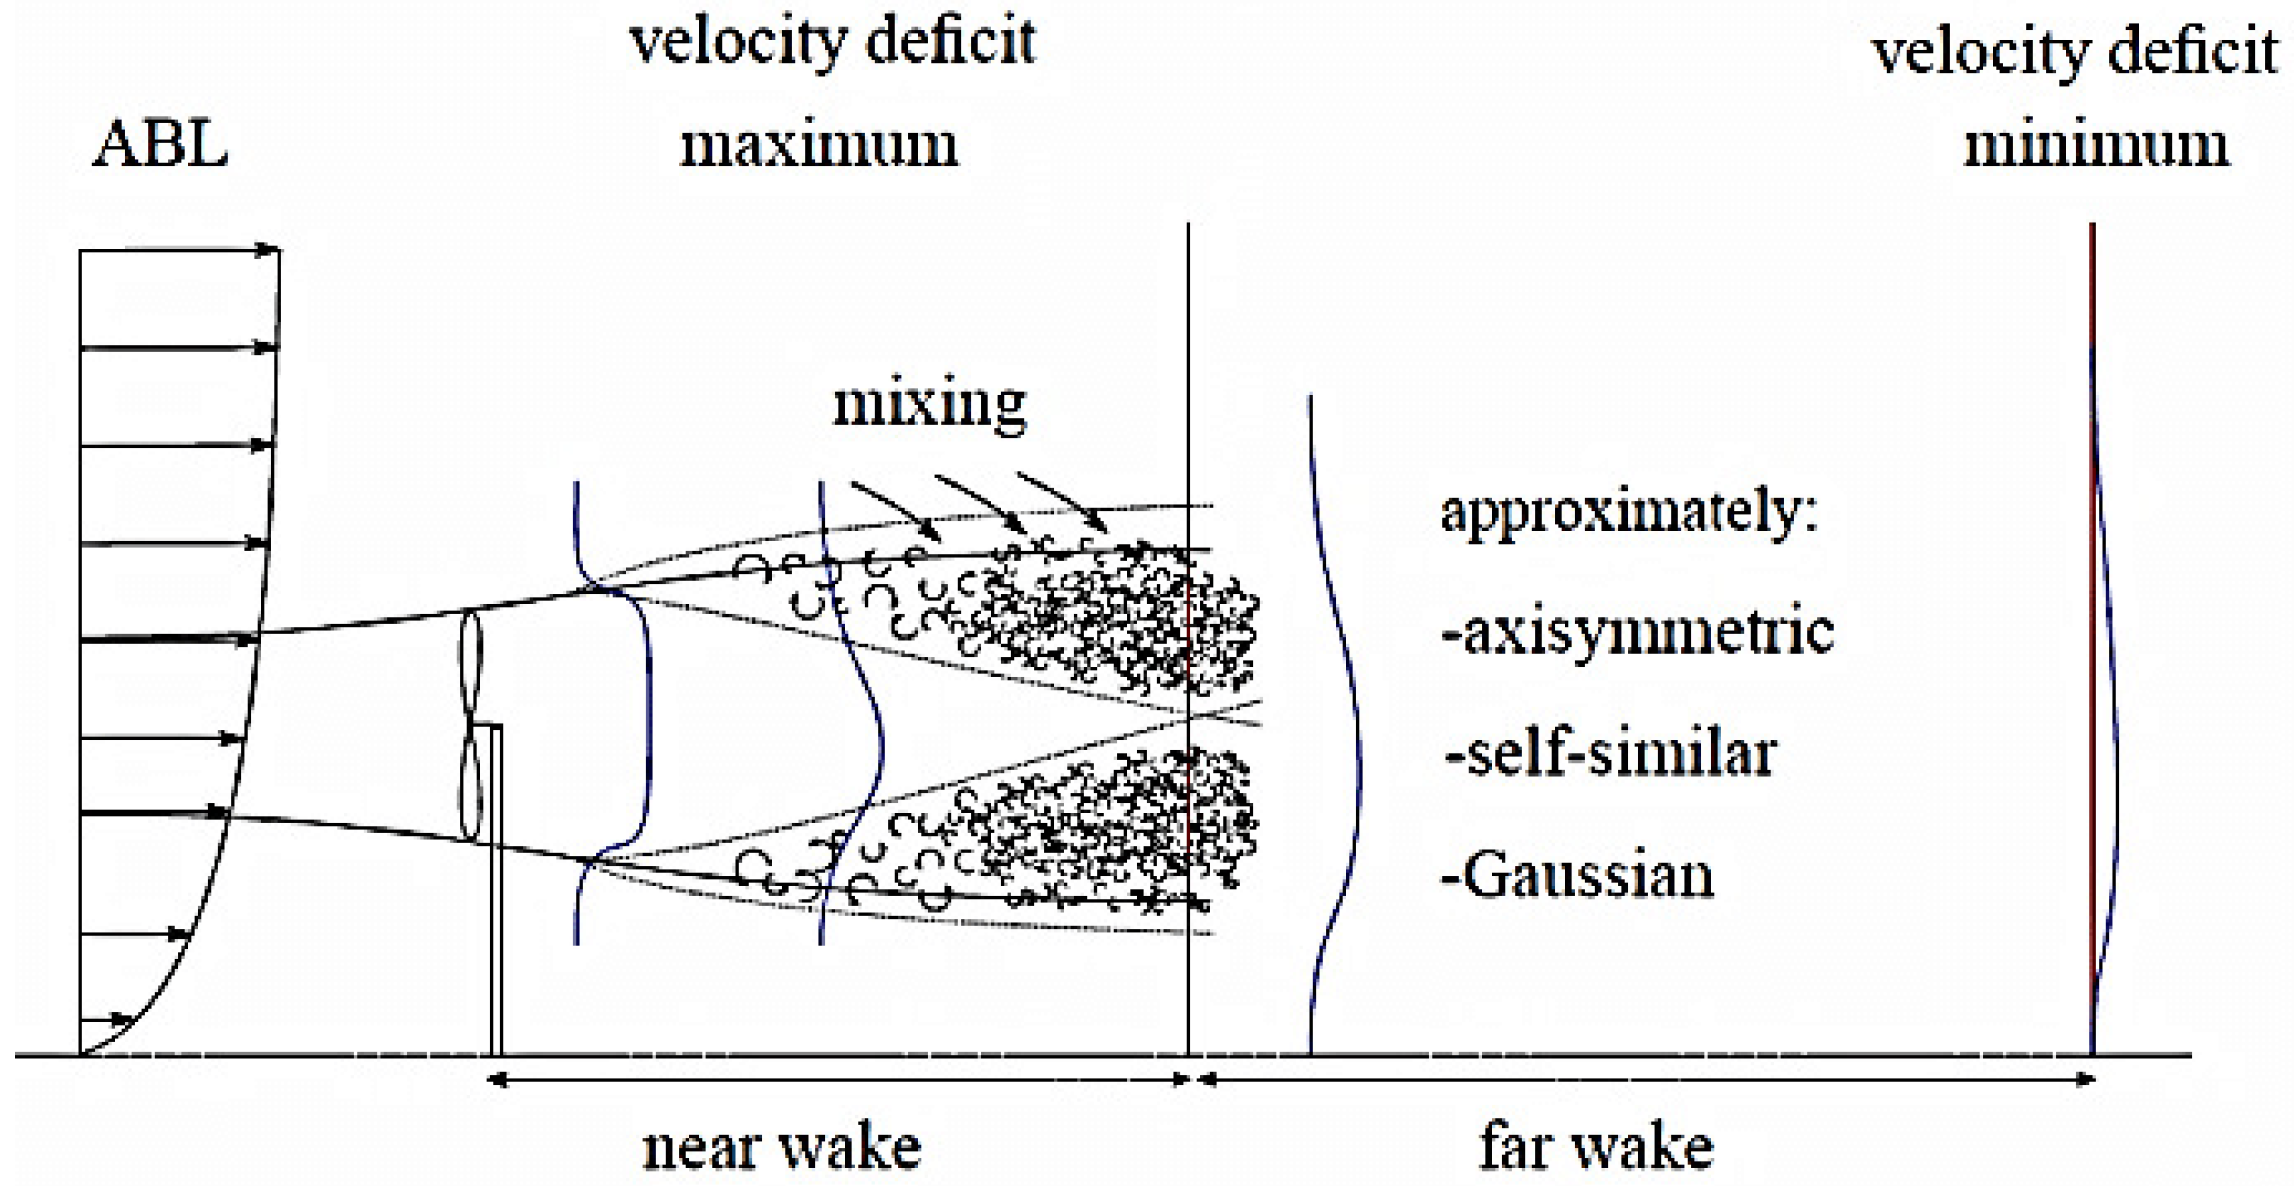
2] and depicted schematically in Figure 1, momentum deficits would occur in the turbine wake as the airflow with an Atmospheric Boundary Layer (ABL) profile passes through the turbine rotor. As the wake progresses axially (in X direction), it would undergo expansion [3]. For a rotor of diameter D, the near wake (X < 1.0 D) is featured mainly by the advection of helical vortical filaments and the bi-modal velocity deficit distribution behind the turbine [4]. The expanding far-wake region (X > 1.0 D) determines the wake recovery process in which the kinetic energy of the wake steadily increases due to turbulent mixing in the shear layer [5,6]. High-velocity components outside the wake are mixed with the low-velocity components in the wake creating turbulent eddies [2]. Higher levels of blade-driven turbulence intensity in the wake as well as a turbulent ABL increases the mixing efficiency, thus reducing the distance for wake recovery. However, the siting of downstream turbines must be conducted to minimize turbulence-induced blade vibrations in them.
Many experimental studies have been conducted recently to investigate the wake characteristics behind wind turbines [4,7,8]. In the recent work of Tian et al. [9], an experimental study evaluated how the incoming surface wind conditions (i.e., mean wind profile and turbulence intensity) affect the wake characteristics and dynamic wind loads acting on a wind turbine model sited in ABL winds. Incoming winds with 10% and 16% ambient turbulence intensity at the turbine hub height were generated in a large-scale ABL wind tunnel to simulate the scenarios over typical offshore and onshore wind farms. The higher turbulence intensity level in the incoming ABL wind (i.e., ~16% ambient turbulence intensity case to the scenario over typical onshore wind farms) was found to be a contributing factor in the early breakup of wake vortices in comparison to the case with a lower ambient turbulence intensity (i.e., the scenario over typical offshore wind farms). More recently, Wang et al. [10] explored a dual-rotor wind turbine concept, i.e., placing a small rotor upstream of the main rotor attached to the same nacelle, to manage to increase the turbine power output. Nemes et al. [11] conducted an experimental investigation with a planar PIV system to measure the velocity fields on the wake centerline, with velocity measurements phase-locked to different blade positions of the rotor. These measurements elucidated the unsteady meander of vortex cores at different blade positions. Zhang et al. [12] used a stereoscopic PIV system to examine the advection of tip vortex filaments in the wake flow behind a scaled turbine model while revealing the breakup for the root vortices. Regions of flow circulation were highlighted by the vorticity parameter in this study.
As described in Sarmast et al. [13], three dominant instabilities can be identified for the breakup of tip vortex filaments. The long-wave instability is caused by an out-of-phase displacement of a successive helical turn eventually leading up to pairing. Short-wave instability occurs due to perturbations inside vortex cores in which the perturbation wave lengths are in the same order of the core diameter. This instability, also called elliptical instability, is caused by an interaction between vortex waves and an existing velocity field. Vortex waves or Kelvin modes are affected by radial velocity, axial and azimuthal Kelvin wave numbers [14,15]. The third instability, termed mutual inductance, occurs due to a reduced helical pitch between nearby filaments. The process of mutual induction depends on the tip-speed ratio and the presence of other vortical elements (e.g., tip and root vortices) in the flow [13]. In mutual induction, specific waves propagating along the helicoidal filament are amplified leading up to its eventual breakup [13]. Lignarolo and Ragni [16] conducted PIV measurements in the wake behind a two-bladed HAWT model and revealed that the location of instability or the breakup point in the wake would move upstream as the tip-speed ratio increases. The mechanism behind this vortex breakup is a well-known feature of vortex rings and helical filaments called leap-frogging. Leap-frogging interactions cause vortex filaments or rings to expand and contract as they pass through each other [17,18]. The location of the breakup and the type of instability can determine the downstream turbulence intensity and the effectiveness of the shear layer in the wake recovery process.
Analyzing highly turbulent flow fields generated by wind turbine rotors requires advanced experimental and post-processing techniques. A Proper-Orthogonal-Decomposition (POD) is predominantly employed to construct a low-order representation of a dynamical system. It is highly utilized in pattern recognition and statistical algorithms to find governing patterns embedded in data streams [19]. This approach has been adopted to identify and isolate energy-dominant and periodic flow patterns embedded in turbulent flow fields contaminated due to low-energy noise, small-scale mechanical turbulence and the background flow. Such flow structures, comprised of vortices showing periodicity in spatial and temporal domains, are called coherent structures [20]. With the introduction of high-resolution flow measurement techniques such as PIV, in which vector fields of dynamic flow processes can be recorded and visualized, POD has become critical in identifying the underlying coherent structures, thus improving our understanding of turbulence and vorticity. One such augmentation of POD called “method of snapshots” was introduced by Lumley in 1967 [21]. The method of snapshots uses planar or volumetric vector or scalar fields with the ensemble average subtracted prior to the analysis. A low-order reconstruction for a specific snapshot can be derived through the addition of the most energetic POD modes scaled to their respective amplitude. This form of Reduced-Order Modeling (ROM) can also be implemented in computational simulations. Variations, including Dynamic Model Decomposition (DMD) and Balanced-Proper-Orthogonal-Decomposition (BPOD) [22], have been introduced to improve the reconstructions and to obtain temporal modes for time-resolved data. However, utilizing such methods for experimental measurements can be challenging because the data acquisition frequency in typical PIV systems may be lower than the blade-passing frequency of scaled wind turbine models operating under conditions comparable to their prototypes. A previous DMD analysis of wind turbine flow mechanics that was conducted in 2017 by Premaratne and Hu in 2017 utilized phase-averaged measurements to create a temporal data stream. However, phase averaging runs the risk of filtering out important flow dynamics in the turbine wake [23].
POD has been used to analyze wind turbine wake flows, predominantly computational in nature. Modeling highly detailed wind turbine wake flows computationally requires high-performance computing resources. Siddique et al. [24] used POD in tandem with Galerkin projections in a finite volume scheme to create an ROM that simulated a 5 MW NREL turbine siting in an offshore wind farm. The ROM was able to capture 99% of the modal energy with an error of 4.7% in the relative velocity upon comparison with the high-fidelity solution. Zhang and Stevens used POD to identify coherent structures in a Large-Eddy Simulation (LES) of a wind farm operating in a boundary layer. The rotor dynamics were simplified using an actuator disk model and the turbines were placed in an aligned and a staggered configuration. The study revealed that the number of turbines is solely responsible for the large-scale interactions between the turbines and atmospheric flow, rather than the wind farm configuration as previously thought [25]. De Cillis et al. [26] analyzed the LES results of a three-bladed wind turbine operating in a uniform flow using POD. The rotor was modeled using an actuator line model and the authors aimed to study the influence of the nacelle and the tower. Results from the rotor simulation (without tower and nacelle) showed a tip vortex filament advecting up to six diameters downstream unperturbed. A turbine tower and a nacelle created a discontinuity in the tip vortex filament which accelerated the breakdown process. However, the helical nature of the filament was preserved up to four diameters downstream. The Karman vortex street shed from the cylindrical tower, highly energetic in nature, was observed to be interacting with the tip vortices shed from the rotor.
An experimental study was conducted by Meyer et al. [27] with a scaled turbine model operating in a uniform incoming flow inside a water flume. Stereoscopic PIV (SPIV) measurements obtained for downstream planes (far wake) perpendicular to the rotor axis were subjected to a POD analysis, which in turn revealed the processing of vortex cores as they advect downstream. A multi-part study was conducted by Hamilton et al. [28,29] in which the SPIV measurements were conducted at upwind and downwind locations of scaled wind turbines operating in a wind farm setting. This study utilized an “open terrain” boundary layer and the blade design emulated flow characteristics of a 1 MW turbine. A POD analysis was applied to the whole flow field encompassing effects from the rotor, tower and the nacelle. The POD analysis was applied for the second time to reconstruct snapshot series, and the approach is called DPOD (Double-POD). Modes resulting from a DPOD are used to increase the accuracy of the Reynolds stress tensor.
In the present study, we analyze a unique wind turbine entrainment comprising a tip vortex and a secondary vortex filament shed from the midspan location of a turbine blade in the turbulent boundary layer wind. This complex vortex flow field was measured by using a planar PIV system behind a scaled model of a typical utility-scale turbine prototype (2 MW) located in an offshore boundary layer wind. The offshore boundary layer airflow was specifically selected due to the recent interest in offshore wind farms, an alternative approach to meet the energy needs of coastal cities. Previous studies with wind turbines operating in uniform incoming airflow elucidated tip vortex filaments which break down in the far-wake (X > 1.0 D) locations [2,26]. For the case with a wind turbine operating in a more realistic turbulent boundary layer wind, the presence of a secondary vortex filament (midspan) in addition to a tip and hub filaments, advection of these structures under the influence of an ambient turbulence and their breakup in the near wake (X < 1.0 D) created a much more challenging scenario for the present study. Based on the observations from statistically averaged quantities (i.e., mean velocity, mean vorticity, turbulence intensity), we focused our POD analysis on a streamwise plane that encompasses the cross-sections of midspan and tip vortex filaments. This is a deviation from the previous POD studies aiming to extract wind farm flow features using either stereoscopic or planar measurements for the whole turbine assembly, including the nacelle and the tower. In addition to the traditional velocity fluctuation-based POD analysis, we utilized a vorticity fluctuation-based formulation. This approach yielded much faster solutions and extracted coherency from the shear layer in the turbine wake, a feat that was unattainable with the velocity-based formulation.

2. Experiment and Setup

An experimental study was conducted to quantify the wake characteristics behind a scaled, three-bladed HAWT model by leveraging in a large-scale Atmospheric Boundary Layer (ABL) wind tunnel at Iowa State University (i.e., ISU-ABL tunnel) with a test section of 25 m in length × 2.4 m in width × 2.3 m in height. Similar as those used by Tian et al. [9], an offshore ABL wind profile was generated in the ISU-ABL tunnel with several rows of wooden blocks and metal chains placed upwind of the model turbine location. Figure 2 shows the time-averaged velocity and turbulence intensity distributions of incoming ABL wind in the middle of the test section. A Cobra-probe anemometer system acquired the measurements at the position where the scaled turbine would be mounted.
As described in Zhou and Kareem [30], the averaged velocity profile of boundary layer wind over an open terrain such as over ocean surfaces can usually be fitted well to a power function, i.e., U(Z) = UHub (Z/H)α, where UHub is the wind velocity at a reference height of H (i.e., hub height of the turbine). The exponent “α” determines terrain roughness. As shown clearly in Figure 2a, the measured mean velocity profiles were found to be fitted satisfactorily with the aforementioned power function for an exponent α ≈ 0.11, thus agreeing well with the ISO standard for offshore ABL wind (i.e., α ≈ 1/8.4). The turbulence intensity of the incoming wind profile at the hub height of the turbine was measured to be about 10%, which satisfactorily agrees with the field measurements reported in Hansen et al. [31] for the turbines in Horns Rev offshore wind farm.
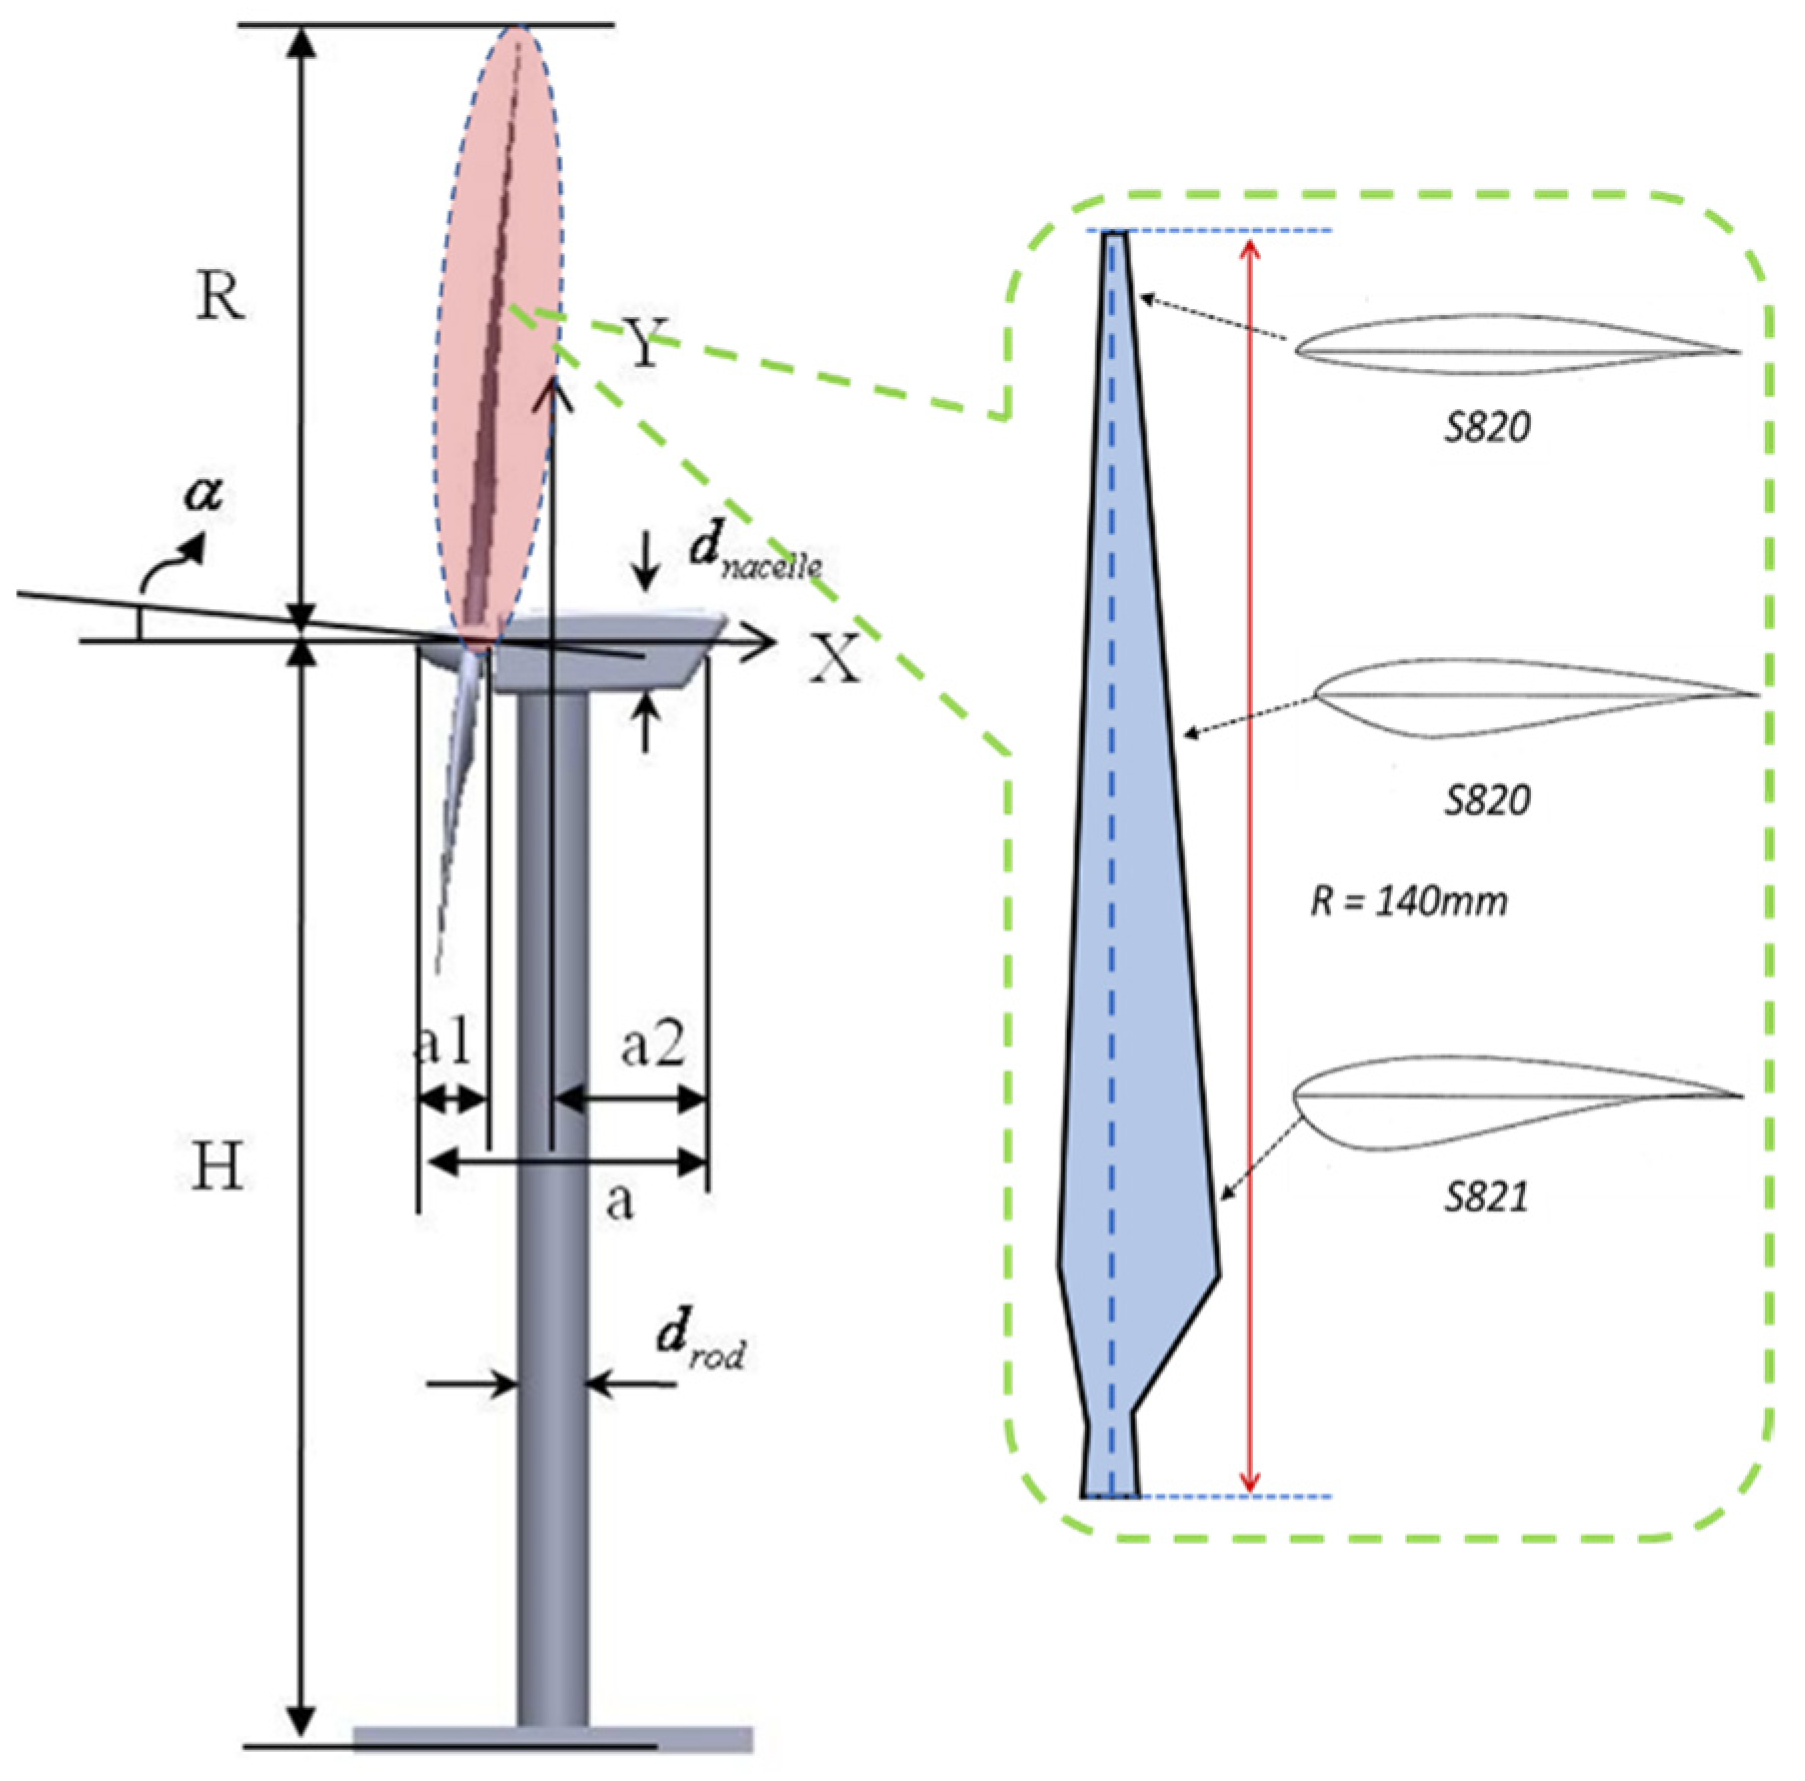
The turbine prototype used in the current study represents the most commonly used, three-bladed horizontal axial wind turbines (HAWTs) in modern wind farms. As shown schematically in Figure 3, the model has a rotor radius of 140 mm (i.e., D = 280 mm) and a hub height of 225 mm (i.e., H = 225 mm). Scaled according to a ratio of 1:320, the model turbine would represent 2 MW prototype with a rotor diameter of about 90 m and a tower height of about 80 m. The rotor and nacelle assembly of the turbine model were made of a hard-plastic material and manufactured by a rapid prototyping machine (i.e., 3D printer). A metal rod was used as the tower of the turbine that supports the rotor and nacelle assembly, which is connected to a force/moment transducer to monitor the wind loads acting on the turbine model. The rotor blade design was based on the ERS-100 prototype turbine blades. These blades have circular cross-sections from the root of the blade to 5% of its radius (R) and three NREL airfoil profiles (S819, S820, S821) at different spanwise locations along the rotor blade. Table 1 gives the design specifications of the turbine model used in our study. The same wind turbine model had also been utilized by Tian et al. [9] to evaluate the effects of incoming surface wind scenarios on the wake flow and dynamic wind loads acting on the model.
During the experiment, the average wind velocity at the hub height of the model turbine was measured to be about 5.0 m/s (i.e., UHub = 5.0 m/s). The wind turbine model was operated at a tip-speed ratio ( λ = ω R / U H u b , where ω is the angular velocity) of 5.0, where the optimum power coefficient, Cp, occurs. The corresponding Reynolds number based on the rotor diameter of the turbine model is about 100,000 (i.e., R e D 100 , 000 ), which is above the minimum Reynolds number level specified by Chamorro et al. [32] to ensure the Reynolds number independence for the turbine wake statistics.
A high-resolution PIV system was used in the present study to obtain high-resolution flow field measurements in the vertical ZX plane passing through the symmetrical plane of the scaled model turbine. The measured flow field was illuminated by using a double-pulsed Nd:YAG laser adjusted on the second harmonic, emitting two pulses of 200 mJ at the wavelength of 532 nm. The airflow in the ISU-AABL tunnel was seeded with ~1 μm diameter oil droplets by using a smoke generator. Two high-resolution 16-bit CCD cameras (PCO1600, Cooke Corp, Romulus, MI, USA) acquired the PIV images with the axis of the cameras directed orthogonal to the laser sheet. The cameras and the double-pulsed Nd:YAG lasers were connected to a host computer through a digital delay generator (Berkeley Nucleonics, Model 565), which synchronized the laser illumination and the image acquisition. A setup of the experiment is shown in Figure 4. The thickness of the laser sheet was adjusted to be about 1.0 mm to improve the correlation coefficient in the PIV image process because tracer particles traveling out of the plane may cause erroneous vectors in the derived PIV results.
In addition to performing “free-run” PIV measurements, “phase-locked” PIV measurements were also conducted to characterize the turbine wake flow fields. The “free-run” PIV measurements were used to obtain the ensemble-averaged flow statistics (e.g., Reynolds stress, turbulent kinetic energy and mean velocity of the turbine wake. For the “free-run” PIV measurements, the image acquisition rate was pre-selected at a frequency that is not a harmonic frequency of the blade-passing frequency to ensure meaningful experimental data to derive ensemble-averaged flow quantities. PIV measurements that are “phase-locked” were acquired to investigate the effects of the rotor blade position on the evolution of wake vortices. A digital tachometer was used to detect the position of a pre-marked rotor blade for the “Phase-locked” PIV measurements, which would generate a pulsed signal when the pre-marked blade was detected. This pulsed signal was input into a Digital Delay Generator (DDG) to trigger the PIV system to acquire the “phase-locked” PIV measurements. Adding different time delays between the tachometer input signal and the transistor–transistor logic (TTL) signal output from the DDG triggered the digital PIV system to capture “phase-locked” flow measurements at different blade phase angles of the pre-marked rotor blade.
Based on the acquired PIV images, instantaneous flow velocity vectors were obtained by a frame-to-frame cross-correlation technique involving successive frames article images in an interrogation window of 32 × 32 pixels, encompassing physical area of 7.4 mm × 7.4 mm. An overlap of 50% of the interrogation windows was employed in PIV image processing, effectively resulting in a spatial resolution of 3.7 mm × 3.7 mm for the PIV snapshots. In the present study, 1000 frames of instantaneous PIV measurements were used to calculate the ensemble-averaged flow quantities, such as velocity magnitude and vorticity, in the turbine wake flow. A set of 400 frames of instantaneous “phase-locked” PIV measurements were used to calculate the “phase-averaged” flow quantities at each given phase angle. The measurement uncertainty level for the instantaneous velocity vectors was estimated to be within 2%, while the uncertainty for ensemble-averaged flow quantities was about 5%.

3. Measurement Results and Discussion

3.1. Ensemble-Averaged Flow Quantities

As described above, both “free-run” and “phased-locked” PIV measurements were conducted to quantify the airflow characteristics and the evolution of the unsteady vortical structures in the turbine wake. Figure 5a depicts an instantaneous velocity measurement from the PIV. A region of velocity deficit can be seen in the aft of the rotor (green) with a turbulent flow region present between this deficit and the high-velocity region (red). Figure 5b gives the ensemble-averaged airflow velocity distribution derived based on the “free run” PIV measurements, which depicts a region of velocity deficit ( U / U H u b < 1.0 ) in the aft of the wind turbine model due to the harvesting of kinetic energy from the incoming airflow. The vertical velocity gradient shows the shear layer (yellow region) expanding spanwise as it propagates downstream. The highly turbulent nature of the wake flow was observed to cause the increased contour density near the nacelle and the hub. Regions with significant turbulent intensities were found to be right behind the turbine tower, nacelle and blade tips, as elucidated by the ensemble-averaged turbulent kinetic energy (TKE) distribution (i.e., ( u 2 + v 2 ) / U H u b 2 ) shown in Figure 5c. The velocity perturbations ( u , v ) for an instantaneous measurement were obtained by subtracting the ensemble-averaged velocity from its original velocity field (i.e., u = u u ¯ ). The TKE was calculated for each instantaneous measurement and averaged over the total frame of instantaneous PIV measurements. Two distinct streaks of the TKE emanating from the midspan and the tip of the blade can be attributed to the presence of vortex-driven turbulence. A vorticity measurement, as shown in Figure 5d, was derived from phase-averaged velocity measurements to further confirm the midspan and tip vortex streaks. These tip and midspan vortices break up into tiny turbulent eddies at about a 0.5 rotor diameter behind the tower. As the wake advects downstream, the strengths and size of the vortices were found to reduce continuously. The root/hub vortices were found to rotate in the opposite direction to the tip and midspan vortices, as expected. The root vortices were found to interact with the airflow over the nacelle and decay rapidly. The presence and advection of the vortex structures were also revealed from the phase-averaged PIV measurements.

3.2. Coherent Structure Extraction and Analysis

As aforementioned, POD is an effective tool in identifying principal flow features via linear decomposition and the reconstruction of instantaneous PIV measurements. The spatially orthogonal POD modes, similar to a wave harmonic, ranked by their modal energy (kinetic energy of the flow velocity fluctuations), represent the embedded flow patterns. A matrix is constructed in which fluctuating quantities (statistical average removed) are arranged columnwise for each measurement or snapshot. The matrix is subjected to Singular-Value-Decomposition (SVD) if the number of quantities (rows) is smaller than the number of snapshots (columns), while a different technique, “the method of snapshots”, is used for a matrix with more rows than columns. Even though both methods will yield the same answer, selecting the appropriate method can drastically reduce the computational time. A step-by-step construction of the “method of snapshots” is described here. While the superscript denotes the snapshot number, the subscript index indicates the degree of freedom [19,33].
For a series of 2D PIV measurements, all the fluctuating horizontal and vertical velocity components, denoted by u and v , are arranged in matrix U as:
U = [ u 1 u 2 u N ] = [ u 1 1 u 1 2 u M 1 u M 2 v 1 1 v 1 2 v M 1 v M 2 u 1 N u M N v 1 N v M N ]
where the number of spatial discrete points is given by M, and N is the number of the PIV snapshots. The eigenvalues ( σ ) and eigenvectors ( A ) of the auto-covariance matrix C ˜ are calculated as
C ˜ · A i = σ i · A i
where C ˜ = U T · U .
The eigenvalues representing turbulent kinetic energy are listed in a descending order. Each POD mode is obtained by projecting matrix U onto each eigenvector and then dividing by its norm as given by,
i = n = 1 N ( A n i · u n ) | | n = 1 N ( A n i · u n ) | | , i = 1 , , N
where i = [ 1 2 N ] . The weights or the coefficients of each mode can be obtained as
a n = T · u n
A low-order reconstruction of velocity fluctuations in an nth instantaneous measurement can be created by the summation of L energy-dominant mode vectors multiplied by their corresponding modal coefficients.
u n = i = 1 L a i n i = · a n
The order of reconstruction (L) can be decided based on the cumulative modal energy. Finally, an Lth order POD reconstruction can be expressed as the summation of the ensemble-averaged velocity components,
U n = U ¯ + u n
where U ¯ is the ensemble-averaged flow velocity. The summation of all the available modes ( L = N ) would yield the original instantaneous snapshot.
Replacing velocity fluctuations with vorticity fluctuations reduces the number of rows of the U matrix by 50%, thus decreasing the computational cost. In this formulation, eigenvalues represent turbulent enstrophy ( ω 2 ). The vorticity fluctuation matrix is shown below [34].
Ω = [ ω 1 ω 2 ω N ] = [ ω 1 1 ω 1 N ω M 1 ω M N ]
The vorticity-based POD along with the velocity-based POD have been used in analyzing a region that encompasses both vortex filaments behind the turbine. Two windows, R1 (0.05 D < X < 0.65 D) and R2 (0.65 D < X < 1.1 D), were declared based on the axial location of the vortex breakup (X~0.65 D), as observed in Figure 6a, highlighted by the merging streaks of the TKE and the diffusion of the distinct vortical cross-sections. The R1 window was utilized to capture energetic modes pertaining to tip and midspan vortices prior to their breakup, while the R2 was used to identify energetic modes embedded in the shear layer due to the breaking up of the vortices. A normalized vorticity distribution of R1 and R2, derived from phase averaging the “phase-locked” data, further supports this window selection as shown in Figure 6b,c. The out-of-plane normalized vorticity ( ω D / U H u b ) is used to identify rotational flows in both velocity- and vorticity-based POD reconstructions.

3.3. Analysis of R1 Using Velocity- and Vorticity-Based POD

The modal energy (or the eigenvalues of the covariance matrix) of the first two modes was monitored while steadily increasing the snapshots until reaching a convergence criterion to determine the snapshot number required for the present study. The convergence study showed asymptotic (converging) behavior in the modal energy of mode 1 and mode 2 after using 500 snapshots of the instantaneous PIV measurement results.
The first mode carried the higher modal energy (~45%), while the corresponding value of the second mode was found to be about 6%. The cumulative modal energy parameter asymptotes to 1.0 as the number of modes increases, as shown in Figure 7a. The first few energetic modes correspond to the dominant flow features buried within the flow solution. The modes with less modal energy may correspond to smaller eddies or/and measurement noise. The gradient of the cumulative modal–energy curve, also shown in Figure 7b, yields the energy addition rate to a potential reduced-order reconstruction.
An exponential change in the energy addition was approximated up to the first 5 modes (Figure 7b, dotted line). The rate was found to decrease monotonically with the increase mode number, eventually approaching zero. Because the energy added to reconstructions varies minimally after the fifth mode, the former approximation is valid. Similar reasoning is applied to the following POD reconstructions. Therefore, the low-order reconstruction utilized the first five modes containing roughly 62% of the cumulative modal energy.
The five modes and the ensembled average ( ϕ 0 ) are elucidated in Figure 8 with the normalized vorticity highlighting the regions of the rotational flow. The first two modes ( ϕ 1 and ϕ 2 ) show vorticity streaks, alternating in and out of the XZ plane, propagating in the streamwise direction. Mode 3 and 4 do not show a clear coherency, while mode 5 highlights a series of vortical cores with vorticity in alternating directions. These cores are emanating from the midspan and the blade tip, suggesting coherence in the midspan and tip vortex filaments.
The summation of the fluctuation modes multiplied their respective amplitudes (e.g., a 1 1 + a 2 2 + + a 5 5 ) and led to a low-order reconstruction of an instantaneous measurement with pronounced rotational flow features, as shown in Figure 9a. The alternating direction (−Y (blue) and +Y (red)) of the vortical fluctuations suggests spatial periodicity of the induced flow field due to advecting midspan and tip vortex filaments. The fifth mode ( ϕ 5 ) has become more dominant in this reconstruction. Other modes may become more prominent when reconstructing different instantaneous measurements. The addition of the statistically averaged flow field ( U ¯ ) back to the fluctuations-based reconstruction results in the final low-order reconstruction, as shown in Figure 9b. Figure 9b elucidates the cross-sections of vortex filaments shed from the tip and midspan locations, as the super-position of averaged flow has strengthened the −Y fluctuations (blue). A small region of counterclockwise rotation (+Y) is present between 0.1 D < X < 0.2 D in the midspan vortex stream, thus suggesting an induced flow due to large cores. The distinct vortex cores cannot be identified in the instantaneous measurement provided in Figure 9c, thus proving the capability of POD in filtering out the non-dominant artifacts from the flow. A comparison is drawn between the phase average (0° blade angle) depicted in Figure 9d and the reconstruction in Figure 9b. Both images confirm the existence of the tip and midspan vortex filaments. The differences in vortex core locations suggest that the reconstruction corresponds to a different blade angle than 0°.
The claim can be further validated by using a vorticity-based POD method, where vorticity fluctuations ( ω ) in a ± Y direction are selected as the variable of interest. The turbulent enstrophy ( ω 2 ), which corresponds to the modal energy in this formulation, represents the level of dissipation in the angular momentum. Reconstructions have utilized the first three modes based on the rate of the enstrophy addition (Figure 10a,b) containing a total of 14% of the enstrophy. The mode shapes are shown in Figure 11. Mode 0 ( ϕ 0 ), denotes the average flow field of the R1 region that encompasses both tip and midspan vortex streams. Mode 1 ( ϕ 1 ) and mode 2 ( ϕ 2 ) show alternating vortex patches comparable to mode 5 from a velocity-based POD. A slight offset in phase can also be observed between the vortex pairs of mode 1 and mode 2. Mode 3 ( ϕ 3 ) depicts streamwise vortex streaks with alternating directions and resembles mode shapes ( ϕ 1 and ϕ 2 ) from the velocity-based POD analysis.
The reconstruction shown in Figure 12a depicts the alternating vorticity fluctuations in midspan and tip vortex regimes. Even though each tip and midspan vorticity perturbation shown in Figure 12a is shed at the same time, the changes in advection speeds make the filaments out of phase after X > 0.4 D. While the tip vortex moved slightly faster than the midspan filament, both filaments were found to undergo expansion in the +Z direction. This offset in phase is further confirmed in Figure 12b in which the ensemble-averaged vorticity ( Ω ¯ ) is added back to the reconstruction. Both velocity- and vorticity-based POD methods have identified the same periodic vortex patches, thus confirming the validity of the methods. However, the normalized vorticity in vorticity-based POD reconstructions shows larger and spread-out vortical cores with smoother contour lines compared to the vorticity contours obtained using the velocity-based POD reconstructions presented in Figure 9a,b. In the vorticity-based POD formulation, the majority of the turbulent enstrophy is spread out among the eigenmodes, contrary to the velocity-based POD modes in which a majority of the kinetic energy was concentrated in the first few modes. The dissipation of the angular momentum is dominated by many small-scale turbulent eddies spread throughout the R1 region. The tip and midspan vortex pair observed at X < 0.1 D has a smaller core size in the velocity-based POD reconstructions compared to the vorticity-based ones. The counter-rotating circulation zone observed at X~0.14 D in Figure 9b is also absent from the vorticity-based POD reconstructions in Figure 12b. Such changes can be attributed to the kinetic energy and enstrophy distributions among the modes. The velocity-based POD reconstruction has captured more than 65% of the turbulent kinetic energy, thus increasing its reliability when studying flow physics.
Both vorticity- and velocity-based POD reconstructions shown in Figure 9b and Figure 12b clearly capture the features shown in the phase-averaged statistics shown in Figure 6b. Therefore, researchers can utilize POD reconstructions obtained from “free-runs” to replace phase-locked PIV measurements which can be time consuming to set up. Machine learning algorithms may be utilized to identify the corresponding phase angle of the reconstruction. Moreover, future experimentalists can gain an insight into the turbulence statistics of phase angles that are unattainable due to the precision and uncertainties in tachometers or digital delay generators.

3.4. Analysis of R2 Using Velocity- and Vorticity-Based POD

The R2 region in which the vortices breakdown to form the shear layer was analyzed using both velocity- and vorticity-based POD methods. The modal energy content and the gradient of the cumulative energy plots for a velocity-based POD analysis on the R2 region are shown in Figure 13a,b, respectively. The first six modes containing 70% of the total turbulent kinetic energy were selected for this reconstruction based on the energy addition rate, similar to the previous analysis of R1. The mode shapes for the first 6 modes are shown in Figure 14. Mode 1 ( ϕ 1 ) containing 50% of the modal energy shows a streamwise vortex pattern with alternating directions. This pattern has a higher vorticity magnitude above 0.5 D (+Y) and below 0.35 D (−Y). Modes 2 to 5 ( ϕ 2 to ϕ 5 ) do not show any identifiable coherence. However, mode 6 shows alternating vorticity patches suggesting an underlying coherency in low-energy modes.
Final reconstructions of R2 utilizing the first 6 modes did not highlight coherent patterns, such as alternating vortices, as elucidated by Figure 15a,b. Adding the statistical average of the ( U ¯ ) has nullified the vortical fluctuations in the +Y direction as shown in Figure 15b, yet they reappear in the instantaneous PIV result given in Figure 15c. The phase-locked measurement for the 0° blade angle shown in Figure 15d shows the formation of a shear layer as the tip and midspan filaments begin to interact creating turbulent eddies or more dissipative flow. The reconstruction in Figure 15c also shows a dissipative interaction between the filaments.
The vortex breakup in R2 results in turbulent velocity fluctuations ( u , v ), often random or incoherent in nature. Incoherent turbulent fluctuations with no underlying patterns increase the mixing efficiency between the wake flow and the flow outside the wake region. However, spatial correlations can exist in the enstrophy because energy dissipation occurs via small-scale eddies, thus requiring a vorticity-based POD analysis.
The vorticity-based POD analysis of R2 isolated six energetic modes (20% of the total turbulent enstrophy) based on the enstrophy accumulation and its gradient, as given in Figure 16a,b. The modal energy addition rate becomes steady after the sixth mode (dotted line), as shown in Figure 16b. Mode shapes are shown in Figure 17 and the first three modes show coherent patterns. The first mode elucidating streamwise vorticity distributions resembles mode 1 from the velocity-based POD modes in Figure 14. Modes 2 and 3 in Figure 17 show alternating vortex cores advecting downstream. The last three modes do not show any identifiable coherent patterns.
Low-order reconstructions, presented in Figure 18a,b, depict a coherent pattern, contrary to their velocity-based counterparts. Mode 2 has become dominant in this reconstruction as the corresponding modal coefficient ( a 2 ) is dominant for this instantaneous reconstruction. The elongation of vortex cores in the Z direction was observed in the reconstructions presented in Figure 12a,b. Counter-rotating vorticity fluctuations (red) have become slightly dominant, even after the super-position of statistically averaged flow ( Ω ¯ ), contrary to the reconstructions of R1. Because the first six modes do not encompass a majority of the enstrophy, it can be concluded that the angular momentum is dissipated via numerous turbulent eddies spread throughout R2. The phase-locked measurement in Figure 15d does not show counter-rotating vortical components contrary to Figure 18b, suggesting a lack of enstrophy in the reconstruction.
The decrease in proximity between the vortex filaments observed in Figure 8b and Figure 9d increases the influence of mutually induced velocity perturbations on consecutive helical turns. The presence of a midspan vortex filament and its proximity to a tip vortex filament also accelerate the mutual induction-driven destabilization, thus preventing both filaments from advecting into the far wake. The velocity induced by a vortex filament can be computed using the Biot–Savart law as [35],
d V i n d = Γ 4 π d l × r r 3
where Γ is the circulation strength, r denotes the position vector to a point of interest and d l is the elemental segment of the filament. The elliptical shapes in the vortices of the R1 window, depicted in Figure 6b and Figure 8b, suggest the growth of sinusoidal perturbations in the filament, speculating on the presence of short-wave instability. However, its presence can only be validated via volumetric PIV measurements. Therefore, the early breakup of the vortices, in the near-wake region, can be attributed to a combination among mutually induced velocity perturbations, short-wave instability and the ambient turbulence in the incoming flow.

4. Conclusions

Turbine wake characteristics were investigated to identify coherent vortices embedded in the turbulent wake flow and to elucidate the underlying mechanisms behind the experimental observations. The experimental study was conducted by leveraging a large-scale wind tunnel available at Iowa State University. A scaled three-bladed horizontal-axis wind turbine (HAWT) model was placed in the boundary layer airflow with the similar inflow characteristics of the Atmospheric Boundary Layer (ABL) winds over typical offshore wind farms under a neutral stability condition. A high-resolution Particle Imaging Velocimetry (PIV) system was used to achieve both “free-run” and “phase-locked” measurements to quantify the evolution of the unsteady wake vortices behind the wind turbine model sited in the turbulent ABL wind. The presence of a tip vortex filament and a secondary filament shed from the midspan location of the turbine blades were revealed clearly based on the PIV measurements. Both filaments were found to break up in the near-wake region, contrary to previously conducted simulations and experimental observations with uniform incoming airflow where wake vortices would break up at far-wake locations.
A Proper-Orthogonal-Decomposition (POD) analysis was conducted to identify energetic vortex patterns in the turbulent near wake. The entrainment or the wake, which encompasses the advection of the tip and midspan vortices, was divided into two regions (R1 and R2) for the POD analysis. While the region R1 contained information prior to the vortex breakup, R2 contained flow mechanics of the filament breakup crucial to wake recovery or “recharging”. The dominant flow components in the R1 region accounted for 62% (first five modes) of the modal energy. The reconstruction, acting as a low-pass filter for an instantaneous measurement, showed alternating vortical fluctuations (in and out of the ZX plane) as they propagate downstream. The addition of the statistical mean amplified into-the-plane (−Y) vorticity perturbations, highlighting the tip and midspan vortices previously observed in phase-averaged solutions. The elliptical nature of the vortex cores speculates on the presence of a three-dimensional “elliptical” short-wave instability. Mutual induction resulting from decreased proximity between the filaments also contributed to the rapid spatial decay of the filaments. This reduction in proximity can be attributed to the high-blade vortex shedding frequency (high-rotor RPM required maintaining the optimal tip-speed ratio) and the differences in advecting velocities of the tip and midspan filaments. The presence of the elliptical deformation of the cores was further validated by vorticity-based POD reconstructions utilizing three dominant modes to reconstruct the R1 region. This analysis of the R2 region, in which the vortices break up to form the shear layer, yielded highly “stretched” fluctuations with amplitudes growing in the +Y direction. However, velocity-based POD reconstructions failed to obtain a coherent pattern in R2, thus suggesting a highly incoherent, yet effective mixing process. Therefore, a combination of mutual induction, short-wave or elliptical instability and the ambient turbulence intensity of the incoming flow can be considered the culprits behind the vortex breakup and the formation of the shear layer. Exploring the 3D flow dynamics may further reveal the nature of the tip and midspan vortices and specific correlations between modes associated with the helical nature of these filaments. Researchers could utilize advanced measurements such as the Tomographic PIV or Stereo PIV (SPIV) for this purpose.
The validated low-order POD reconstructions may reduce the need for phase-locked measurements in future wind turbine experiments. The present study provided further insight into the vortex filament advection and breakup mechanisms in wind turbine wakes. The effects of the boundary layer flows over blades should also be characterized to improve the understanding of the generation and the evolution of the secondary helix (midspan) vortical structures. Furthermore, future studies could also focus on trade-offs between the vorticity-based and velocity-based POD analyses for wind turbine flow measurements. Techniques such as two-point space correlations [35] should be investigated as a tool for identifying the suitable POD formulation.

Author Contributions

Conceptualization, P.P. and H.H.; methodology, W.T. and P.P.; software, P.P. and H.H.; formal analysis, P.P. and W.T.; investigation, P.P.; data curation, P.P. and W.T.; writing—original draft preparation, P.P. and H.H.; writing—review and editing, P.P. and H.H.; visualization, P.P.; supervision, H.H.; project administration, H.H.; funding acquisition, H.H. All authors have read and agreed to the published version of the manuscript.

Funding

This research was funded by the National Science Foundation (NSF) under the award numbers CBET-1438009 and TIP-2140489.

Institutional Review Board Statement

Not applicable.

Informed Consent Statement

Not applicable.

Data Availability Statement

The data that support the findings of this study are available from the corresponding author upon reasonable request.

Conflicts of Interest

The authors declare no conflict of interest.

References

  1. Bartl, J.; Pierella, F.; Sætran, L. Wake Measurements behind an Array of Two Model Wind Turbines. Energy Procedia 2012, 24, 305–312. [Google Scholar] [CrossRef] [Green Version]
  2. Sanderse, B. Aerodynamics of Wind Turbine Wakes: Literature Review; Energy Research Centre of the Netherlands: Petten, The Netherlands, 2009; pp. 1–46. [Google Scholar]
  3. Abdelsalam, A.M.; Boopathi, K.; Gomathinayagam, S.; Hari Krishnan Kumar, S.S.; Ramalingam, V. Experimental and Numerical Studies on the Wake Behavior of a Horizontal Axis Wind Turbine. J. Wind Eng. Ind. Aerodyn. 2014, 128, 54–65. [Google Scholar] [CrossRef]
  4. Hu, H.; Yang, Z.; Sarkar, P. Dynamic Wind Loads and Wake Characteristics of a Wind Turbine Model in an Atmospheric Boundary Layer Wind. Exp. Fluids 2012, 52, 1277–1294. [Google Scholar] [CrossRef]
  5. Adaramola, M.S.; Krogstad, P.Å. Experimental Investigation of Wake Effects on Wind Turbine Performance. Renew. Energy 2011, 36, 2078–2086. [Google Scholar] [CrossRef]
  6. Newman, J.; Lebron, J.; Meneveau, C.; Castillo, L. Streamwise Development of the Wind Turbine Boundary Layer over a Model Wind Turbine Array. Phys. Fluids 2013, 25, 085108. [Google Scholar] [CrossRef]
  7. Wang, Z.; Tian, W.; Ozbay, A.; Sharma, A.; Hu, H. An Experimental Study on the Aeromechanics and Wake Characteristics of a Novel Twin-Rotor Wind Turbine in a Turbulent Boundary Layer Flow. Exp. Fluids 2016, 57, 150. [Google Scholar] [CrossRef]
  8. Ozbay, A.; Tian, W.; Hu, H. Experimental Investigation on the Wake Characteristics and Aeromechanics of Dual-Rotor Wind Turbines. J. Eng. Gas Turbines Power 2015, 138, 042602. [Google Scholar] [CrossRef]
  9. Tian, W.; Ozbay, A.; Hu, H. Effects of Incoming Surface Wind Conditions on the Wake Characteristics and Dynamic Wind Loads Acting on a Wind Turbine Model. Phys. Fluids 2014, 26, 125108. [Google Scholar] [CrossRef] [Green Version]
  10. Wang, Z.; Ozbay, A.; Tian, W.; Hu, H. An Experimental Study on the Aerodynamic Performances and Wake Characteristics of an Innovative Dual-Rotor Wind Turbine. Energy 2018, 147, 94–109. [Google Scholar] [CrossRef]
  11. Nemes, A.; Sherry, M.; Lo Jacono, D.; Blackburn, H.M.; Sheridan, J. Evolution and Breakdown of Helical Vortex Wakes behind a Wind Turbine. J. Phys. Conf. Ser. 2014, 555, 012077. [Google Scholar] [CrossRef] [Green Version]
  12. Zhang, W.; Markfort, C.D.; Porte-Agel, F. Near-Wake Flow Structure Downwind of a Wind Turbine in a Turbulent Boundary Layer. Exp. Fluids 2012, 52, 1219–1235. [Google Scholar] [CrossRef] [Green Version]
  13. Sarmast, S.; Dadfar, R.; Mikkelsen, R.F.; Schlatter, P.; Ivanell, S.; Sørensen, J.N.; Henningson, D.S. Mutual Inductance Instability of the Tip Vortices behind a Wind Turbine. J. Fluid Mech. 2014, 755, 705–731. [Google Scholar] [CrossRef] [Green Version]
  14. Leweke, T.; Quaranta, H.U.; Bolnot, H.; Blanco-Rodríguez, F.J.; Dizès, S. Le Long- and Short-Wave Instabilities in Helical Vortices. J. Phys. Conf. Ser. 2014, 524, 012154. [Google Scholar] [CrossRef] [Green Version]
  15. Hattori, Y.; Fukumoto, Y. Effects of Axial Flow on the Stability of a Helical Vortex Tube. Phys. Fluids 2012, 24, 054102. [Google Scholar] [CrossRef]
  16. Lignarolo, L.E.M.; Ragni, D.; Krishnaswami, C.; Chen, Q.; Simão Ferreira, C.J.; van Bussel, G.J.W. Experimental Analysis of the Wake of a Horizontal-Axis Wind-Turbine Model. Renew. Energy 2014, 70, 31–46. [Google Scholar] [CrossRef]
  17. Lignarolo, L.E.; Ragni, D.; Simao Ferreira, C.; van Bussel, G.G. Experimental Quantification of the Entrainment of Kinetic Energy and Production of Turbulence in the Wake of a Wind Turbine with Particle Image Velocimetry. In Proceedings of the 32nd ASME Wind Energy Symposium, National Harbor, MD, USA, 13–17 January 2014; pp. 1–12. [Google Scholar] [CrossRef] [Green Version]
  18. Wu, J.-Z.; Ma, H.-Y.; Zhou, M.-D. Vorticity and Vortex Dynamics; Springer Science & Business Media: Berlin/Heidelberg, Germany, 2006. [Google Scholar]
  19. Bernero, S.; Fiedler, H.E. Application of Particle Image Velocimetry and Proper Orthogonal Decomposition to the Study of a Jet in a Counterflow. Exp. Fluids 2000, 29, S274–S281. [Google Scholar] [CrossRef]
  20. Hussain, A.K.M.F. Coherent Structures and Turbulence. J. Fluid Mech. 1986, 173, 303–356. [Google Scholar] [CrossRef]
  21. Lumley, J.L.; Berkooz, G.; Holmes, P.; Lumley, J.L. The Proper Orthogonal Decomposition in the Analysis of Turbulent Flows. Annu. Rev. Fluid Mech. 2017, 25, 539–575. [Google Scholar] [CrossRef]
  22. Luchtenburg, D.M.; Rowley, C.W. Model Reduction Using Snapshot-Based Realizations. SIAM J. Control Optim. 2012, 56, 1–17. [Google Scholar]
  23. Premaratne, P.; Hu, H. Analysis of Turbine Wake Characteristics by Using Dynamic Mode Decomposition Method. In Proceedings of the AIAA AVIATION Forum, Denver, CO, USA, 5–9 June 2017. [Google Scholar]
  24. Siddiqui, M.S.; Latif, S.T.M.; Saeed, M.; Rahman, M.; Badar, A.W.; Hasan, S.M. Reduced Order Model of Offshore Wind Turbine Wake by Proper Orthogonal Decomposition. Int. J. Heat Fluid Flow 2020, 82, 108554. [Google Scholar] [CrossRef]
  25. Zhang, M.; Stevens, R.J.A.M. Characterizing the Coherent Structures Within and Above Large Wind Farms. Bound.-Layer Meteorol. 2020, 174, 61–80. [Google Scholar] [CrossRef] [Green Version]
  26. De Cillis, G.; Cherubini, S.; Semeraro, O.; Leonardi, S.; De Palma, P. POD-Based Analysis of a Wind Turbine Wake under the Influence of Tower and Nacelle. Wind Energy 2021, 24, 609–633. [Google Scholar] [CrossRef]
  27. Meyer, K.E.; Naumov, I.V.; Kabardin, I.; Mikkelsen, R.; Sørensen, J.N. PIV in a Model Wind Turbine Rotor Wake. In Proceedings of the 10th International Symposium on Particle Image Velocimetry—PIV13, Delft, The Netherlands, 1–3 July 2013; pp. 1–7. [Google Scholar]
  28. Hamilton, N.; Murat, T.; Cal, R. Wind Turbine Boundary Layer Arrays for Cartesian and Staggered Configurations: Part II, Low-Dimensional Representations via the Proper Orthogonal Decomposition. Wind Energy 2015, 18, 297–315. [Google Scholar] [CrossRef]
  29. Hamilton, N.; Tutkun, M.; Cal, R.B. Low-Order Representations of the Canonical Wind Turbine Array Boundary Layer via Double Proper Orthogonal Decomposition. Phys. Fluids 2017, 28, 025103. [Google Scholar] [CrossRef]
  30. Zhou, Y.; Kareem, A. Definition of Wind Profiles in ASCE 7. J. Struct. Eng. 2002, 128, 1082–1086. [Google Scholar] [CrossRef] [Green Version]
  31. Hansen, K.S.; Barthelmie, R.J.; Jensen, L.E.; Sommer, A. The Impact of Turbulence Intensity and Atmospheric Stability on Power Deficits Due to Wind Turbine Wakes at Horns Rev Wind Farm. Wind Energy 2012, 15, 183–196. [Google Scholar] [CrossRef] [Green Version]
  32. Chamorro, L.P.; Arndt, R.E.; Sotiropoulos, F. Reynolds Number Dependence of Turbulence Statistics in the Wake of Wind Turbines. Wind Energy 2012, 15, 733–742. [Google Scholar] [CrossRef]
  33. Ma, X.; Geisler, R.; Agocs, J.; Schröder, A. Investigation of Coherent Structures Generated by Acoustic Tube in Turbulent Flow Separation Control. Exp. Fluids 2015, 56, 46. [Google Scholar] [CrossRef]
  34. Tang, S.L.; Djenidi, L.; Antonia, R.A.; Zhou, Y. Comparison between Velocity- and Vorticity-Based POD Methods in a Turbulent Wake. Exp. Fluids 2015, 56, 169. [Google Scholar] [CrossRef]
  35. Liu, W.; Liu, W.; Zhang, L.; Sheng, Q.; Zhou, B. A Numerical Model for Wind Turbine Wakes Based on the Vortex Filament Method. Energy 2018, 157, 561–570. [Google Scholar] [CrossRef]
Figure 1. A schematic of the wake characteristics of a wind turbine [2].
Energies 15 03596 g001
Figure 2. Flow characteristics of the incoming ABL wind used in the present study. (a) Measured mean velocity profile. (b) Measured turbulence intensity profile.
Energies 15 03596 g002
Figure 3. The schematic of the wind turbine model used in the present study.
Energies 15 03596 g003
Figure 4. Experiment setup for “free run” and “phase-locked” PIV measurements.
Energies 15 03596 g004
Figure 5. (a) Velocity magnitude of an instantaneous PIV measurement, (b) ensemble-averaged normalized velocity, (c) ensemble-averaged normalized TKE and (d) phase-averaged normalized vorticity for rotation phase angle of 0°.
Energies 15 03596 g005
Figure 6. Regions of interest and the corresponding phase-averaged vorticity solutions for θ = 0 ° . (a) Regions of Interest (R1 and R2). (b) R1 Normalized Vorticity. (c) R2 Normalized vorticity.
Energies 15 03596 g006
Figure 7. POD analysis results in terms of cumulative modal energy and the rate of energy addition. (a) Cumulative modal energy. (b) The rate of energy addition.
Energies 15 03596 g007
Figure 8. Velocity-based POD mode shapes for R1 region.
Energies 15 03596 g008aEnergies 15 03596 g008b
Figure 9. Normalized vorticityderived from velocity-based POD reconstructions in R1. (a) a 1 1 + + a 5 5 . (b) a 1 1 + + a 5 5 + U ¯ . (c) An instantaneous vorticity distribution. (d) Phase-locked measurement.
Energies 15 03596 g009aEnergies 15 03596 g009b
Figure 10. Modal enstrophy content for R1 region. (a) Cumulative modal enstrophy. (b) Rate of enstrophy addition.
Energies 15 03596 g010
Figure 11. Normalized vorticity contours of vorticity-based POD mode shapes for R1 region.
Energies 15 03596 g011
Figure 12. Reconstruction results for R1 by using vorticity-based POD. (a) a 1 1 + + a 3 3 . (b) a 1 1 + + a 3 3 + Ω ¯ .
Energies 15 03596 g012
Figure 13. Modal energy and the energy addition ratio for R2 using velocity-based POD. (a) Cumulative modal energy. (b) Rate of energy addition.
Energies 15 03596 g013
Figure 14. Normalized vorticity contours of velocity-based POD mode shapes for R2 region.
Energies 15 03596 g014
Figure 15. Vorticity reconstructions of velocity-based POD analysis for R2 region. (a) a 1 ϕ 1 + a 2 ϕ 2 + + a 6 ϕ 6 . (b) a 1 ϕ 1 + a 2 ϕ 2 + + a 6 ϕ 6 + U ¯ . (c) Instantaneous measurement. (d) Phase-locked vorticity (0° blade angle).
Energies 15 03596 g015
Figure 16. Modal enstrophy content for R2 region. (a) Cumulative enstrophy. (b) Gradient of cumulative enstrophy.
Energies 15 03596 g016
Figure 17. Normalized vorticity contours of vorticity-based POD mode shapes for R2 region.
Energies 15 03596 g017
Figure 18. Vorticity-based POD reconstructions for X > 0.65 D (R2). (a) a 1 1 + + a 6 6 . (b) a 1 1 + + a 6 6 + Ω ¯ .
Energies 15 03596 g018
Table 1. The primary design parameters of the wind turbine model used in the present study (for α = 5 ° ).
ParameterRHhubdroddnacelleaa1a2
Dimension (mm)1402261826682035
Publisher’s Note: MDPI stays neutral with regard to jurisdictional claims in published maps and institutional affiliations.

