1. Introduction
In regional integrated energy systems, integrated energy service providers can improve their energy utilization efficiency through the mutual conversion and utilization of different forms of energy, such as cold, heat, and electricity. According to the principle of “temperature matching and cascade utilization” [
1,
2], integrated energy service providers can implement cascade utilization of heat energy with different qualities and improve the energy utilization productivity of the system through demand response management of various types of loads of users [
3,
4,
5,
6].
At present, demand response management of integrated energy service providers is mainly studied from energy efficiency, cross elasticity of different energy sources, peak cutting and valley filling, etc. In reference [
7], the authors proposed the combination of energy efficiency management and demand response to improve the efficiency and utilization rate of energy use. By considering how energy efficiency configuration conditions of residential buildings affect peak demand and demand response, the impact of energy efficiency management on demand response and the interaction between demand response and energy efficiency management are studied, so as to achieve the ultimate goal of reducing peak load, reducing overall electricity consumption, and saving energy, providing a basis for TOU pricing. Considering that demand side resources, such as demand response and energy efficiency, can help support capacity adequacy of power system reliability, reference [
8] reveals the process and trends of demand response in long-term capacity market procurement through case studies such as ISO New England. In reference [
9], the authors studied the cross elasticity of different energy sources, considered their complementary or substitution relationship, and analyzed the position of natural gas in the energy market from the perspective of cross elasticity of demand. References [
10,
11,
12] considered unified economy and achieved multi-objective optimization at the same time, proposing a peak load transfer model, which coordinated economic cost objectives, peak cutting, and valley filling objectives by adjusting economic coefficients while considering the uncertainty of energy demand. References [
13,
14,
15] aimed to minimize the peak–valley difference and establish a constrained nonlinear programming model for peak–valley TOU electrovalence to achieve better demand response effect.
In demand response management, if energy cascade utilization is considered, it will be beneficial to further tap the potential of energy transfer utilization on the demand side. However, the current demand response research of comprehensive energy service providers does not fully combine energy cascade utilization. The current research on energy cascade utilization mainly focuses on the optimization of integrated energy scheduling. References [
16,
17,
18] considered the differential collaborative configuration method of multiple energy storage, built the electric–thermal network model, the active–reactive power characteristic model, and the refined model of cold/thermal energy storage, and proved the superiority of the collaborative configuration of multiple energy storage through algorithms. In reference [
19], considering renewable resources and realizing cascade utilization of energy, a multi-objective stochastic optimization model of cogeneration was established. References [
20,
21,
22,
23,
24] considered the waste heat recovery and the improvement of the fuel cell, and through the example analysis, it was proved that the application of waste heat recovery in energy storage could improve the stability of the fuel cell and improve its energy utilization efficiency at the same time. Reference [
25] considered designing a new type of energy system, which mainly adopted hydrogen energy storage. In the example simulation, while satisfying the demand of rural users, hydrogen energy storage played an obvious role in energy conservation, environmental protection, and reducing carbon emissions. References [
26,
27,
28,
29,
30] considered the energy storage in the case of charge and discharge, in some special states, the adaptive droop control way could significantly improve the power and save energy. While changing the vertical factor, the power increase can be found slowly. References [
31,
32] considered the deterministic electrovalence planning of electricity sellers in an uncertain power grid; using the demand side management of a virtual power plant and a large number of renewable energy sources to improve the profits of electricity sellers, the prices of electricity sellers could finally be compared with real-time prices in the power grid, to become more competitive.
This paper establishes a demand response management strategy that considers energy cascade utilization, cross elasticity of various energy sources, and energy utilization efficiency comprehensively. A multi-objective optimal scheduling model was constructed based on a multi-type energy demand response strategy, using the optimal total regional operation cost and minimum exergy loss of energy utilization as the objective function. This paper established the model of quality according to the heat, to the principle “temperature matched and cascade utilization”, on the load side heat energy cascade utilization of a different quality, and to consider different energies between cross elasticity and the energy of carbon emissions; the cross elasticity of demand response management strategy, according to the examples, verify the validity of the model of the demand response management strategy.
2. Energy Cascade Utilization
Energy cascade utilization through the use of different qualities of heat energy, step-by-step, to achieve multiple uses of energy, finally lets the quality of energy, step-by-step, down to the target quality, or it cannot be used thus far. Energy cascade utilization in demand response can improve the energy utilization efficiency of the whole system, which is an important measure of energy saving.
2.1. Energy Cascade Utilization Principle
Energy cascade utilization in demand response can improve the energy utilization efficiency of the whole system, which is an important measure of energy saving. Hot and cold energy follows the principle of “temperature matching and cascade utilization”, and can improve energy utilization efficiency by reusing the heat energy left by the equipment, using high-quality heat energy.
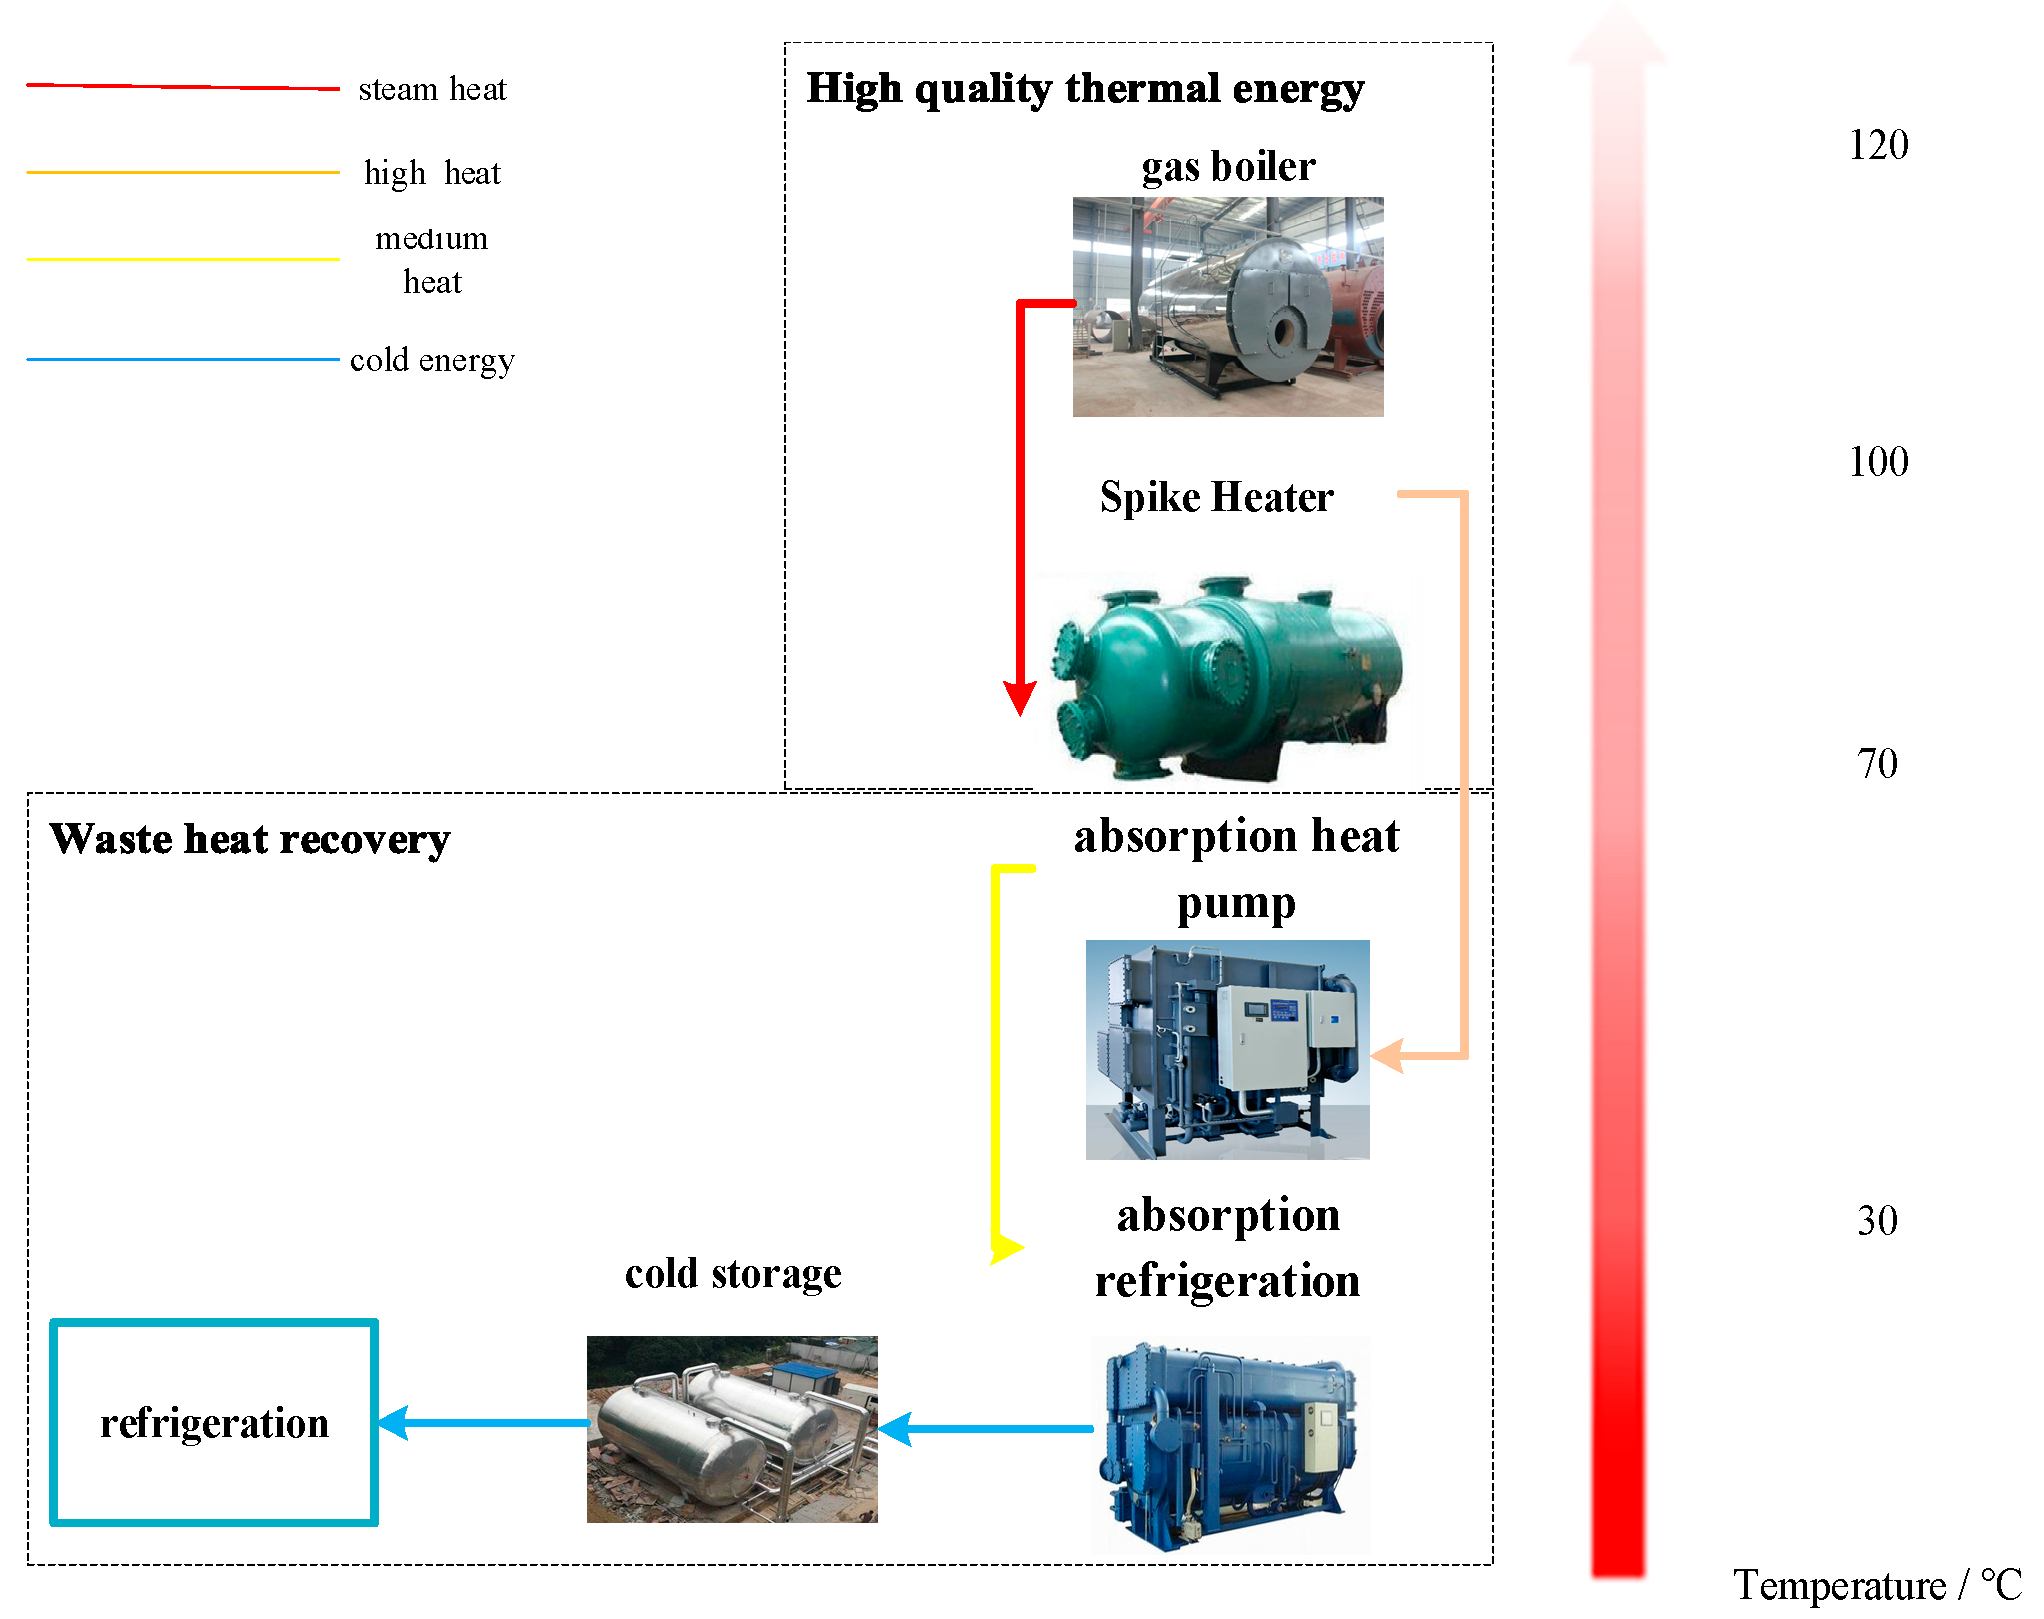
The quality of heat energy is defined as the proportion of available energy in unit energy. The higher the temperature, the more energy available, and the higher the quality of heat energy. Heat energy is divided into steam heat energy, high-temperature heat energy, medium temperature heat energy, and cold energy. After the comprehensive energy service provider purchases natural gas, gas turbines, gas boilers, and other equipment burn natural gas to obtain electric energy, steam heat energy. Through the cascade utilization of energy, the exhaust gas in the gas turbine is reused through the waste heat boiler to produce high-temperature heat energy. An absorption heat pump and absorption chiller are used as waste heat recovery devices; the waste heat generated by the gas boiler is utilized to produce moderate temperature heat energy and cold energy. The cascade utilization of heat energy is shown in
Figure 1.
2.2. Evaluation Index of Cascade Utilization of System Energy
Exergy was taken as the quantitative index to consider the energy efficiency of the whole system. Exergy is a parameter for evaluating the energy value in thermodynamics, which greatly evaluates power efficiency in energy cascade utilization. Exergy is defined as the part of energy that can be converted into useful work in the defined state, also known as effective energy. The equilibrium equation of exergy in the whole system should be: exergy input = exergy output + exergy loss of all equipment + system exergy change [
15].
In the formula, is the exergy loss of the device, is the input exergy, is the output exergy, is the exergy efficiency (output exergy/input exergy of the device) and is the effective input power of each device. Exergy can represent the part that becomes useful work in the process of energy conversion. Through exergy loss, it can be judged whether the equipment is energy-saving, effectively expressing the advantages of energy cascade utilization. Taking energy cascade utilization into consideration in demand response can effectively reduce the exergy loss of the system and improve the energy utilization efficiency of the system.
3. Demand Response Management Strategy for Multiple Types of Energy
For multi-type energy users, integrated energy service providers should take advantage of price incentive measures to fully stimulate the demand response potential of multi-type loads so as to achieve the economic optimal effect. The coupling relationship of the energy cascade is analyzed, and the cross elasticity between different quality levels of energy is excavated, so as to improve the comprehensive energy efficiency of the energy utilization. In this paper, the time-sharing price cross elasticity of heterogeneous energy and time-sharing carbon emission elasticity of the energy price are defined to analyze the coupling relationship between different energy sources and their influence on system carbon emissions.
The time-sharing price demand cross elasticity of heterogeneous energy reflects the sensitivity of the consumption demand of one type of energy to the price change of another type of energy in different periods. The time-sharing price demand cross elasticity of heterogeneous energy is defined as the ratio of the change rate of the energy demand of one type to the change rate of the energy price of another type, and its formula is expressed as:
In the formula, is the price of the type of energy in this period, is the consumption demand of the type energy in this period.
When , the cross elasticity of price demand for two different types of energy is positive, it means that the two types of energy loads are mutually substitutable during this period. The reduction in the price of different types of energy will reduce the demand for the type of energy, and vice versa; the price and demand for different types of energy change in the same direction, indicating that these two types of energy can be replaced. When the price of a certain energy is high, the user chooses another form of energy; the larger the cross elasticity value, the stronger the substitutability.
When , the cross elasticity of demand for two types of energy with different qualities is negative, it means that the consumption of these two types of energy has a related influence in this period. The increase in the price of the type of energy and the decrease in the consumption demand of the type of energy indicate that the consumption of the two types of energy is related and influenced; the larger the absolute value of the cross elasticity, the stronger the correlation and influence.
The time-of-use carbon emission elasticity of energy prices is defined as the ratio of the rate of change of a certain type of energy price to the rate of change of system carbon emissions; its formula is expressed as:
In the formula, is the carbon emission elasticity of the type energy to the carbon emission of the energy system in the period t, is the carbon emission amount of the energy system in this period, and is the price of the type energy in this period.
When , it shows that when the type of energy increases, the system carbon emission decreases, and the change of the type of energy price is inversely related to the change of the system carbon emission. So when the integrated energy system wants to control the emission reduction, it can consider adjusting the price of these types of energy to make it higher.
When , it was shown that when the type of energy increased, the system carbon emission also increased, and the change of the type of energy price was positively related to the change of the system’s carbon emissions. So when the integrated energy system wants to control the emission reduction, it can consider adjusting the price of these types of energy to make it lower.
4. Demand Response Management Optimization Model Considering Energy Cascade Utilization
Based on the demand response management of multi-type energy, aimed at minimizing the total operating cost and loss of the integrated energy system, this paper considers the time-sharing price cross elasticity of heterogeneous energy and the time-sharing carbon emission elasticity of the energy price, and solves the time-sharing prices of integrated energy service providers for multi-type energy under the constraints of energy balance, energy conversion balance, and accumulation energy balance.
4.1. Objective Function
4.1.1. Total Cost of Running the System
Comprehensive energy service providers utilize different qualities of thermal energy in cascade, and meet load demands of different qualities by purchasing resources, such as electricity and natural gas, and operating various equipment in the region.
Divide a day into 24 h, and take the maximum profit of the integrated energy service provider as the objective function, in which the cost of purchasing electricity
from the grid and the cost of purchasing natural gas
are the total income
of the integrated energy service provider, and the total profit of the integrated energy service provider is
.
In the formula, is the electric energy purchased in the t period, and is the electric energy price purchased in the t period.
- 2.
The cost of purchasing natural gas
In the formula, is the purchase price of natural gas in period t, and is the purchase price of natural gas in period t.
In the formula, is the electrovalence sold by the comprehensive energy service provider to the user in the t period, is the total electricity load of the user in the t period, is the steam heat energy price sold by the comprehensive energy service provider to the user in the t period, is the user’s steam heat energy load in the t period, is the price of high-temperature thermal energy sold by comprehensive energy service providers to users in period t, is the high-temperature thermal energy load of users in period t, is the price of moderate temperature thermal energy sold by comprehensive energy service providers to users in period t, is the medium-temperature thermal energy load of users in period t, is the price of cold energy sold by comprehensive energy service providers to users in period t, and is the cooling energy load of users in period t.
4.1.2. Exergy Loss
In the formula,
is the exergy loss of the fan in the period
t,
is the exergy loss of the gas boiler in the period
t,
is the exergy loss of the gas turbine in the period
t, is the exergy loss of the peak heater in the period
t,
is the exergy loss of the absorption heat pump in the period
t,
is the exergy loss of absorption refrigeration in period
t, and
is the exergy loss of electric refrigeration in period
t.
4.2. Restrictions
In the regional integrated energy system, various types of energy should be kept in balance.
4.2.1. Energy Balance
The electrical energy remains in balance at time
t:
In the formula, is the electrical load in the t period, is the electric power purchased from the grid in the t period, is the electric energy made by the wind turbine, is the electric energy made by the gas turbine in the t period, is the electric energy made by the accumulation energy in the t period, discharge the positive energy storage device and charge the negative energy storage device, and is the electric energy used by the electric cooling in the t period.
The heat energy of each quality should be kept in balance:
In the formula, is the thermal load, is the thermal energy made by the gas boiler in the t period, is the thermal energy produced by a gas boiler in the t period, is the thermal energy applied by the absorption chiller in the t period, is the thermal energy applied by the pump in the t period, and is the thermal energy of the steam used by the spike heater for time period t.
High temperature heat energy:
is the high temperature load in the t period, and is the thermal power made by the peak heater in the t period.
Medium temperature heat energy:
is the moderate temperature load in the
t period,
is the moderate temperature thermal energy made by the absorption heat pump in the
t period,
is the moderate thermal energy made by the energy storage in the
t period. ‘Is positive’ means that the energy storage device releases moderate energy, ‘is negative’ means that it is storing moderate energy.
is the cooling load in the t period, means the electric refrigeration produces cold energy in the t period, means the absorption refrigeration produces cold energy in the t period, and means the energy storage device generates cold energy in the t period. Positive means the energy storage device releases cold energy, and negative means the energy storage device stores cold energy.
4.2.2. Energy Conversion Balance
In the cascade utilization equipment of the regional integrated energy system, there are different energy conversions between the equipment, so there is the following balance:
In the formula,
is the electric energy generated by the gas turbine,
is the combustion calorific value of the natural gas,
is the power generation efficiency of the gas turbine, and
is the intake air volume of the gas turbine.
In the formula,
is the intake air volume of the gas boiler,
is the efficiency of the gas boiler, and
is the heat energy of the steam generated by the gas boiler.
In the formula,
is the cooling energy generated by the electric refrigeration,
is the electric energy consumed by the electric refrigeration, and
is the cooling efficiency of the electric refrigeration.
In the formula,
is the steam thermal energy consumed by the spike heater,
is the thermal energy made by the spike heater, and
is the efficiency of the spike heater.
In the formula,
is the steam thermal energy consumed by the absorption heat pump,
is the medium temperature thermal energy generated by the absorption heat pump, and
is the efficiency of the absorption heat pump.
In the formula, is the steam thermal energy consumed by absorption refrigeration, is the cold energy generated by absorption refrigeration, and the is the efficiency of absorption refrigeration.
4.2.3. Energy Storage
In the formula,
is the electrical load/cold/heat state of the accumulation energy
k in the
t period,
is the self-discharge coefficient of the accumulation energy
k,
is the charging efficiency of the accumulation energy
k,
is the discharge efficiency of the accumulation energy
i,
is the time span,
is the storage of the accumulation energy
k.
is the charging power of the accumulation energy
k in the
t period, is the discharge efficiency of the accumulation energy
k, and is the discharge power of the accumulation energy
k in the
t period.
4.2.4. Demand Response
The demand response in the integrated energy service provider system does not only rely on the development of the energy supply side to solve the problem of supply and demand imbalance, but changes the energy consumption mode of users, and relieves the energy supply pressure by cutting peaks and filling valleys.
Demand response elasticity is implemented separately for electricity load, steam load, high temperature load, medium temperature load, and cooling load to formulate real-time prices.
In the formula, is the coefficient ratio between the price of the steam thermal energy sold in the t period and the steam heat load, is the coefficient ratio between the high temperature heat price and the high temperature heat load sold in the t period. The coefficient ratio between the moderate temperature thermal energy price and the medium-temperature heat load is the . The coefficient ratio between the price of cold energy sold in the t period and the high-temperature heat load is the .
The cross elasticity of price demand between different types of energy is:
The elastic coefficient of the consumption of various energy sources at time
t to the carbon emissions of the integrated energy service provider system is as follows:
In the formula, is the carbon emission of the integrated energy service provider system in the period t.
5. Multi-Objective Optimization Method Based on Adaptive Weighting
In the integrated energy service provider system, the total cost and exergy loss are in conflict, so it is difficult to solve the optimal solution through a mathematical model. However, in the solution process, at least one goal is better than all others, which is called the Pareto solution. The set of these solutions is called the Pareto optimal set. The main task of the multi-objective optimization problem is to find the Pareto optimal solution set. For a problem with two objective functions, an adaptive weighted sum method is used to obtain the Pareto optimal solution.
5.1. Randomly Generate a Set of Weights
The optimization model randomly generates a set of weights
to convert the multi-objective into a single-objective problem.
In the formula, is the weighted total objective function, is the i objective function.
5.2. Multi-Objective Optimization Solution Method
Considering
, the multi-disciplinary design optimization method is used to find the optimal solution to obtain the desired multi-objective optimization optimal solution. The constrained optimization problem has the following form.
In the formula, is the equality constraint, is the inequality constraint, is the i objective expected value, X is the optimization variable, and and are the lower and upper limits of the design variables.
Based on the constraints in the text, the optimization model judges whether the multi-objective optimal value obtained by the above formula meets the requirements of the set expected value . If it does, output the optimal result; if not, go back to 5.1 and re-accord the requirements. The weights are changed and the multidisciplinary design optimization is performed again until an optimal solution that satisfies the constraints is obtained.
Finally, the Pareto solution set that meets the expected requirements can be obtained by running the weights randomly for several times, so as to select the appropriate solution. The optimization model adopts the form of adaptive adjustment to select weights, which can make the target closer to the optimal advantage in the optimization interval. However, due to the subjective setting of expectations in the design process, only limited solution sets and solution sets that only meet the design requirements can be found, rather than the optimal solution in the mathematical sense. The process is shown in
Figure 2.
6. Example Analysis
In this paper, all types of loads are given first. Based on the minimum cost and exergy loss, the optimal solutions of exergy loss and costs under different weights are analyzed, and finally the optimization results of all types of loads and demand response are obtained.
6.1. Initial Parameters
The energy system and its equipment connections managed by the integrated energy service provider studied in this paper are shown in
Figure 3.
Among them, the carbon emission coefficient of natural gas consumed by the cogeneration system and boiler is 0.196 kg/kWh and the carbon emission coefficient of grid power generation is 0.968 kg/kWh.
Various types of energy loads provided by integrated energy service providers are shown in
Figure 4.
The price of electricity and natural gas purchased by integrated energy service providers is the time-of-use electrovalence. The purchased electricity and natural gas are converted into thermal energy of different qualities through the regional integrated energy system and provided to users. Among them, the price of electricity and natural gas purchased by integrated energy service providers is shown in
Table 1.
The exergy efficiency [
6] of each device is shown in
Table 2. According to Formula (1), the exergy loss of each device can be calculated, as shown in
Table 2.
6.2. Optimization Results
The multi-objective optimization model in this paper sought to compare the solution results; the results are shown in
Table 3.
When the cost weight is 1, only taking the lowest cost as the objective function can obtain the best economic benefits; if the exergy loss is 1; that is, only taking the lowest exergy loss as the objective function, the optimal operation efficiency can be obtained, so it is necessary to consider the system exergy losses and costs to make optimal decisions. The Pareto solution is shown in
Figure 5.
Under the carbon emission assessment, considering the solution with the least carbon emissions, the cost weight is 0.8, the exergy loss weight is 0.2, and the carbon emissions under the adaptive weighting solution is 5.4 tons. At this time, the comprehensive energy service provider’s calculation results of various types of energy prices for user loads are as follows.
Analysis was made according to
Figure 6 of the above results; 0:00 and 10:00 in a day is the valley period of electrovalence and the normal period of electrovalence, the electric accumulation energy will charge. The peak period of electrovalence is from 11:00 to 14:00, the electric accumulation energy will discharge. Taking into account exergy productivity of accumulation energy and the peak–valley characteristics of electrovalence, the energy time conversion will be completed. This reduces the operation costs and obtains an economic advantage.
Figure 7 shows the steam quality of thermal energy by the gas boiler and gas turbine to supply two devices; the gas boiler and gas turbine exergy productivity are similar, and the cost of the operation of the gas turbine is higher than the gas boiler. So the supply of steam in the gas boiler is larger than the gas turbine, the main unit steam load to the use of the peak absorption refrigeration, absorption heat pump, and heater. Cold energy generally comes from absorption refrigeration equipment. In the peak period of electrovalence, the absorption chiller, which absorbs the steam load to generate cold energy, produces cold energy, thus reducing the operation of electric refrigeration equipment and reducing the pressure of the power grid. The absorption heat pump device absorbs steam thermal energy to generate medium heat to satisfy the demand of users. The peak heater absorbs steam thermal energy to produce high temperature thermal energy to meet the demand of the high temperature load.
As shown in
Figure 8, the high temperature thermal energy is provided by the spike heater.
As shown in
Figure 9, the intermediate temperature thermal energy is supplied by the intermediate temperature thermal energy and photothermic generated after the absorption heat pump absorbs the high-temperature steam. Although the photothermic exergy loss is large, the light energy is a natural resource and the operating cost is low. Therefore, using light and heat to supply the users’ moderate temperature thermal energy is preferred. Based on this, absorption heat pumps are used for heating. The heat storage device stores heat during the trough period, emits moderate temperature heat energy at peak times, and releases heat energy at peak times of moderate temperature load energy consumption to satisfy users.
As shown in
Figure 10, cold energy is provided by absorption refrigeration and electric refrigeration equipment. Exergy productivity of the electrical refrigeration equipment and absorption refrigeration equipment is similar, so the operating cost is given priority. In the valley period of electrovalence, cold energy is provided by the electric refrigeration equipment, and throughout the rest of the time, the absorption refrigeration equipment, using the difference of electrovalence in different time periods to implement the cold energy supply, so as to reduce the operation cost.
6.3. Demand Response Results
According to the analysis in
Figure 12, the integrated energy service provider obtains the corresponding real-time electrovalence through optimization and demand response management.
According to the analyses of
Figure 13 and
Figure 14, 8:00–19:00 is the time period when the steam load can be managed by demand response. According to the optimization results, it can be seen that 8:00–15:00 is selected as the time period for the reduction of the steam load. Since this time period is the normal and peak period of electrovalence, and it is also the peak period of energy consumption, selecting this period as the demand response time period and reducing the price of steam heat energy at this time can effectively relieve the pressure of the energy supply.
According to the analysis of
Figure 15 and
Figure 16, 8:00–22:00 is the time period during which a high temperature load can be managed by the demand response. According to the optimization results, 8:00–11:00 and 13:00–17:00 are selected. This time period is the time when high temperature load can be reduced. This time period is the period of peak electrovalence and valley electrovalence, and it is also the peak period of the load. The only source of the high temperature load is the peak heater. Gas boilers and gas turbines provide peak heaters; two devices for starting energy. Among them, gas turbines are power-consuming devices and their operating costs are directly related to electrovalence, which affect the reduction time of demand response. Therefore, 8:00–11:00 and 13:00–17:00 are selected. The two time periods are used as the load reduction time, and the real-time high temperature heat price is obtained through optimization.
According to the analyses in
Figure 17 and
Figure 18, the heat energy of moderate temperature quality is generally the heating/cooling equipment load of the user’s residents, so it is only necessary to adjust the temperature of the heating/cooling equipment of the user to reduce the user’s moderate temperature energy consumption. According to the optimization results, it can be concluded that, when the user’s heating/cooling equipment temperature is controlled at 20 degrees Celsius, the use of medium-temperature heat energy can be reduced without affecting the user’s comfort, reducing energy supply pressure, and optimizing the acquisition of real-time medium grade heat prices.
According to the analyses in
Figure 19 and
Figure 20, the cooling energy provided by the two types of equipment, absorption refrigeration and electric refrigeration, can obtain a real-time cooling energy price under the condition of giving priority to the operating cost, so more profit can be obtained, and real-time cooling can be obtained through optimization, being able to load.
6.4. Comparison and Analysis of Cross Elasticity
The optimization calculation shows that the demand cross elasticity of each type of equipment in the process of demand response, as shown in the figure.
As shown in
Figure 21, it can be seen that the cross elasticity of the electricity demand for steam heat energy is less than 0 in some periods; that is, electric energy and steam heat energy are complementary; when electrovalence drops in a short period of time, the demand for electricity load will increase relatively, and the demand for steam heat energy will also increase. In some periods, the cross elasticity of electricity demand for steam heat energy is greater than 0; that is, electricity and steam heat energy are complementary; when electrovalence drops in a short period of time, the demand for electricity load will increase relatively, while the demand for steam heat energy will also increase.
The cross elasticity of the demand of steam to high temperature heat energy, high temperature to medium temperature heat energy, and medium temperature to cold energy has positive and negative values in different time periods, but the comparison shows that the influence of medium temperature heat energy on cold energy is the greatest.
The optimization calculation results in the carbon emission elasticity in the process of demand response, as shown in the figure.
As shown in
Figure 22, considering the carbon emission elasticity of different energy sources, it can be seen that the sudden change period in the carbon emission elasticity is related to the excessive price change of each energy source in this period, and even the opposite trend in many places. This can make the price more reasonable.
6.5. Exergy Loss Comparison and Analysis
The optimization calculation can obtain the exergy loss of each type of equipment before and after the demand response, as shown in
Table 4.
In the whole system, the exergy loss before demand response is 20,190.1 kW, the energy utilization efficiency is 75.61%, and the purchase cost of electricity and natural gas is CNY 21,001; after demand response, the exergy loss is reduced to 17,909.7 kW without considering the cross elasticity of demand, The exergy efficiency is 80.06%, and the purchase cost of electricity and natural gas is CNY 19,834; considering the cross elasticity of demand, the exergy loss is reduced to 17,376.0 kW again. At this time, the exergy efficiency is 80.65%, and the purchase cost of electricity and natural gas is CNY 19,689.
According to the analyses of
Figure 23 and
Figure 25, the exergy losses of gas boilers and absorption refrigeration account for a large proportion. Since high-temperature steam is mainly provided by gas boilers and gas turbines, the exergy losses of gas boilers and gas turbines account for a large proportion. As for refrigerator supply, the exergy loss of the absorption chiller accounts for a large proportion. The exergy efficiency of gas turbines and gas boilers is relatively high; in the process of cascade utilization, natural gas is converted into steam heat energy. In the whole system, the exergy loss of the gas turbine and the gas boiler is not very different before and after the demand response, and its proportion is increased throughout the whole system, thus improving the energy utilization efficiency of the system. At the same time, the exergy efficiency of the absorption heat pump is also high. In the process of cascade utilization, it converts steam heat energy into moderate temperature heat energy, and the exergy loss of the absorption heat pump is not very different before and after the demand response; its proportion in the system also increases, thus improving the energy utilization efficiency of the system. Regarding absorption refrigeration—its exergy efficiency is low. In the process of cascade utilization, the steam heat energy is converted into cold energy. The exergy loss of absorption refrigeration has a large gap before and after demand response, but the proportion changes little, indicating that the energy utilization efficiency of the system improved after demand response management.
According to the analyses of
Figure 24 and
Figure 25, in the management of demand response, the exergy loss, considering the cross elasticity of demand, is obviously higher than that without considering the cross elasticity of demand; the system also improves the energy utilization efficiency.
To summarize, it shows the advantages of energy savings after demand response and reduces the cost of purchasing electricity and natural gas.
7. Summary
This paper integrates the cascade utilization of heat energy by energy service providers on the load side, the demand response management of various types of energy on the user side, and the demand management and control based on the cascade utilization of energy. At the same time, the concept of exergy in thermodynamics is used to evaluate the utilization of energy. Considering the cross elasticity between power and steam heat energy and different cascade heat energy, a multi-objective model based on exergy loss and total cost is proposed. The results show that the implementation of energy cascade utilization in the regional comprehensive energy system and the management of demand response for different users can effectively reduce the cost of the system, reduce the loss, and achieve optimal management of economic utilization and energy value.
Author Contributions
Conceptualization, J.Y. and Y.P.; methodology, J.Y.; software, J.Y., Y.P. and J.W.; validation, J.Y., Y.P. and Y.L.; formal analysis, J.Y.; investigation, J.Y. and Y.L.; resources, Y.P.; data curation, Y.P. and J.W.; writing—original draft preparation, J.Y., Y.P. and J.W.; writing—review and editing, J.Y., Y.P. and J.W.; visualization, J.Y.; supervision, Y.P.; project administration, J.Y.; funding acquisition, J.Y. and Y.L. All authors have read and agreed to the published version of the manuscript.
Funding
Research on the operation mechanism and key technologies of the integrated energy system based on the theory of institutional effectiveness: contract no. U1966204; research on the elastic energy management and operation strategy of the integrated energy efficiency power plant based on information-driven: contract no. 51977032.
Data Availability Statement
Not applicable.
Acknowledgments
The authors would like to acknowledge the research on the operation mechanism and key technologies of the integrated energy system based on the theory of institutional effectiveness: contract no. U1966204; research on the elastic energy management and operation strategy of the integrated energy efficiency power plant based on information-driven: contract no: 51977032.
Conflicts of Interest
The authors declare no conflict of interest.
References
- Jin, H.; Sui, J.; Xu, C.; Zheng, D.X.; Shi, L. Research on Theory and Method of Multi-energy Complementary Distributed Cogeneration System. Proc. Chin. Soc. Electr. Eng. 2016, 36, 3150–3161. [Google Scholar]
- Teng, D.; Li, T.; Li, A.; An, L.; Chen, H.; Shen, G. Analysis of system characteristics of waste heat recovery and cascade utilization of flue gas from power station boilers. China Electr. Power 2020, 53, 189–196. [Google Scholar]
- Mojtaba, B.; Ehsan, M.; Ehsan, R. Combined Energy-Exergy-Control (CEEC) analysis and multi-objective optimization of parabolic trough solar collector powered steam power plant. Energy 2020, 201, 117641. [Google Scholar]
- Zhang, H.; Liu, S.; Kang, H. Normalization and generalization of exergy concept in engineering thermodynamics. Res. High. Educ. Eng. 2019, 34, 135–138+144. [Google Scholar]
- Zhang, X.W.; Yufeng, Z.; Ying, S. Energy, exergy, economic (3E) analysis and multi-objective optimization of a novel dual functional integration system. Energy Convers. Manag. 2019, 199, 111962. [Google Scholar]
- Wang, Y.F.; Li, N.; Pan, C.; Li, Y.; Qin, J.; Li, T.; Jin, T. Research on Model Optimization and Dispatching Strategy of Multi-energy Complementary Energy System Based on Exergy Analysis. Glob. Energy Interconnect. 2021, 4, 249–263. [Google Scholar]
- Zhang, K.; Chen, W.G.; Li, H.Y.; Mao, J.; Zhang, K. Research on Gridlab-D-based Energy Efficiency Response Project to Power Demand. Electr. Eng. 2020, 14, 132–136. [Google Scholar]
- Liu, Y.Q. Demand response and energy efficiency in the capacity resource procurement: Case studies of forward capacity markets in ISO New England, PJM and Great Britain. Energy Policy 2017, 100, 271–282. [Google Scholar] [CrossRef]
- Hu, R.; Zhao, M.T. Analysis of the market position of natural gas based on cross-price Elasticity. Gas Heat 2020, 40, 37–39+46. [Google Scholar]
- Bin, Z.; Weihao, H.; Jing, H.L.; Di, C.; Rui, H.; Qi, H.; Zhe, C.; Frede, B. Dynamic energy conversion and management strategy for an integrated electricity and natural gas system with renewable energy: Deep reinforcement learning approach. Energy Convers. Manag. 2020, 220, 113063. [Google Scholar]
- Xu, Z.; Sun, Y.H.; Xie, D.; Mao, J.; Zhang, K. Energy storage optimization configuration of regional integrated energy system considering electric heat flexible load. Autom. Electr. Power Syst. 2020, 44, 53–63. [Google Scholar]
- Marcos, T.; Salah, K.; Hany, M.; Rania, A.; Francisco, J. A mixed-integer-linear-logical programming interval-based model for optimal scheduling of isolated microgrids with green hydrogen-based storage considering demand response. J. Energy Storage 2022, 48, 104028. [Google Scholar]
- Li, C.Y.; Xu, Z.Y.; Ma, Z.Y. The time-of-use electricity price optimization model considering user demand response. J. Electr. Power Syst. Autom. 2015, 27, 11–16. [Google Scholar]
- Hang, X.; Shufeng, D.; Zhongxiao, H.; Yunhui, S. Multi-energy collaborative optimization of factory integrated energy system considering energy cascade utilization. Autom. Electr. Power Syst. 2018, 42, 123–130. [Google Scholar]
- Fang, Z.; Yang, Z.; Chen, Y.G. Exergy loss power analysis of gas engine heat pump system with combined cooling, heating and power supply. Therm. Energy Power Eng. 2009, 24, 53–59+142. [Google Scholar]
- Hanbin, D.; Peiqiang, L.; Xiaoxiu, L.; Xiaolong, L.; Xinran, L. Coordinated Optimal Allocation of Energy Storage in Regional Integrated Energy System Considering the Diversity of Multi-Energy Storage. Trans. China Electrotech. Soc. 2021, 36, 151–165. [Google Scholar]
- Mohammed, K.; Laith, A.; Salah, K.; Hoda, A.; Marcos, T.V. An Improved Arithmetic Optimization Algorithm for design of a microgrid with energy storage system: Case study of El Kharga Oasis, Egypt. J. Energy Storage 2022, 51, 104343. [Google Scholar]
- Wu, J.; Yu, J.; Tianran, L.; Zhang, X.; Li, M.; Zhang, Y. Multi-objective optimization analysis of a combined heat and power system based on useful work of different qualities of heat energy utilization (ISPEC 2020). In Proceedings of the 2020 IEEE Sustainable Power and Energy Conference (ISPEC), Chengdu, China, 23–25 November 2020; pp. 1185–1190. [Google Scholar]
- Yi, Z.K.; Li, Z.M. A combined heat and power dispatch strategy that takes into account the thermal inertia of heat storage and heating areas in the heating network. Power Syst. Technol. 2018, 42, 1378–1384. [Google Scholar]
- Hiroshi, I.; Naoki, M.; Masayoshi, I.; Akihiro, N. Efficiency of unitized reversible fuel cell systems. Int. J. Hydrogen Energy 2016, 41, 5803–5815. [Google Scholar]
- Yuanchao, L.; Trung, V.N. Core-shell rhodium sulfide catalyst for hydrogen evolution reaction/hydrogen oxidation reaction in hydrogen-bromine reversible fuel cell. J. Power Sources 2018, 382, 152–159. [Google Scholar]
- Cevahir, T.; Mehmet, A.Ç. A study on hydrogen, the clean energy of the future: Hydrogen storage methods. J. Energy Storage 2021, 40, 102676. [Google Scholar]
- Matteo, M.; Massimo, S. Hydrogen storage alloys for stationary applications. J. Energy Storage 2020, 32, 101864. [Google Scholar]
- Dan, Z.; Youcef, A.; Abdoul, N.; Abdesslem, D. On-line state of charge estimation of embedded metal hydride hydrogen storage tank based on state classification. J. Energy Storage 2021, 42, 102950. [Google Scholar]
- Ayodele, T.R.; Mosetlhe, T.C.; Yusuff, A.A.; Ogunjuyigbe, A.S.O. Off-grid hybrid renewable energy system with hydrogen storage for South African rural community health clinic. Int. J. Hydrogen Energy 2021, 46, 19871–19885. [Google Scholar] [CrossRef]
- Mohd, A.; Kuldeep, K.; Viresh, D. Droop based control strategy for balancing the level of hydrogen storage in direct current microgrid application. J. Energy Storage 2021, 33, 102106. [Google Scholar]
- Yuhong, X.; Yuzuru, U.; Masakazu, S. Greedy energy management strategy and sizing method for a stand-alone microgrid with hydrogen storage. J. Energy Storage 2021, 44, 103406. [Google Scholar]
- Kuldeep, K.; Mohd, A.; Saket, V.; Viresh, D. Effect of hysteresis band control strategy on energy efficiency and durability of solar-hydrogen storage based microgrid in partial cloudy condition. J. Energy Storage 2020, 32, 101936. [Google Scholar]
- Behnam, Z.; Sanna, S. Electrical energy storage systems: A comparative life cycle cost analysis. Renew. Sustain. Energy Rev. 2015, 42, 569–596. [Google Scholar]
- Faisal, M.; Hannan, M.A.; Ker, P.J.; Hussain, A.; Mansor, M.B.; Blaabjerg, F. Review of Energy Storage System Technologies in Microgrid Applications: Issues and Challenges. IEEE Access 2018, 6, 35143–35164. [Google Scholar] [CrossRef]
- Sayyad, N.; Kazem, Z.; Behnam, M. Application of fuel cell and electrolyzer as hydrogen energy storage system in energy management of electricity energy retailer in the presence of the renewable energy sources and plug-in electric vehicles. Energy Convers. Manag. 2017, 136, 404–417. [Google Scholar]
- Sayyad, N.; Kazem, Z.; Behnam, M. Selling price determination by electricity retailer in the smart grid under demand side management in the presence of the electrolyser and fuel cell as hydrogen storage system. Int. J. Hydrogen Energy 2017, 42, 3294–3308. [Google Scholar]
Figure 1.
Heat energy cascade utilization.
Figure 1.
Heat energy cascade utilization.
Figure 2.
Adaptive weighted solution method.
Figure 2.
Adaptive weighted solution method.
Figure 3.
Energy cascade utilization under the combined heat and power system.
Figure 3.
Energy cascade utilization under the combined heat and power system.
Figure 4.
Daily load curve of various types of energy.
Figure 4.
Daily load curve of various types of energy.
Figure 6.
Daily electricity/power generation curve.
Figure 6.
Daily electricity/power generation curve.
Figure 7.
Daily steam heat supply and load curve.
Figure 7.
Daily steam heat supply and load curve.
Figure 8.
Daily high temperature heat supply and load curve.
Figure 8.
Daily high temperature heat supply and load curve.
Figure 9.
Daily middle-temperature heat supply and load curve.
Figure 9.
Daily middle-temperature heat supply and load curve.
Figure 10.
Daily cold energy supply and load curve.
Figure 10.
Daily cold energy supply and load curve.
Figure 11.
Real-time energy prices sold to users by integrated energy service providers.
Figure 11.
Real-time energy prices sold to users by integrated energy service providers.
Figure 12.
Real-time electricity prices sold to users by integrated energy service providers.
Figure 12.
Real-time electricity prices sold to users by integrated energy service providers.
Figure 13.
Real-time steam prices sold to users by integrated energy service providers.
Figure 13.
Real-time steam prices sold to users by integrated energy service providers.
Figure 14.
Steam load demand response curve.
Figure 14.
Steam load demand response curve.
Figure 15.
Real-time high-temperature thermal energy prices sold to users by integrated energy service providers.
Figure 15.
Real-time high-temperature thermal energy prices sold to users by integrated energy service providers.
Figure 16.
High temperature load demand response curve.
Figure 16.
High temperature load demand response curve.
Figure 17.
Real-time middle-temperature thermal energy prices sold to users by integrated energy service providers.
Figure 17.
Real-time middle-temperature thermal energy prices sold to users by integrated energy service providers.
Figure 18.
Middle-temperature load demand response curve.
Figure 18.
Middle-temperature load demand response curve.
Figure 19.
Real-time cold energy prices sold to users by integrated energy service providers.
Figure 19.
Real-time cold energy prices sold to users by integrated energy service providers.
Figure 20.
Cold load demand response curve.
Figure 20.
Cold load demand response curve.
Figure 21.
Cross elasticity.
Figure 21.
Cross elasticity.
Figure 22.
Cross elasticity of cold energy on carbon emissions.
Figure 22.
Cross elasticity of cold energy on carbon emissions.
Figure 23.
Percentage of exergy losses of each device prior to the demand response.
Figure 23.
Percentage of exergy losses of each device prior to the demand response.
Figure 24.
The proportion of equipment exergy loss in the case of demand response without considering cross elasticity.
Figure 24.
The proportion of equipment exergy loss in the case of demand response without considering cross elasticity.
Figure 25.
Percentage of exergy losses, taking into account cross elasticity for each device after the demand responses.
Figure 25.
Percentage of exergy losses, taking into account cross elasticity for each device after the demand responses.
Table 1.
The price at which integrated energy service providers buy energy.
Table 1.
The price at which integrated energy service providers buy energy.
| Time | The Purchase Price of the Integrated Energy Service Provider |
|---|
0:00–7:00
23:00–24:00 | 0.3648 | 3.4 |
8:00–11:00
18:00–23:00 | 0.8645 | 3.4 |
| 12:00–17:00 | 1.3902 | 3.4 |
Table 2.
The price at which integrated energy service providers buy energy.
Table 2.
The price at which integrated energy service providers buy energy.
| Equipment | The Purchase Price of the Integrated Energy Service Provider |
|---|
| Wind turbine | 45 | |
| Gas turbine | 97.71 | |
| Absorption heat pump | 71.30 | |
| Absorption refrigeration | 71.30 | |
| Spike heater | 43.20 | |
| Electric refrigeration | 65.01 | |
| Gas boiler | 94.34 | |
Table 3.
Optimal solutions for different goals.
Table 3.
Optimal solutions for different goals.
| Scene | Cost Weight | Exergy Loss
Weights | The Cost of Purchasing Electricity and Natural Gas/CNY 10,000 | Exergy Loss/1000 kW | Carbon Emissions/t |
|---|
| Fixed weight | 0.5 | 0.5 | 2.0527 | 16.322 | 40.822 |
| Adaptive weighting | 0.8 | 0.2 | 1.9689 | 17.376 | 5.4 |
Table 4.
Comparison of exergy before and after the demand response.
Table 4.
Comparison of exergy before and after the demand response.
| Equipment | Exe Loss before Demand Response (kW) | Exergy Loss after Demand Response (kW) (Exergy Loss after Demand Response) | Exergy Loss after Demand Response (kW) (Consider Cross Elasticity) |
|---|
| Gas turbine | 1240.2 | 1225.1 | 1219.1 |
| Absorption heat pump | 2240.2 | 2302.5 | 2264.6 |
| Absorption refrigeration | 6386 | 5195.5 | 4947.1 |
| Electric refrigeration | 1038.3 | 458.2 | 444.9 |
| Gas boiler | 8131.6 | 8102.5 | 7959.7 |
| Energy storage | 1154.2 | 625.9 | 540.6 |
| Total exergy loss | 20,190.1 | 17,909.7 | 17,376.0 |
| Publisher’s Note: MDPI stays neutral with regard to jurisdictional claims in published maps and institutional affiliations. |
© 2022 by the authors. Licensee MDPI, Basel, Switzerland. This article is an open access article distributed under the terms and conditions of the Creative Commons Attribution (CC BY) license (https://creativecommons.org/licenses/by/4.0/).


