Article

Study of the Microstructural Characteristics of Low-Rank Coal under Different Degassing Pressures

1
Key Laboratory of Coalbed Methane Resources and Reservoir Formation Process, Ministry of Education, Xuzhou 221008, China
2
Carbon Neutrality Institute, China University of Mining and Technology, Xuzhou 221008, China
3
The Fifth Institute of Geology and Mineral Exploration of Shandong Province, Tai’an 271099, China
4
Xuzhou Coal Mining Group, Xuzhou 221008, China
*
Authors to whom correspondence should be addressed.
Energies 2022, 15(10), 3691; https://doi.org/10.3390/en15103691
Submission received: 6 April 2022 / Revised: 6 May 2022 / Accepted: 14 May 2022 / Published: 18 May 2022
(This article belongs to the Special Issue Low-Grade Coal Beneficiation)

Abstract

:
Low-rank coal samples from the Xishanyao Formation in the southern Junggar basin of Xinjiang were processed under different negative pressures in order to examine the microstructural characteristics of low-rank coal reservoirs. The pore structures of low-rank coal under different negative pressures were tested using scanning electron microscopy, low-temperature nitrogen adsorption–desorption, and water saturation and centrifugal low-field NMR experiments. The results showed that for the low-rank coal samples from the study area, a high portion of the porosity and surface area came from micropores and small pores; the fractal dimension of the adsorption pores of the low-rank coal samples was divided into surface fractal dimension D1 and structural fractal dimension D2, which showed that the microstructure of the low-rank coal from the study area was complex. The transverse relaxation times T2 of the low-rank coal samples in the test were approximately 0.1~2.5, approximately 10, and greater than 100 ms; the T2 spectrum had basically three peak types. By combining scanning electron microscopy and nuclear magnetic resonance tests, it was concluded that the pore connectivity of the low-rank coal reservoirs in the study area was poor and the effective porosity was relatively low, which may be unfavorable for the exploration and development of coalbed methane.

1. Introduction

China’s low-rank coal comes primarily from the Junggar and Ordos basins in Northwest China. Low-rank coalbed methane resources abound with huge exploration and development potential. Significant progress has been achieved in the production of low-rank coalbed methane in Fukang, Xinjiang, and other regions in recent years. The microstructure of low-rank coal is complex as seen by the intricate pore structures. The adsorption and desorption of coalbed methane in coal is affected by the pore distribution, pore morphology, and connectivity of different sizes in low-rank coal, which ultimately affects gas extraction [1,2,3].
The research region is a typical low-rank coal accumulation basin in front of a foreland mountain, with a reflectance (R0) of 0.42–0.77 percent of low-rank coal vitrinite [4]. Previous research has focused on coalbed methane exploration and production, low-rank coal basin physical property characterization, and other topics. In the pores of low-rank coal, small pores (i.e., transition pores) and large pores emerge, with small pores being the most developed [5,6,7,8,9]. The pore structure of coal is studied using techniques such as mercury injection, low-temperature nitrogen adsorption, scanning electron microscopy, and low-field nuclear magnetic resonance. SEM is often used to qualitatively assess the pore structure of coal. The MIP method is mostly used to determine the pore size of large and medium pores. Pore size analysis of micropores, tiny pores, and some middle pores is performed using the LT-N2A method with a test range of 1.7–300 nm. LT-N2A has limitations in the range of pore size and cannot reflect the distribution of large pores and cracks in coal samples; the MIP method damages coal samples. The LF-NMR technique, on the other hand, uses the T2 relaxation time of fluid in a coal pore to determine the distribution of pores in a coal sample, including micropores, medium pores, large pores, and cracks, and has the advantages of being quick, non-destructive, and precise. Previous research using LF-NMR technology has quantified coal pore structure and obtained related metrics such as pore diameter distribution and porosity [10,11,12,13,14,15].
Based on this, this paper conducted SEM, LT-N2A, and LF-NMR tests on low-rank coal samples from the Xishanyao Formation in the Zhunnan basin, Xinjiang, and analyzed the pore structure characteristics of low-rank coal reservoirs from the study area under different negative pressure conditions. It also studied the dynamic evolution of the pores and fractures and the variation in the characteristics of pore heterogeneity under effective stress in order to provide the basis for accurately obtaining the pore structure characteristics of low-rank coal reservoirs from the study area.

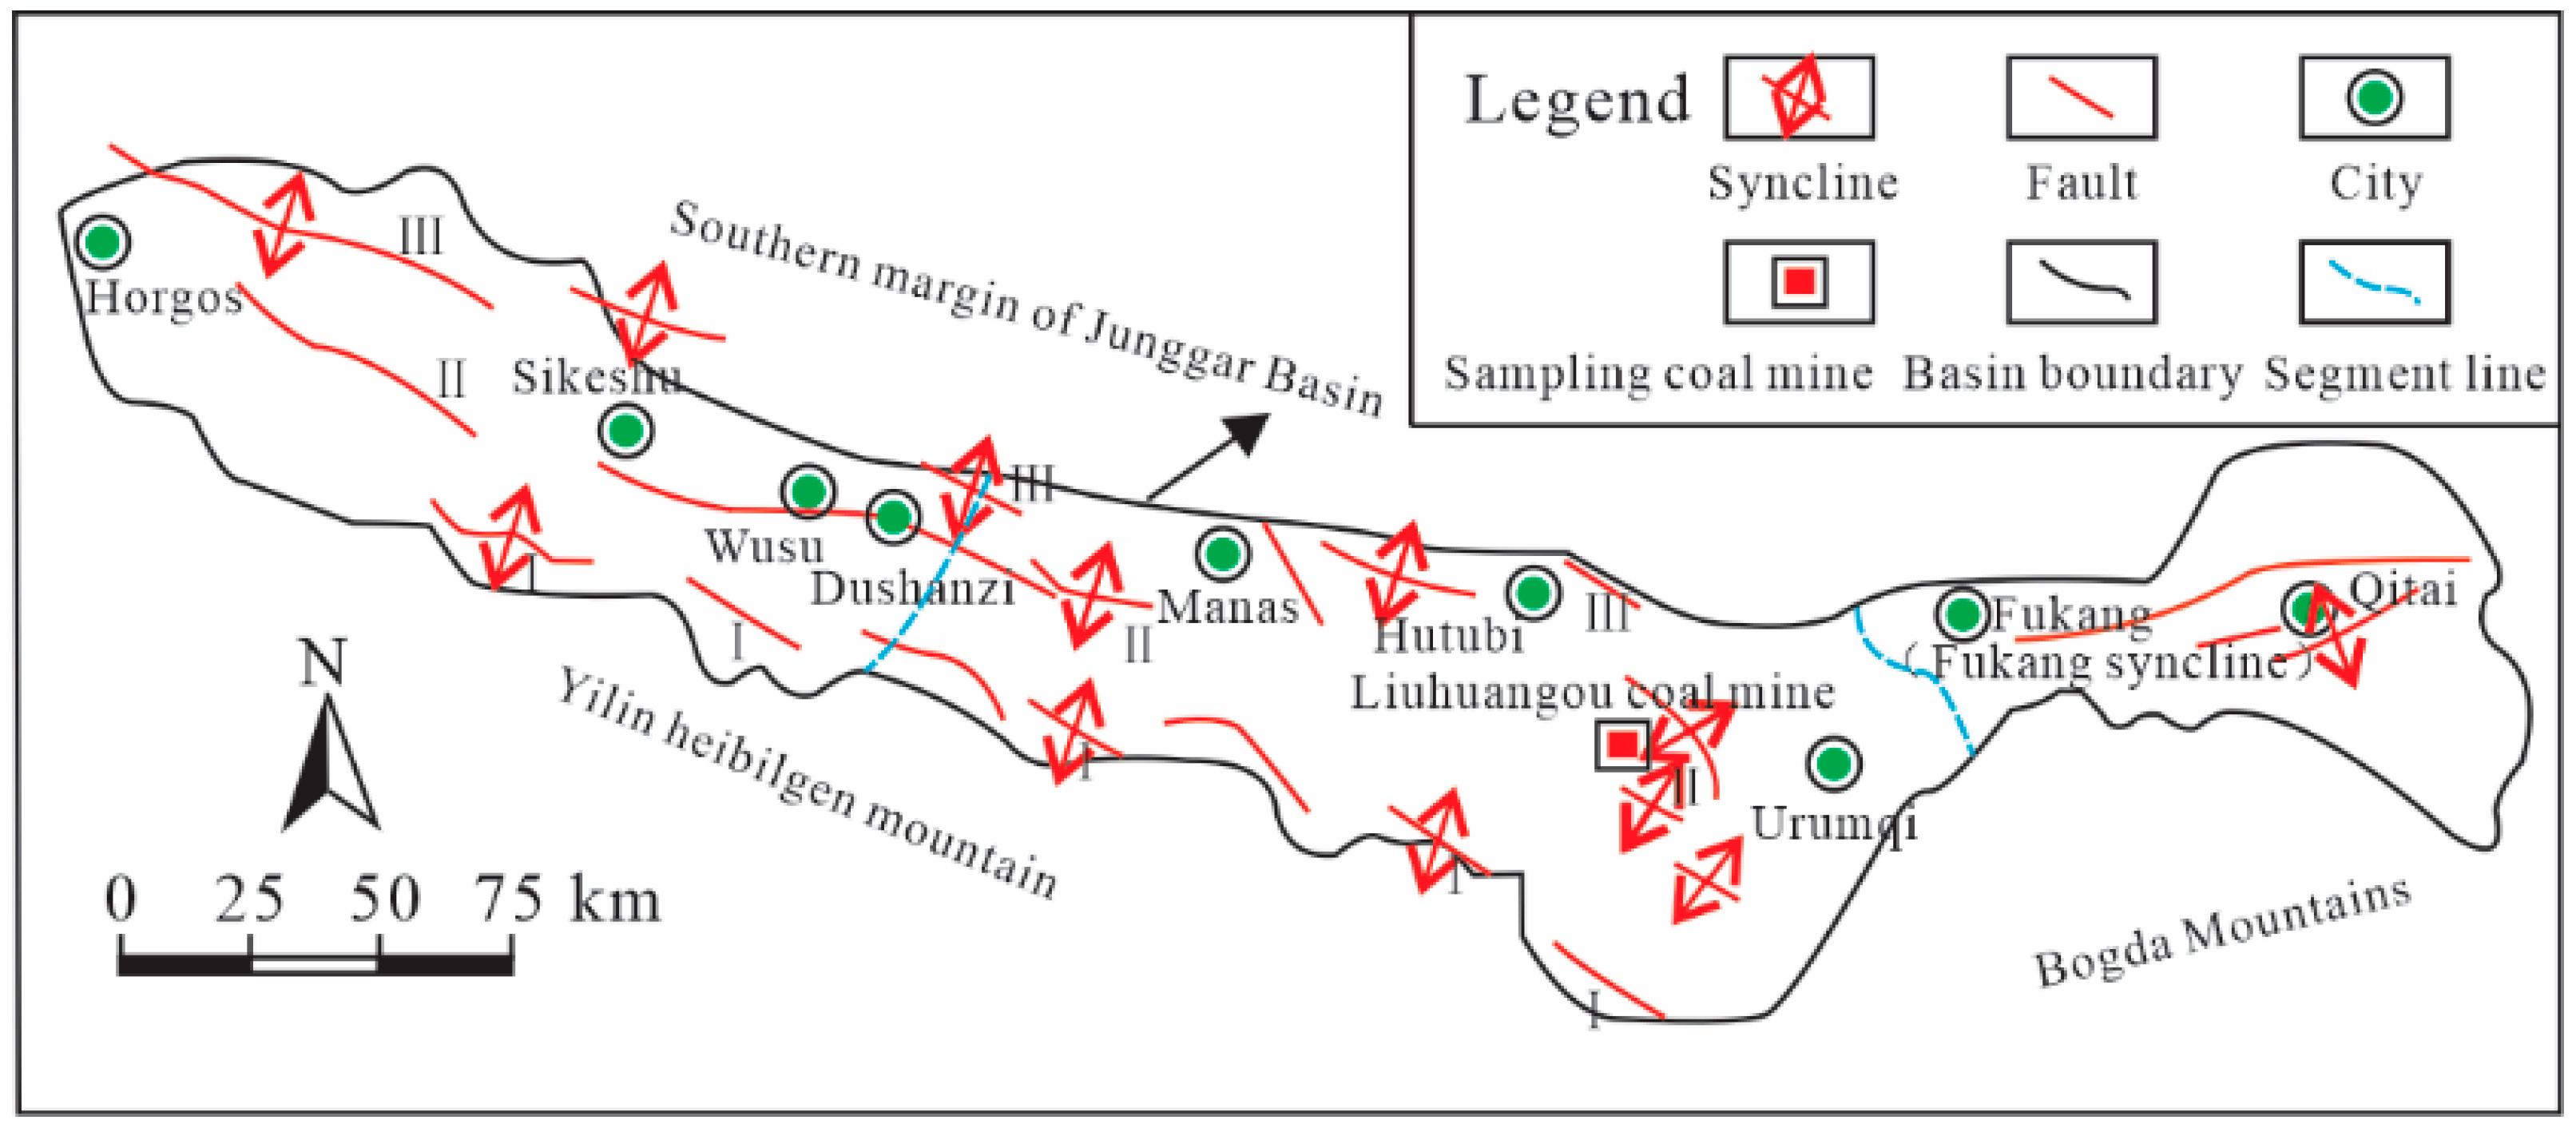
2. Geological Background

The superposition of syncline, anticline, and thrust fault, which is a piedmont thrust structural belt, characterizes the southern boundary of the Junggar basin. On the whole, the strata are thrust nappe from south to north, and it exhibits the features of “north–south zoning and east–west segmentation” [16]. In the east–west direction, taking Urumqi and Dushanzi as the boundary, it is divided into an east section, interruption section, and a west section. In the north–south direction, nearly east–west extending structural belts are formed, namely, the North Tianshan Piedmont wedge structural belt (I), Horgos–Manas-Tugulu thrust nappe belt (II), and Dushanzi–Hutubi detachment structural belt (III) [17]. The Liuhuanggou coal mine is situated in an interrupted syncline structure, which is still in its early stages of development (Figure 1). The Xishanyao Formation (J2x) and the Badaowan Formation (J1b) of the middle and lower Jurassic are coal-bearing rock groups on the Junggar basin’s southern edge. The Xishanyao Formation is found in the upper portion of the coal-bearing rock sequence, and it has a fan delta-delta facies deposition from bottom to top [18] with the lithology primarily consisting of gray-black fine sandstone, siltstone, mudstone, carbonaceous mudstone, and coal seam.

3. Sampling and Experimental Tests

3.1. Sample Collection and Processing

Low-rank coal from the Xishanyao Formation (J2x) in the Liuhuanggou coal mine in the Fukang mining area was selected as the research object (Figure 1). The maximum reflectance of the vitrinite was 0.68%, which is typical of gas coal. To avoid the oxidation of the low-rank coal samples, the collected fresh coal samples were completely wrapped with preservative film and sent to the laboratory for relevant experimental tests. The American CBM industry defines coal with a Ro, max lower than 0.7% or 0.8% as low-rank coal [19]. Therefore, the upper limit of low-rank coal in this study was Ro, max = 0.8%. The findings from the measurements of the vitrinite reflectance and macerals of the coal samples, according to GB/T6948-2008 and GB/T8899-2013, are shown in Table 1.
The low-rank coal samples were subjected to negative pressure treatment under five different pressures (i.e., −0.075, −0.06, −0.045, −0.03, and −0.015 MPa) (Table 2). During the experimental test, the same samples were used for the relevant experimental tests at different pressures to avoid possible experimental errors caused by the strong heterogeneity of coal and rock; that is, the experimental test was carried out after the negative pressure treatment of −0.075 MPa, and after the experimental test under this pressure was completed, the coal samples were reused for negative pressure treatment under other pressures and experimental tests under those pressures.

3.2. Experimental Tests

In this study, the pore fracture morphology and pore size distribution properties of low-rank coal reserves were finely characterized using SEM, LT-N2A, LF-NMR, and other methods. Xoдoт’s [20] diameter classification scheme was used in this study: micropore (diameter < 10 nm), small pore/transition (diameter = 10–100 nm), mesopore (diameter = 100–1000 nm), macropore (diameter = 1000–10,000 nm), and crack (width > 10,000 nm).
(1)
Image analysis method: SEM was primarily used to study the formation of pores and fractures in low-rank coal reserves as well as to obtain coal sample pictures and analyze the size, shape, connectivity, and surface morphology of pores and fractures;
(2)
Physical adsorption method: The micropores and pores of low-rank coal reservoirs were characterized using am LT-N2A adsorption approach. The experiment used a fully automated physical adsorption apparatus (GEMSV-Sorb 2800TP). The particle size of the N2 adsorption test coal sample was 0.2~0.25 mm, and the weight of the coal sample was approximately 20 g;
(3)
Low-field nuclear magnetic resonance: The pore size distribution characteristics of low-rank coal reservoirs as well as the conversion relationship between porosity and T2 relaxation time were established using NMR relaxation time analysis, and the distribution characteristics of the T2 relaxation time at different spectral peaks corresponded to the distribution characteristics of the micropores, medium pores, large pores, and fractures in the low-rank coal samples. The instrument used was a medium-sized NMR analysis and imaging system, and the instrument model was MesoMR23-060H-I.

4. Results and Discussion

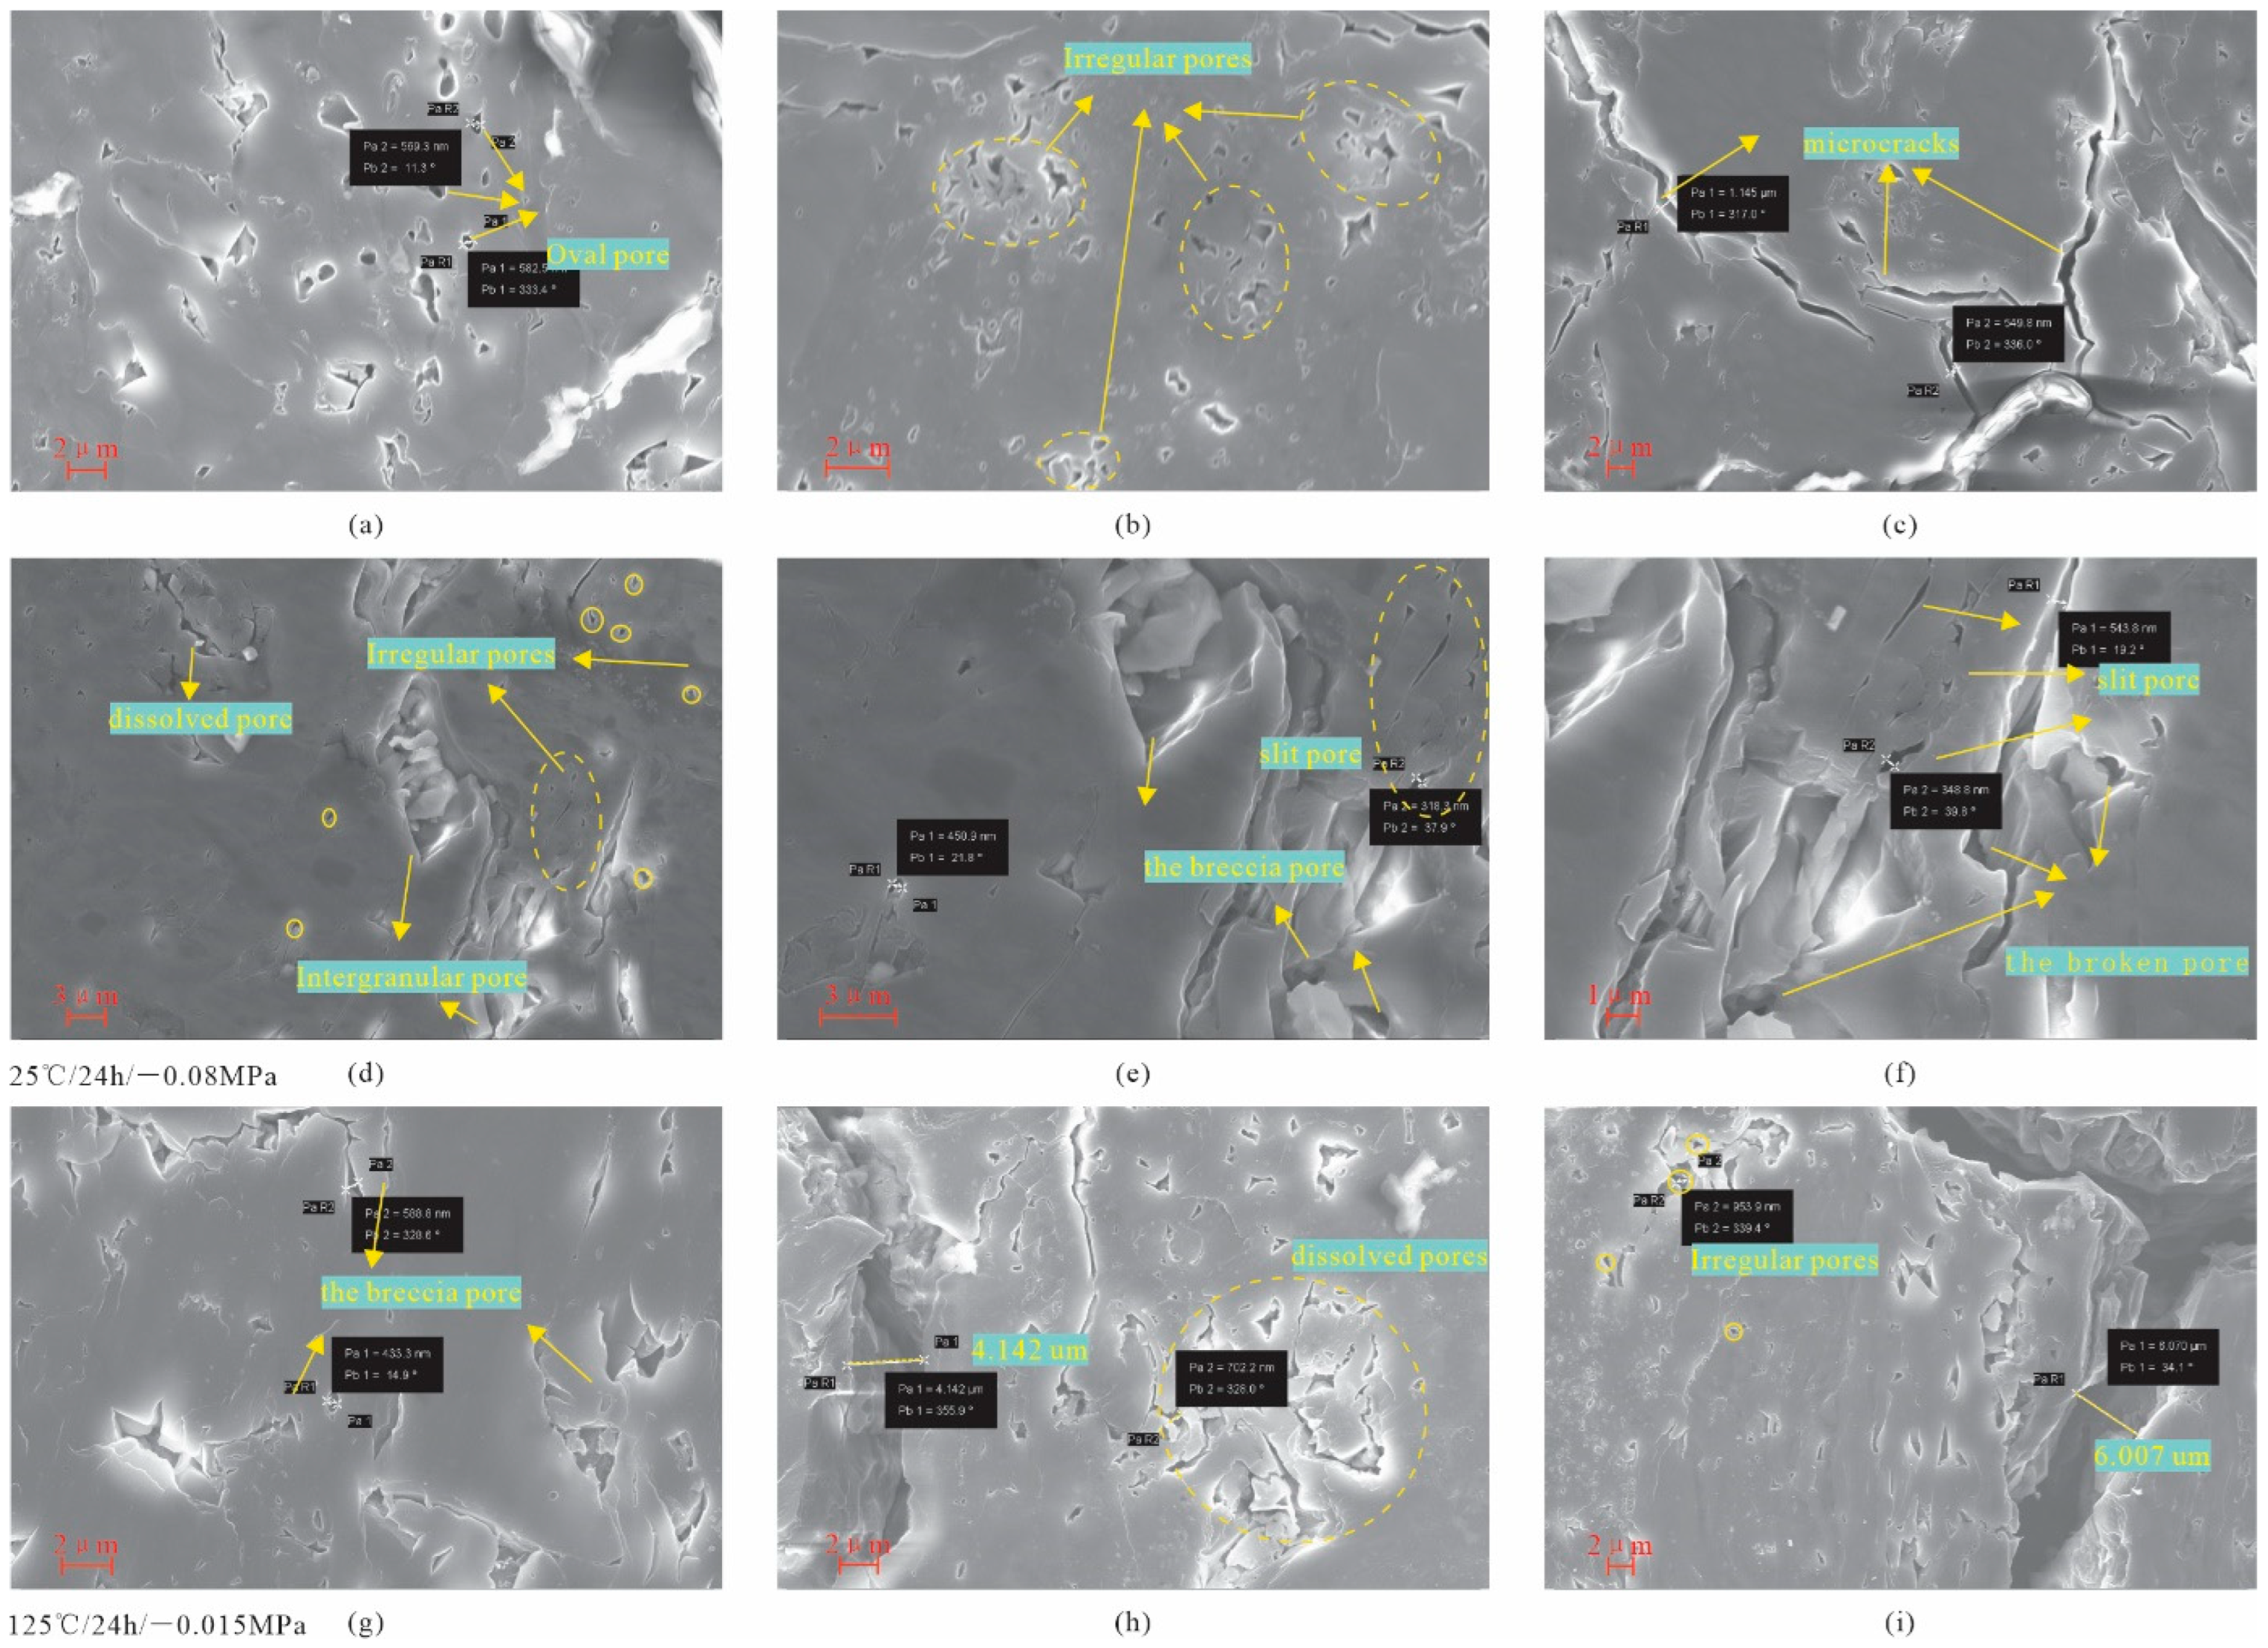
4.1. Pore Morphological Characteristics of Low-Rank Coal

A variety of micropores were generated in the low-rank coal from the research area using an SEM to observe the pore fissure of low-rank coal under the microscope, and the distributions of the pore morphology and sizes were diverse (Figure 2). Scholars, at home and abroad, define coal pores as primary pores, gas holes, intergranular pores, mineral dissolution pores, mineral mold pore, microcracks, etc., based on the origin and distribution features of the pores [21]. In the early stages of coal formation, a substantial amount of gas is produced for low-rank coal. A large number of pores are created as a result of gas creation and buildup. The majority of the pores were subcircular with a smooth pore edge. The pores in the low-rank coal displayed oval and irregular pores due to the compaction and diagenesis in the later stages of coal formation, and the connection between pores was poor. The pore size belonged to the micropore range, and the microfractures generated in the low-rank coal were mostly endogenous fractures. The microfractures can sometimes link with the pores to generate seepage channels, as can be observed (Figure 2a–c). Figure 2 depicts the change in the pore structure of the low-rank coal samples treated under various negative pressures. According to the SEM images, generally speaking, the diameter and volume of the pores and fractures showed an increasing trend. After treatment at 25 °C for 24 h and at −0.08 MPa (Figure 2d–f), the pore morphology and size did not change; however, with the increase in temperature and pressure after treatment at 125 °C for 24 h at −0.015 MPa, the low-rank coal sample began to dehydrate and volatilize. In this process, the pore diameter increased significantly, and the fracture width also increased (Figure 2g–i).

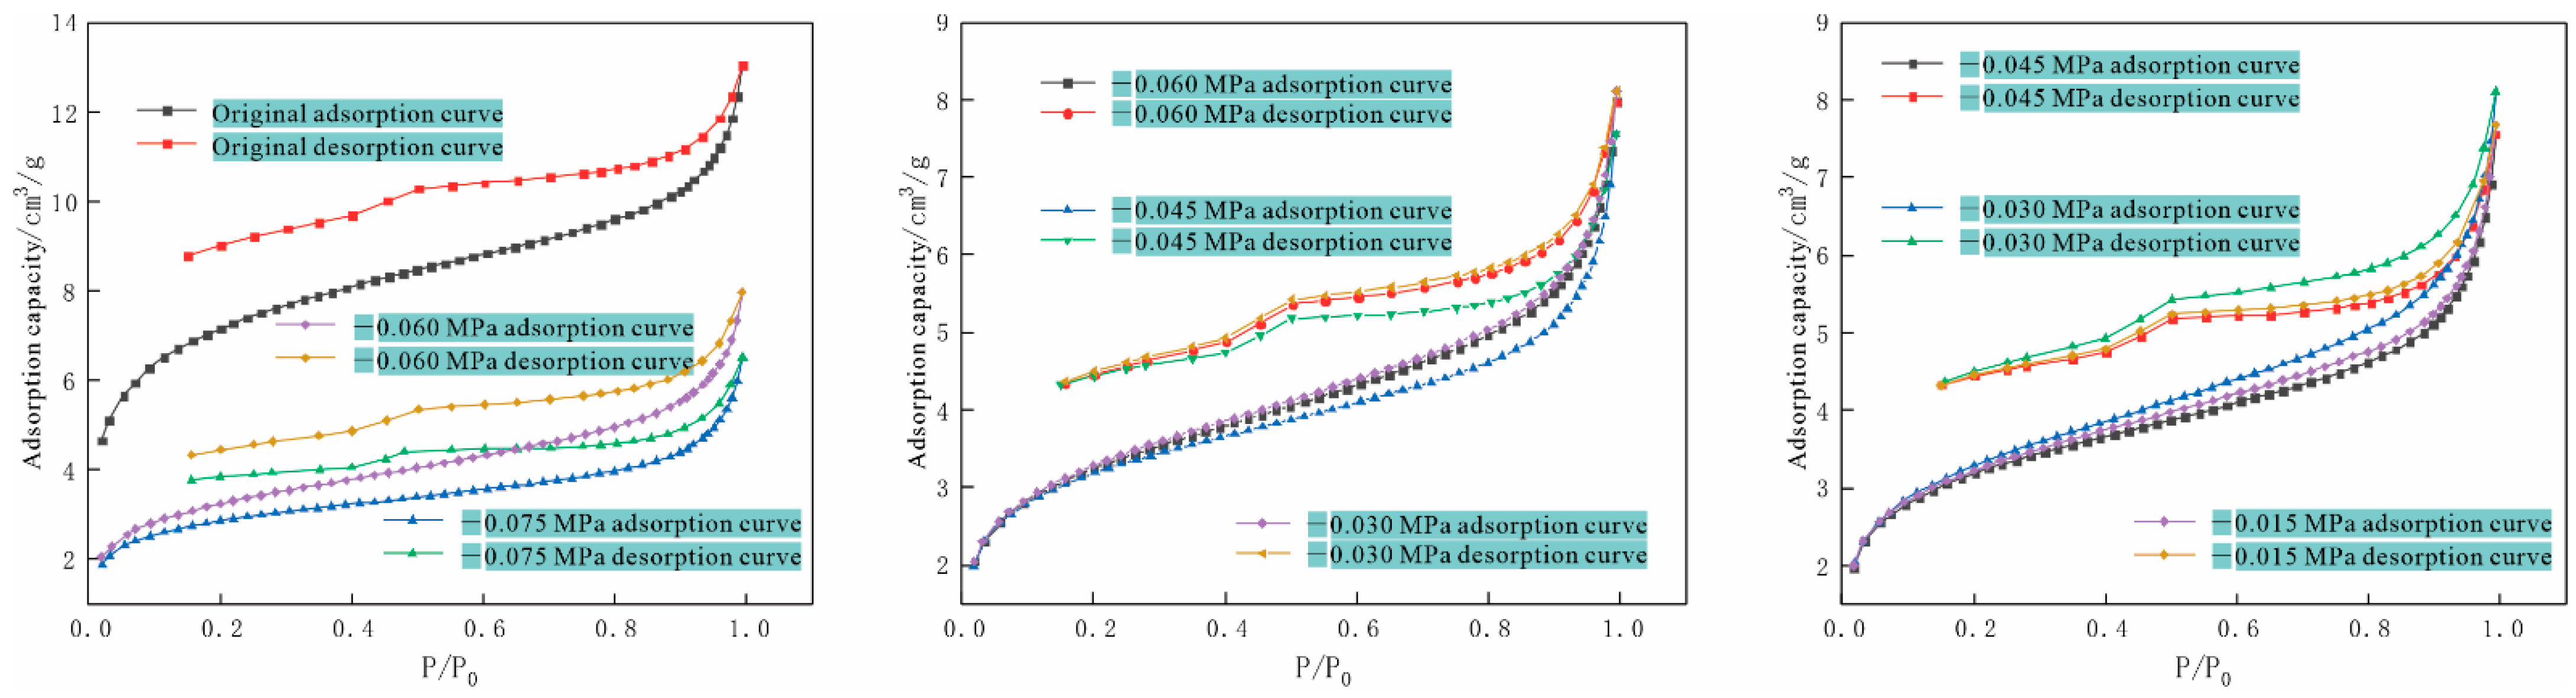
4.2. Characteristics of the LT-N2A Curves under Different Negative Pressure Conditions

Adsorption and desorption curves of the low-rank coal test samples were produced using a low-temperature nitrogen adsorption and desorption experiment (Figure 3). Under different negative pressure conditions, the characteristics of the adsorption–desorption curves of the low-rank coal were relatively similar. It can be seen that under the condition of low relative pressure (P/P0 < 0.8), the nitrogen adsorption capacity of the low-rank coal samples increased relatively slowly, while when the relative pressure was P/P0 > 0.8, the nitrogen adsorption capacity of the coal samples increased rapidly to the maximum value. This indicates that there was a great number of macropores in the low-rank coal samples. With the decrease in relative pressure, P/P0, the nitrogen adsorption capacity decreased slowly under different negative pressure conditions. When the relative pressure was P/P0 = 0.5, an inflection point could be seen.
Figure 3 shows that the nitrogen adsorption and desorption curves of the low-rank coal samples did not match, indicating that adsorption hysteresis existed in both samples. Adsorption hysteresis existed throughout the pressure section of the low-rank coal samples under various negative pressure circumstances. The presence of many mesopores and macropores in the low-rank coal samples as well as the capillary condensation on the surface of the coal samples may be the cause of adsorption hysteresis. The shape and size of the pores in the coal samples were connected to the form and size of the adsorption hysteresis ring. When the relative pressure, P/P0, was equal to approximately 0.5, the desorption curve of the low-rank coal sample decreased abruptly, indicating that the adsorption hysteresis ring in the coal sample was of the H2 type (Figure 4). There were many “ink bottle” pores in the coal samples [22]. The desorption curves increased slowly when the relative pressure, P/P0, was low, and then it climbed quickly, causing a dramatic increase. The pore system of the low-rank coal samples were complicated as can be observed.

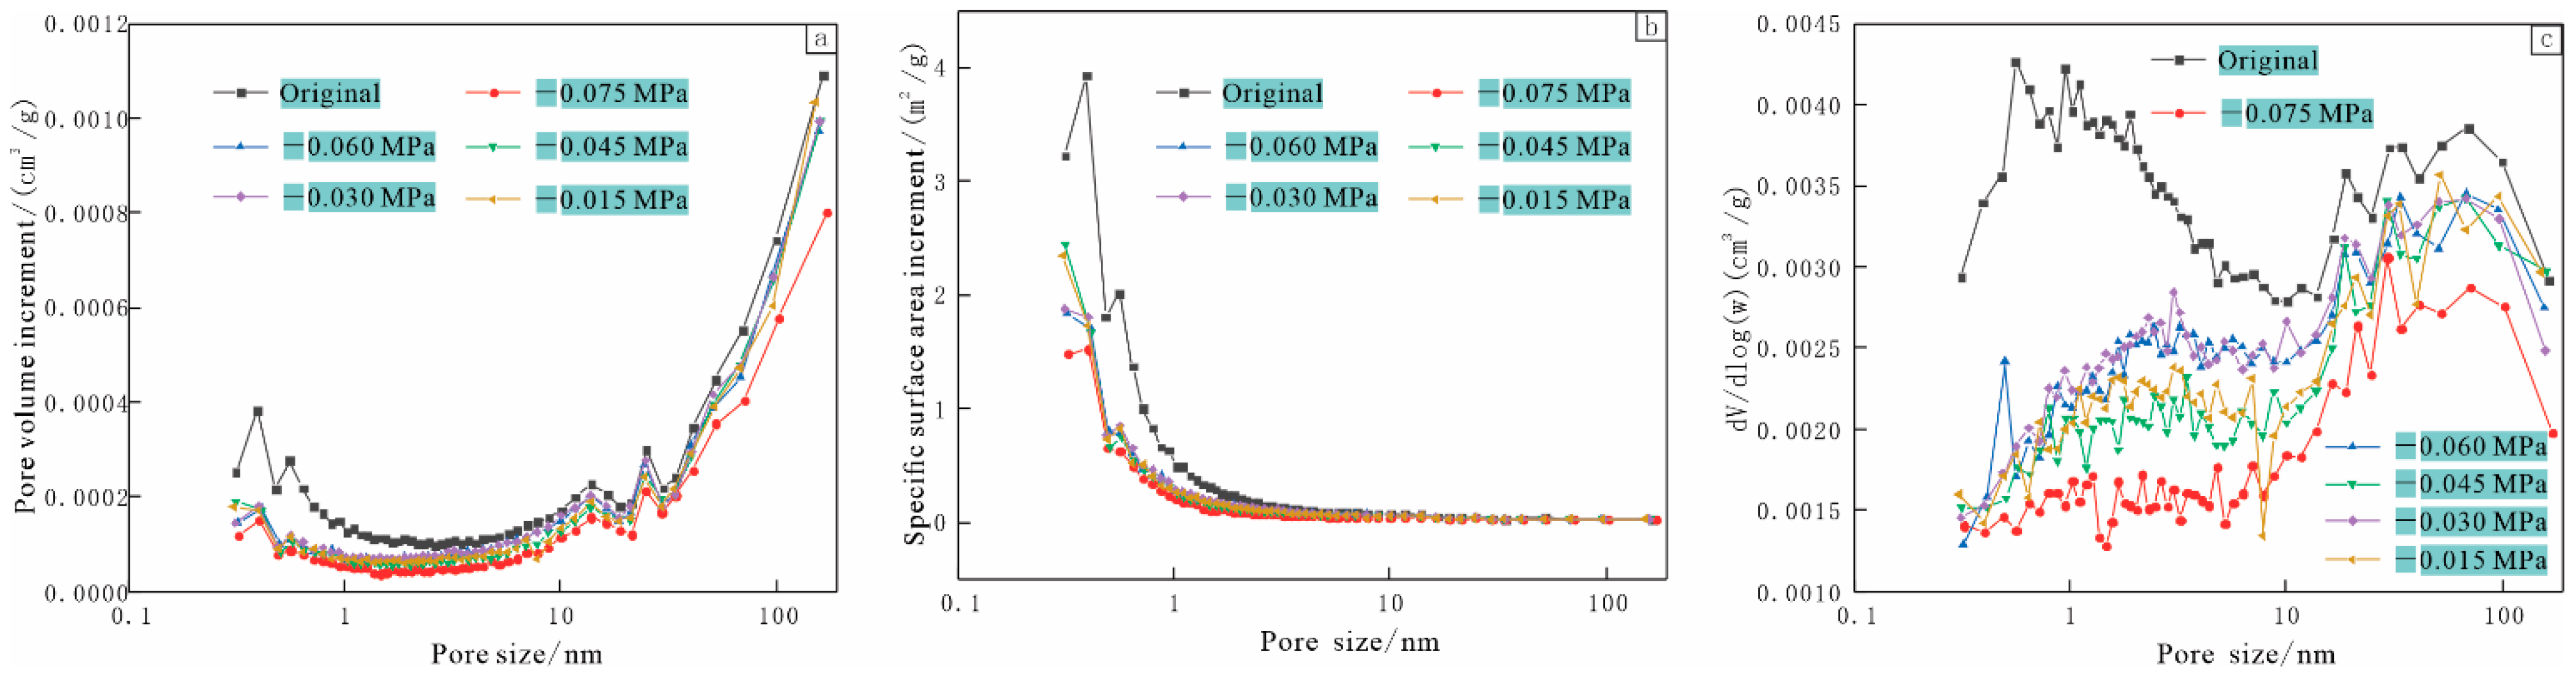
4.3. Characteristics of Pore Structure Parameters of the Low-Rank Coal under Different Negative Pressure Conditions

Under varied negative pressure settings, the BET specific surface area of the low-rank coal samples in this experiment was 10.0975~11.7648 m2/g with an average of 11.2263 m2/g. The total pore volume of the BJH was 6.094 × 10⁻³–7.984 × 10⁻³ cm3/g with an average of 7.327 × 10⁻³ cm3/g. Table 3 displays the results. As shown in Figure 5, the pore structure of the low-rank coal samples had multipeak distribution features (Figure 5) with pore volume peaks at 1 and 10–100 nm, owing primarily to the contribution of small pores. They had a large total pore volume, often exceeding 6.1 × 10⁻³ cm3/g, owing to the contribution of a significant number of micropores and small pores, which also resulted in a small average pore size of approximately 2.5 nm. Micropores were primarily responsible for the peak of the pore-specific surface area, which was 1 nm. This was due to the enormous micropore volume and the specific surface area of the micropores and tiny pores, respectively. Although such a pore shape is favorable for coalbed methane adsorption and enrichment, the low-rank coal samples produced a large number of “ink bottle” pores [22], which are detrimental to coalbed methane desorption and diffusion.

4.4. Heterogeneity of the Adsorption Pores

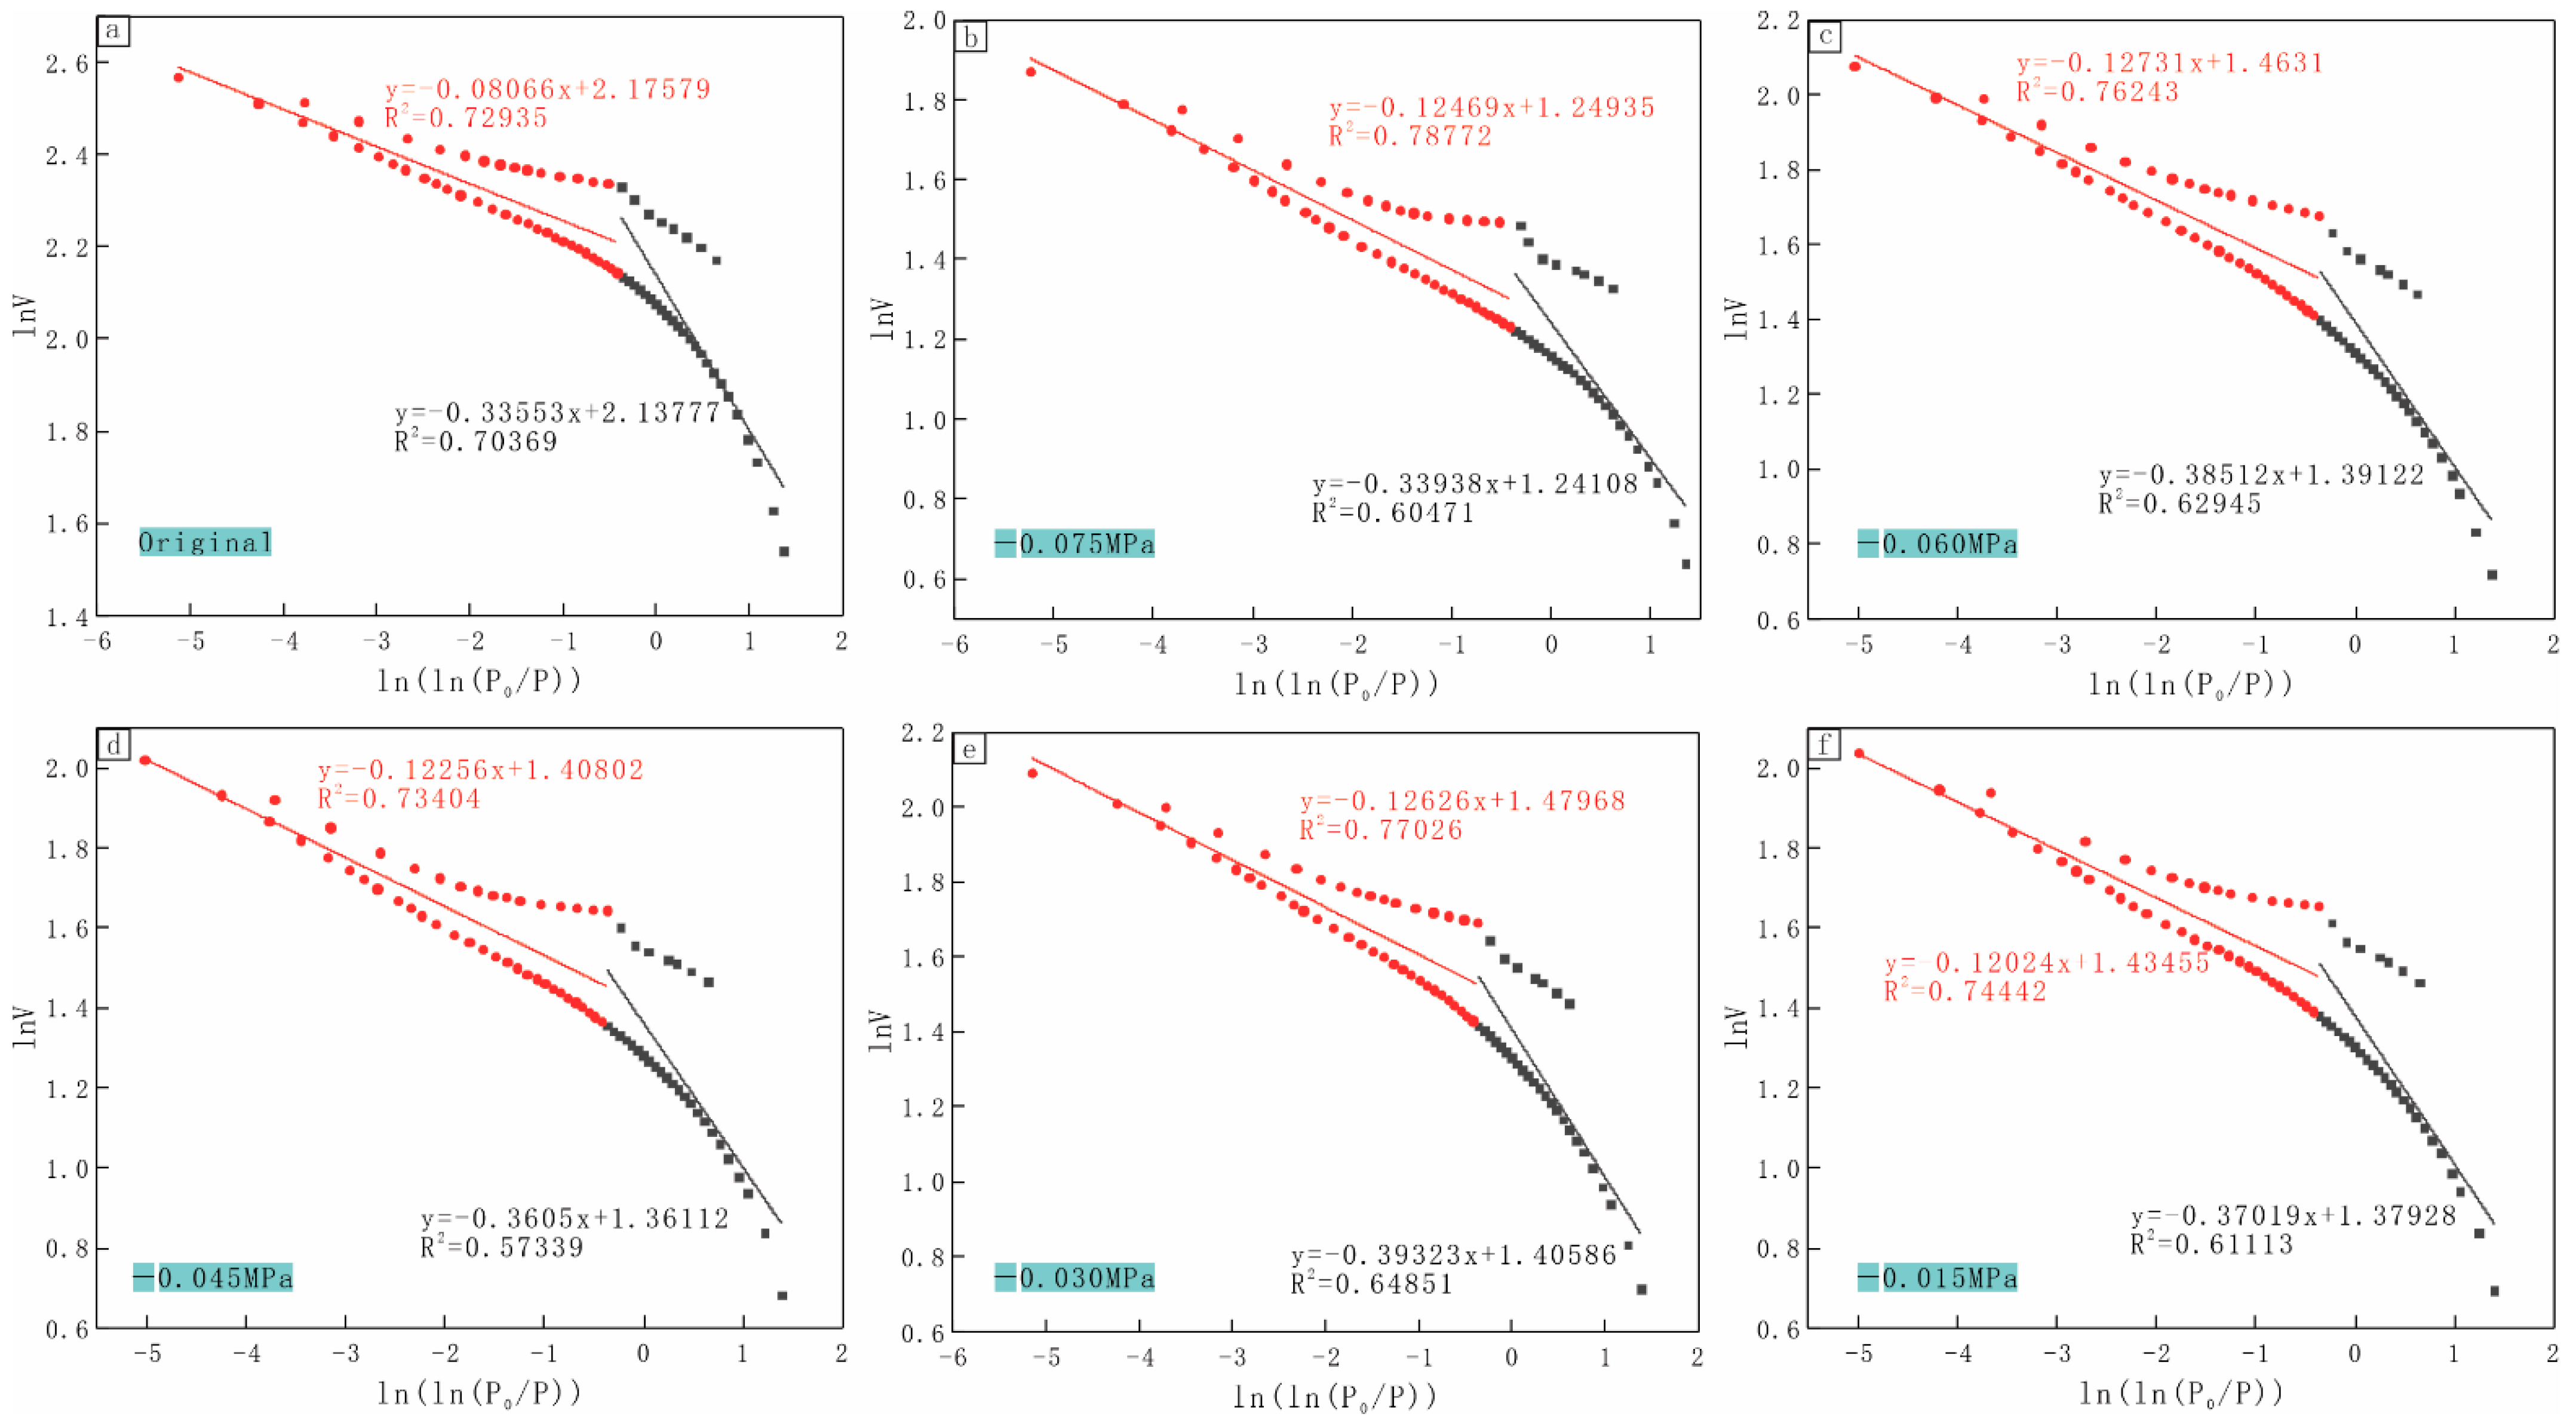
4.4.1. Fractal Theory and the Model of Adsorption Pores of Low-Rank Coal

The development characteristics of the adsorption pores of the low-rank coal were quantitatively characterized in this study using a low-temperature nitrogen adsorption–desorption experiment, and the fractal characteristics of the adsorption pores of the low-rank coal were analyzed using data from the adsorption process such as relative pressure (P/P0) and adsorption capacity (V). To compute the fractal dimension (D) of coal reservoir adsorption pores, previous researchers [25,26] generally used the Frenkel–Halsey–Hill (FHH) model. The double logarithm equation is then used to fit the data on the relative pressure and adsorption capacity into the nitrogen adsorption process, resulting in the fractal dimension of the adsorption pore of low-rank coal. The following is the mathematical expression:
lnV = α [ ln ( ln ( P 0 P ) ) ] + C ,
where V is the molecular volume of adsorbed gas under equilibrium pressure (P), cm3/g; P0 is the gas saturation pressure, MPa; C is a constant; α is the slope of the linear fitting of LnV and ln (Ln (P0/P)).
Using the slope, α, to calculate the fractal dimension, D, of adsorption pores, Liu Dameng [27] and others studied the fractal dimension of adsorption pores according to a large number of coal reservoir samples from China’s main coal-bearing basins. It was found that the fractal dimension calculated using Equation (2) was between 2.0 and 3.0, which is in line with the definition of the fractal dimension of pore surfaces and pore structures of coal reservoirs. In this study, Equation (2) was used to calculate the fractal dimension of adsorption holes in low-rank coal reservoirs.
D = α + 3 ,

4.4.2. Fractal Characteristics of Adsorption Pores of Low-Rank Coal

The adsorption lag phenomena of adsorption and desorption curves emerge when the fractal dimension is calculated using the adsorption–desorption curve of low-temperature nitrogen. At different pressure stages (P/P0), the adsorption properties of the low-rank coal samples compared to gas change. Gas adsorption occurs mostly in micropores in the low-pressure region (P/P0 < 0.5), and capillary condensation occurs primarily in the high-pressure section (P/P0 > 0.5). To characterize the different adsorption characteristics of the low-rank coal samples, we used the relative pressure of 0.5 as the boundary when calculating the fractal dimension with low-temperature nitrogen adsorption data. The data on the relative pressure and the adsorption capacity of the low-pressure section (P/P0 < 0.5) and high-pressure section (P/P0 > 0.5) were fitted. The investigation revealed that the impact of fitting the data of the two relative pressure sections (i.e., P/P0 < 0.5 and P/P0 > 0.5) was good as illustrated in Figure 6. At the relative pressure sections of P/P0 < 0.5 and P/P0 > 0.5, there existed two separate fractal dimensions, D1 and D2, which corresponded to fractal dimensions D1 and D2.
The fractal dimensions D1 and D2 of the two relative pressure sections with P/P0 < 0.5 and P/P0 > 0.5, respectively, were determined using Equation (2) (Table 4). The low relative pressure section’s fractal dimension D1 was relatively small, ranging from 2.60677 to 2.66447 (R2 > 0.57339), but the high relative pressure section’s fractal dimension D2 was relatively large, ranging from 2.87269 to 2.91934 (R2 > 0.72935). The fractal dimensions D1 and D2 represent two different fractal properties of the low-rank coal samples’ pore structures and reflect the diverse characteristics of the adsorption pores. The force between the gas molecules and the coal samples was a van der Waals force in the low relative pressure section (P/P0 < 0.5), where D1 reflects the roughness of the coal sample’s pore surface and is the surface fractal dimension; in the high relative pressure section, gas adsorption was primarily capillary condensation. Adsorption is primarily influenced by the pore structure, which is the structure’s fractal dimension. The complicated characteristics of the development of the pore structures of coal in the samples are reflected in D2.

4.5. NMR Pore Characteristics

The test principle of low-field NMR technology is mainly to obtain the distribution and connectivity of pores and fissures with different sizes in coal samples by measuring the T2 relaxation time of fluid in coal and rock pores [15,28]. The T2 transverse relaxation characteristic formula is as follows:
1 T 2 ρ 2 ( S V ) = Fs ( ρ 2 r ) ,
where T2 is the transverse relaxation time, ms; S is the pore surface area, nm2; V is the pore volume, nm3; ρ2 is the transverse surface relaxation coefficient (nm/ms); R is the pore radius, nm; FS is the shape factor with a columnar pore of FS = 2 and spherical pore of FS = 3. Equation (3) can be simplified as rc = CT2 (where C = Fs ρ2, called the conversion coefficient).
According to Equation (3), there was a corresponding relationship between the pore radius, r, and the transverse relaxation time. The larger the T2 value, the larger the pore radius characterized by the low-rank coal samples. According to Xoдoт, based on the pore size classification scheme [20], the critical value of the T2 signal distribution and pore size distribution is that T2 < 2.5 ms represents a microporous–microporous (i.e., transition pore) section (P1 peak in the T2 distribution diagram); 2.5 ms < T2 < 100 ms represents a mesoporous section (P2 peak in the T2 distribution diagram); T2 > 100 ms represents macropore and fracture sections (P3 peak in the T2 distribution diagram) [15,29].

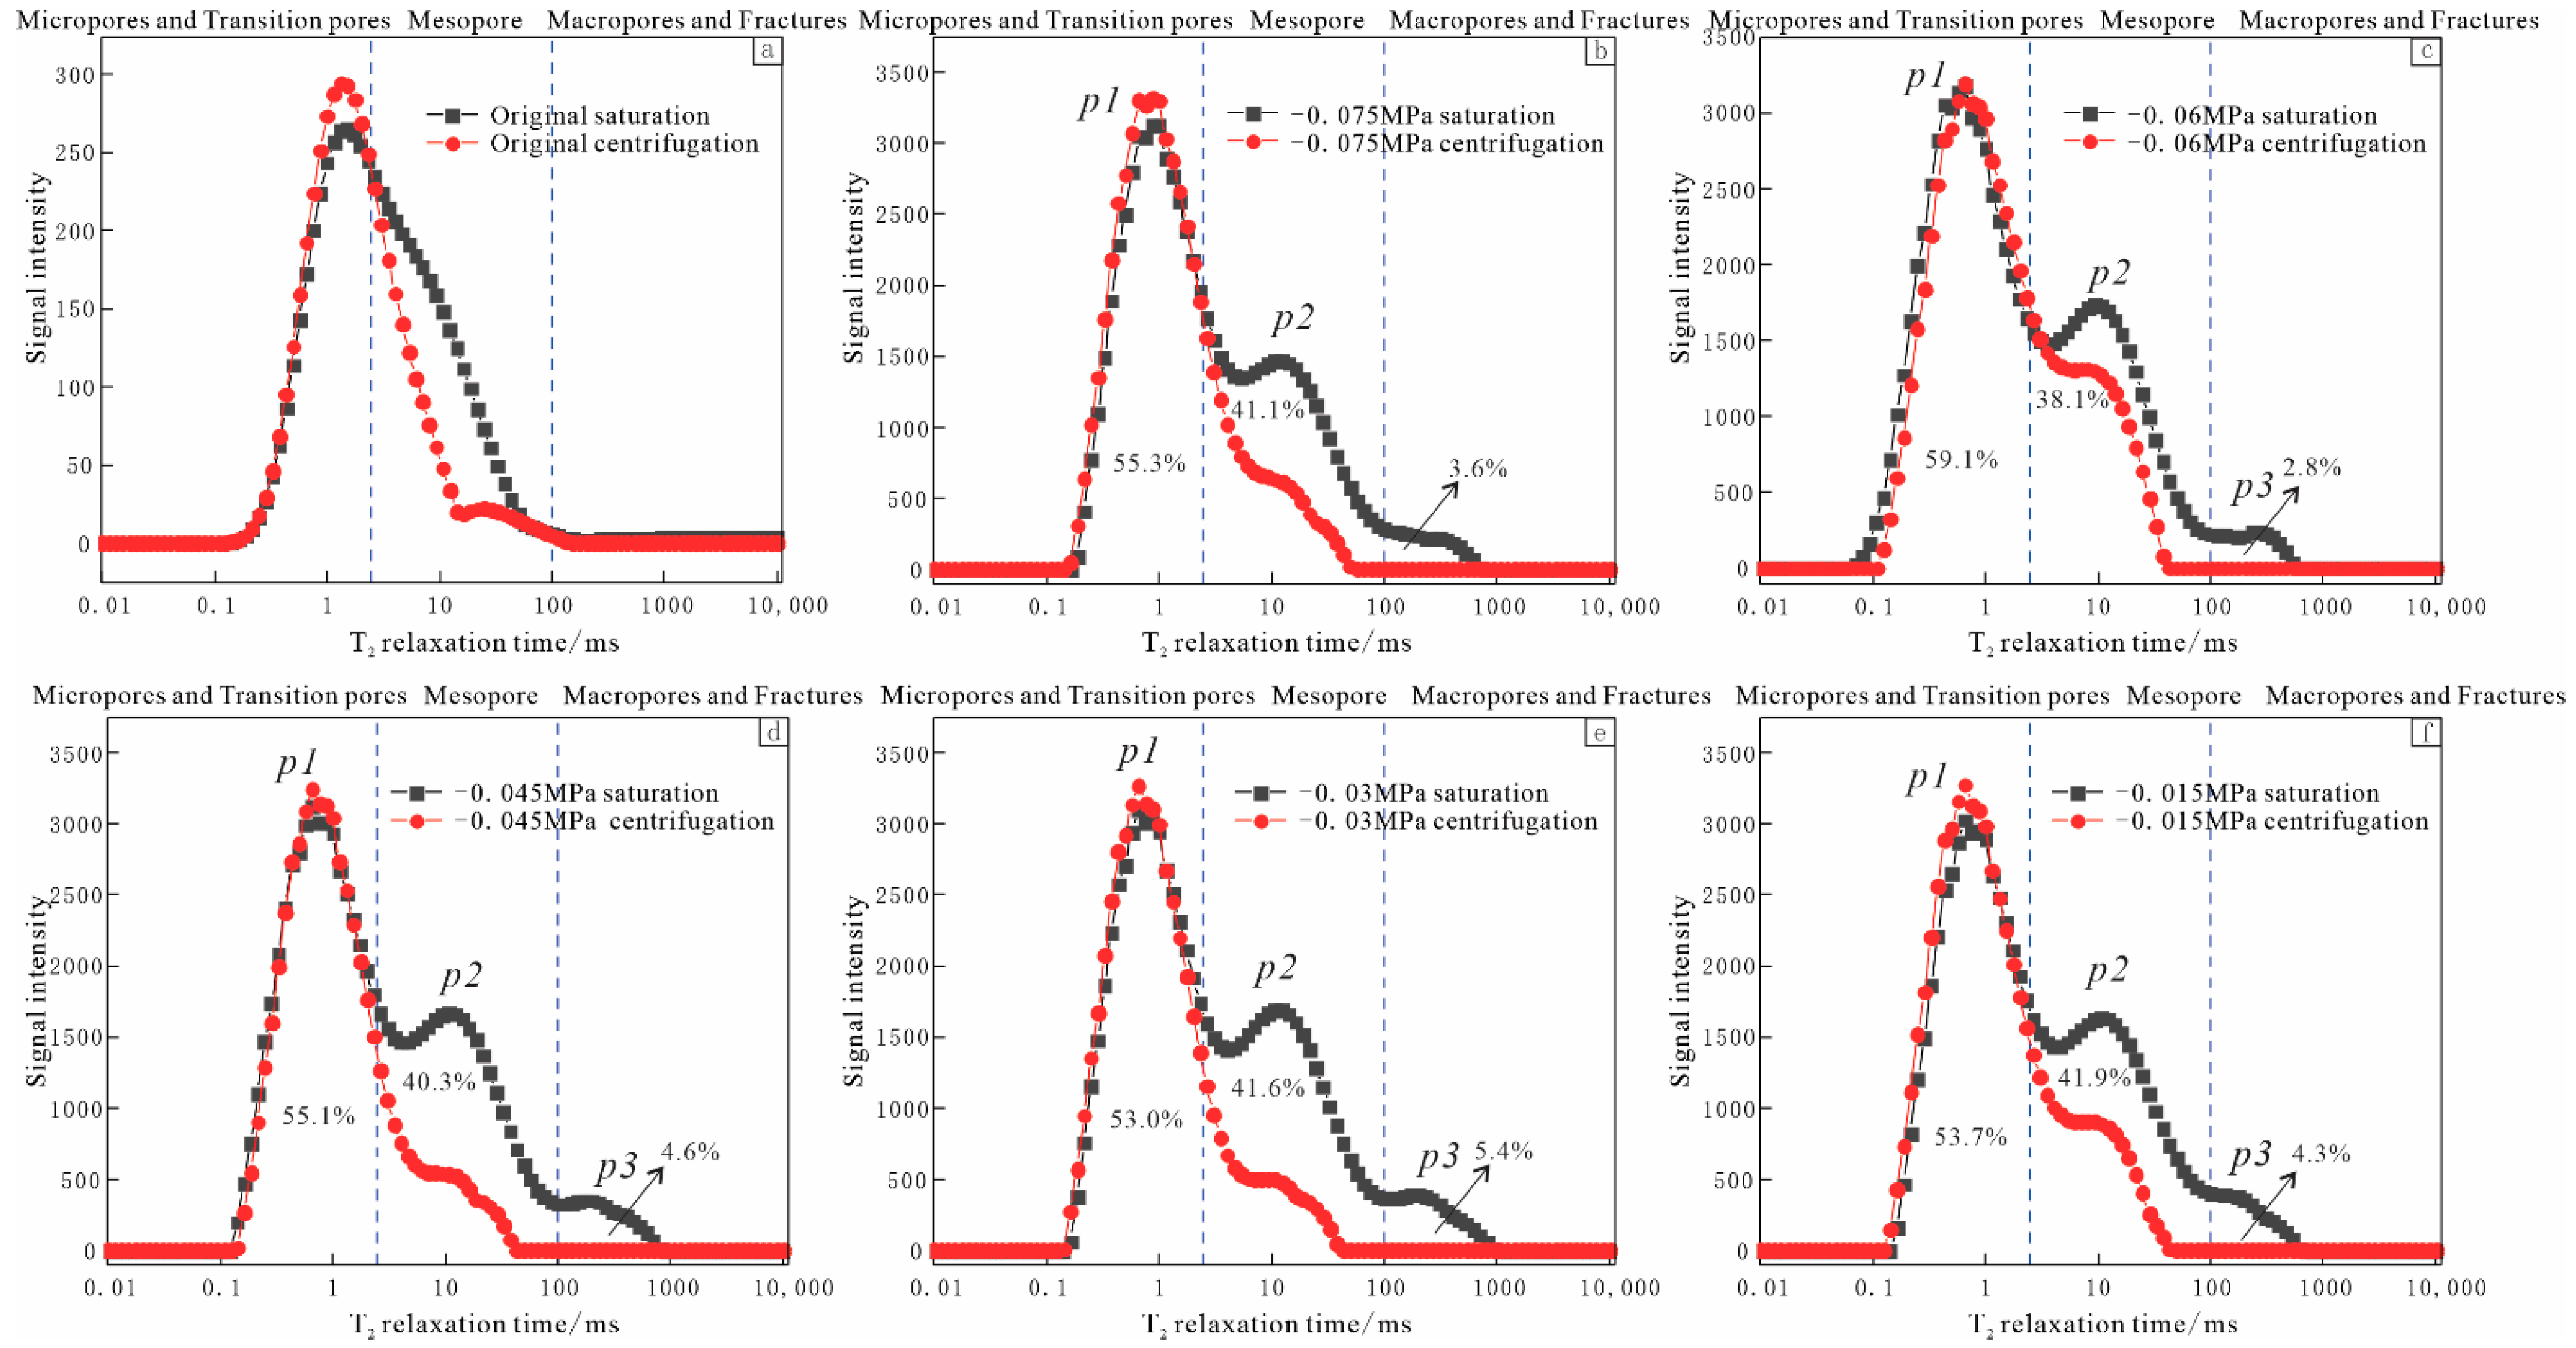
4.5.1. Fracture Characteristics of NMR Pores under Different Negative Pressure Treatment Conditions

A low-field NMR experiment was used to obtain the T2 relaxation time spectrum of the low-rank coal samples from the study area (Figure 7). The distribution features of the T2 spectrum peaks of low-rank coal were distinct, as shown in the Picture. The T2 spectrum of the coal sample revealed a bimodal distribution (Figure 7a) without negative pressure treatment, in which the signal strength of P1 peak is much bigger than that of P2 peak, and there is no signal display in the T2 > 100 ms area. The T2 spectrum peak was mainly distributed in a three-peak structure after the coal sample was processed by a negative pressure method. The fluid signals in the micropores, medium pores, big pores, and fractures were represented by the spectrum peaks P1, P2, and P3, which spread from left to right at 0.1~2.5 ms, approximately 10 ms, and a T2 higher than 100 ms, respectively. The low-rank coal samples had a three-peak T2 spectrum, with the P1 peak signal being the highest, the P2 peak signal being the second, and the P3 peak signal being the weakest (Figure 7). The percentages of the T2 spectral area of the signal segments corresponding to 0.1–2.5 ms, 2.5–100 ms, and >100 ms in the total T2 spectral area were SP1 > SP2 > SP3, indicating that the development degree of micropores and small pores (transition pores) of the low-rank coal samples from the study area was best, followed by medium pores, and the development degree of large pores and fractures was the worst.

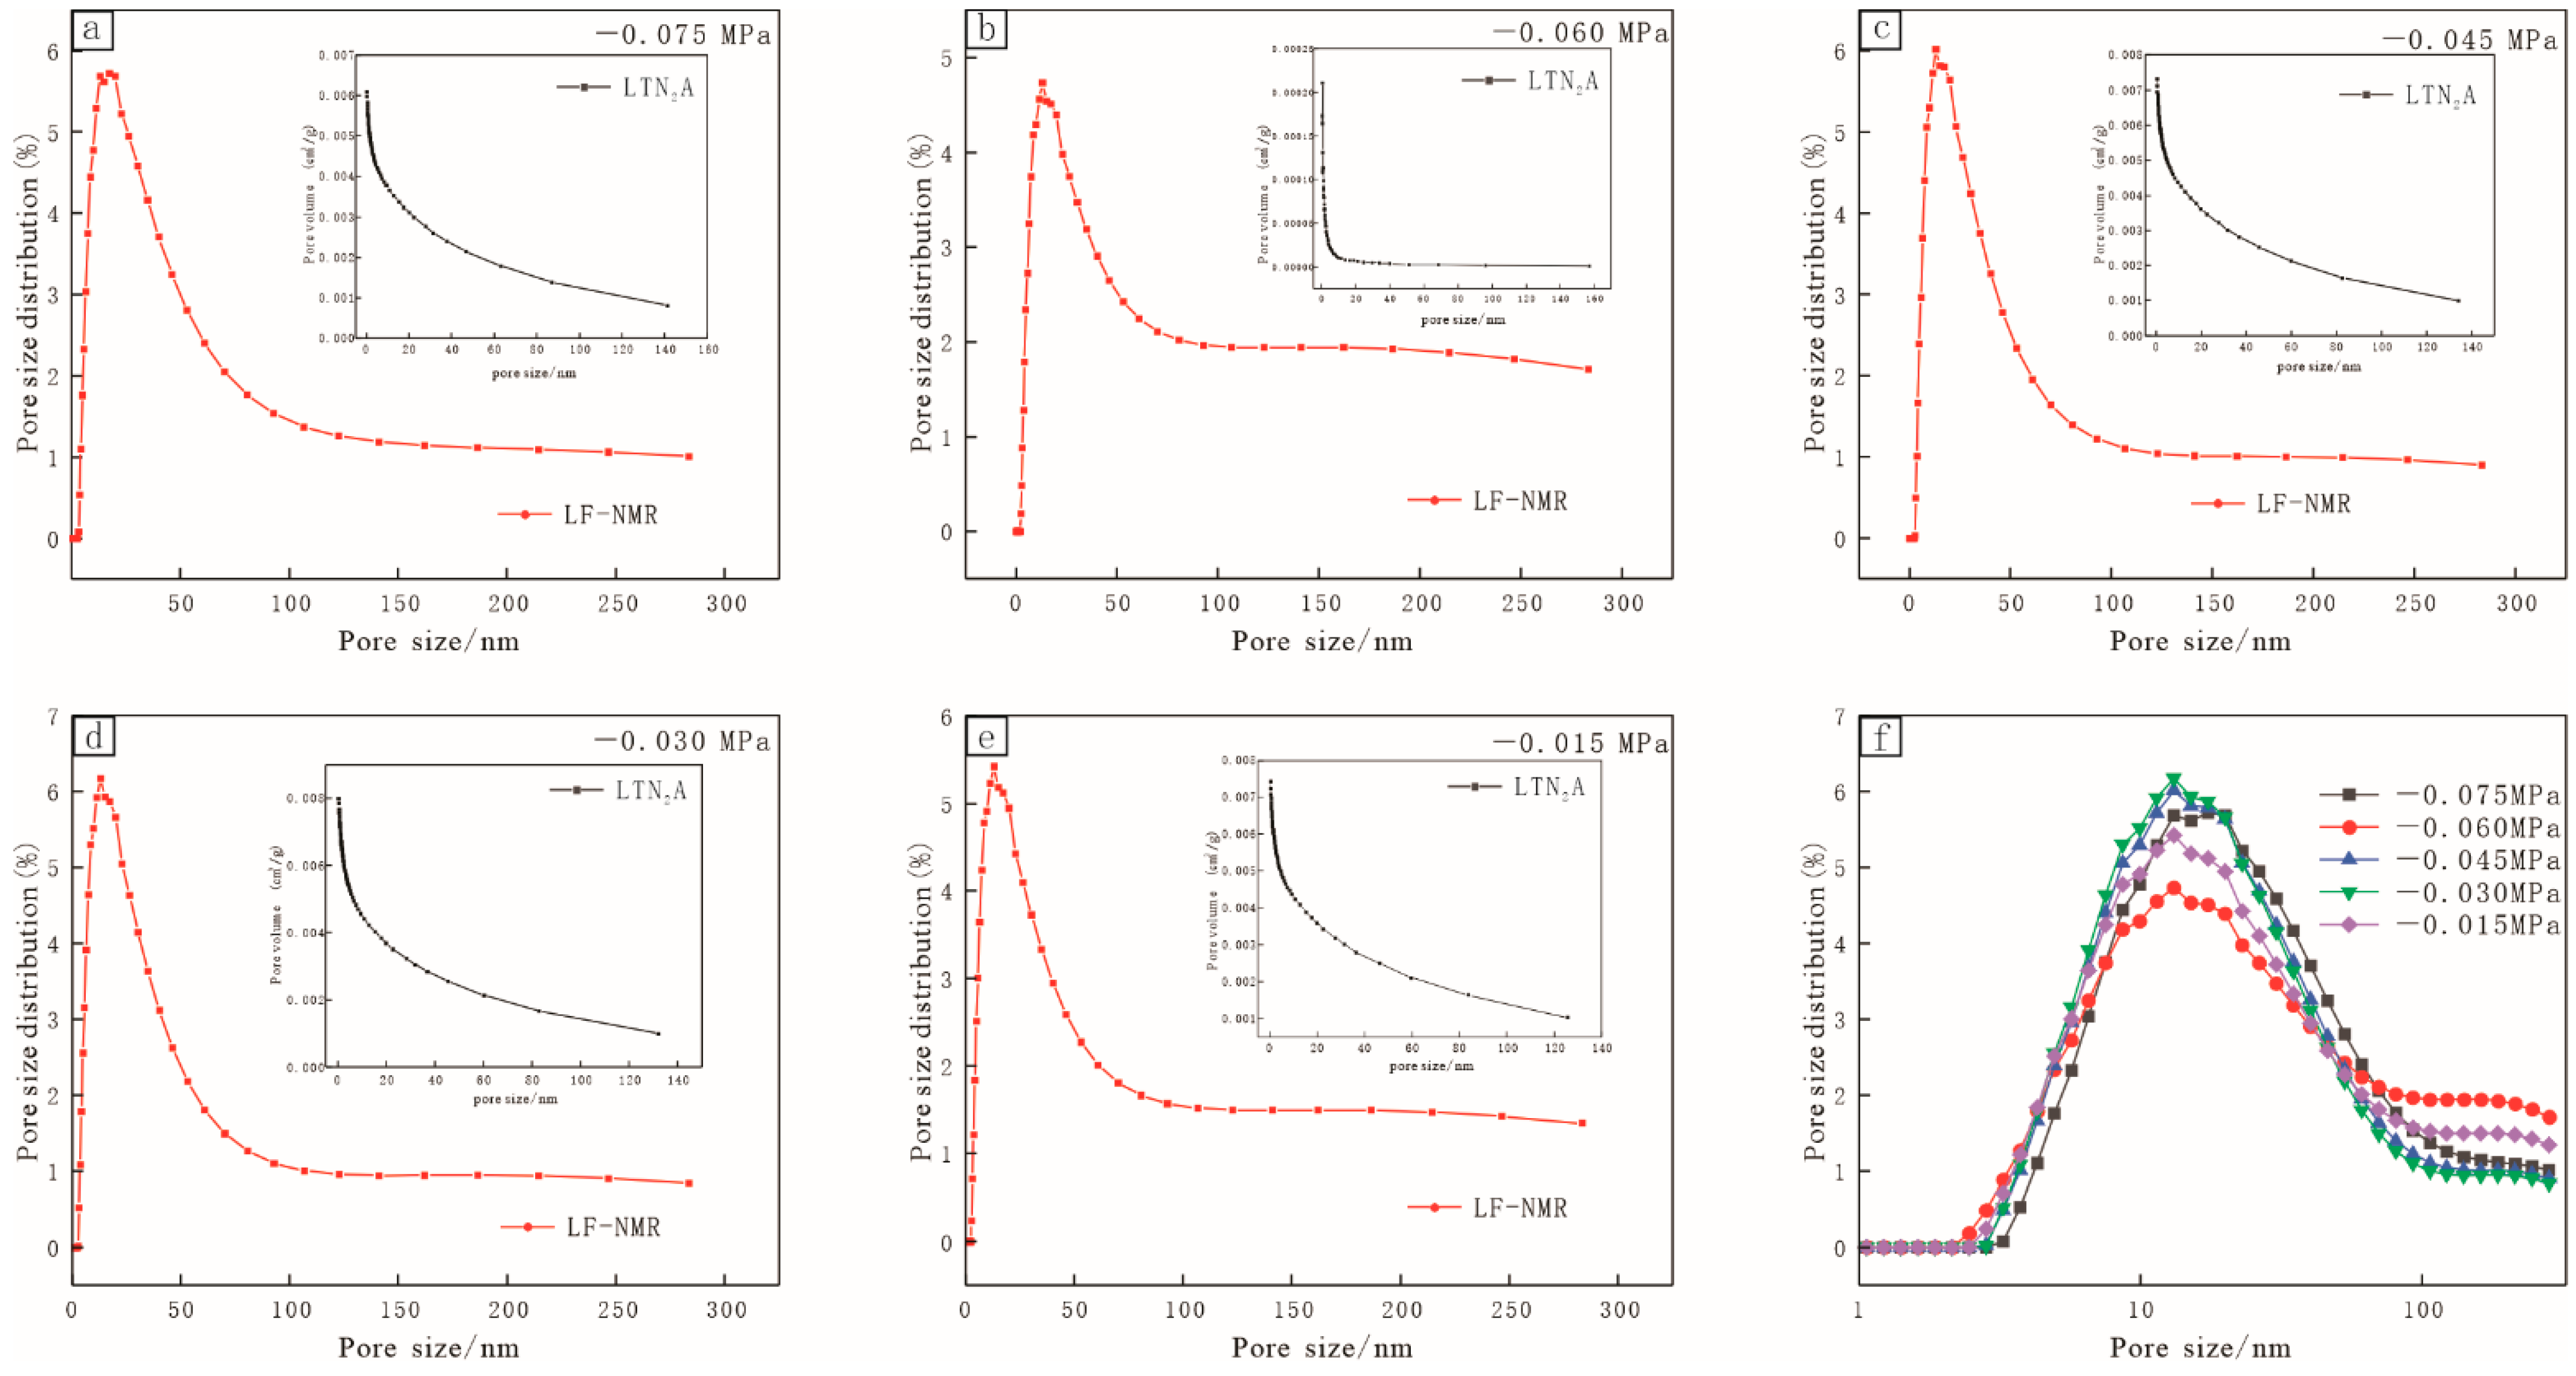
4.5.2. Pore Size Distribution Characteristics of Micropores and Small Pores

The results of the low-temperature nitrogen adsorption experiment show that the pores of the low-rank coal samples from the study area were primarily adsorption pores; the T2 relaxation time spectrum of the low-rank coal samples in a water-saturated state (Figure 7) shows that the low-rank coal samples from the study area primarily developed with micropores and small pores. The relaxation duration of the adsorption peak of the low-rank coal samples was determined using the single-component inversion approach to obtain the pore size distribution features of the micropores and small pores. Equation (3) was used to calculate the surface relaxation rate of the low-rank coal samples based on the surface area and pore volume data received from the low-temperature nitrogen adsorption experiment (Table 5).
Table 5 shows that the adsorption peak relaxation times of the low-rank coal samples from the research area ranged between 3.458 and 5.174 ms with a peak at 4.0672 ms. With an average of 2.6128 × 10⁻⁸ m/ms, the surface relaxation rate was 1.9258 × 10⁻⁸–3.0891 × 10⁻⁸ m/ms. The surface relaxation rate of coal samples is related to the coal rank, according to earlier studies [30,31]. The surface relaxation rate of middle- and low-rank coal samples is generally much higher than that of high-rank coal samples. The intricacy of the pore structure and pore types in coal samples are the key reasons behind this. Low-rank coal has a high number of micropores, a complex pore structure, and developed pore shapes that are predominantly “ink bottle” pores, resulting in a high surface relaxation rate.
The pore geometry of the low-rank coal samples was assumed to be spherical with FS = 3. Micropores and some mesopores (0–300 nm) predominated. The surface relaxation rate of the low-rank coal can be used to calculate the conversion coefficient, C, value of the coal sample, according to Equation (3). The correlation transformation between the pore size of the low-rank coal sample in the research region and relaxation time T2 was produced, because the C value of the low-rank coal sample in the research area was 7.8384 × 10⁻⁸ m/ms. The C value was used to convert the T2 relaxation time of the five coal samples treated with varied negative pressures into sample pore size, and a pore size distribution graphic was created. The results of the pore size distribution diagram were compared to the pore size obtained from the low-temperature nitrogen adsorption experiment as shown in Figure 8. In the micropore size segment, the pore size distribution of T2 relaxation time conversion in NMR matched the pore size distribution of low-temperature nitrogen adsorption (BJH technique). In addition, as shown in Figure 8, the proportion of the different pore diameters of the low-rank coal samples in the research area at various negative pressures was statistically displayed (f).

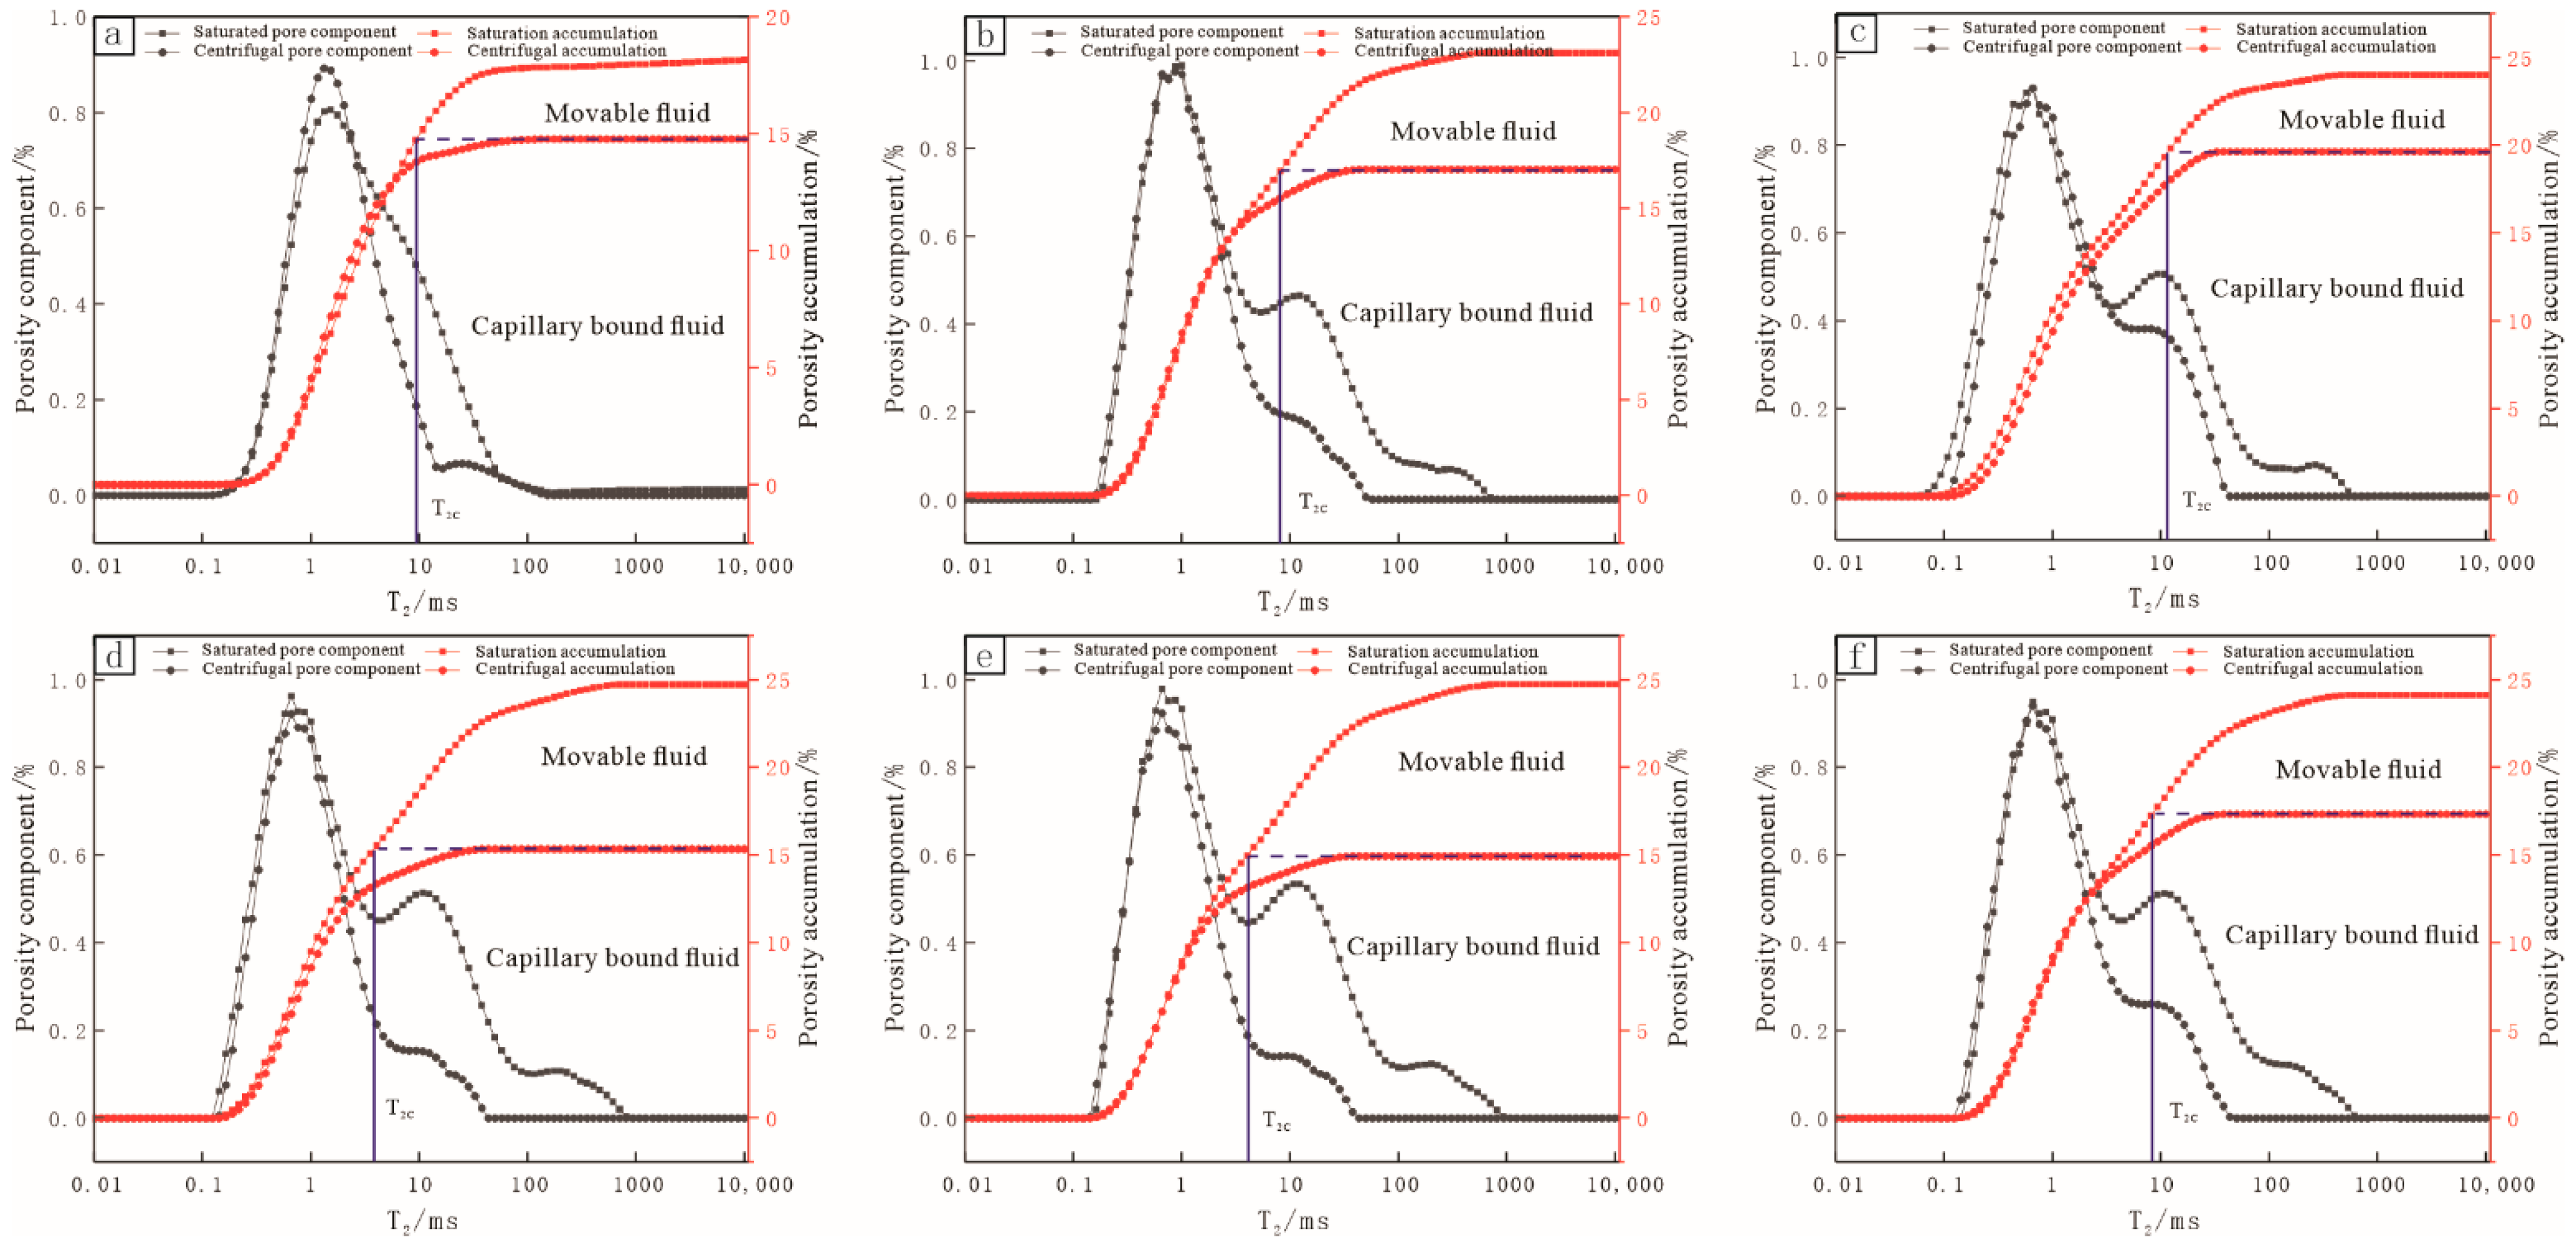
4.5.3. Effective Porosity

The fluid distribution in the pores of the low-rank coal samples from the research area was determined, NMR measurements were conducted after completion of the water saturation and centrifugation of the coal samples, and the T2 spectrum distribution of the water-saturated and centrifugal coal samples was obtained. Finally, the porosity of the material was determined. Figure 9 depicts the experimental outcomes. The porosity of moveable fluid is referred to as the effective porosity of low-rank coal. According to previous research [30,31,32,33], NMR technology can estimate the effective porosity value, and there is a T2C cut-off value that can be used to discriminate between free and bound fluid in the pores as well as to compute the saturation of both mobile and bound fluid.
The determination method for the T2C value was as follows: The T cumulative porosity curves of the low-rank coal samples before (saturated) and after centrifugation were made according to the nuclear magnetic resonance data; then, the maximum position of the cumulative porosity curve after centrifugation was found, a straight line parallel to the x-axis was drawn, and the intersect of the (saturated) cumulative porosity curve before centrifugation at a point were found [33]. Finally, a straight line perpendicular to the x-axis from this point was drawn, and the intersection at one point is T2C.
The effective porosity [32] is the difference between the maximum porosity before and after centrifugation, and the irreducible porosity is the value represented by the cumulative porosity curve after centrifugation. In low-rank coal, the calculation model formula for moveable fluid saturation and irreducible fluid saturation is as follows:
BVI = Tmin T 2 c S ( T 2 ) dT 2 / Tmin Tmax S ( T 2 ) dT 2 ,
FFI = 1 BVI ,
where BVI is the irreducible fluid saturation, %; FFI is the movable fluid saturation, %; Tmin is the minimum value of T2, ms; Tmax is the maximum value of T2, ms; S (T2) is the T2 spectrum distribution curve.
Thus, T2C, effective porosity, and bound porosity were obtained using the cumulative porosity curve of the low-rank coal samples before and after centrifugation. The calculation results are shown in Table 6.
It can be seen from the table that the nuclear magnetic resonance T2C values of the low-rank coal samples were between 6.136 and 14.175 ms, and the T2C values of the coal samples were the largest when the pressure was −0.075/−0.015 MPa, which was 14.175 ms. The magnetic porosity of the low-rank coal core was 18.166%~24.743%, with an average of 23.1505%. The effective porosity was 3.385%~9.797%, and the average value was 6.633%. The bound porosities were 14.781%~19.647% with an average of 16.517%. The average effective void ratio was 28.133%. At the research location, the effective porosity of the low-rank coal samples was low. The fundamental reason for this is that low-rank coal pores and fractures comparatively developed, primarily by micropores, and the porosity component of the moveable fluid was low, which is consistent with pore size distribution data represented in the nuclear magnetic resonance T2 relaxation time spectrum (Figure 7). As a result, one of the indexes for evaluating the physical properties of low-rank coal reserves is effective porosity.

5. Conclusions

(1)
The vitrinite content of the low-rank coal from the study area was higher than that of inertinite; the minerals in the coal samples were mostly clay and carbonate minerals with a high organic matter content;
(2)
According to the observation of the SEM, the pores and fissures of the low-rank coal samples from the study area developed mainly as nanoscale pores and dissolution pores. At the same time, there were also micron cracks. After negative pressure treatment, the dissolution of the pores and fissures was strong;
(3)
According to the low-temperature nitrogen adsorption experiment, the adsorption–desorption curves of the low-rank coal samples from the study area was the H2 type, and the lag ring and inflection point were obvious, the pores were mainly “ink bottle pores”, and micropores and pores were developed. The adsorption mechanisms of the low-rank coal samples at different pressure sections were different. The fractal dimension D1 of the low-pressure section (P/P0 < 0.5) was the surface fractal dimension, and the fractal dimension D2 of the high-pressure section (P/P0 > 0.5) was the structural fractal dimension. The structural fractal dimension D2 of the low-rank coal samples from the study area was relatively large, and the pore structure of the coal samples was complex;
(4)
The T2 spectral peak of the NMR transverse relaxation time of the low-rank coal from the research area was of three peak types. The T2 value spectral peaks corresponding to the three peaks were distributed at 0.1~2.5 ms, approximately 10 ms, and a T2 greater than 100 ms, respectively, and the area of the T2 spectral peak corresponding to the signal section accounted for the largest proportion. Therefore, the development of the pore diameter was mainly micropores, accompanied by the development of medium and large pores and fractures;
(5)
The surface relaxation rate of the low-rank coal was approximately 2.6128 × 10⁻⁸ m/ms. The conversion coefficient, C, of a coal sample was obtained from the surface coal relaxation rate of low-rank coal, which was 7.8384 × 10⁻⁸ m/ms, and then the pore size structure of the micropores in the low-rank coal was finely characterized. According to the cumulative porosity curve, the T2C cut-off value was 6.136~14.175 ms, and the effective porosity was 3.385%~9.797%. It was found that the effective porosity was low.
(6)
With the increase in degassing pressure, the changes in the pore volume, pore specific surface area, and pore diameter of the low-rank coal were closely related to the collapse of micropores and small pores in the coal rock under different degassing pressures.

Author Contributions

Conceptualization, Y.M. and M.W.; methodology, Y.M. and X.D.; software, Y.M.; validation, Y.M., M.W. and X.D.; formal analysis, Y.M.; investigation, Y.M. and Y.H.; resources, Y.M.; data curation, Y.M.; writing—original draft preparation, Y.M.; writing—review and editing, Y.M.; visualization, Y.M.; supervision, Y.M.; project administration, M.W.; funding acquisition, M.W. and X.Z. All authors have read and agreed to the published version of the manuscript.

Funding

This research was funded by the Fundamental Research Funds for the Central Universities (No. 2020ZDPYMS09) and the NSFC-Xinjiang Joint Fund (No. U1903209).

Informed Consent Statement

Informed consent was obtained from all subjects involved in the study. Informed consent was obtained from all subjects involved in the study.

Data Availability Statement

Not applicable.

Acknowledgments

The authors are sincerely thankful for the Fundamental Research Funds for the Central Universities (No. 2020ZDPYMS09).

Conflicts of Interest

The authors declare no conflict of interest.

References

  1. Li, Y.; Cao, D.Y.; Wei, Y.C. Middle to low-rank coalbed methane accumulation and reservoiring in the southern margin of Junggar Basin. Acta Pharm. Sin. 2016, 37, 1472–1482. [Google Scholar]
  2. Fu, H.J.; Tang, D.Z.; Pan, Z.J. A study of hydrogeology and its effect on coalbed methane enrichment in the southern Junggar Basin, China. AAPG Bull. 2018, 103, 189–213. [Google Scholar] [CrossRef]
  3. Kang, J.Q.; Fu, X.H.; Gao, L. Production profile characteristics of large dip angle coal reservoir and its impact on coalbed methane production: A case study on the Fukang west block, southern Junggar Basin, China. J. Pet. Sci. Eng. 2018, 171, 99–114. [Google Scholar] [CrossRef]
  4. Fu, H.J.; Tang, D.Z.; Xu, T. Preliminary research on CBM enrichment models of low-rank coal and its geological controls: A case study in the middle of the southern Junggar Basin, NW China. Mar. Pet. Geol. 2017, 83, 97–110. [Google Scholar] [CrossRef]
  5. Fu, H.J.; Tang, D.Z.; Xu, T. Characteristics of pore structure and fractal dimension of low-rank coal: A case study of Lower Jurassic Xishanyao coal in the southern Junggar Basin, NW China. Fuel 2017, 193, 254–264. [Google Scholar] [CrossRef]
  6. Zhou, S.D.; Liu, D.M.; Yao, Y.B. Fractal characterization of pore–fracture in low-rank coals using a low-field NMR relaxation method. Fuel 2016, 181, 218–226. [Google Scholar] [CrossRef]
  7. Zhou, S.D.; Liu, D.M.; Cai, Y.D. Multi-scale fractal characterizations of lignite, subbituminous and high-volatile bituminous coals pores by mercury intrusion porosimetry. J. Nat. Gas Sci. Eng. 2017, 44, 338–350. [Google Scholar] [CrossRef]
  8. Wang, Z.Z.; Pan, J.N.; Hou, Q.L. Anisotropic characteristics of low-rank coal fractures in the Fukang mining area, China. Fuel 2018, 211, 182–193. [Google Scholar] [CrossRef]
  9. Li, X.; Fu, X.H.; Liu, A.H. Methane adsorption characteristics and adsorbed gas content of low-rank coal in China. Energy Fuels 2016, 30, 3840–3848. [Google Scholar] [CrossRef]
  10. Yang, M.; Bi, J.C. Influence of extreme temperature on the pore and fracture development of high-rank coal. Adv. Civ. Eng. 2018, 2018, 4529751. [Google Scholar] [CrossRef]
  11. Yang, M.; Bi, J.C. Low-field NMR ecological research on the effects of confining pressure changes on pore fissurecharacteristics of high-rank coal. Ekoloji 2018, 106, 817–825. [Google Scholar]
  12. Yao, Y.B.; Liu, J.; Liu, D.M. A new application of NMR in characterization of multiphase methane andadsorption capacity of shale. Int. J. Coal Geol. 2019, 201, 76–85. [Google Scholar] [CrossRef]
  13. Ridvan, A.; Nazareth, T.P.; Jay, V.H. Nmr Logging of Natural Gas Reservoirs; 6094048[P]. 2000-07-25; OnePetro: Richardson, TX, USA, 2000. [Google Scholar]
  14. Wang, C.X.; Zhang, X.B.; Lu, F.C. Study on coal cracking under liquid nitrogen soaking based onnuclear magnetic resonance and stress analysis. China Saf. Sci. J. 2019, 29, 156–163. [Google Scholar]
  15. Yao, Y.B.; Liu, D.M.; Yao, C. Petrophysical characterization of coals by low-field nuclear magneticresonance (NMR). Fuel 2010, 89, 1371–1380. [Google Scholar] [CrossRef]
  16. Xu, K.N. Study on the Accumulation of Multi-Energy Resources in Jurassic in the Southern Margin of Junggar Basin; Library of China University of Geosciences: Beijing, China, 2017. [Google Scholar]
  17. Li, B.L.; Guan, S.W.; Chen, Z.X. Theory and Application of Fault Related Folds; Petroleum Industry Press: Beijing, China, 2010; pp. 111–119. [Google Scholar]
  18. Ou, C.H.; Li, C.C.; Zhi, D.M. Coupling accumulation model with gas-bearing features to evaluate low-rank coalbed methane resource potential in the southern Junggar Basin, China. AAPG Bull. 2018, 102, 153–174. [Google Scholar] [CrossRef]
  19. Li, Z.W. Study on Microstructure Characteristics of Low-Rank Coal and Its Control Mechanism on Gas Adsorption/Desorption; China University of Mining and Technology: Xuzhou, China, 2015. [Google Scholar]
  20. Xoдoт, B.B. Coal and Gas Outburst (Chinese Translated Version); China Industry Press: Beijing, China, 1966; pp. 27–28. [Google Scholar]
  21. Zhang, H. Genetical type of proes in coal reservoir and its research significance. J. China Coal Soc. 2001, 26, 40–44. [Google Scholar]
  22. Li, T.; Wang, H.C. Pore structure characteristics of low-rank coal under various degassing temperatures: A case study of lignite from Xishanyao Formation, Turpan-Hami Basin, Xinjiang. J. China Coal Soc. 2021, 46, 414–422. [Google Scholar]
  23. Everett, D.H.; Koopal, L.K. International union of pure and applied chemistry. Polymer 2001, 31, 1598. [Google Scholar]
  24. Xie, W.D.; Wang, M.; Dai, X.G. Microscopic characteristics of shale gas reservoirs in middle and southern coal measures of Hedong Coalfield, Shanxi Province. Nat. Gas Geosci. 2019, 30, 512–525. [Google Scholar]
  25. Yao, Y.B.; Liu, D.M.; Tang, D.Z. Fractal characterization of adsorption-pores of coals from North China: An investigation on CH4 adsorption capacity of coals. Int. J. Coal Geol. 2008, 73, 27–42. [Google Scholar] [CrossRef]
  26. Zhang, S.H.; Tang, S.H.; Tang, D.Z. Determining fractal dimensions of coal pores by FHH model: Problems and effects. J. Nat. Gas Sci. Eng. 2014, 21, 929–939. [Google Scholar] [CrossRef]
  27. Yao, Y.B.; Liu, D.M. Fine Quantitative Characterization and Comprehensive Evaluation Model of Coal Reservoir; Geological Publishing House: Beijing, China, 2013. [Google Scholar]
  28. Yao, Y.B.; Liu, D.M. Comparison of low-field NMR and mercury intrusion porosimetry in characterizing pore size distributions of coal. Fuel 2012, 95, 152–158. [Google Scholar] [CrossRef]
  29. Li, Y.; Tang, D.Z.; Xu, H. Experimental research on coal permeability: The roles of effective stress and gas slippage. J. Nat. Gas Sci. Eng. 2014, 21, 481–488. [Google Scholar] [CrossRef]
  30. Ren, H.K.; Wang, A.M.; Li, C.F. Study on porosity characteristics of low-rank coal reservoirs based on nuclear magnetic resonance technology. Coal Sci. Technol. 2017, 45, 143–148. [Google Scholar]
  31. Xie, S.B.; Yao, Y.B.; Chen, J.Y. Research of micropore structure in coal reservoir using low–field NMR. J. China Coal Soc. 2015, 40, 170–176. [Google Scholar]
  32. Yang, M.; Liu, L.; Zhang, X.B. Nuclear magnetic resonance experimental study on pore structure and fluid characteristics of coal at different ranks. China Saf. Sci. J. 2021, 31, 81–88. [Google Scholar]
  33. Yao, Y.B.; Liu, D.M.; Cai, Y.D. Advanced characterization of pores and fractures in coals by nuclear magnetic resonance and X-ray computed tomography. Sci. China Earth Sci. 2010, 53, 854–862. [Google Scholar] [CrossRef]
Figure 1. The southern boundary of Junggar basin’s structural outline map and sampling mine distribution map.
Energies 15 03691 g001
Figure 2. (ai) Characteristics of microporous fractures of low-rank coal from the study area under a scanning electron microscope.
Energies 15 03691 g002
Figure 3. Nitrogen adsorption–desorption curves of the low-rank coal under different negative pressure conditions.
Energies 15 03691 g003
Figure 4. Classification of the nitrogen adsorption–desorption curves and the corresponding pore types [23,24].
Energies 15 03691 g004
Figure 5. (ac) Dynamic changes in the characteristics of the pore structure parameters of the low-rank coal samples under different negative pressure conditions.
Energies 15 03691 g005
Figure 6. (af) Double logarithm curves of the low-temperature nitrogen adsorption volume and relative pressure of the low-rank coal samples from the study area under different negative pressure conditions.
Energies 15 03691 g006
Figure 7. (af) T2 relaxation time spectra of low-rank coal samples.
Energies 15 03691 g007
Figure 8. (af) Comparison of pore size distribution between NMR conversion and LT-N2A.
Energies 15 03691 g008
Figure 9. (af) Porosity component and cumulative porosity before and after centrifugation.
Energies 15 03691 g009
Table 1. Test results of low-rank coal samples.
Sample NameDepth (m)PositionRo, maxMacerals %Mineral Base %
%VitriniteInertiniteExiniteClaySulfideCarbonateOxidesOrganic
LHG735J2x0.6860.3535.903.744.540.201.971.3891.91
Table 2. Treatment conditions of negative pressure degassing.
Treatment Conditions/Coal Sample (Block)SEMLT-N2ALF-NMR
LHG original coal sample (without negative pressure treatment)111
Pressure (−0.015/−0.03/−0.045/−0.06/−0.075 MPa)555
During the negative pressure treatment of the samples, the following conditions were constant: 24 h, 125 °C and −0.08 Mpa.
Table 3. Experimental results of the LT-N2A on the low-rank coal samples under negative pressure.
Negative PressureBET Specific Surface AreaTotal Pore VolumeAverage Pore DiameterPore Volume of Each Pore Diameter Section (cm³/g)
(m2/g)(cm3/g)(nm)<10 nm10–100 nm>100 nm
−0.075 MPa10.09750.0060942.73780.0023180.0023960.001380
−0.060 MPa11.54720.0078202.68960.0033530.0034920.000974
−0.045 MPa11.28490.0073152.60960.0029400.0033800.000994
−0.030 MPa11.76480.0079842.64830.0034240.0035680.000993
−0.015 MPa11.43700.0074222.55500.0030510.0033390.001033
Table 4. Calculation results of the fractal dimensions of the adsorption pores based on the FHH fractal model.
Negative PressureRelative Pressure P/P0: 0~0.5Relative Pressure P/P0: 0.5~1.0
α1D1 = 3 + α1R2α2D2 = 3 + α2R2
Original−0.335532.664470.70369−0.080662.919340.72935
−0.075 MPa−0.339382.660620.60471−0.124692.875310.78772
−0.06 MPa−0.385122.614880.62945−0.127312.872690.76243
−0.045 MPa−0.36052.63950.57339−0.122562.877440.73404
−0.03 MPa−0.393232.606770.64851−0.126262.873740.77026
−0.015 MPa−0.370192.629810.61113−0.120242.879760.74442
Table 5. Calculation data of surface relaxation rate of the low-rank coal samples.
Negative PressuresAdsorption Peak Relaxation Time
(ms)
S
(m2/g)
V
(cm3/g)
ρ2
(10−8 m/ms)
−0.075 MPa5.17410.09750.0100611.9258
−0.06 MPa3.45811.54720.0123353.0891
−0.045 MPa3.91411.28490.0116902.6466
−0.03 MPa3.89511.76480.0125432.7372
−0.015 MPa3.89511.43700.0118732.6653
Table 6. Coal sample porosity based on the NMR-T2C method.
Negative PressuresTotal Porosity (%)T2C (ms)BVI (%)FFI (%)Effective Porosity (%)Bound Porosity (%)Effective Void Ratio (%)
(a) Original18.16610.72383.57216.4283.38514.78118.634
(b) −0.075 MPa23.11414.17579.30120.6996.06817.04626.252
(c) −0.060 MPa24.03712.32912.32987.6714.3919.64718.264
(d) −0.045 MPa24.7176.13668.40931.5919.37915.33837.946
(e) −0.030 MPa24.7437.05568.1631.849.79714.94639.595
(f) −0.015 MPa24.12614.17577.74722.2536.78117.34528.107
Publisher’s Note: MDPI stays neutral with regard to jurisdictional claims in published maps and institutional affiliations.

