
A New Approach to Energy Transition in Morocco for Low Carbon and Sustainable Industry (Case of Textile Sector)

Abstract
:1. Introduction
1.1. Literature Background
1.2. Moroccan National Industry Economic Programs and Climate Plan
- Strengthen climate governance;
- Build a resilience to climate risks;
- Converge to a low-carbon economy with an accelerated transition;
- Place territories in a climate dynamic;
- Build human, technological and financial capacity.
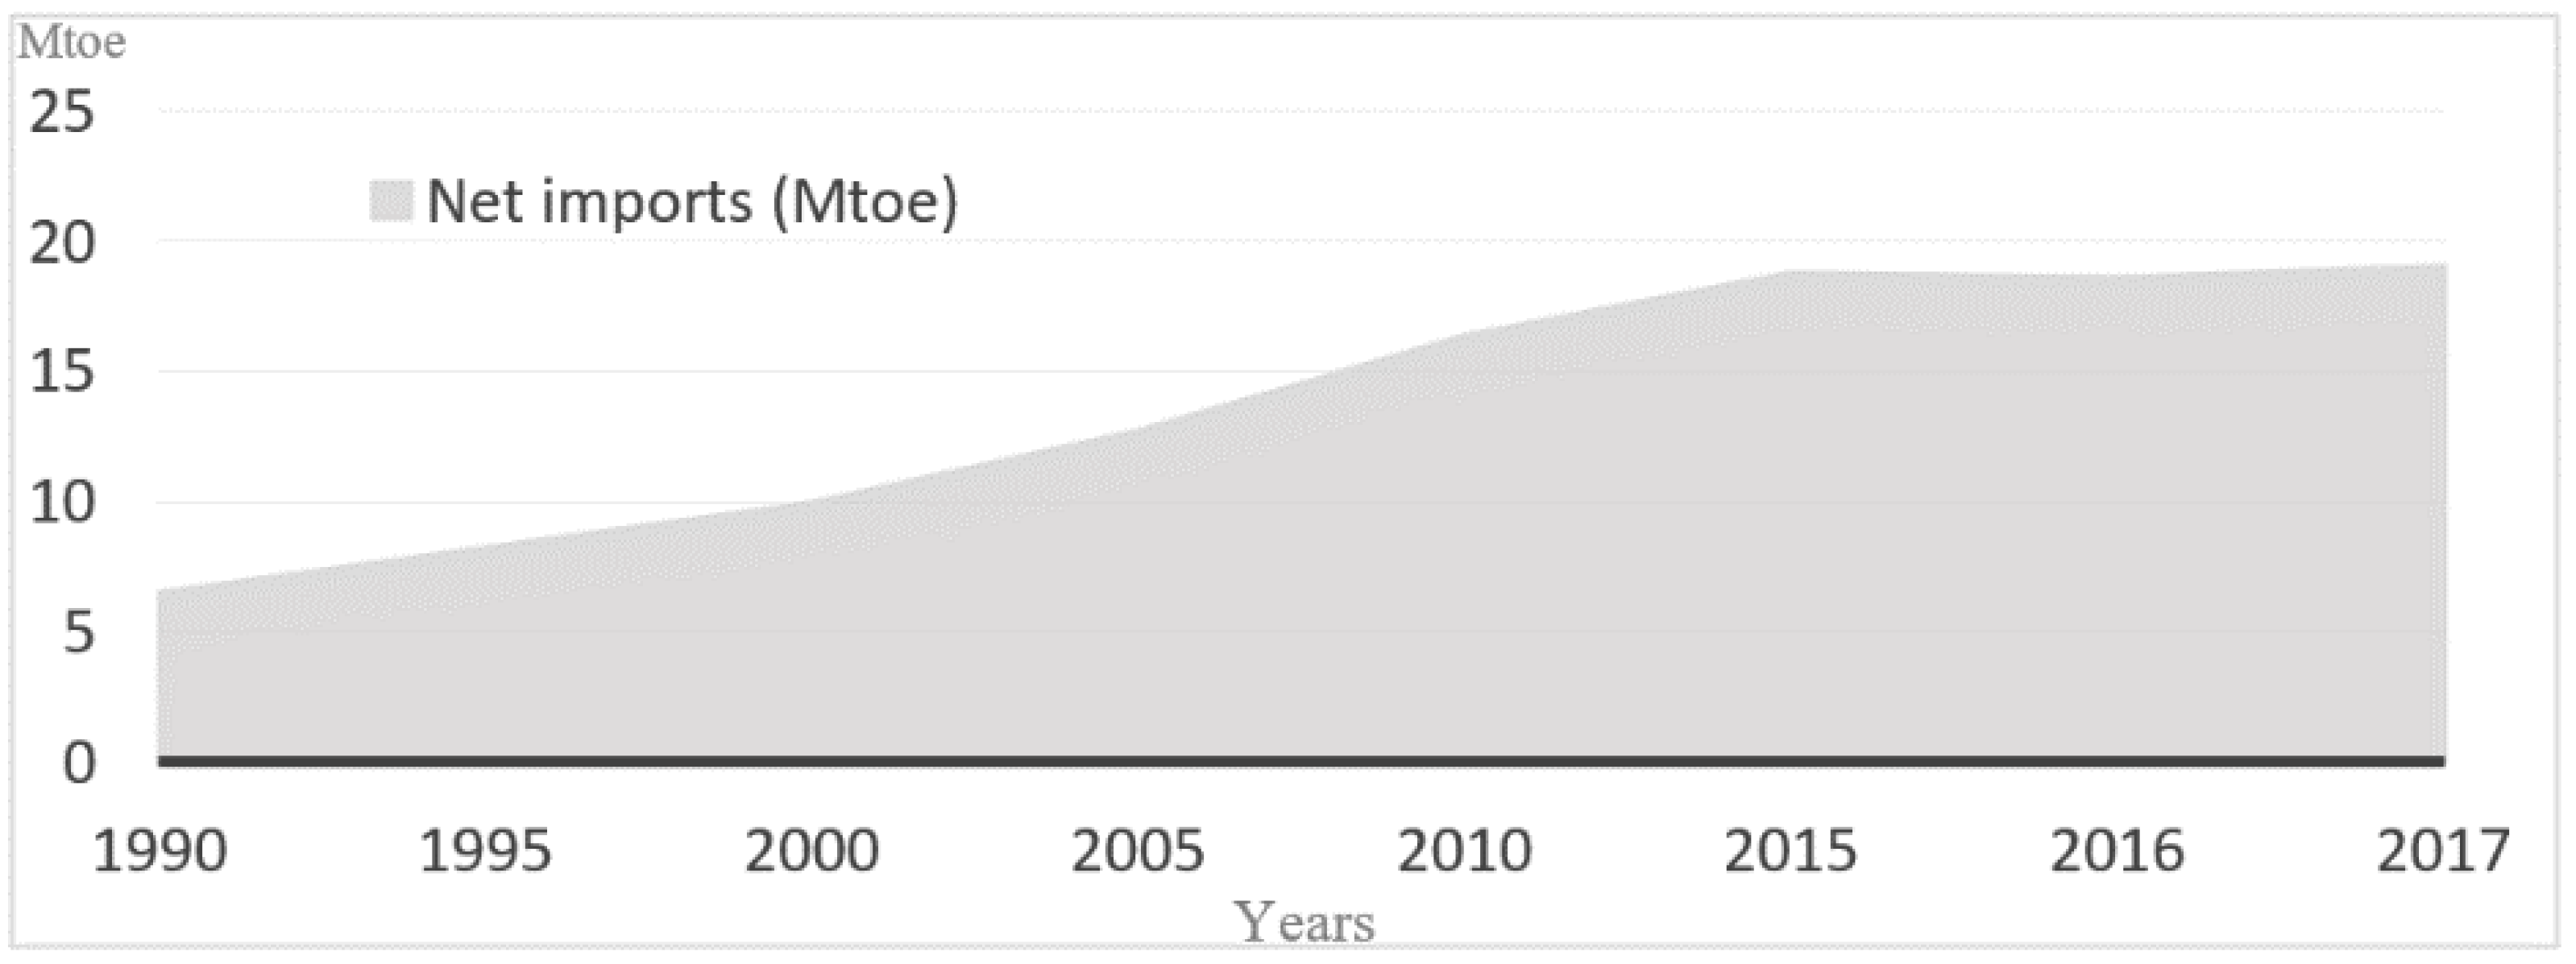
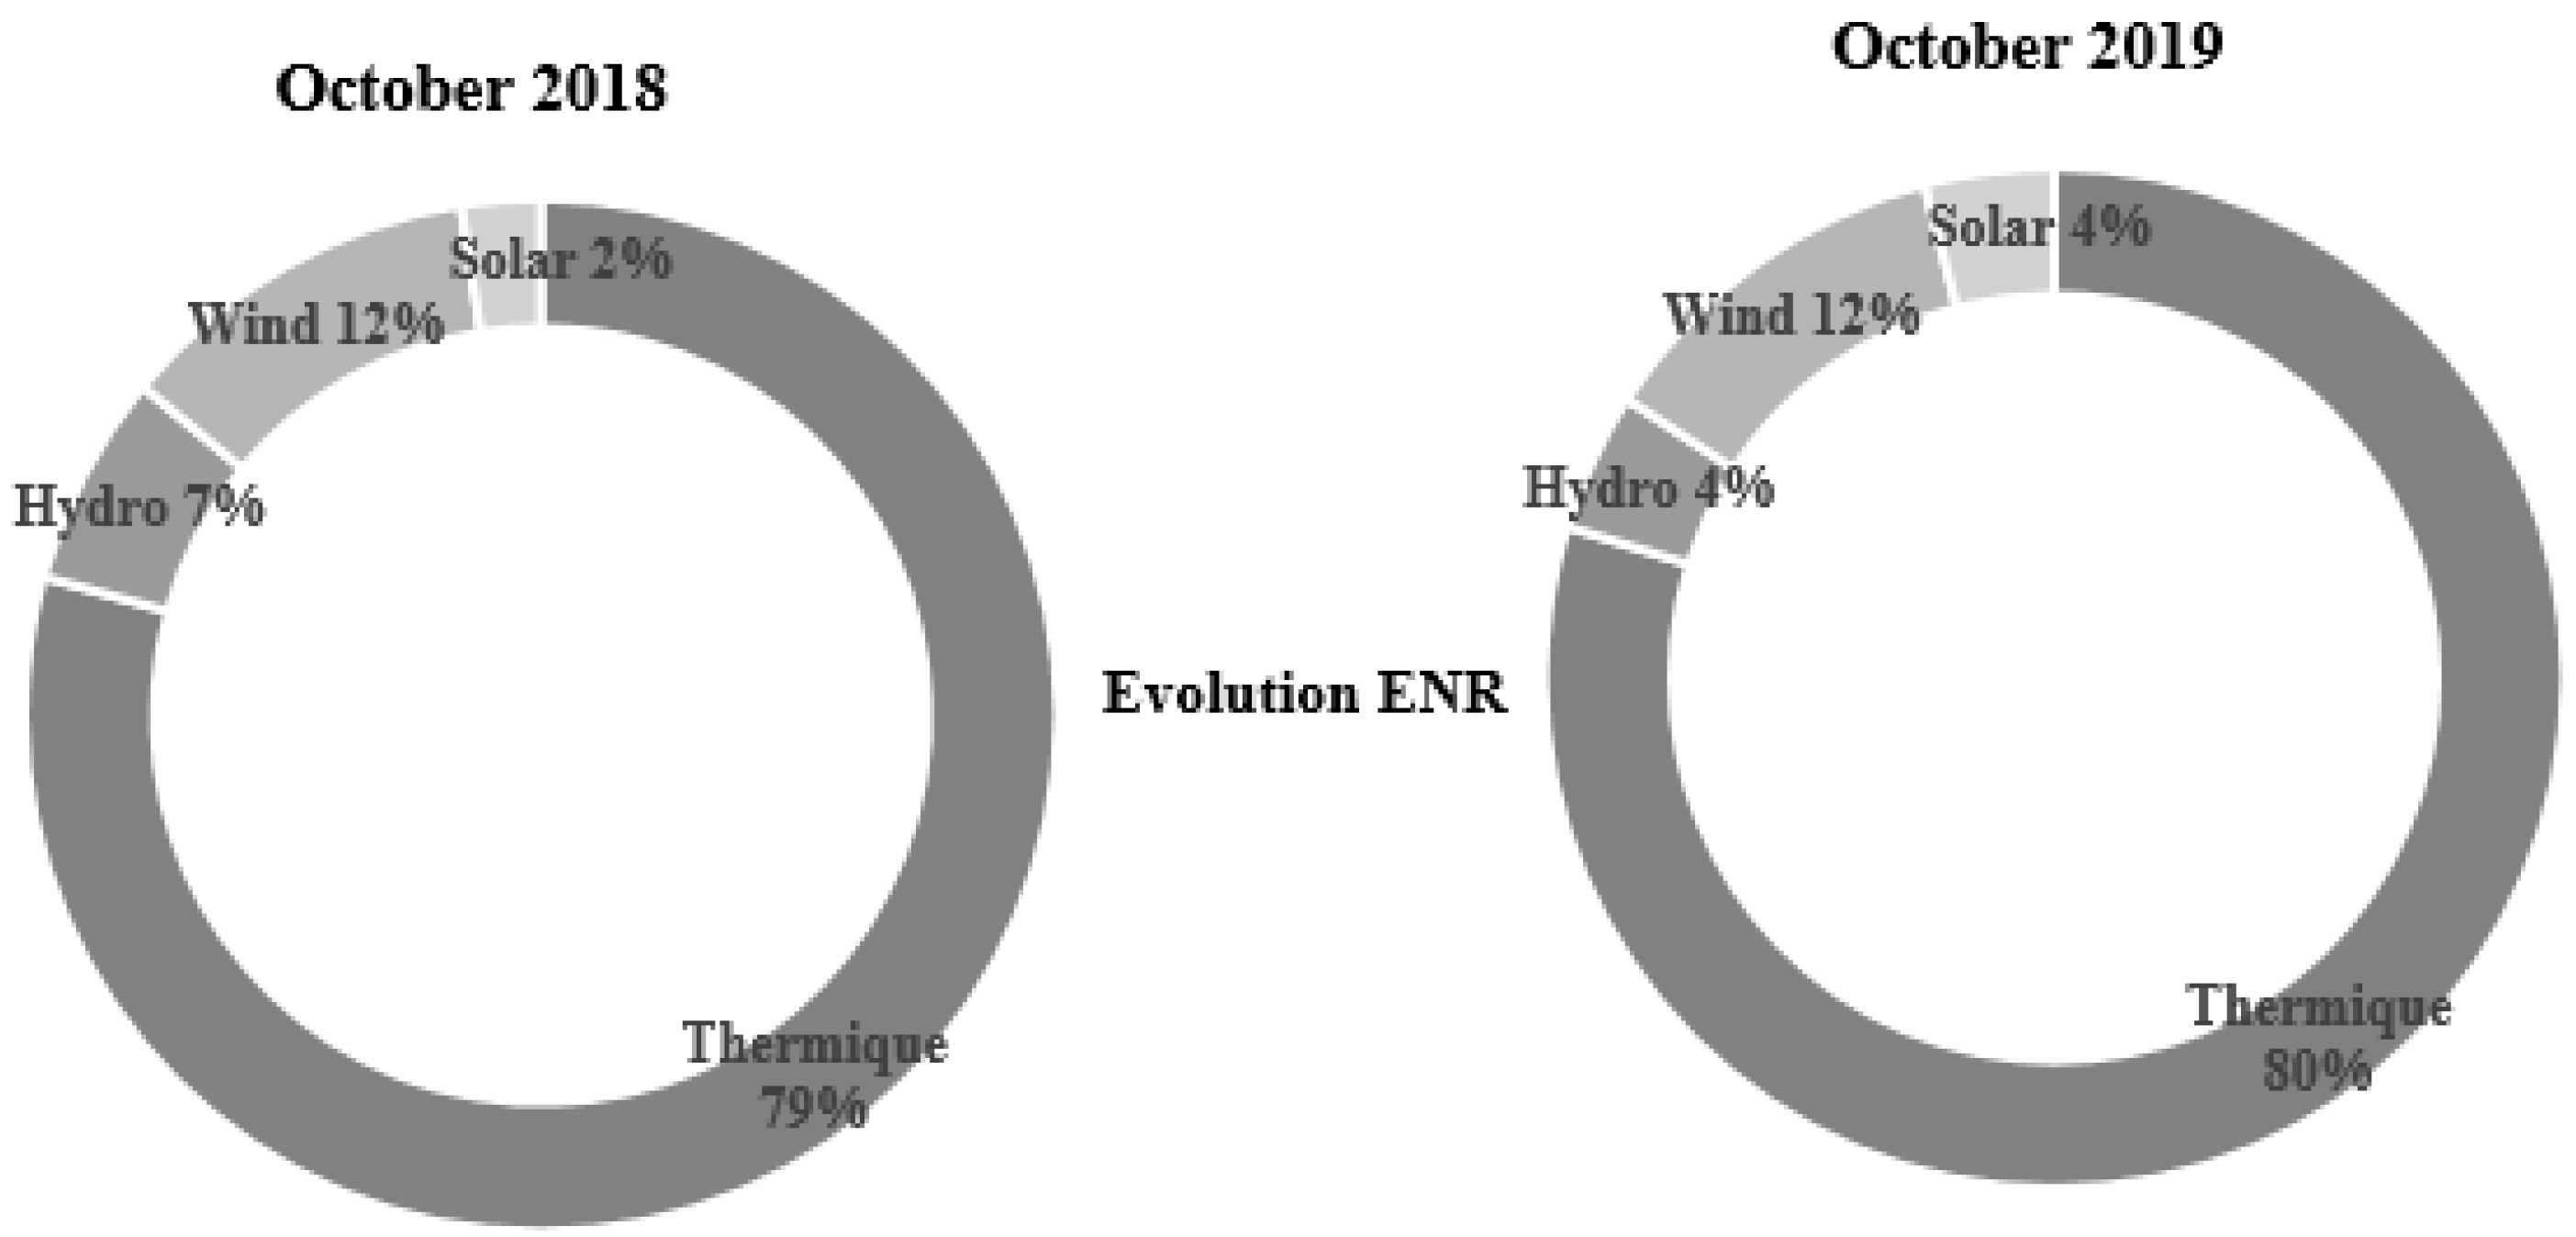
2. Moroccan Energy Sector
3. Methods
3.1. Data and Hypothesis
3.1.1. Moroccan Textile Factories: Industrial Company
- (a)
- Detailed case: Fez
- (b)
- Different zone case and company
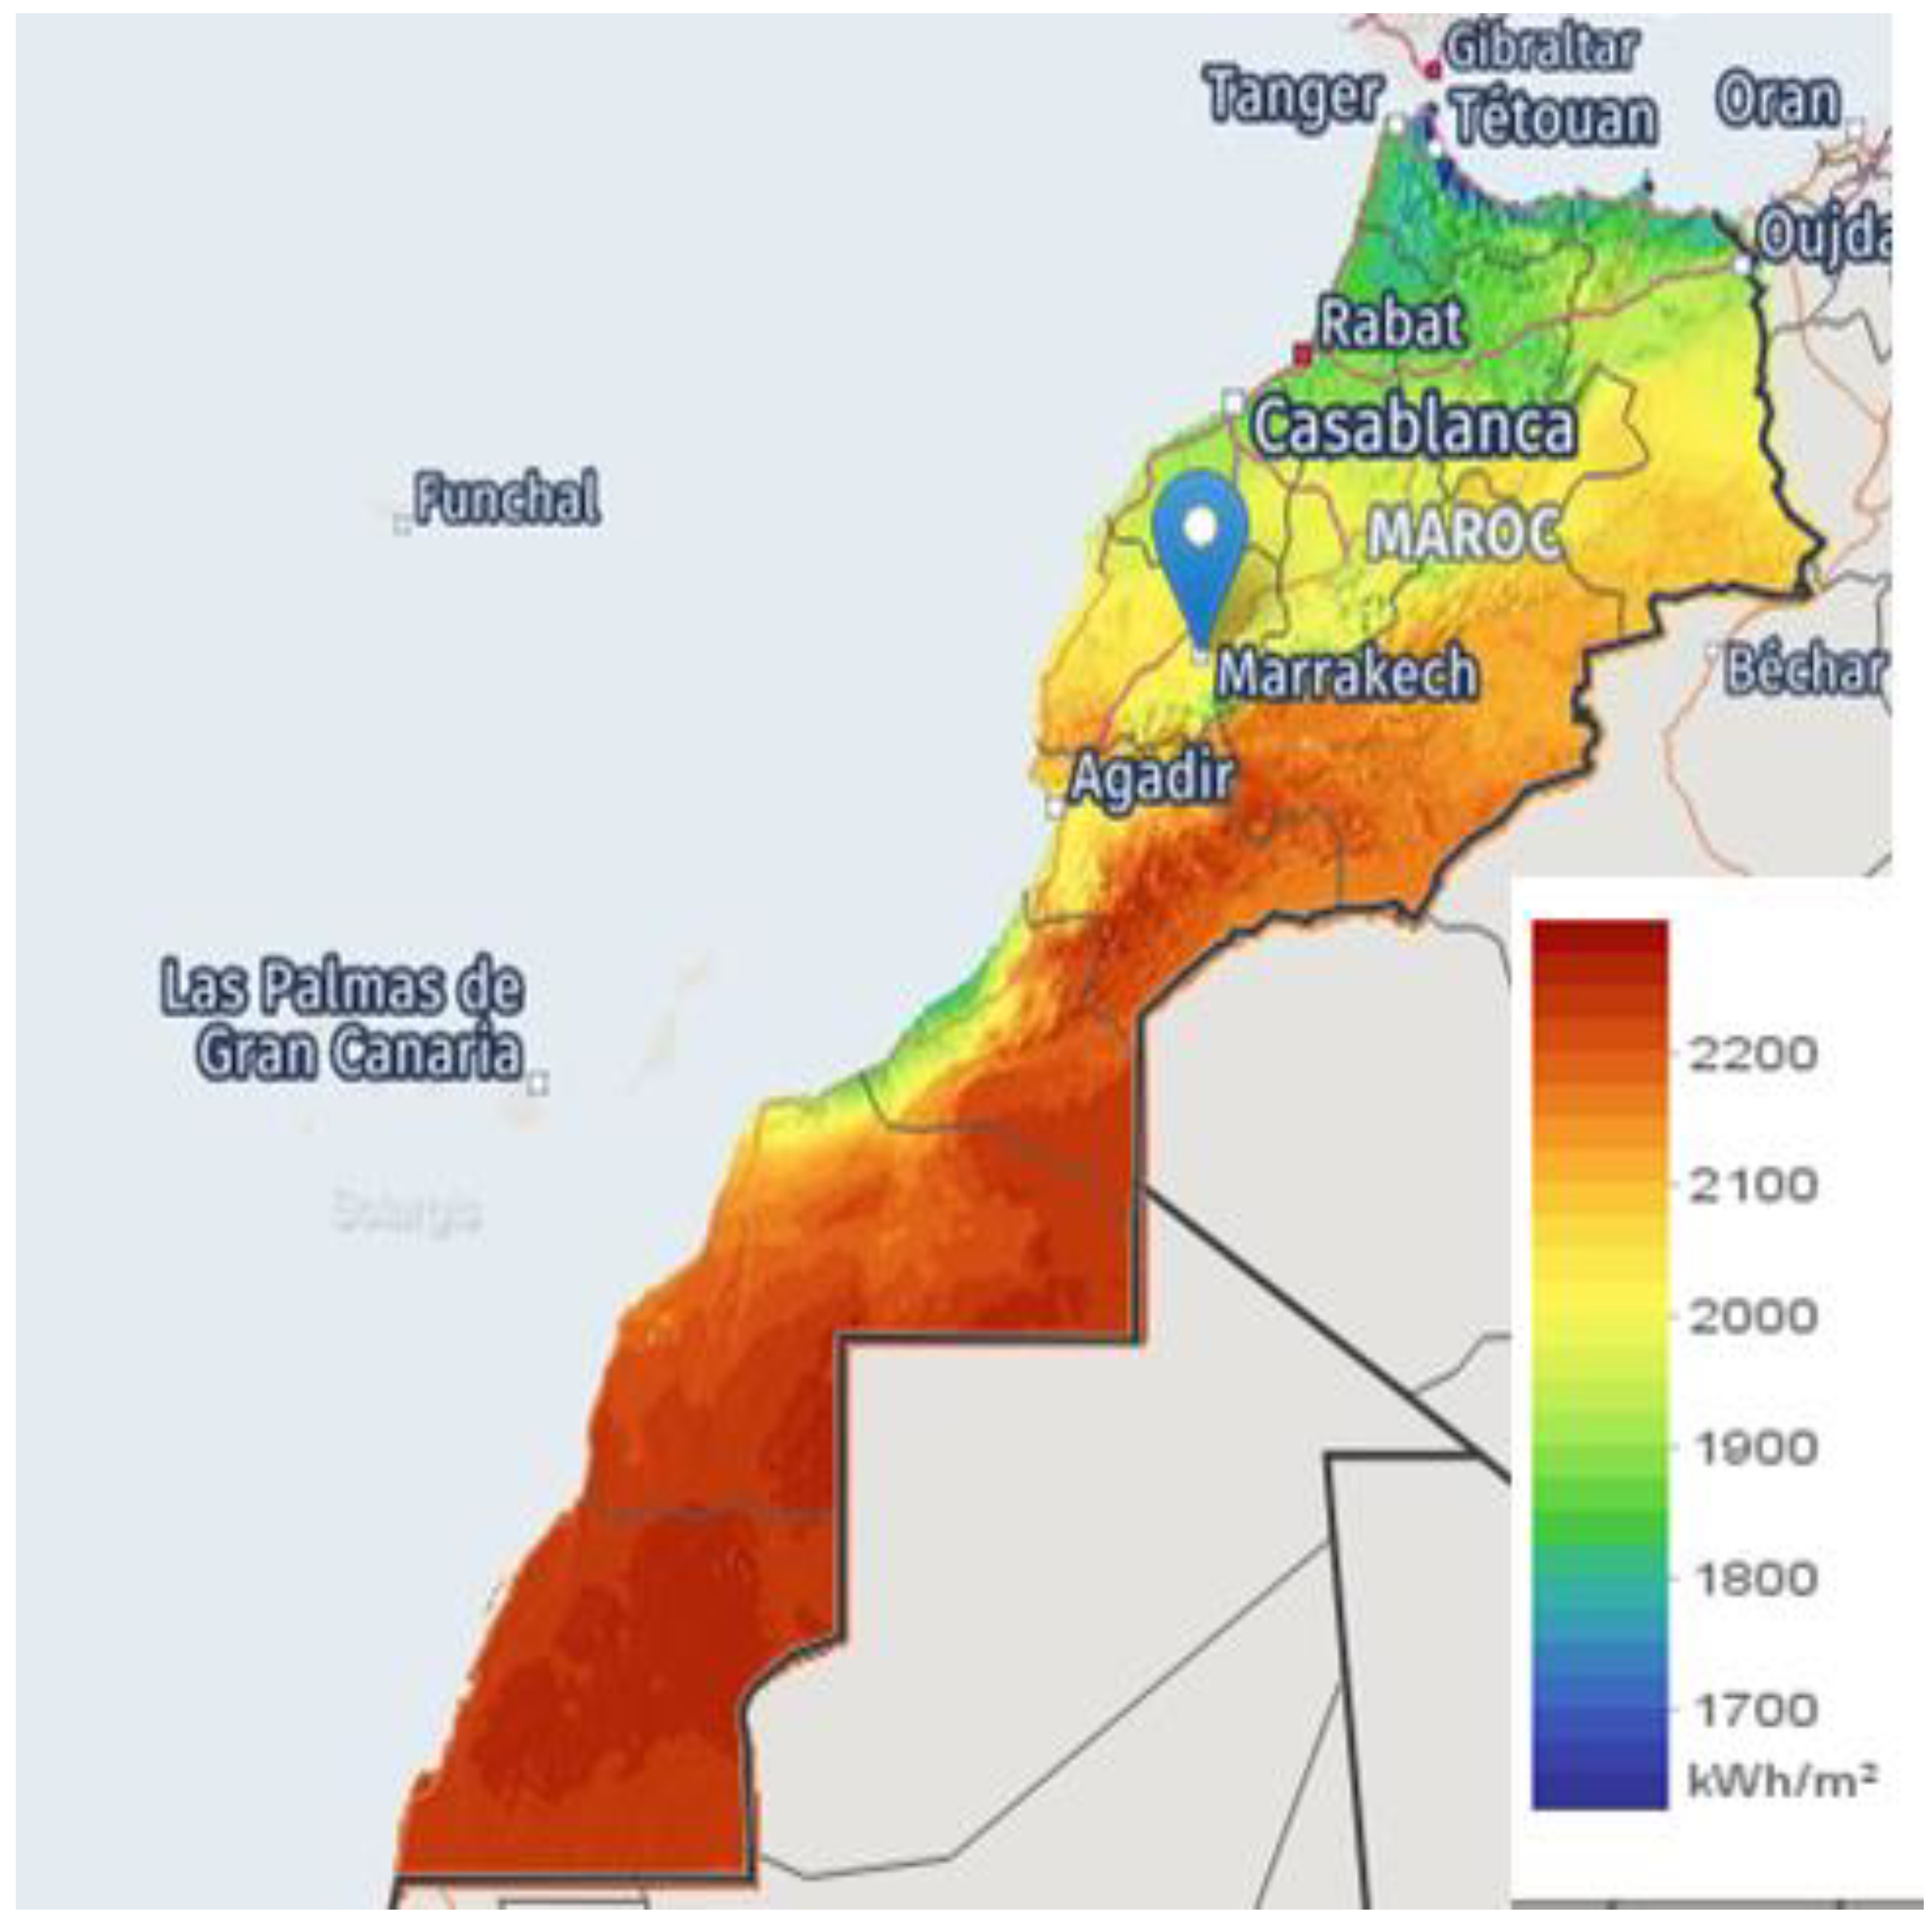
3.1.2. Solar Potential
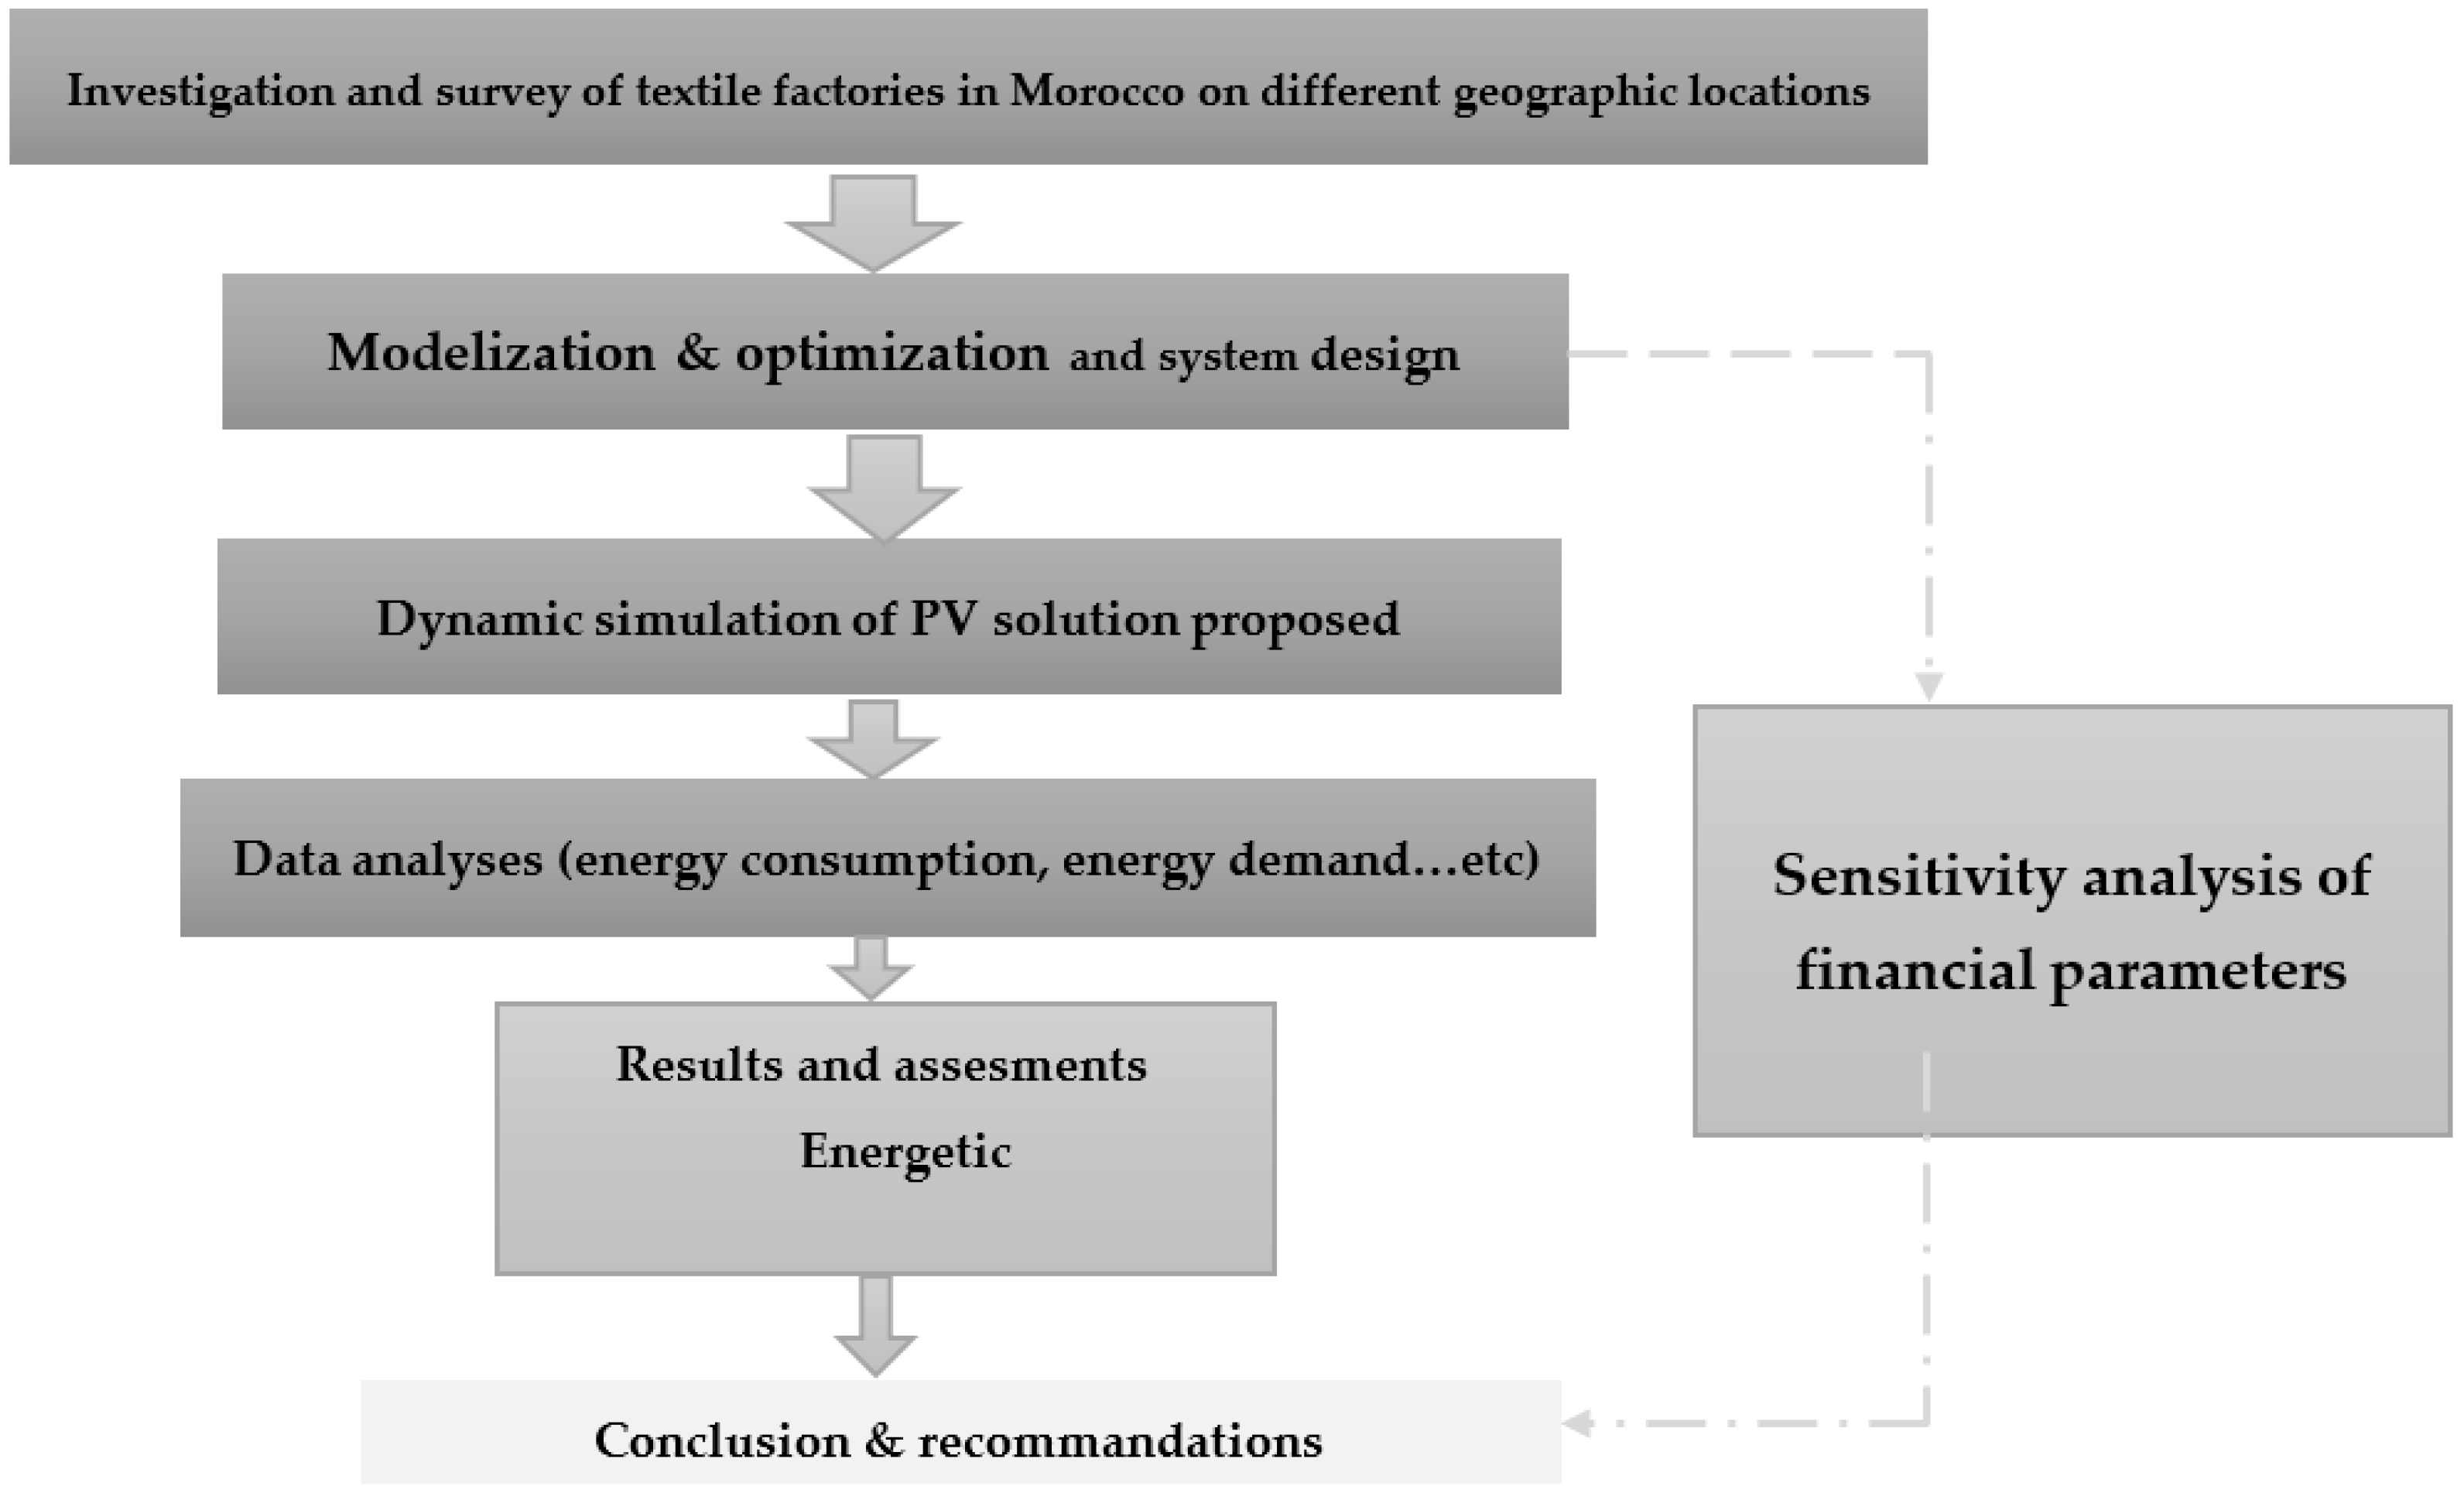
3.2. Proposed Model: Theoretical Model; Methodology Follow
3.2.1. Proposed System Analysis
3.2.2. Mathematical Model
3.3. Economic Analysis Model
- (a)
- Net present cost (NPC)
- (b)
- Simple payback period
- (c)
- Cost of Energy (COE)
3.4. Environmental Assessment and Sustainability Management
4. Results and Discussion
4.1. Detailed Case: Fez Region
- (a)
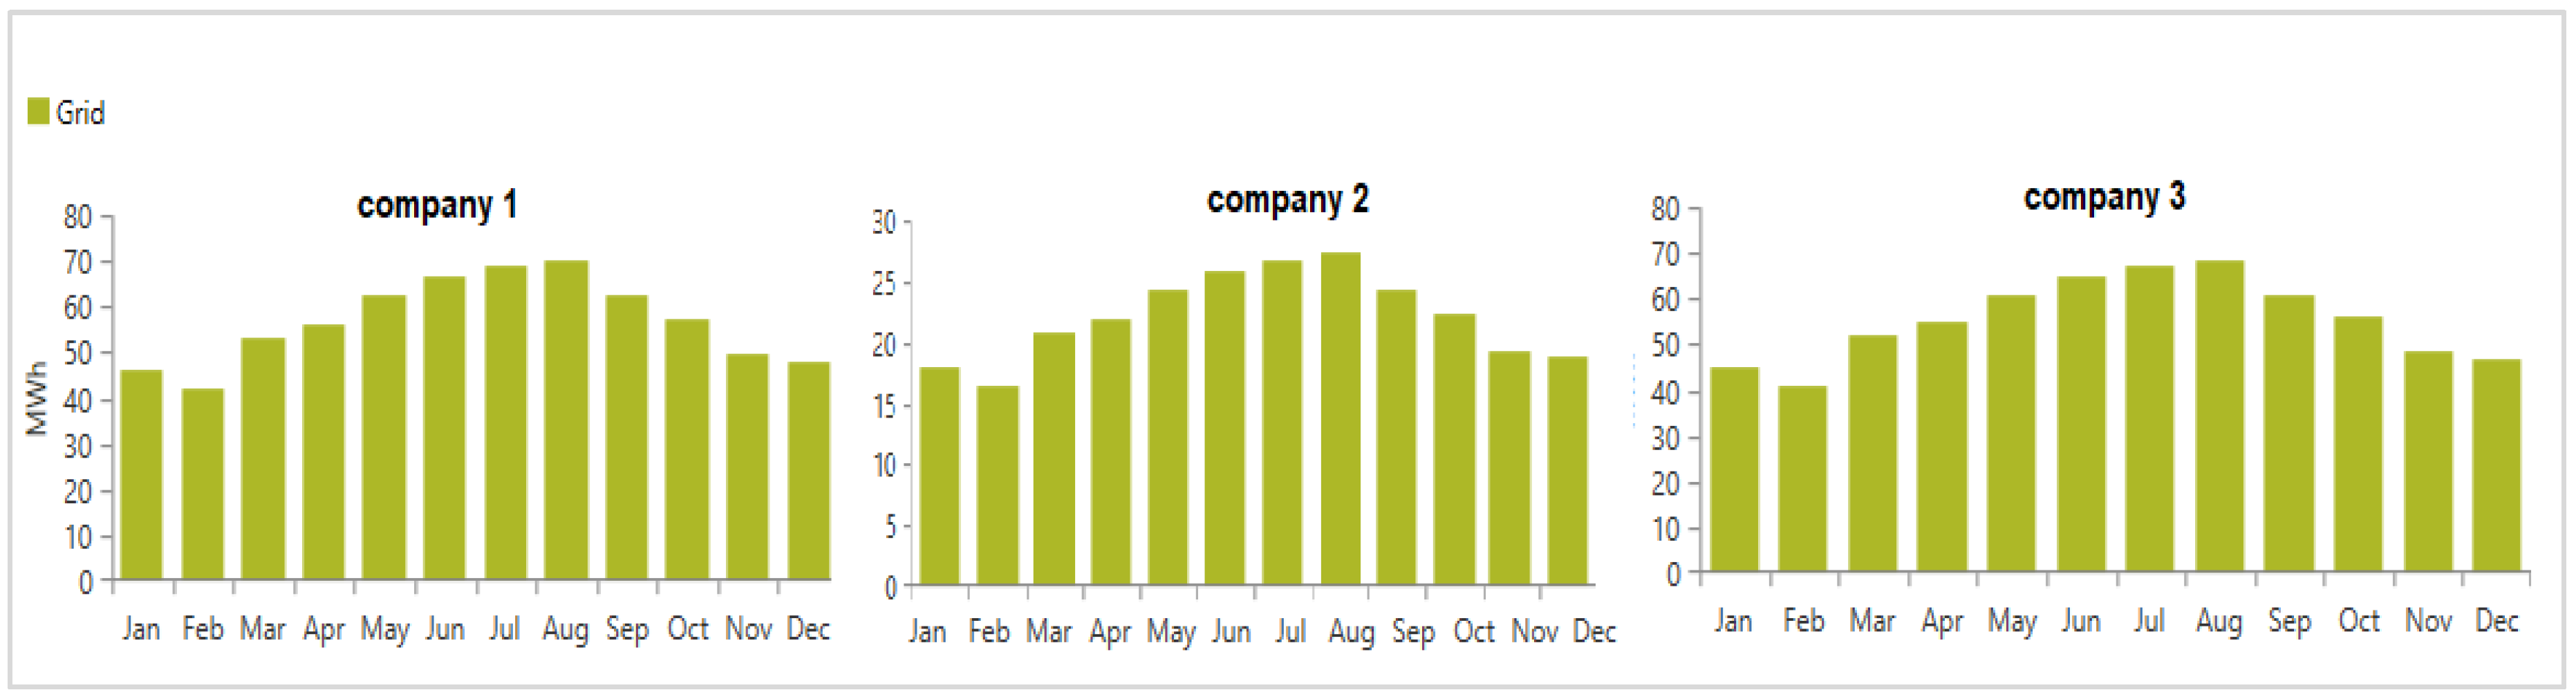
- Scenario 1: grid-only system
- (b)
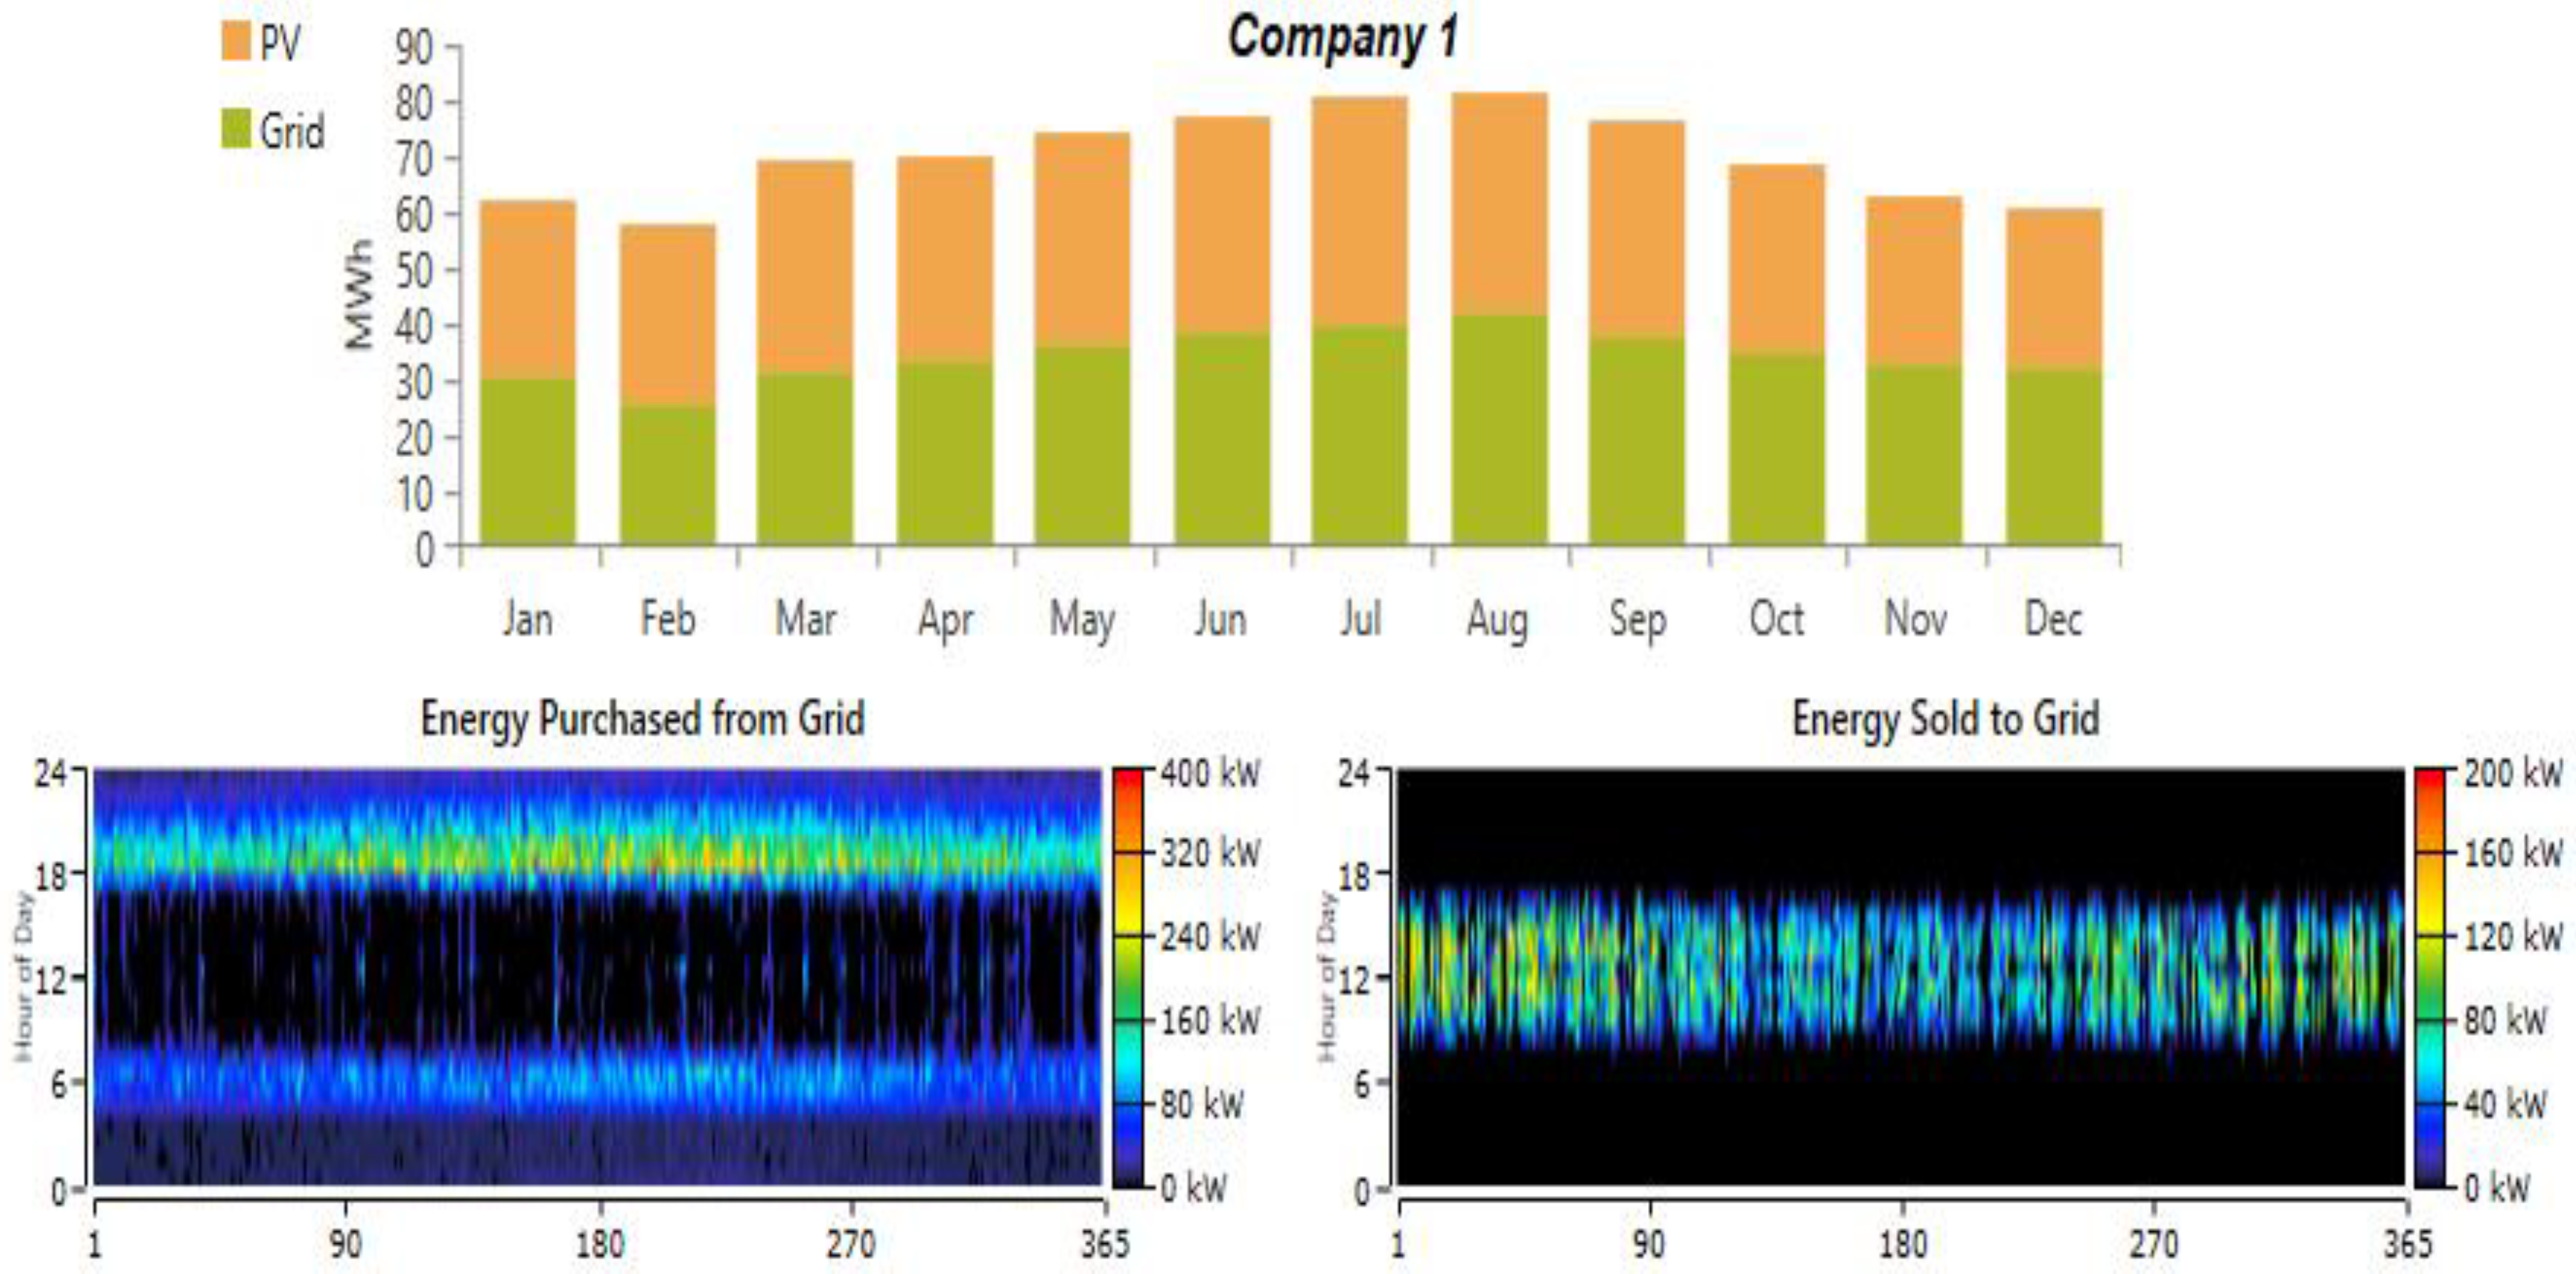
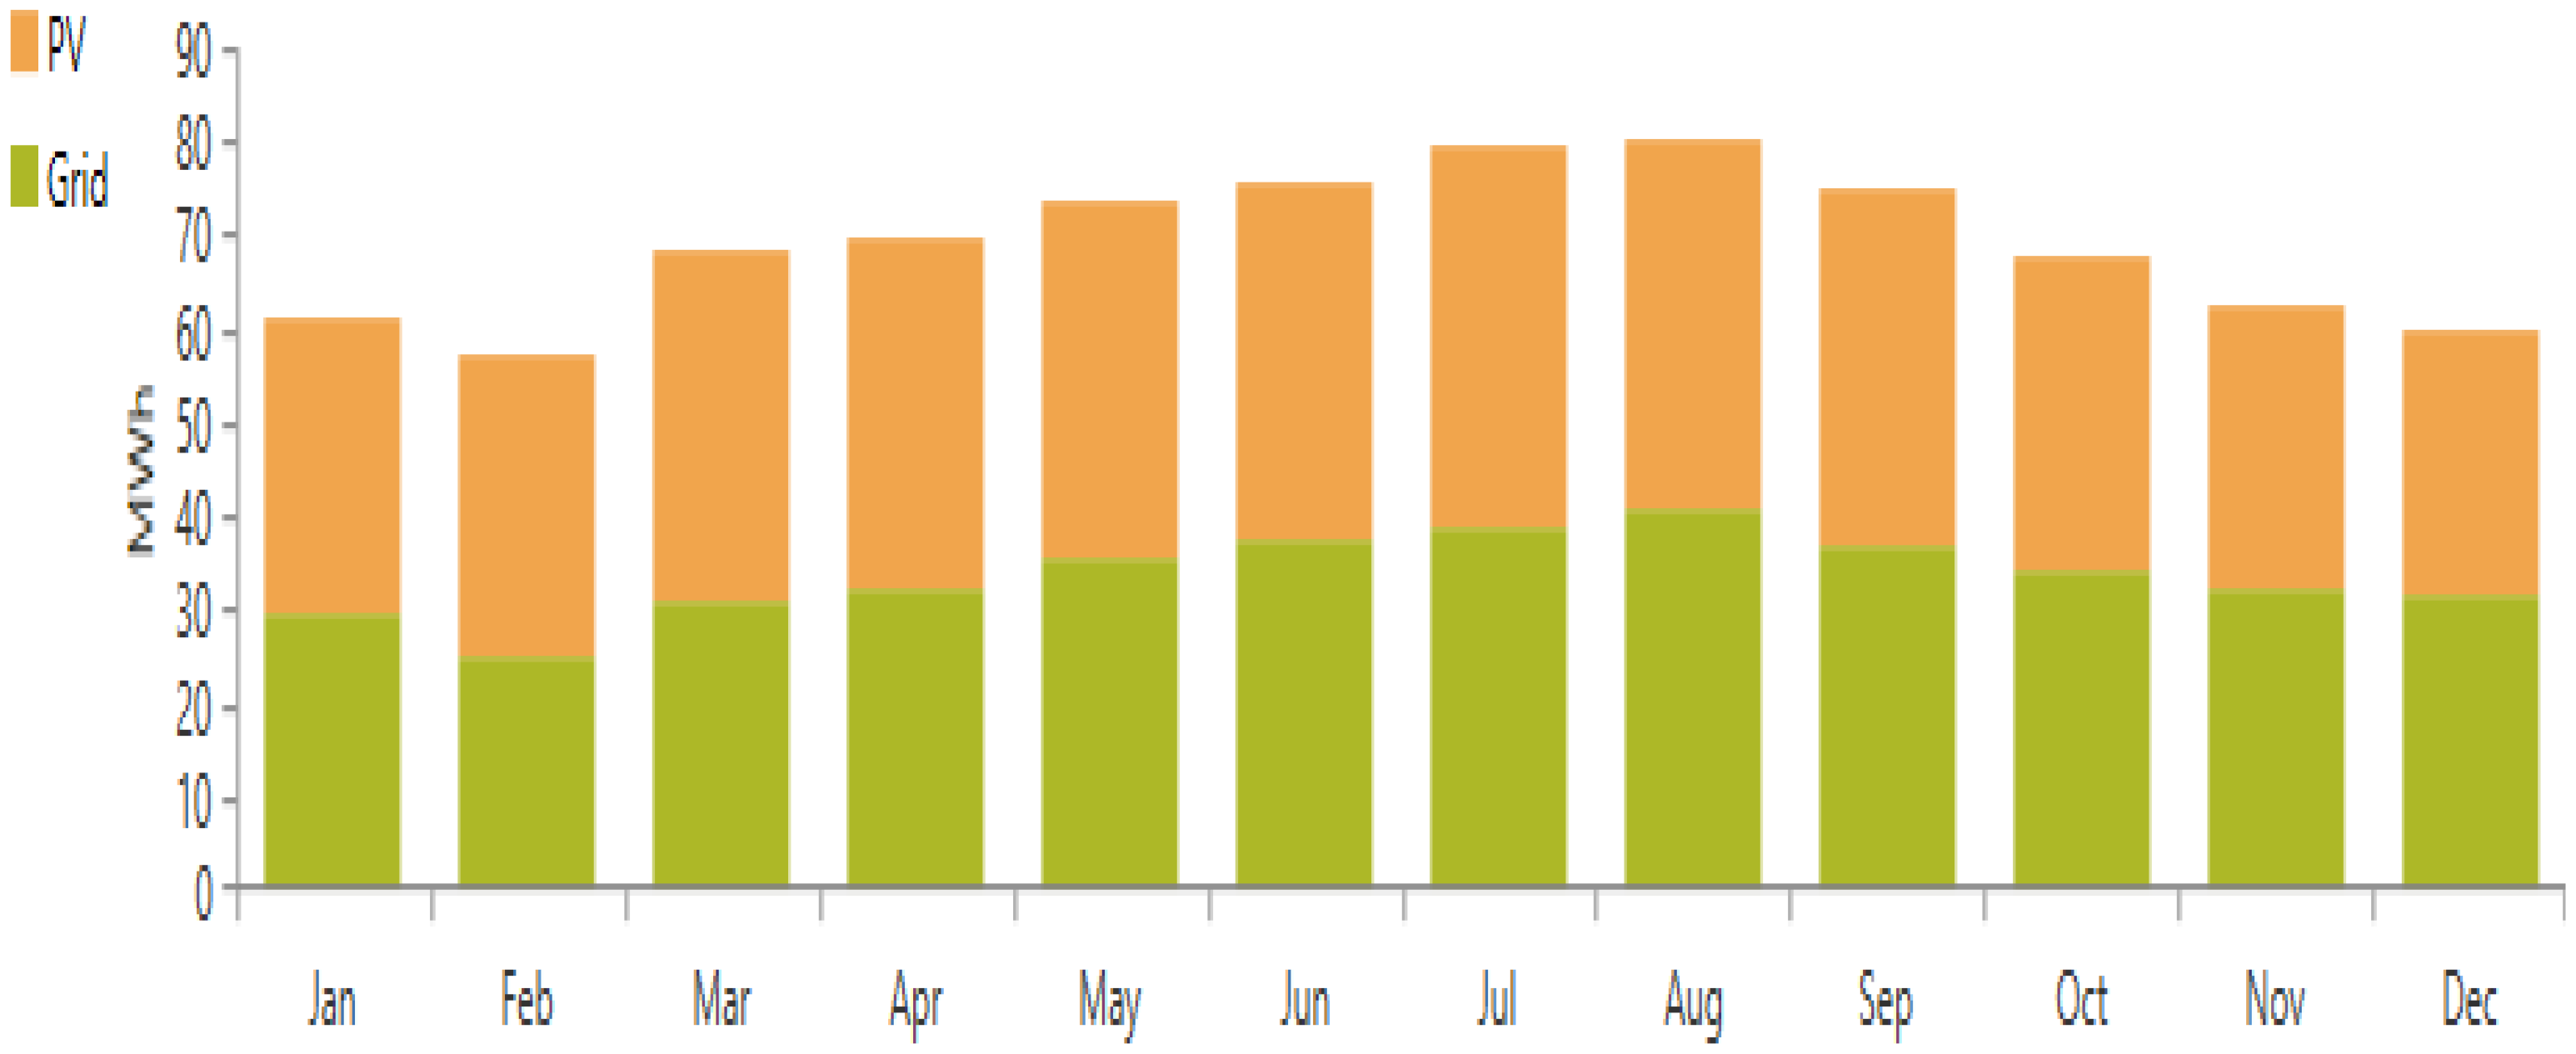
- Scenario 2: PV grid-connected system
4.2. Optimal Decisions for Other Zone Company
4.3. Sensitivity Analysis
5. Conclusions and Recommendations
Author Contributions
Funding
Informed Consent Statement
Conflicts of Interest
References
- Munasinghe, M. The sustainomics trans-disciplinary meta-framework for making development more sustainable: Applications to energy issues. Int. J. Sustain. Dev. 2002, 5, 125–182. [Google Scholar] [CrossRef]
- Mana, A.A.; Allouhi, A.; Ouazzani, K.; Jamil, A. Feasibility of agriculture biomass power generation in Morocco: Techno-economic analysis. J. Clean. Prod. 2021, 295, 126293. [Google Scholar] [CrossRef]
- Harbouze, R.; Pellissier, J.-P.; Rolland, J.-P.; Khechimi, W. Rapport de synthèse sur l’agriculture au Maroc. Ph.D. Thesis, CIHEAM-IAMM, Montpellier, France, 2019; p. 104. Available online: https://hal.archives-ouvertes.fr/hal-02137637 (accessed on 8 June 2021).
- Mana, A.A.; Allouhi, A.; Ouazzani, K.; Jamil, A. Toward a Sustainable Agriculture in Morocco Based on Standalone PV Pumping Systems: A Comprehensive Approach. In Advanced Technologies for Solar Photovoltaics Energy Systems; Springer: Cham, Switzerland, 2021; pp. 399–433. [Google Scholar]
- IEA. Energy Policies beyond IEA Countries. Morocco 2019; International Energy Agency IEA: Paris, France, 2019. [Google Scholar]
- IEA. Energy Policies beyond IEA Countries, Report 2021; Royal Institut for Stategical Studies: Rabat, Morocco, 2021. [Google Scholar]
- Textiles Sector Growing in Morocco|Morocco 2015|Oxford Business Group. Available online: https://oxfordbusinessgroup.com/analysis/textiles-sector-growing-morocco (accessed on 8 June 2021).
- Khude, P. A review on energy management in textile industry. Innov. Ener. Res. 2017, 6, 1463–2576. [Google Scholar] [CrossRef]
- Ghaffar, A.; Pumijumnong, N.; Cui, S. Decarbonization action plans using hybrid modeling for a low-carbon society: The case of Bangkok Metropolitan Area. J. Clean. Prod. 2017, 168, 940–951. [Google Scholar]
- Ali, G.; Abbas, S.; Pan, Y.; Chen, Z.; Hussain, J.; Sajjad, M.; Ashraf, A. Urban environment dynamics and low carbon society: Multi-criteria decision analysis modeling for policy makers. Sustain. Cities Soc. 2019, 51, 101763. [Google Scholar] [CrossRef]
- Lallana, F.; Bravo, G.; Le Treut, G.; Lefèvre, J.; Nadal, G.; Di Sbroiavacca, N. Exploring deep decarbonization pathways for Argentina. Energy Strategy Rev. 2021, 36, 100670. [Google Scholar] [CrossRef]
- Domínguez, R.; Vitali, S.; Carrión, M.; Moriggia, V. Analysing decarbonizing strategies in the European power system applying stochastic dominance constraints. Energy Econ. 2021, 101, 105438. [Google Scholar] [CrossRef]
- Le Treut, G.; Lefevre, J.; Lallana, F.; Bravo, G. The multi-level economic impacts of deep decarbonization strategies for the energy system. Energy Policy 2021, 156, 112423. [Google Scholar] [CrossRef]
- Wen, J.; Tao, M. Research on clean energy development strategy of China Three Gorges Corporation based on SWOT framework. Sustain. Energy Technol. Assess. 2021, 47, 101335. [Google Scholar]
- Åsa, L.; Rootzen, J. Brick by brick: Governing industry decarbonization in the face of uncertainty and risk. Environ. Innov. Soc. Transit. 2021, 40, 189–202. [Google Scholar]
- Singh, P.K.; Chudasama, H. Conceptualizing and achieving industrial system transition for a dematerialized and decarbonized world. Glob. Environ. Chang. 2021, 70, 102349. [Google Scholar] [CrossRef]
- Ernst, W.; Boyd, G. Bottom-up estimates of deep decarbonization of US manufacturing in 2050. J. Clean. Prod. 2022, 330, 129758. [Google Scholar]
- Griffiths, S.; Sovacool, B.K.; Kim, J.; Bazilian, M.; Uratani, J.M. Industrial decarbonization via hydrogen: A critical and systematic review of developments, socio-technical systems and policy options. Energy Res. Soc. Sci. 2021, 80, 102208. [Google Scholar] [CrossRef]
- Rajabloo, T.; De Ceuninck, W.; Van Wortswinkel, L.; Rezakazemi, M.; Aminabhavi, T. Environmental management of industrial decarbonization with focus on chemical sectors: A review. J. Environ. Manag. 2022, 302, 114055. [Google Scholar] [CrossRef] [PubMed]
- Baik, E.; Siala, K.; Hamacher, T.; Benson, S.M. California’s approach to decarbonizing the electricity sector and the role of dispatchable, low-carbon technologies. Int. J. Greenh. Gas Control. 2022, 113, 103527. [Google Scholar] [CrossRef]
- Bonilla, J.; Blanco, J.; Zarza, E.; Alarcón-Padilla, D.C. Feasibility and practical limits of full decarbonization of the electricity market with renewable energy: Application to the Spanish power sector. Energy 2022, 239, 122437. [Google Scholar] [CrossRef]
- Luo, S.; Hu, W.; Liu, W.; Xu, X.; Huang, Q.; Chen, Z.; Lund, H. Transition pathways towards a deep decarbonization energy system—A case study in Sichuan, China. Appl. Energy 2021, 302, 117507. [Google Scholar] [CrossRef]
- Samantha, L.; Clarke, A.; Tozer, L. Technical pathways to deep decarbonization in cities: Eight best practice case studies of transformational climate mitigation. Energy Res. Soc. Sci. 2022, 86, 102422. [Google Scholar]
- GIZ; PNUD. Plan Climat National A L’horizon 2030, Ministre de l’Energie, des Mines et du Développement Durable, Chargé du Développement Durable; PNUD: New York, NY, USA, 2020. [Google Scholar]
- (PDF) Egm ev-Maroc fr|houda Ammor—Academia.edu. Available online: https://www.academia.edu/36004095/Egm_ev_maroc_fr (accessed on 8 June 2021).
- Berraho, A.; Birouk, A.; Menioui, M. Biodiversité et Equilibres Ecologiques. 2006, Volume GT8-4, pp. 119–185. Available online: http://docplayer.fr/38619597-Biodiversite-et-equilibres-ecologiques.html (accessed on 8 June 2021).
- GIZ. Recueil Annuel Des Instruments D’appui À L’entreprenariat; GIZ: Bonn, Germany, 2020. [Google Scholar]
- AMITH, Portail Officiel de l’Association Marocaine des Industries du Textile et de l’Habillement. Available online: http://www.amith.ma/portail/PageFR.aspx?id=64 (accessed on 8 June 2021).
- Moudine, C.; El Khattab, Y. La Délocalisation au Maroc: Etat des Leix et Perspectives de Développement; MPRA: Munich, Germany, 2010. [Google Scholar]
- Gargab, F.Z.; Allouhi, A.; Kousksou, T.; El-Houari, H.; Jamil, A.; Benbassou, A. A New Project for a Much More Diverse Moroccan Strategic Version: The Generalization of Solar Water Heater. Inventions 2021, 6, 2. [Google Scholar] [CrossRef]
- Morocco—Countries & Regions—IEA. Available online: https://www.iea.org/countries/morocco (accessed on 6 September 2021).
- Conti, J.; Holtberg, P.; Diefenderfer, J.; LaRose, A.; Turnure, J.T.; Westfall, L. International Energy Outlook 2016 with Projections to 2040; USDOE Energy Information Administration (EIA): Washington, DC, USA, 2016. [Google Scholar]
- La Recette Marocaine du Développement Durable. Available online: https://www.latribune.fr/economie/international/la-recette-marocaine-du-developpement-durable-615152.html (accessed on 8 June 2021).
- Oualkacha, L.; Stour, L.; Agoumi, A.; Kettab, A. Climate change impacts in the Maghreb region: Status and prospects of the water resources. Water Land Secur. Drylands 2017, 17–25. [Google Scholar] [CrossRef]
- Moore, S. Evaluating the energy security of electricity interdependence: Perspectives from Morocco. Energy Res. Soc. Sci. 2017, 24, 21–29. [Google Scholar] [CrossRef]
- L’Agence Marocaine pour L’énergie Durable (Moroccan Agency for Sustainable Energy—Masen). Available online: https://www.masen.ma/10-04-2022 (accessed on 8 June 2021).
- Bahadori, A.; Nwaoha, C. A review on solar energy utilisation in Australia, Renew. Sustain. Energy Rev. 2013, 18, 1–5. [Google Scholar] [CrossRef]
- Mills, D. Advances in solar thermal electricity technology. Sol. Energy 2004, 76, 19–31. [Google Scholar] [CrossRef]
- Ghenai, C.; Bettayeb, M. Design and optimization of grid-tied and off-grid solar PV systems for super-efficient electrical appliances. Energy Effic. 2020, 13, 291–305. [Google Scholar] [CrossRef]
- Xu, L.; Wang, Y.; Solangi, Y.A.; Zameer, H.; Shah, S.A.A. Off-grid solar PV power generation system in Sindh, Pakistan: A techno-economic feasibility analysis. Processes 2019, 7, 308. [Google Scholar] [CrossRef] [Green Version]
- Golroodbari, S.Z.; Van Sark, W. Simulation of performance differences between offshore and land-based photovoltaic systems. Prog. Photovolt. Res. Appl. 2020, 28, 873–886. [Google Scholar] [CrossRef]
- Obeng, M.; Gyamfi, S.; Derkyi, N.S.; Kabo-bah, A.T.; Peprah, F. Technical and economic feasibility of a 50 MW grid-connected solar PV at UENR Nsoatre Campus. J. Clean. Prod. 2020, 247, 119159. [Google Scholar] [CrossRef]
- Kornelakis, A.; Koutroulis, E. Methodology for the design optimisation and the economic analysis of grid-connected photovoltaic systems, IET Renew. Power Gener. 2009, 3, 476–492. [Google Scholar] [CrossRef]
- Aziz, A.S.; Tajuddin, M.F.N.; Adzman, M.R.; Mohammed, M.F.; Ramli, M.A.M. Feasibility analysis of grid-connected and islanded operation of a solar PV microgrid system: A case study of Iraq. Energy 2020, 191, 116591. [Google Scholar] [CrossRef]
- Jin, C.; Jiang, W. Design of a digital controlled solar water pump drive system for a nano-filtration system. In Proceedings of the 2011 IEEE Ninth International Conference on Power Electronics and Drive Systems, Singapore, 5–8 December 2011; pp. 982–986. [Google Scholar]
- Kolhe, M.; Joshi, J.C.; Kothari, D.P. Performance analysis of a directly coupled photovoltaic water-pumping system. IEEE Trans. Energy Convers. 2004, 19, 613–618. [Google Scholar] [CrossRef]
- Elgendy, M.A.; Zahawi, B.; Atkinson, D.J. Comparison of directly connected and constant voltage controlled photovoltaic pumping systems, IEEE Trans. Sustain. Energy 2010, 1, 184–192. [Google Scholar]
- Reges, J.P.; Braga, E.J.; Mazza, L.C.D.S.; De Alexandria, A.R. Inserting photovoltaic solar energy to an automated irrigation system. Int. J. Comput. Appl. 2016, 975, 8887. [Google Scholar] [CrossRef]
- Cardoen, D.; Joshi, P.; Diels, L.; Sarma, P.M.; Pant, D. Agriculture biomass in India: Part 1. Estimation and characterization, Resour. Conserv. Recycl. 2015, 102, 39–48. [Google Scholar] [CrossRef]
- Ashraf, M.A.; Liu, Z.; Alizadeh, A.; Nojavan, S.; Jermsittiparsert, K.; Zhang, D. Designing an optimized configuration for a hybrid PV/Diesel/Battery Energy System based on metaheuristics: A case study on Gobi Desert. J. Clean. Prod. 2020, 270, 122467. [Google Scholar] [CrossRef]
- Makhdoomi, S.; Askarzadeh, A. Optimizing operation of a photovoltaic/diesel generator hybrid energy system with pumped hydro storage by a modified crow search algorithm. J. Energy Storage 2020, 27, 101040. [Google Scholar] [CrossRef]
- Kahwash, F.; Maheri, A.; Mahkamov, K. Integration and optimisation of high-penetration Hybrid Renewable Energy Systems for fulfilling electrical and thermal demand for off-grid communities. Energy Convers. Manag. 2021, 236, 114035. [Google Scholar] [CrossRef]
- Vendoti, S.; Muralidhar, M.; Kiranmayi, R. Techno-economic analysis of off-grid solar/wind/biogas/biomass/fuel cell/battery system for electrification in a cluster of villages by HOMER software. Environ. Dev. Sustain. 2021, 23, 351–372. [Google Scholar] [CrossRef]
- Jumare, I.A.; Bhandari, R.; Zerga, A. Assessment of a decentralized grid-connected photovoltaic (PV)/wind/biogas hybrid power system in northern Nigeria. Energy. Sustain. Soc. 2020, 10, 1–25. [Google Scholar] [CrossRef]
- Humada, A.M.; Hojabri, M.; Hamada, H.M.; Samsuri, F.B.; Ahmed, M.N. Performance evaluation of two PV technologies (c-Si and CIS) for building integrated photovoltaic based on tropical climate condition: A case study in Malaysia. Energy Build. 2016, 119, 233–241. [Google Scholar] [CrossRef] [Green Version]
- Salisu, S.; Mustafa, M.W.; Olatomiwa, L.; Mohammed, O.O. Assessment of technical and economic feasibility for a hybrid PV-wind-diesel-battery energy system in a remote community of north central Nigeria. Alex. Eng. J. 2019, 58, 1103–1118. [Google Scholar] [CrossRef]
- Elmer, T. A Novel SOFC tri-Generation System for Building Applications; Springer: Berlin/Heidelberg, Germany, 2016. [Google Scholar]
- Demiroren, A.; Yilmaz, U. Analysis of change in electric energy cost with using renewable energy sources in Gökceada, Turkey: An island example, Renew. Sustain. Energy Rev. 2010, 14, 323–333. [Google Scholar] [CrossRef]
- Timmerberg, S.; Sanna, A.; Kaltschmitt, M.; Finkbeiner, M. Renewable electricity targets in selected MENA countries–Assessment of available resources, generation costs and GHG emissions. Energy Rep. 2019, 5, 1470–1487. [Google Scholar] [CrossRef]
- Allouhi, A.; Saadani, R.; Buker, M.S.; Kousksou, T.; Jamil, A.; Rahmoune, M. Nationa. Sol. Energy 2019, 178, 25–36. [Google Scholar] [CrossRef]


| City | Companies | Total Energy Consumption (kWh/Year) | Daily Electric Profile (kWh/Day) |
|---|---|---|---|
| Casablanca | Company 1 | 1,813,766 | 5650 |
| Company 2 | 775,823 | 2424 | |
| Company 3 | 274,925 | 864 | |
| Company 4 | 4,389,956 | 12,724 | |
| Company 5 | 215,960 | 674 | |
| Company 6 | 67,211 | 210 | |
| Company 7 | 102,125 | 318 | |
| Company 8 | 113,098 | 353 | |
| Tangier | Company 1 | 2,305,000 | 7092 |
| Company 2 | 1,146,840 | 3583 | |
| Company 3 | 1,649,550 | 5138 | |
| Company 4 | 696,985 | 2178 | |
| Company 5 | 946,163 | 2956 | |
| Company 6 | 8451 | 27 | |
| Company 7 | 231,187 | 720 | |
| Meknes | Company 1 | 45,372 | 142 |
| Company 2 | 289,364 | 904 | |
| Company 3 | 95,539 | 298 | |
| Sale | Company 1 | 338,125 | 1056 |
| Company 2 | 462,075 | 1439 | |
| Company 3 | 771,648 | 2403 | |
| Marrakech | Company 1 | 14,883,639 | 46,511 |
| Agadir | Company 1 | 11,115,636 | 34,736 |
| Company 2 | 1,524,782 | 4750 | |
| Company 3 | 5,256,697 | 16,427 | |
| Settat | Company 1 | 30,264,554 | 94,282 |
| Company 2 | 3,990,382 | 12,431 |
| City | Latitude | Longitude | Altitude |
|---|---|---|---|
| Casablanca | 33°35′17″ N | 7°36′40″ W | 27 m |
| Meknes | 33°53′36″ N | 5°32′50″ W | 531 m |
| Fez | 34°01′59″ N | 5°00′01″ W | 406 m |
| Setat | 33°00′03″ N | 7°36′59″ W | 365 m |
| Sale | 34°01′46″ N | 6°50′09″ W | 11 m |
| Marrakech | 31°38′02″ N | 7°59′59″ W | 457 m |
| Tangier | 35°46′02″ N | 5°47′59″ W | 20 m |
| Architecture | Electric Load | Grid | NPC | COE | Operating Costs | Initial Capital | Energy Purchased | CO2 |
|---|---|---|---|---|---|---|---|---|
| Hybrid On-Grid | (kWh/Day) | (kW) | ($) | ($) | ($) | ($) | (kWh) | kg/Year |
| Company 1 | 1868 | 999,999 | 871,394 | 0.1 | 68,166 | 0 | 681,663 | 430,811 |
| Company 2 | 728 | 999,999 | 339,709 | 0.1 | 26,574 | 0 | 265,743 | 167,949 |
| Company 3 | 1822 | 999,999 | 850,292 | 0.1 | 66,516 | 0 | 665,156 | 420,378 |
| Company | PV Installed (Kw) | Energy Production (kWh/Year) |
|---|---|---|
| Company 1 | 250 | 425,033 |
| Company 2 | 165 | 280,522 |
| Company 3 | 250 | 425,669 |
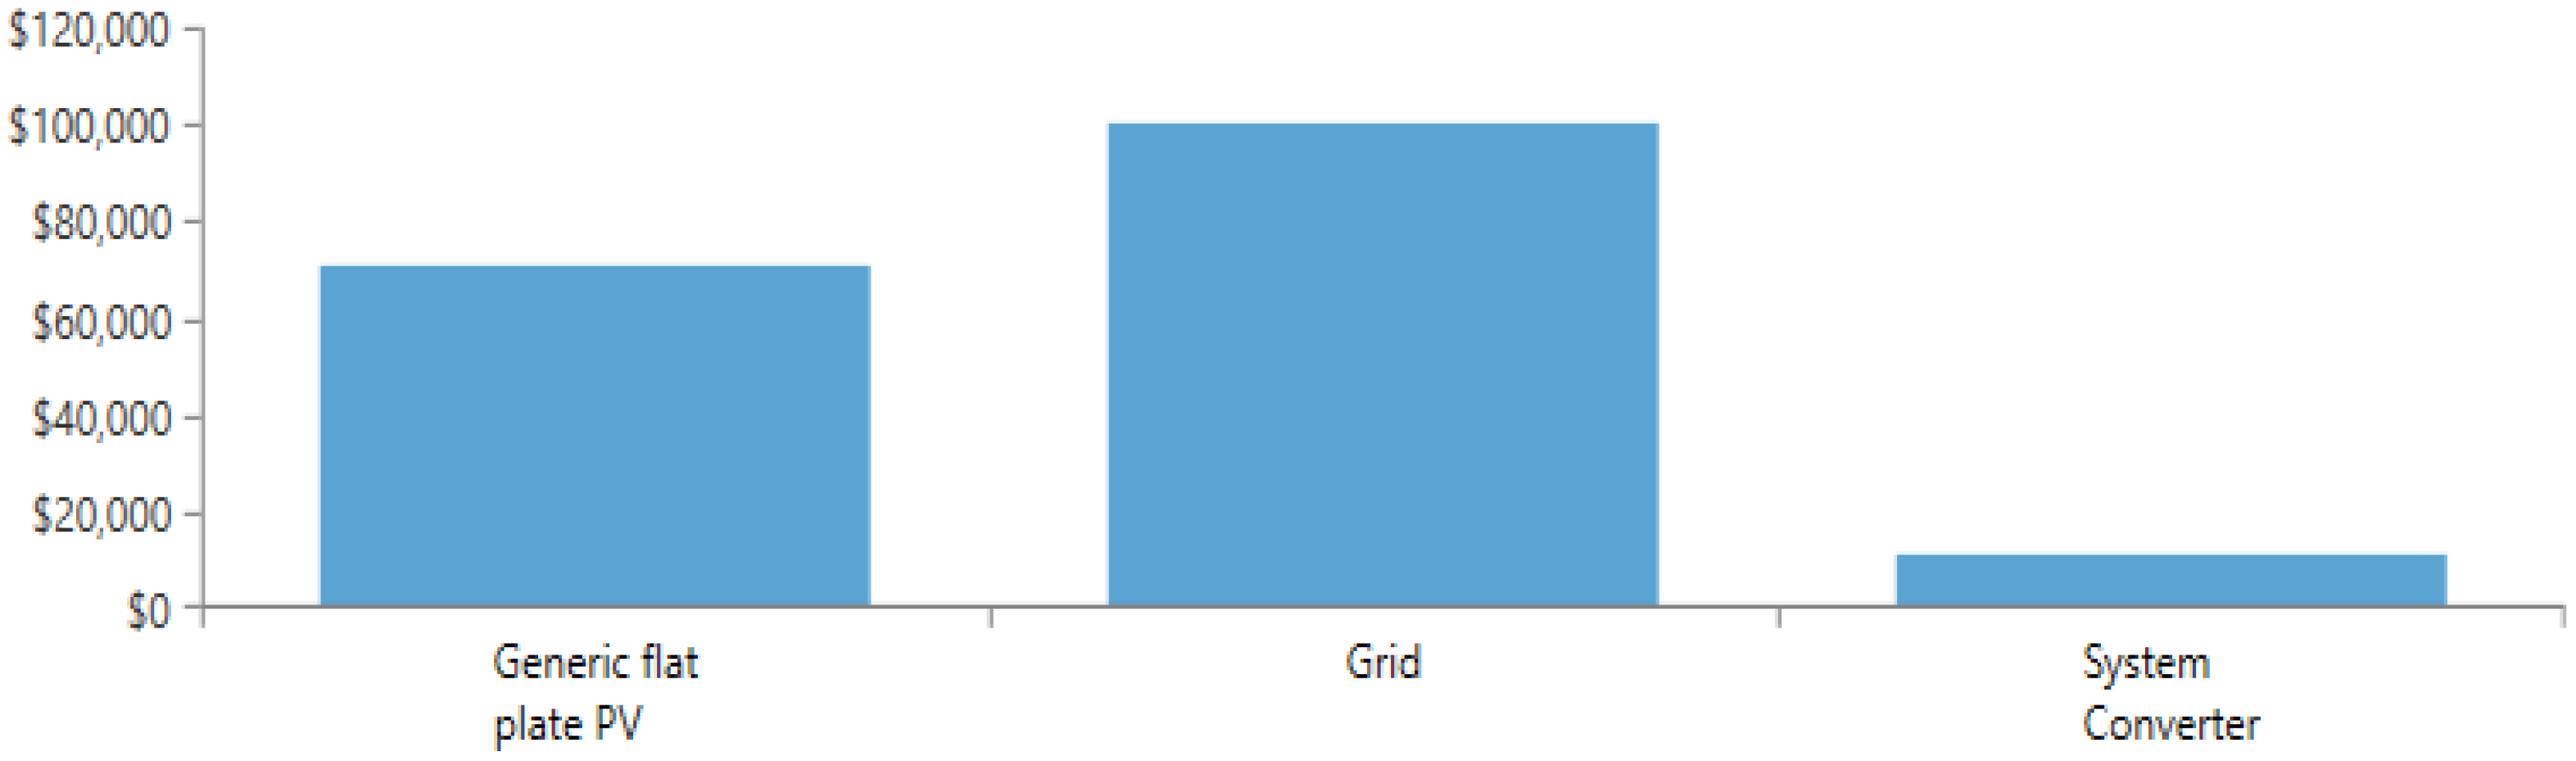
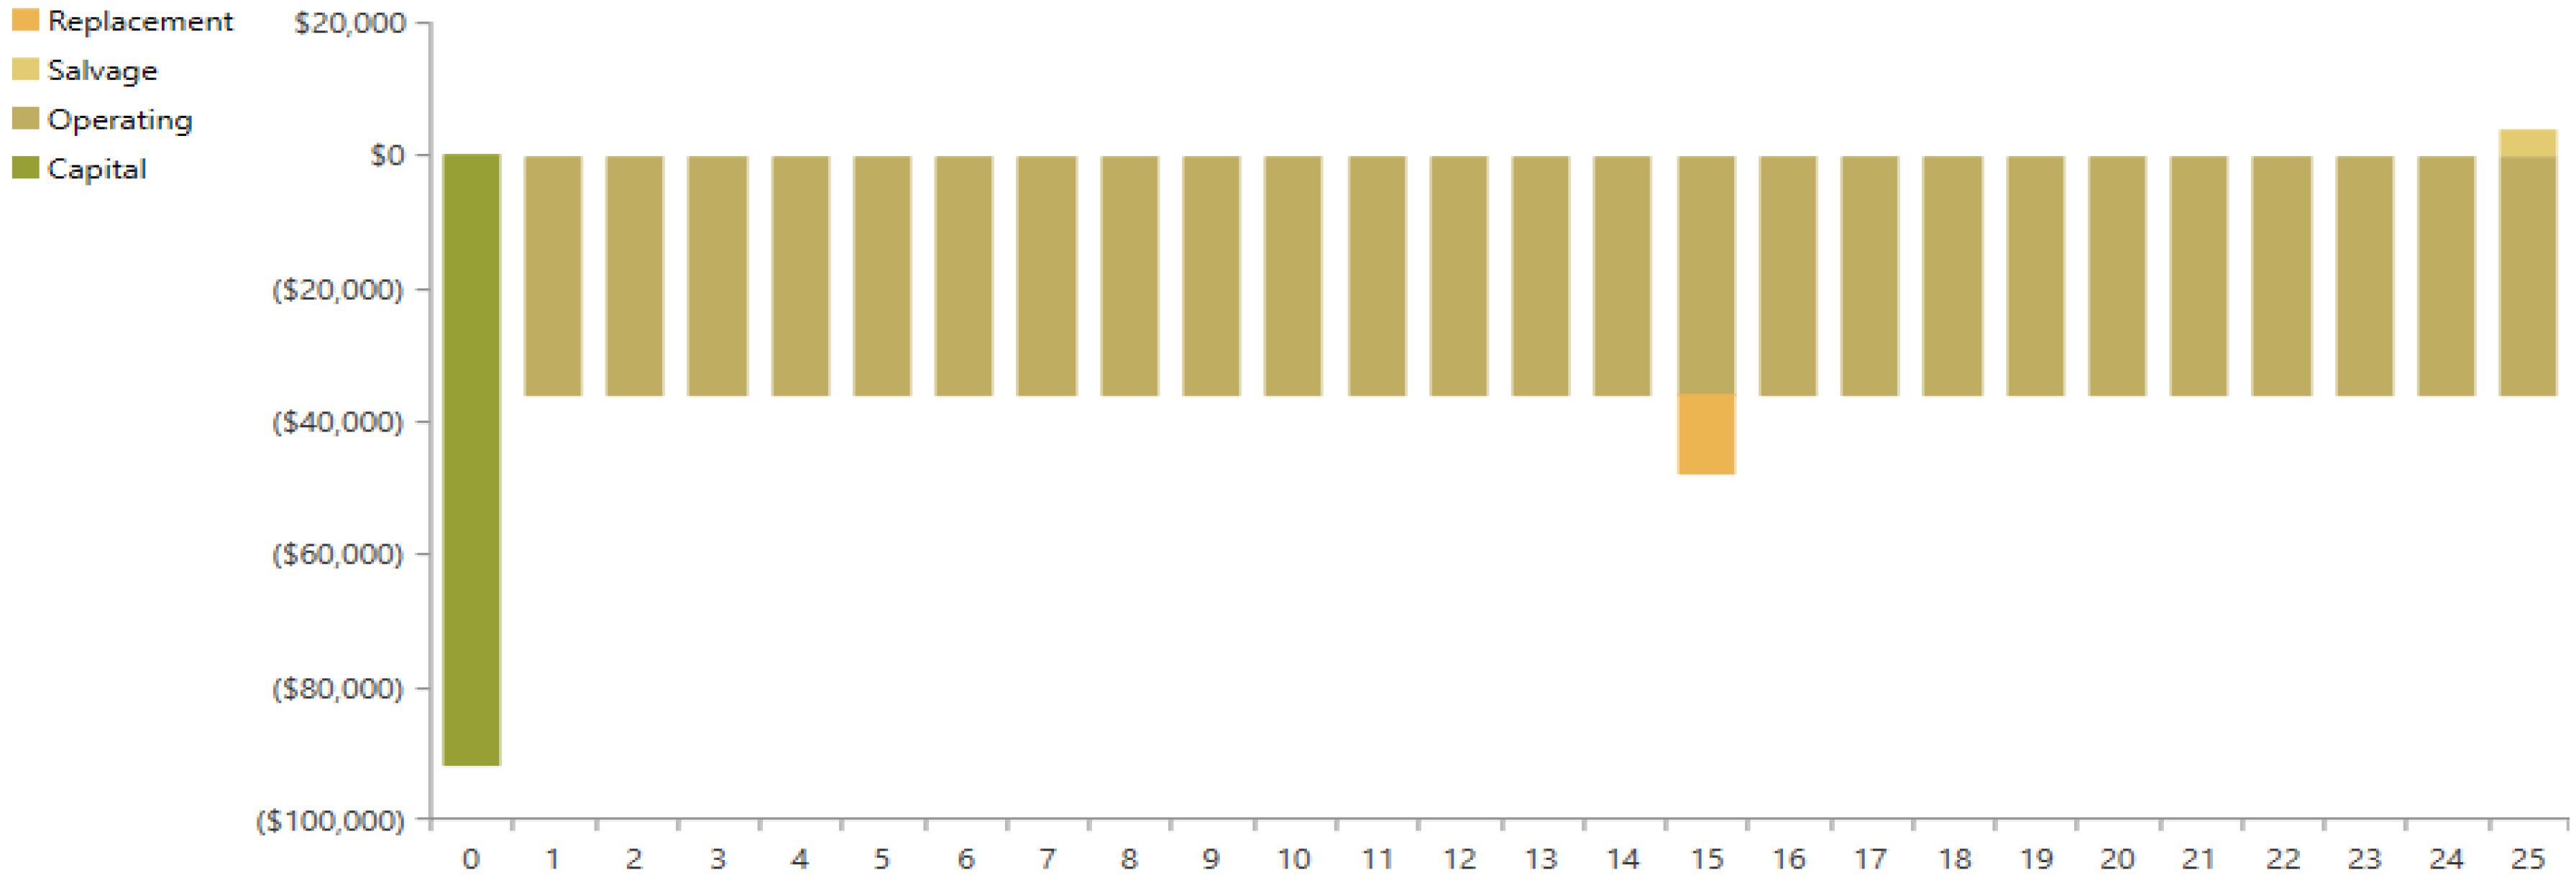
| Component | Capital ($) | Replacement ($) | O&M ($) | Fuel ($) | Salvage ($) | Total ($) |
|---|---|---|---|---|---|---|
| Generic/flat plate PV | 75,000.00 | 0 | 31,958.39 | 0 | 0 | 106,958.39 |
| Grid | 4500.00 | 0 | 445,014.95 | 0 | 0 | 449,514.95 |
| System Converter | 12,292.50 | 5129.23 | 0 | 0 | 954.71 | 16,467.02 |
| System | 91,792.50 | 5129.23 | 476,973.34 | 0 | 954.71 | 572,940.36 |
| Cities and Main COMPANIES | Pv (kW) | Converter (kW) | Production (kW/Year) | COE ($) | NPC ($) | Simple Payback (Year) | Operating Cost ($) | Initial Cost ($) | RF % | Saved CO2 (kg/Year) | |
|---|---|---|---|---|---|---|---|---|---|---|---|
| Casablanca | 1 | 554 | 750 | 938,907 | 0.069 | 1.91 M | 2.88 | 132,541 | 215,625 | 39.9 | 469,232 |
| 2 | 300 | 246 | 508,739 | 0.057 | 761,546 | 2.93 | 51,028 | 109,235 | 46.7 | 211,753 | |
| 3 | 120 | 97.7 | 203,496 | 0.053 | 264,823 | 3.18 | 17,089 | 46,365 | 50 | 78,000 | |
| 4 | 604 | 507 | 1,024,262 | 0.084 | 5.01M | 2.39 | 374,756 | 216,105 | 21 | 606,241 | |
| 5 | 75 | 62 | 127,185 | 0.062 | 221,564 | 3.14 | 14,931 | 30,695 | 43.6 | 56,821 | |
| 6 | 40 | 32.5 | 67,832 | 0.043 | 60,573 | 2.17 | 3295 | 3295 | 59.1 | 20,372 | |
| 7 | 50 | 40.4 | 84,790 | 0.05 | 96,304 | 3.75 | 5819 | 21,932 | 53.7 | 43,755 | |
| 8 | 65 | 53 | 110,227 | 0.043 | 100,185 | 3.74 | 5711 | 27,178 | 58.2 | 34,009 | |
| Tanger | 1 | 650 | 514 | 1,068,053 | 0.069 | 2.44 M | 2.67 | 172,929 | 231,988 | 36.8 | 539,373 |
| 2 | 320 | 262 | 525,811 | 0.07 | 1.24 M | 3.01 | 88,228 | 116,203 | 36.1 | 268,872 | |
| 3 | 520 | 426 | 854,443 | 0.066 | 1.74 M | 2.75 | 120,578 | 186,078 | 39.7 | 409,229 | |
| 4 | 350 | 282 | 575,106 | 0.049 | 642,671 | 2.84 | 40,385 | 126,416 | 53.2 | 200,435 | |
| 5 | 350 | 285 | 575,100 | 0.06 | 955,512 | 2.91 | 64,845 | 126,845 | 44.3 | 250,038 | |
| 6 | 65 | 52.6 | 106,514 | 0.035 | 70,613 | 3.02 | 3400 | 27,154 | 64.4 | 26,994 | |
| 7 | 75 | 60 | 123,237 | 0.066 | 244,172 | 3.16 | 16,707 | 30,954 | 40.5 | 58,046 | |
| Meknes | 1 | 45 | 37 | 76,477 | 0.024 | 31,455 | 4.63 | 26,200 | 20,214 | 72 | 15,060 |
| 2 | 45 | 39 | 76,470 | 0.084 | 356,677 | 4.75 | 26,310 | 20,346 | 22 | 45,112 | |
| 3 | 50 | 40 | 84,974 | 0.047 | 88,269 | 4.67 | 5189 | 21,934 | 55.6 | 28,211 | |
| Salé | 1 | 120 | 98 | 206,210 | 0.06 | 340,123 | 2.95 | 22,977 | 46,398 | 44.6 | 90,502 |
| 2 | 150 | 124 | 257,762 | 0.063 | 473,073 | 2.82 | 32,551 | 56,959 | 42.1 | 119,551 | |
| 3 | 175 | 144 | 300,722 | 0.075 | 863,102 | 2.35 | 62,385 | 65,618 | 31.6 | 165,125 | |
| Marrakech | 1 | 920 | 787 | 1,556,028 | 0.093 | 20.3 M | 2.37 | 1.56 M | 327,736 | 8.7 | 1,476,360 |
| Agadir | 1 | 650 | 553 | 1,195,707 | 0.093 | 15.1 M | 2.18 | 1.16 M | 232,704 | 10 | 716,795 |
| 2 | 460 | 379 | 846193 | 0.063 | 1.53 M | 2.46 | 106,910 | 165,210 | 42.1 | 369,420 | |
| 3 | 560 | 474 | 1,030,148 | 0.087 | 6.7 M | 2.09 | 508,371 | 200,960 | 16.3 | 615,858 | |
| Settat | 1 | 920 | 751 | 1,549,333 | 0.096 | 42.6 M | 2.37 | 3.30 M | 325,559 | 5% | 927,136 |
| 2 | 650 | 536 | 1,094,637 | 0.082 | 4.81 M | 2.41 | 358,412 | 231,683 | 22.8 | 642,354 | |
Publisher’s Note: MDPI stays neutral with regard to jurisdictional claims in published maps and institutional affiliations. |
© 2022 by the authors. Licensee MDPI, Basel, Switzerland. This article is an open access article distributed under the terms and conditions of the Creative Commons Attribution (CC BY) license (https://creativecommons.org/licenses/by/4.0/).
Share and Cite
Smouh, S.; Gargab, F.Z.; Ouhammou, B.; Mana, A.A.; Saadani, R.; Jamil, A. A New Approach to Energy Transition in Morocco for Low Carbon and Sustainable Industry (Case of Textile Sector). Energies 2022, 15, 3693. https://doi.org/10.3390/en15103693
Smouh S, Gargab FZ, Ouhammou B, Mana AA, Saadani R, Jamil A. A New Approach to Energy Transition in Morocco for Low Carbon and Sustainable Industry (Case of Textile Sector). Energies. 2022; 15(10):3693. https://doi.org/10.3390/en15103693
Chicago/Turabian StyleSmouh, Slimane, Fatima Zohra Gargab, Badr Ouhammou, Abdel Ali Mana, Rachid Saadani, and Abdelmajid Jamil. 2022. "A New Approach to Energy Transition in Morocco for Low Carbon and Sustainable Industry (Case of Textile Sector)" Energies 15, no. 10: 3693. https://doi.org/10.3390/en15103693