Article

Scenarios to Decarbonize Austria’s Energy Consumption and the Role of Underground Hydrogen Storage

1
Innovation Engineering & Management, University of Applied Sciences, 4600 Wels, Austria
2
OMV E&P, New Technology, Protteser Str. 40, 2230 Gaenserndorf, Austria
*
Author to whom correspondence should be addressed.
Energies 2022, 15(10), 3742; https://doi.org/10.3390/en15103742
Submission received: 2 April 2022 / Revised: 5 May 2022 / Accepted: 9 May 2022 / Published: 19 May 2022

Abstract

:
The European Union is aiming at reaching greenhouse gas (GHG) emission neutrality in 2050. Austria’s current greenhouse gas emissions are 80 million t/year. Renewable Energy (REN) contributes 32% to Austria’s total energy consumption. To decarbonize energy consumption, a substantial increase in energy generation from renewable energy is required. This increase will add to the seasonality of energy supply and amplifies the seasonality in energy demand. In this paper, the seasonality of energy supply and demand in a Net-Zero Scenario are analyzed for Austria and requirements for hydrogen storage derived. We looked into the potential usage of hydrogen in Austria and the economics of hydrogen generation and technology and market developments to assess the Levelized Cost of Hydrogen (LCOH). Then, we cover the energy consumption in Austria followed by the REN potential. The results show that incremental potential of up to 140 TWh for hydropower, photovoltaic (PV), and wind exists in Austria. Hydropower generation and PV is higher in summer- than in wintertime, while wind energy leads to higher energy generation in wintertime. The largest incremental potential is PV, with agrivoltaic systems significantly increasing the area amenable for PV compared with PV usage only. Battery Electric Vehicles (BEV) and Fuel Cell Vehicles (FCV) use energy more efficiently than Internal Combustion Engine (ICE) cars; however, the use of hydrogen for electricity generation significantly decreases the efficiency due to electricity–hydrogen–electricity conversion. The increase in REN use and the higher demand for energy in Austria in wintertime require seasonal storage of energy. We developed three scenarios, Externally Dependent Scenario (EDS), Balanced Energy Scenario (BES) or Self-Sustained Scenario (SSS), for Austria. The EDS scenario assumes significant REN import to Austria, whereas the SSS scenario relies on REN generation within Austria. The required hydrogen storage would be 10.82 bn m3 for EDS, 13.34 bn m3 for BES, and 18.69 bn m3 for SSS. Gas and oil production in Austria and the presence of aquifers indicates that sufficient storage capacity might be available. Significant technology development is required to be able to implement hydrogen as an energy carrier and to balance seasonal energy demand and supply.

1. Introduction

In 2021, the European Union (EU) established a framework for achieving climate neutrality in 2050 [1]. The regulation sets a binding objective of climate neutrality in the European Union by 2050. In addition, it sets a European Union target of net domestic reduction in greenhouse gas emissions by at least 55%, compared to 1990 levels, by 2030. The aim is to limit global warming to 1.5 °C above pre-industrial levels to limit the impact of global warming, as based on the assessment of the Intergovernmental Panel on Climate Change (IPCC) [2]. To achieve this target, the EU issued a directive to increase the use of energy from renewable sources to 38–40% by 2030 [3]. Hydrogen is seen as a key priority to achieve the European Green Deal [4] and Europe’s clean energy transition [5].
The International Energy Agency (IEA) forecasts substantial short-term additions in renewable energy capacity in Europe until 2025 [6]. The major increase in renewable energy in Europe is expected to come from photovoltaic (PV) followed by wind energy [6]. The share of renewables in total energy supply is forecasted to increase to 75% in the Net-Zero Emission Scenario (NZE) of the IEA [7]. Austria issued a law in 2021 with the aim of increasing the share of renewable energy (REN) by 2030 and reaching carbon neutrality by 2040 [8]. The law aims at increasing electricity generation from PV by 11 TWh, from wind by 10 TWh, from hydropower by 5 TWh and biomass by 1 TWh until 2030 [8].
Recently, the European Commission issued a communication as a response to the Russian invasion of the Ukraine [9]. The EU announced a phasing out of its dependence on fossil fuels from Russia before 2030. To do so, the EU intends to increase the resilience of the EU-wide energy system. This includes the electrification of Europe by adding wind and PV capacities but also boosting green hydrogen production and imports, as well as electrification of and hydrogen use in energy-intensive industries. Austria is following a similar strategy with the aim of accelerating the use of REN, producing hydrogen from REN and importing hydrogen to substantially decrease the dependency on fossil fuel until 2030 [10].
The challenge of using REN is the fluctuating energy supply from PV, wind, and hydropower (e.g., [11,12]). Integrating large amounts of REN needs to address the flexibility of the system on intraday, day-ahead planning and seasonal energy fluctuations (e.g., [13,14,15]). Several options exist for storing electricity. These include pumped hydro storage (PHS), compressed air energy storage (CAES), batteries, and flywheels (e.g., [16,17]). The preferred option for storing large amounts of electricity from REN for a long period of time is hydrogen storage, owing to the large volumes of energy that can be stored [18] (Figure 1). Short-term storage is not included in our further analysis and will require different technologies than hydrogen storage, as shown in Figure 1.
Concerning hydrogen storge, electricity could be used to generate hydrogen, which is then stored in the subsurface (e.g., [19,20]). Underground Hydrogen Storage (UHS) can be done in different geological structures, such as salt caverns, abandoned conventional mines, depleted gas reservoirs, depleted oil reservoirs or aquifers (e.g., [21,22]). Injecting hydrogen for seasonal storage favours the use of depleted gas and oil reservoirs or aquifers, owing to the large volumes of hydrogen that need to be stored (e.g., [23,24]). Various issues need to be addressed in UHS, including hydrogen-brine-rock geochemical reactions, microbial growth in the reservoir, mixing of gases, and geomechanics (e.g., [25,26,27]).
Here, we are going to investigate the impact of substantially increased renewable energy generation on the potential for using and implementing Underground Hydrogen Storage in Austria.
The paper is based on the not-peer-reviewed paper SPE 209627-MS, published in the conference proceedings of the SPE Europec 2022, which will be held 5–9 June 2022.
The paper is structured as follows: In the next paragraph, the potential generation, storage and use of hydrogen in Austria is described. Then, the current energy generation and usage in Austria is discussed, including the scenarios for energy generation in 2050 and resulting hydrogen storage requirements.

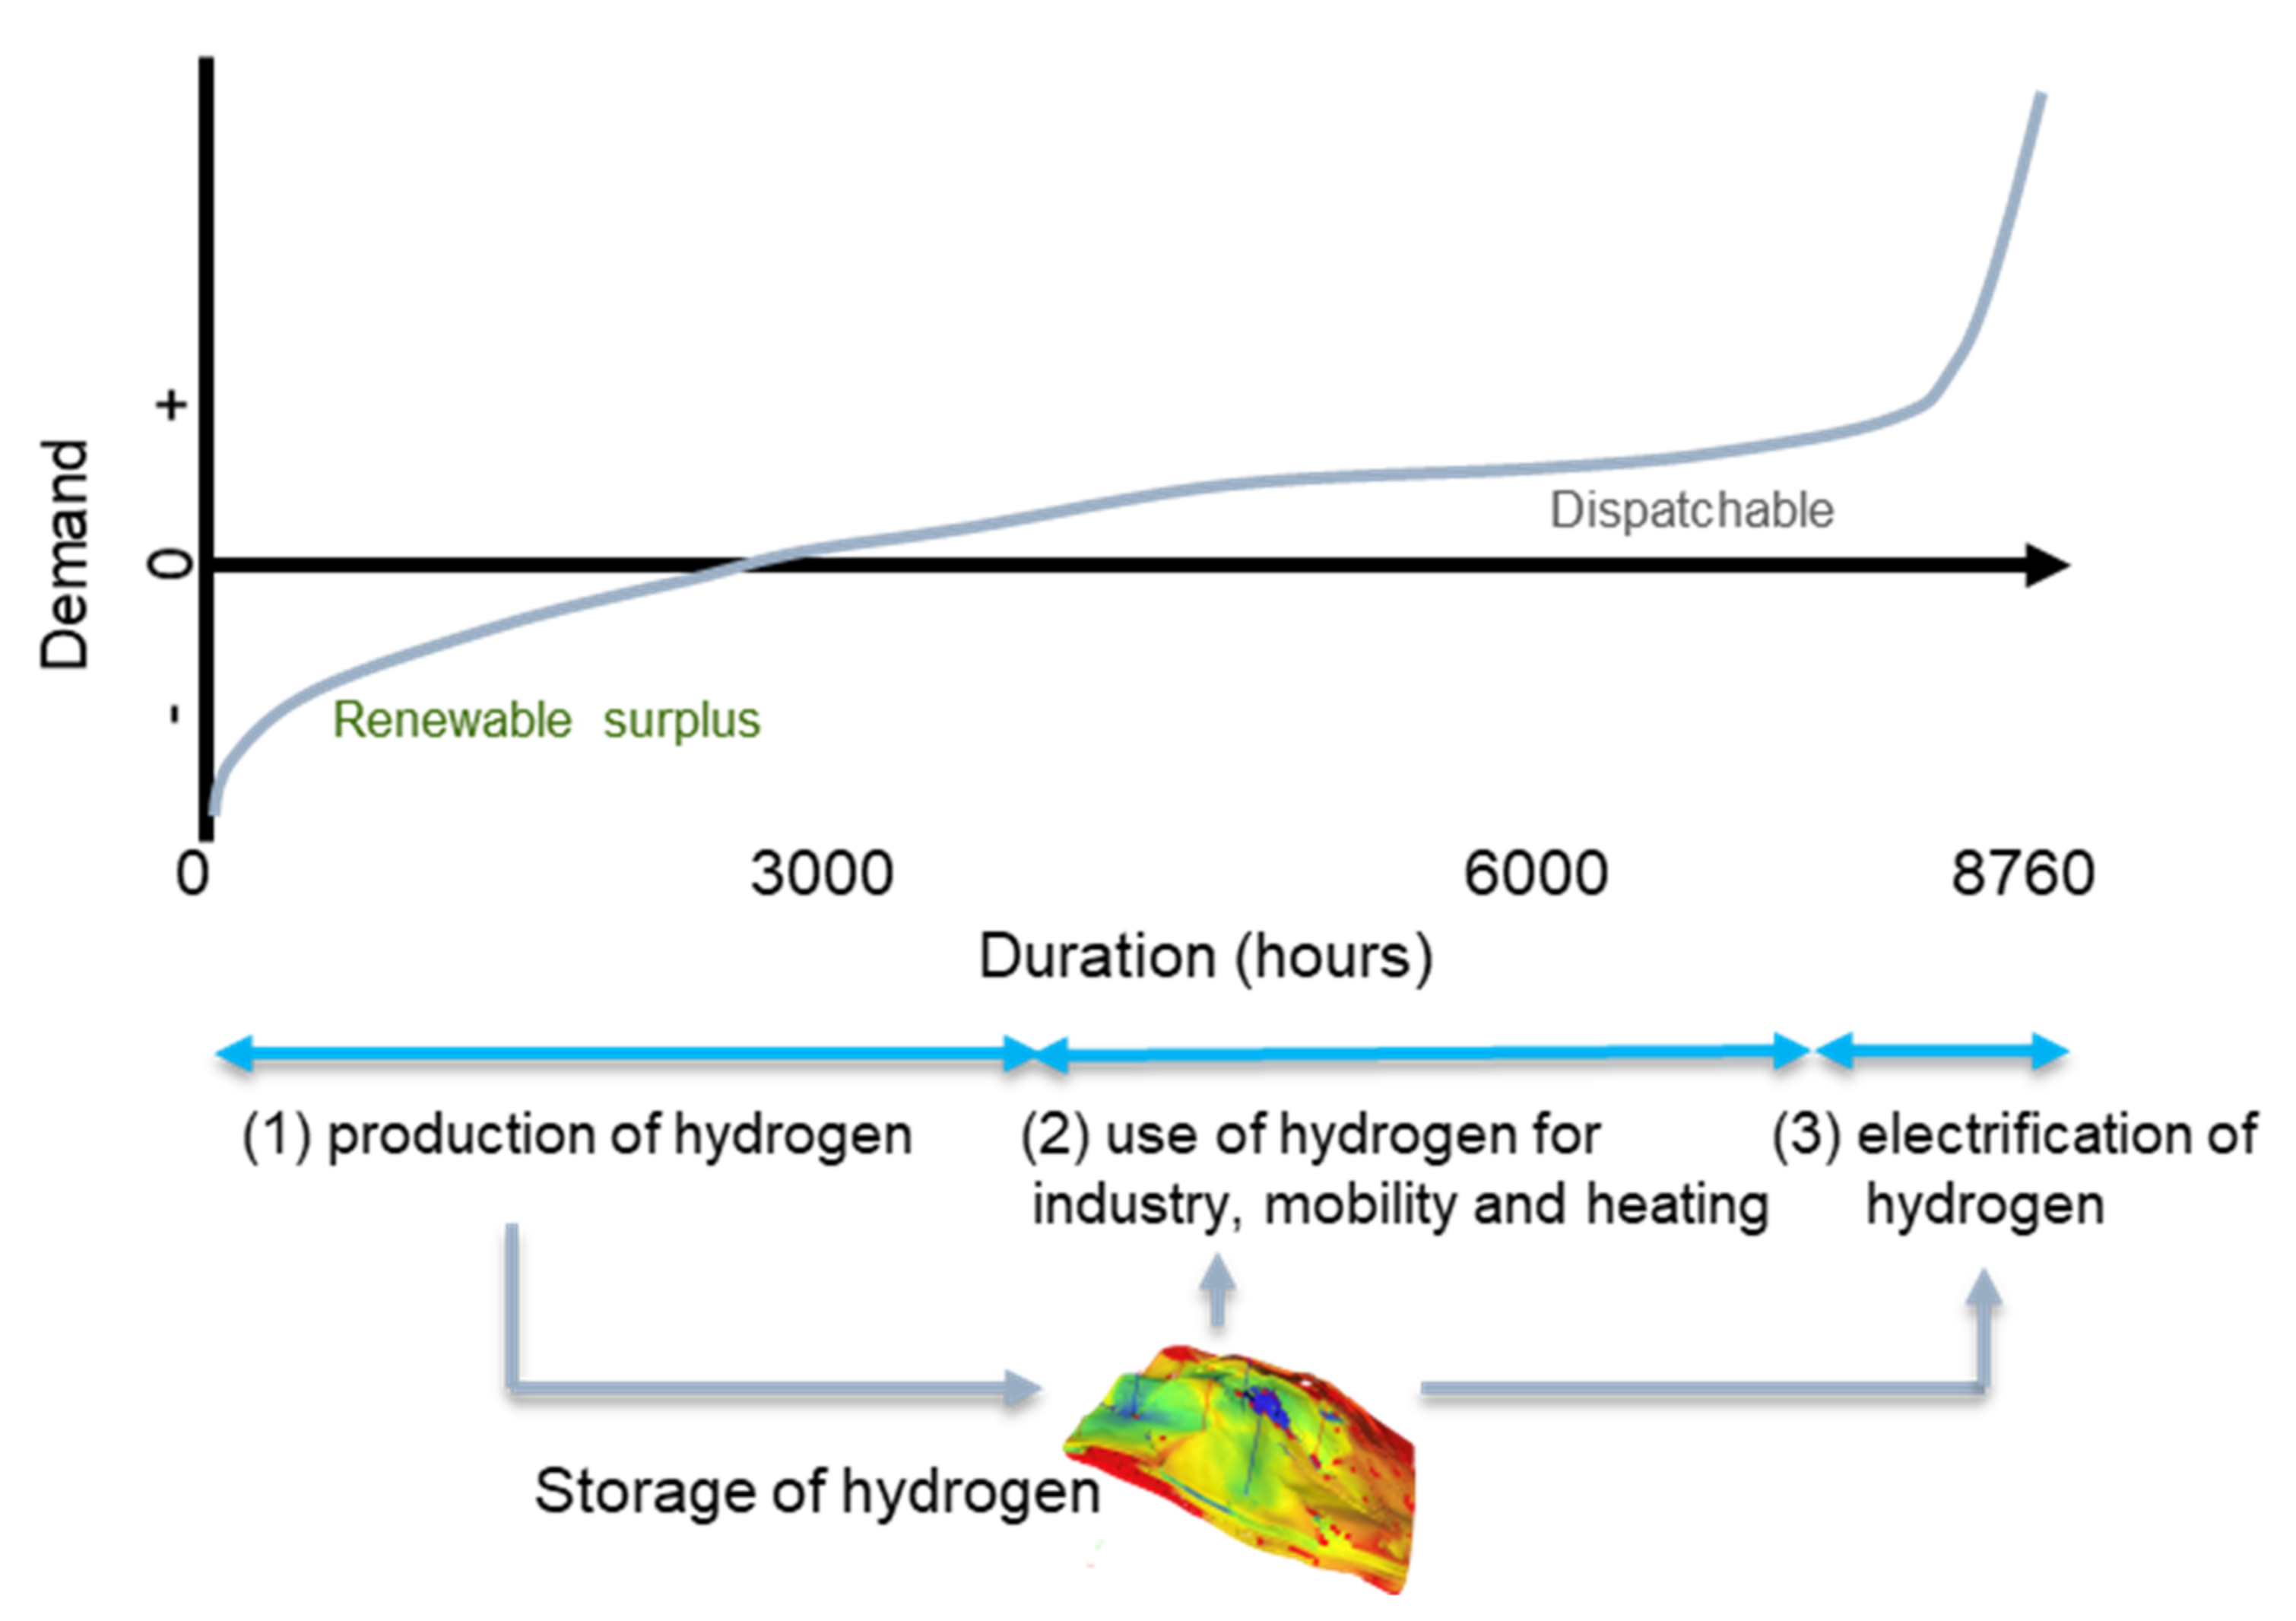
2. Potential Generation, Storage and Use of Hydrogen in Austria

In 2020, about 150,000 t of hydrogen were used in Austria [28]. The hydrogen used in Austria is currently generated from fossil fuels. Figure 2 shows the potential generation, storage, and usage of hydrogen in Austria. Electricity which is generated from REN sources could be used to generate hydrogen, which is then stored in the subsurface. The generated hydrogen could be supplied to the grid or stored in short-term or seasonal storage sites and then used for multiple purposes.
Various potential uses for hydrogen supplied from a hydrogen gas grid are shown on the right part of Figure 2.
Building heating: in Austria, 49.8% of households have a central heating system and 11.8% a gas heating system covering one floor. In 2020, 27.3% of the used heating systems burned gas and 16% oil [29]. Hydrogen can replace natural gas and heating oil as an energy carrier for heating. Currently, 10% of hydrogen is allowed to be added to the natural gas network in Austria [30]. To use larger parts of the gas network for hydrogen, several options were studied and challenges identified (e.g., [31,32]), and the challenges include the distribution network but also the heating system in households.
Aviation: in aviation, about 0.83 Mt of kerosene were used in Austria, emitting 2.61 Mt CO2 in 2018 ([33]). Hydrogen can be used as a replacement for fossil fuels but requires significant research and development in aviation (e.g., [34,35]).
Transport sector and ferry and cargo ships: in the transport sector, heavy road transport is forecasted to be satisfied by a mixture of technologies; out of those, 55% are expected to be hydrogen related [36]. For light-duty vehicles, the sales of electric vehicles are expected to increase substantially (e.g., [37]). The generation of a hydrogen network might lead to opportunities for fuel cell light-duty cars [38]. The reason is that a hydrogen network might be generated allowing cars to be refuelled at various places. The share of the energy consumption of transport in Austria is about 36.1%. The emissions from light-duty vehicles were 14.9 mn tCO2 and from heavy duty 8.7 mn tCO2 in 2019 [39]. For heavy-duty cars, hydrogen fuel cell vehicles might be developed to allow for longer-distance travelling and faster charging times.
Industry feedstock: hydrogen could be supplied to various industry sectors to decarbonise production. CO2 emissions from industry in Austria amounted to 28.4 mn tCO2 in 2020 excluding public electricity and heat generation [40]. In 2018, the main contributors were the iron and steel industry with 11.3 mn tCO2, other industries (energy related emissions) 9.2 mn tCO2, mineral industry (e.g., cement) 2.9 mn tCO2, and refinery with 2.8 mn tCO2. The technologies to use hydrogen for these industries to reduce CO2 emissions are currently developed (e.g., [41,42,43,44,45]).
Electricity generation: renewable energy contributes to about 77% of the electricity generation in Austria [46]. Hydrogen can be used as fuel to generate CO2 free electricity (e.g., [36,47]). In an electricity shortage situation, at peak demand, high electricity prices are expected, which allow for conversion of hydrogen into electricity (e.g., [48]) by using gas turbines or fuel cells (e.g., [49,50]).
A by-product of hydrogen generation from water electrolysis is oxygen (light-blue arrow in Figure 2). The oxygen might be supplied to oxy-fuel combustion of biomass (e.g., [51,52]) (see bottom left, Figure 2). The heat from the oxy-fuel power plant and the electricity could be fed into the respective grids. The CO2 can be cost-efficiently separated from the exhaust gas and geologically stored. Synthetic fuels could be generated by using CO2 and hydrogen (e.g., [53,54]). The synthetic fuel can be used for various purposes in the transport sector but also as industry feedstock (bottom right of Figure 2). Synthetic fuels might be particularly attractive for long-haul flights but a number of challenges need to be overcome before hydrogen can be used for long distances (e.g., [34,55]).
The various components of the hydrogen–electricity system, as shown in Figure 2, are at different Technology Readiness Levels (TRLs). The TRLs used here are based on [56]. Renewable Energy (REN) generation is proven in an operational environment (TRL 9). Several improvements and extensions of REN generation are currently tested in an operational environment (e.g., agrivoltaic). Electrolysis is a proven technology using alkaline electrolysis; however, potentially cost-competitive options, such as Proton Exchange Membrane (PEM), require more developments and need to prove the cost benefits (IEA 2019). Underground Hydrogen Storage (UHS) in porous media is tested in a relevant environment and at TRL 5. Large-scale hydrogen distribution requires additional research concerning hydrogen network and usage in households, industry, and aviation—in some of those areas, the TRL is 5, in others, 3. Conversion of hydrogen into electricity using turbines or fuel cells is at TRL 4. Oxyfuel combustion of biomass or the alternative CO2 air capture is at TRL 5, as some pilot plant tests were performed [57]. CO2 storage is applied in a number of cases, hence, at TRL 9. The generation of CO2-emission-neutral synthetic fuels is at various TRLs of 3 to 5, dependent on the application. Industry feedstock is at a lower TRL than synthetic fuels for transport.
Various authors forecast that the Levelized Costs of Hydrogen (LCOH) generation from REN will be competitive with other sources of hydrogen and methane in the future (e.g., [47,58]). More details on the economics of hydrogen are described in Appendix A.
The sections above covered general aspects of hydrogen generation, storage and usage in a net-zero CO2 emission scenario. In the next section, the current energy use in Austria is described to cover the current CO2 emissions. Then, the potential for renewable energy generation in Austria is given. Afterwards, scenarios for renewable energy usage in Austria are developed based on the potential of renewables and annual variations in renewable energy generation.

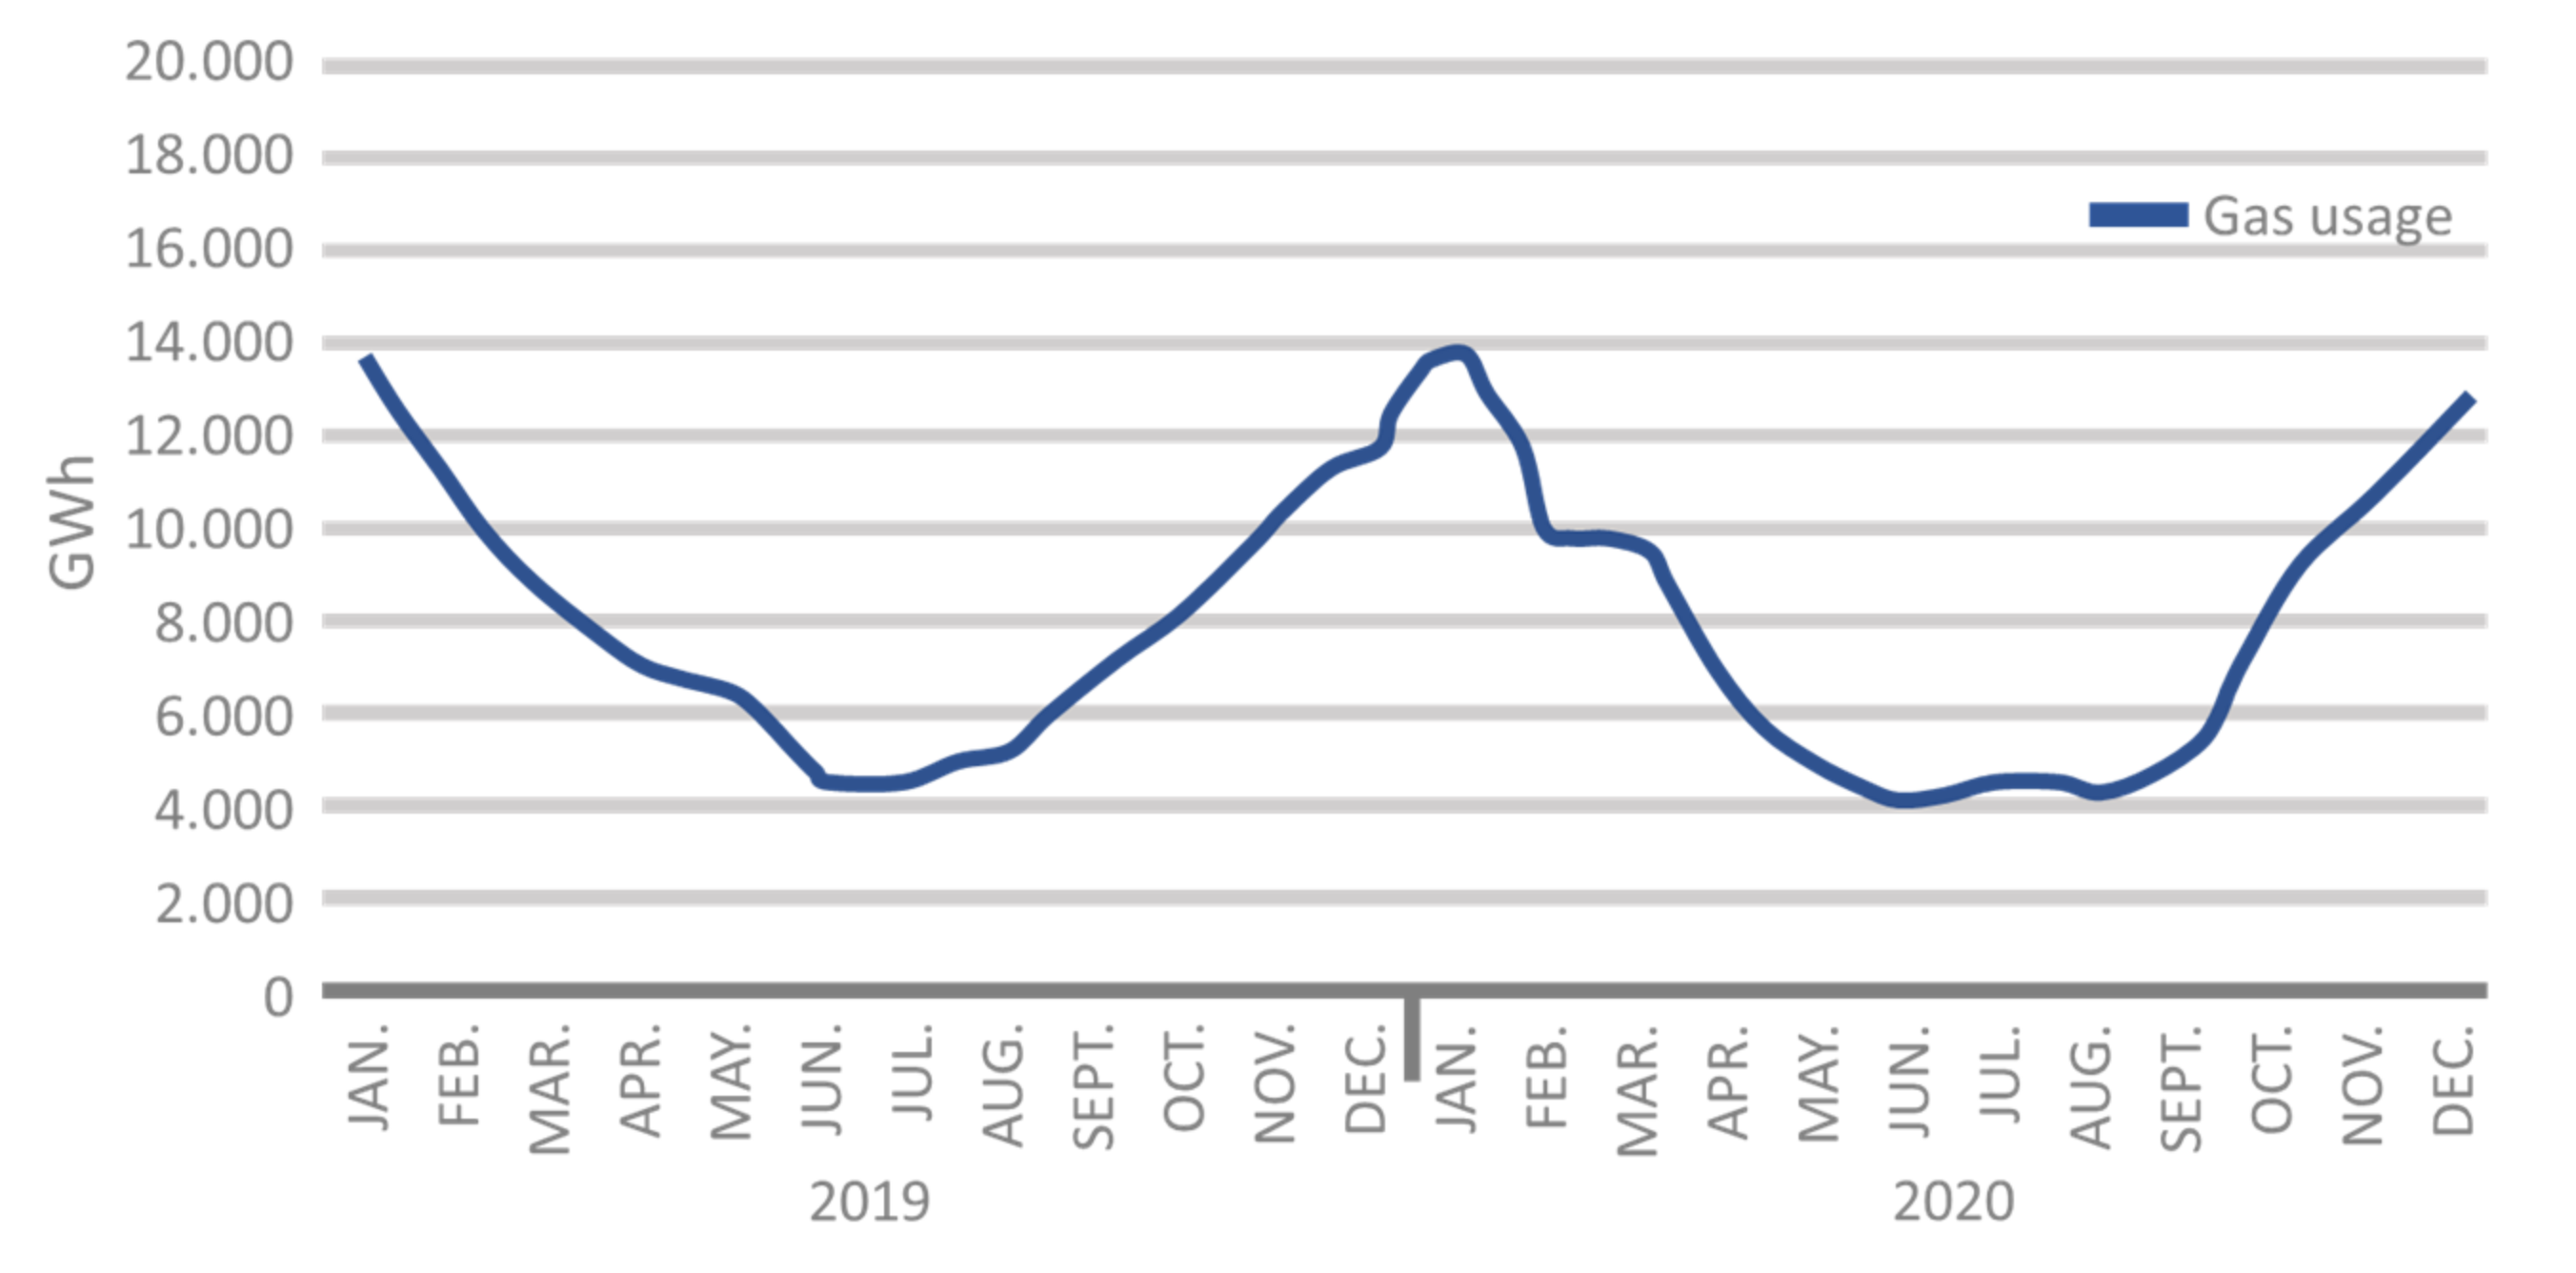
3. Energy Use Austria

The development of the mix of the used energy in Austria in the years 1970–2020 is shown in Figure 3. The largest amount of the consumed energy in Austria in 2020 was provided by oil (34%), followed by electrical energy (21%) and gas (18%).
The electricity balance in Austria over the year 2020 is shown in Figure 4. Austria emitted about 160 gCO2/kWh of electricity produced, which is significantly below the IEA average [60]. The reason is the large contribution of hydropower in the energy mix (Figure 4). Due to the higher runoff in summertime, there is a seasonal effect in the electricity generation from hydropower. In 2020, a cumulative amount of 22.3 TWh of electricity was exported and 24.5 TWh of electricity imported to Austria. The physical import of electricity and electricity generation from thermal power stations are higher in wintertime than in summertime to balance the electricity consumption in winter. The electricity that is imported to Austria is generated with higher CO2 intensity than the electricity generated in Austria and needs to be replaced in a net-zero emission scenario. That said, 75% of the thermal power shown in Figure 4 is generated from fossil fuels and the remainder by using biofuel (E-Control 2021).
The largest fluctuation in energy consumption is related to heating in wintertime. Figure 5 shows the changes in gas consumption in Austria in 2019–2020. The difference in gas consumption is more than a factor of three, comparing July and January. In Austria, several Underground Gas Storage (UGS) fields with a total volume of 8.4 bn m3 are used to balance gas supply and demand [60].

4. Potential of Renewable Energy in Austria

Renewable Energy contributed 32.6% to the total energy consumption in Austria in 2017 [61]. The amount of electricity generated from REN was 50.8 TWh, the amount of heat generated from REN was 52.2 TWh, and biofuels 5.8 TWh [61]. The contribution of the various REN energy sources to electricity and power is depicted in Figure 6.
Biomass has the biggest share of the REN-generated heat, followed by district heat using biomass. Hydropower dominates electricity generation, followed by wind and biomass. The largest increase in REN electricity generation within the last decade was achieved by wind energy, which provided 6.6 TWh in 2018.
In the following section, the potential of the various REN sources in Austria is described.

4.1. Hydropower

Austria uses a substantial amount of hydropower for electricity generation. From 2005 until 2019, the electricity generation by hydropower grew by 0.7% per year. There is potential to further increase hydropower electricity generation from 38.4 TWh in 2017 by 11 TWh until 2050. The total capacity of hydropower in Austria is higher than 11 TWh; however, places in environmentally sensitive areas need to be subtracted from the theoretical potential, leading to an incremental potential of about 11 TWh [62].

4.2. Wind Energy

Wind energy contributed 6.6 TWh to the electricity generation in Austria in 2017. While in 2014, 407 MW wind energy capacity was added, the capacity additions in Austria slowed down to 120 MW in 2019. Adding wind energy capacity is challenging, owing to restrictions related to the distance of wind turbines to houses, environmentally sensitive areas, biological activity, and recreation aspects. The incremental potential for energy generation by wind energy is estimated as 12 TWh [63] or 22.4 TWh [64].

4.3. Geothermal Energy
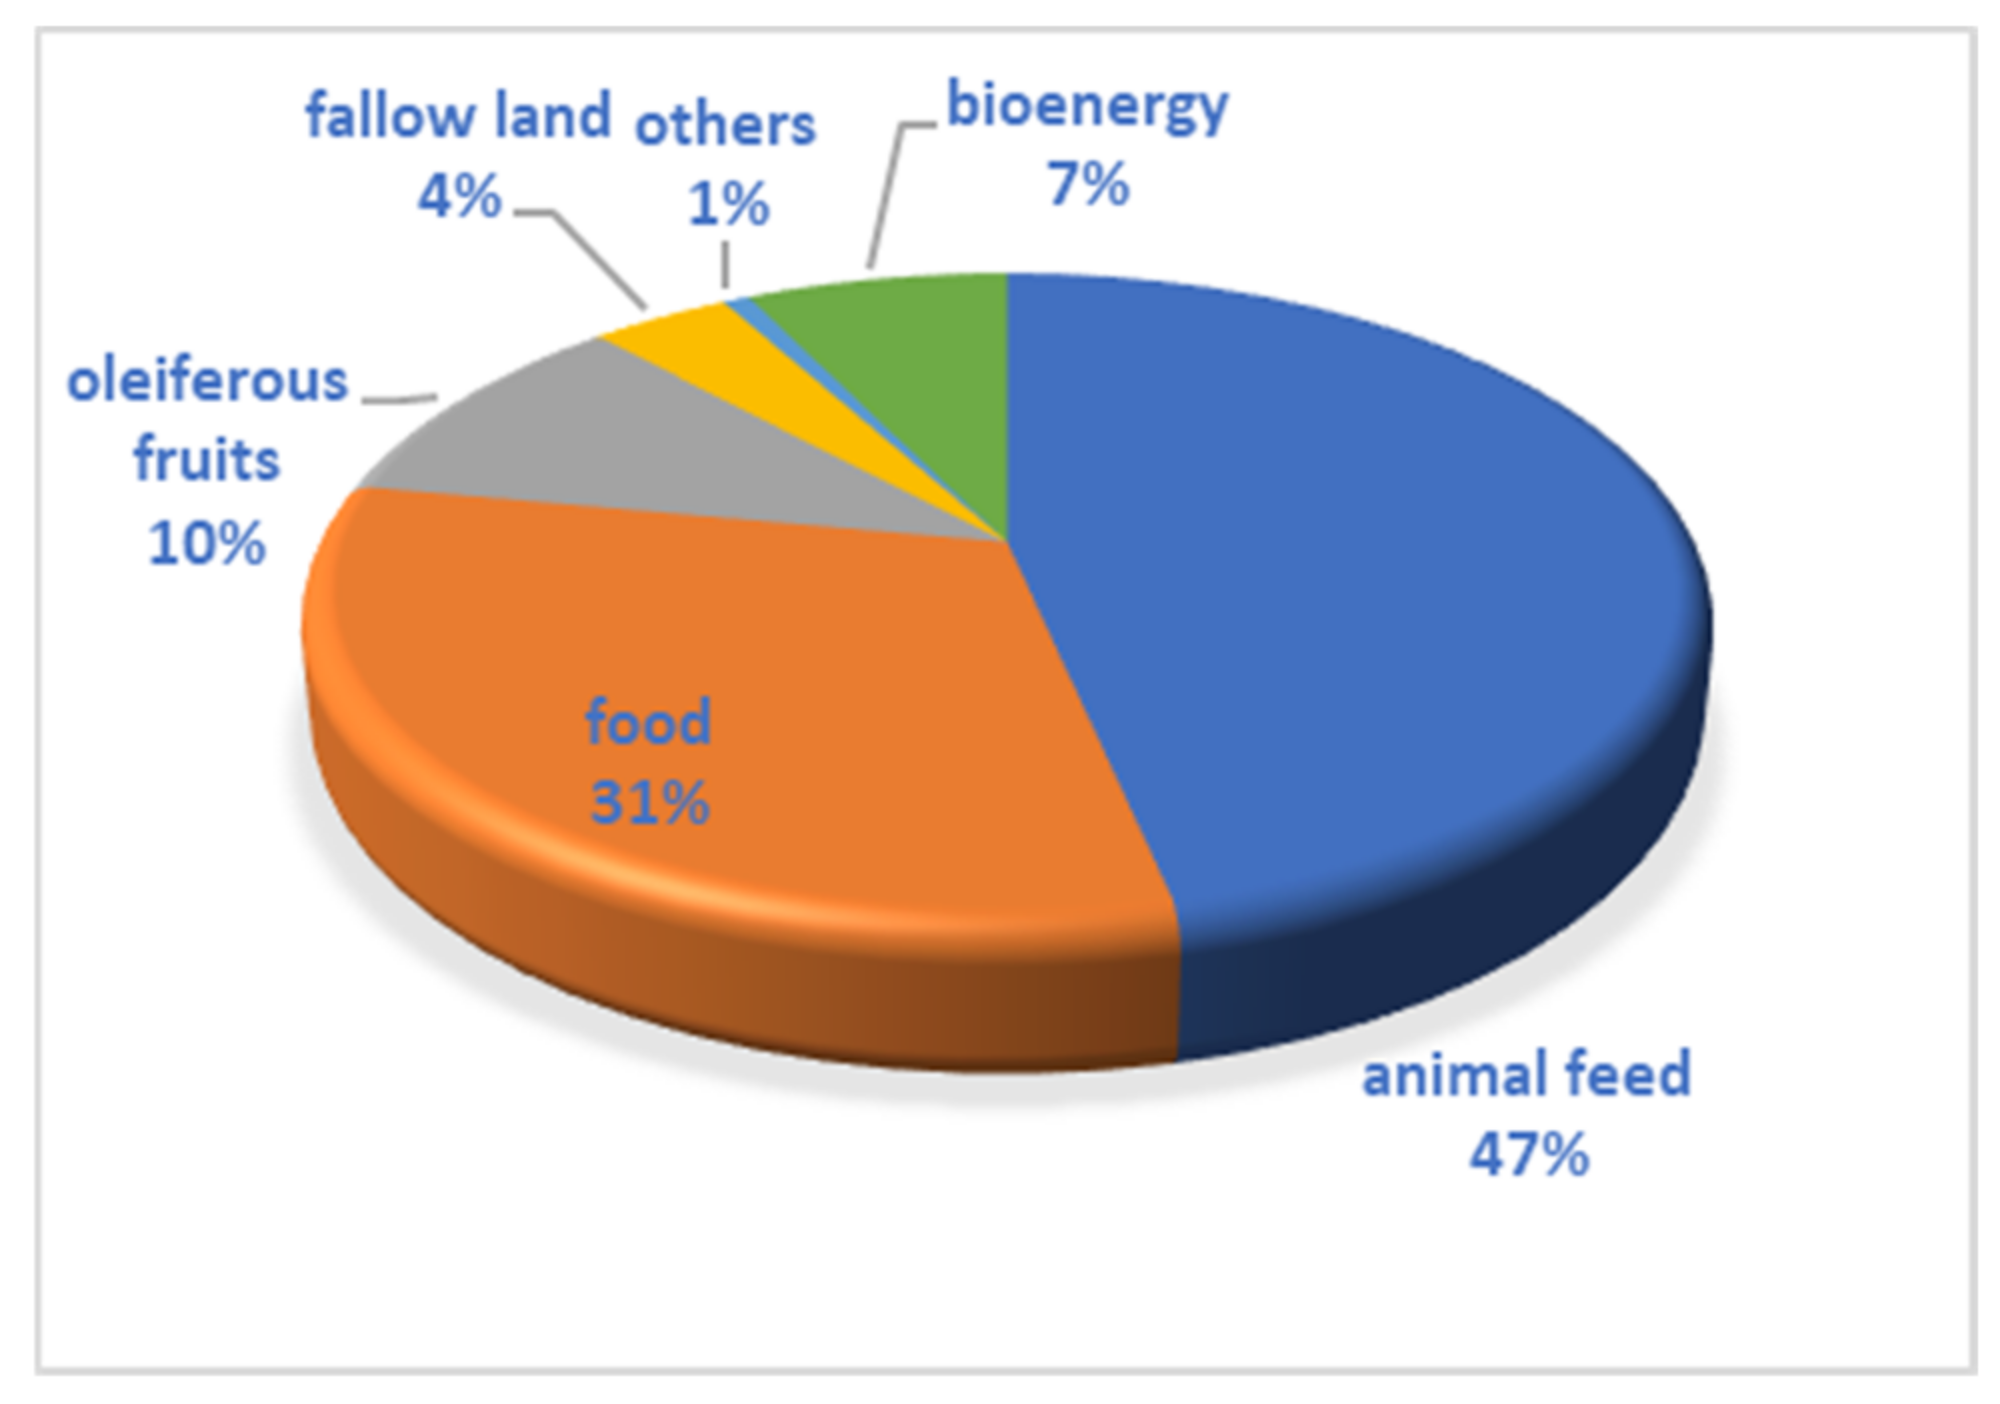
Currently, the contribution of geothermal energy to heat and electricity generation is small, only about 0.1 GW installed [60]. Königshofer et al. [65] looked into the potential for geothermal energy in Austria. The resulting potential was estimated as 3.1 TWh in 2050.

4.4. Biomass

Biomass contributed 49.6 TWh to electricity generation in Austria in 2017 [61]. Biomass includes wood, wood pellets, woodchips, wood waste, charcoal, biofuel, and other biomass. The largest share of bioenergy is solid biofuel (84%), followed by biodiesel (7%) and biogases (6%) [66]. The potential contribution of biomass to energy generation is seen as 19–51 TWh [67].

4.5. Photovoltaic

Austria has substantial potential for energy generation using photovoltaic (PV) systems. Figure 7 shows the solar potential of the various areas in Austria [68]. In 2017, 1.27 TWh electricity was produced by PV in Austria [61]. The installed PV capacity in Austria increased steeply from 2010 onwards; in 2020, 341 MW capacity was added.
The potential of PV in Austria includes various parts: (1) PV installed on buildings, (2) PV installations on landfills, (3) along roads and railway tracks, and (4) PV installed in open space. The estimated potential by Fechner (2020) [69] is given in Table 1.
Agrivoltaics is significantly increasing the open space areas that could be used for PV (e.g., [70,71]). Levelized Costs of Electricity (LCOE) are expected to be about 30% higher compared with ground-mounted PV [70]; however, only limited reduction in agricultural product growth is expected. Hence, the conflicting use of open space for agricultural or electricity production is resolved. For agricultural purposes, 1.33 mn ha are used in Austria [72]. The distribution of the usage of the agricultural area is shown in Figure 8. The largest part is used for animal feed (0.619 mn ha), followed by food (0.415 mn ha), and oleiferous fruits (0.135 mn ha).
The energy yield of agrivoltaics is about 312 kWpeak/ha [73]; hence, even assuming that only a small fraction of the agricultural area can be used for agrivoltaics leads to large potential for electricity generation.

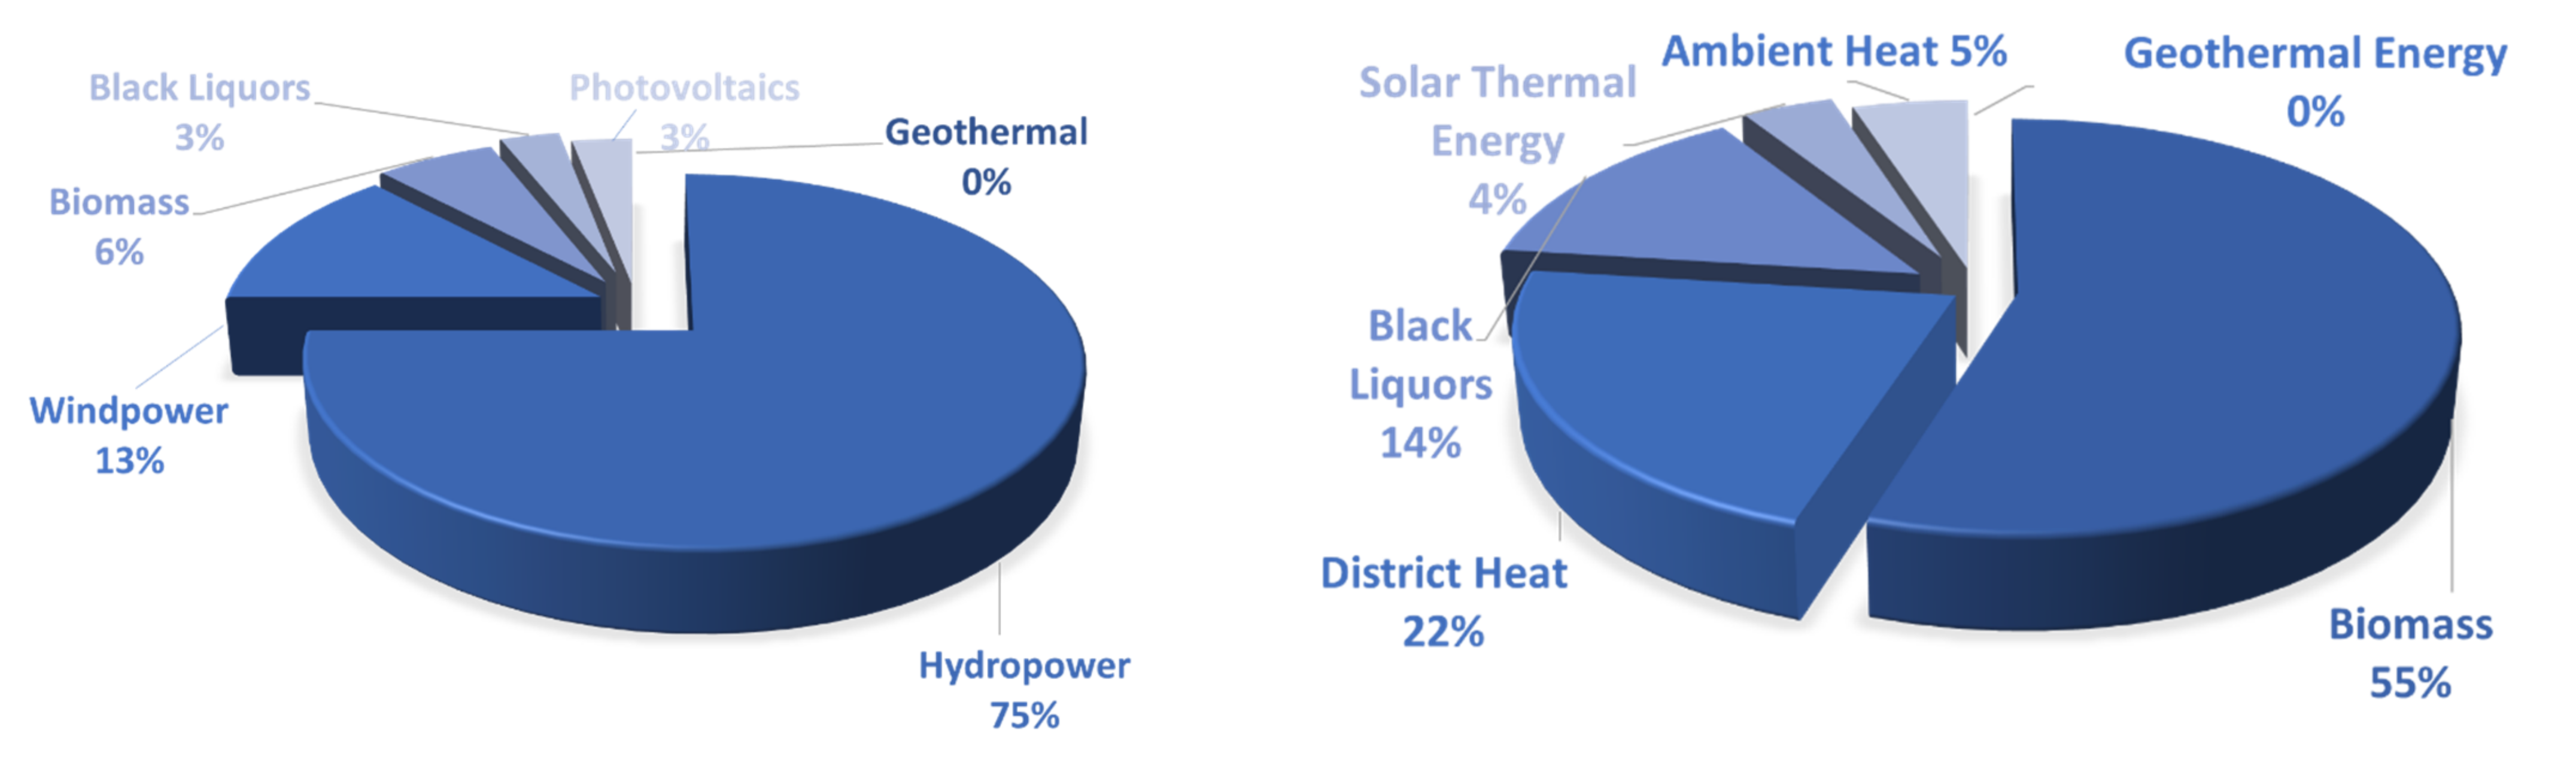
4.6. Summary of Renewable Energy Generation Potential in Austria

The largest potential for incremental REN generation in Austria is energy provided by biomass and PV. The potential from wind and hydropower is substantial, whereas geothermal energy has a somewhat lower potential in Austria. The potential of PV can be extended substantially if agrivoltaic electricity generation is implemented. The following section describes how the potential of REN generation, as described above, is combined with energy consumption to derive REN scenarios for the use of hydrogen storage in Austria.

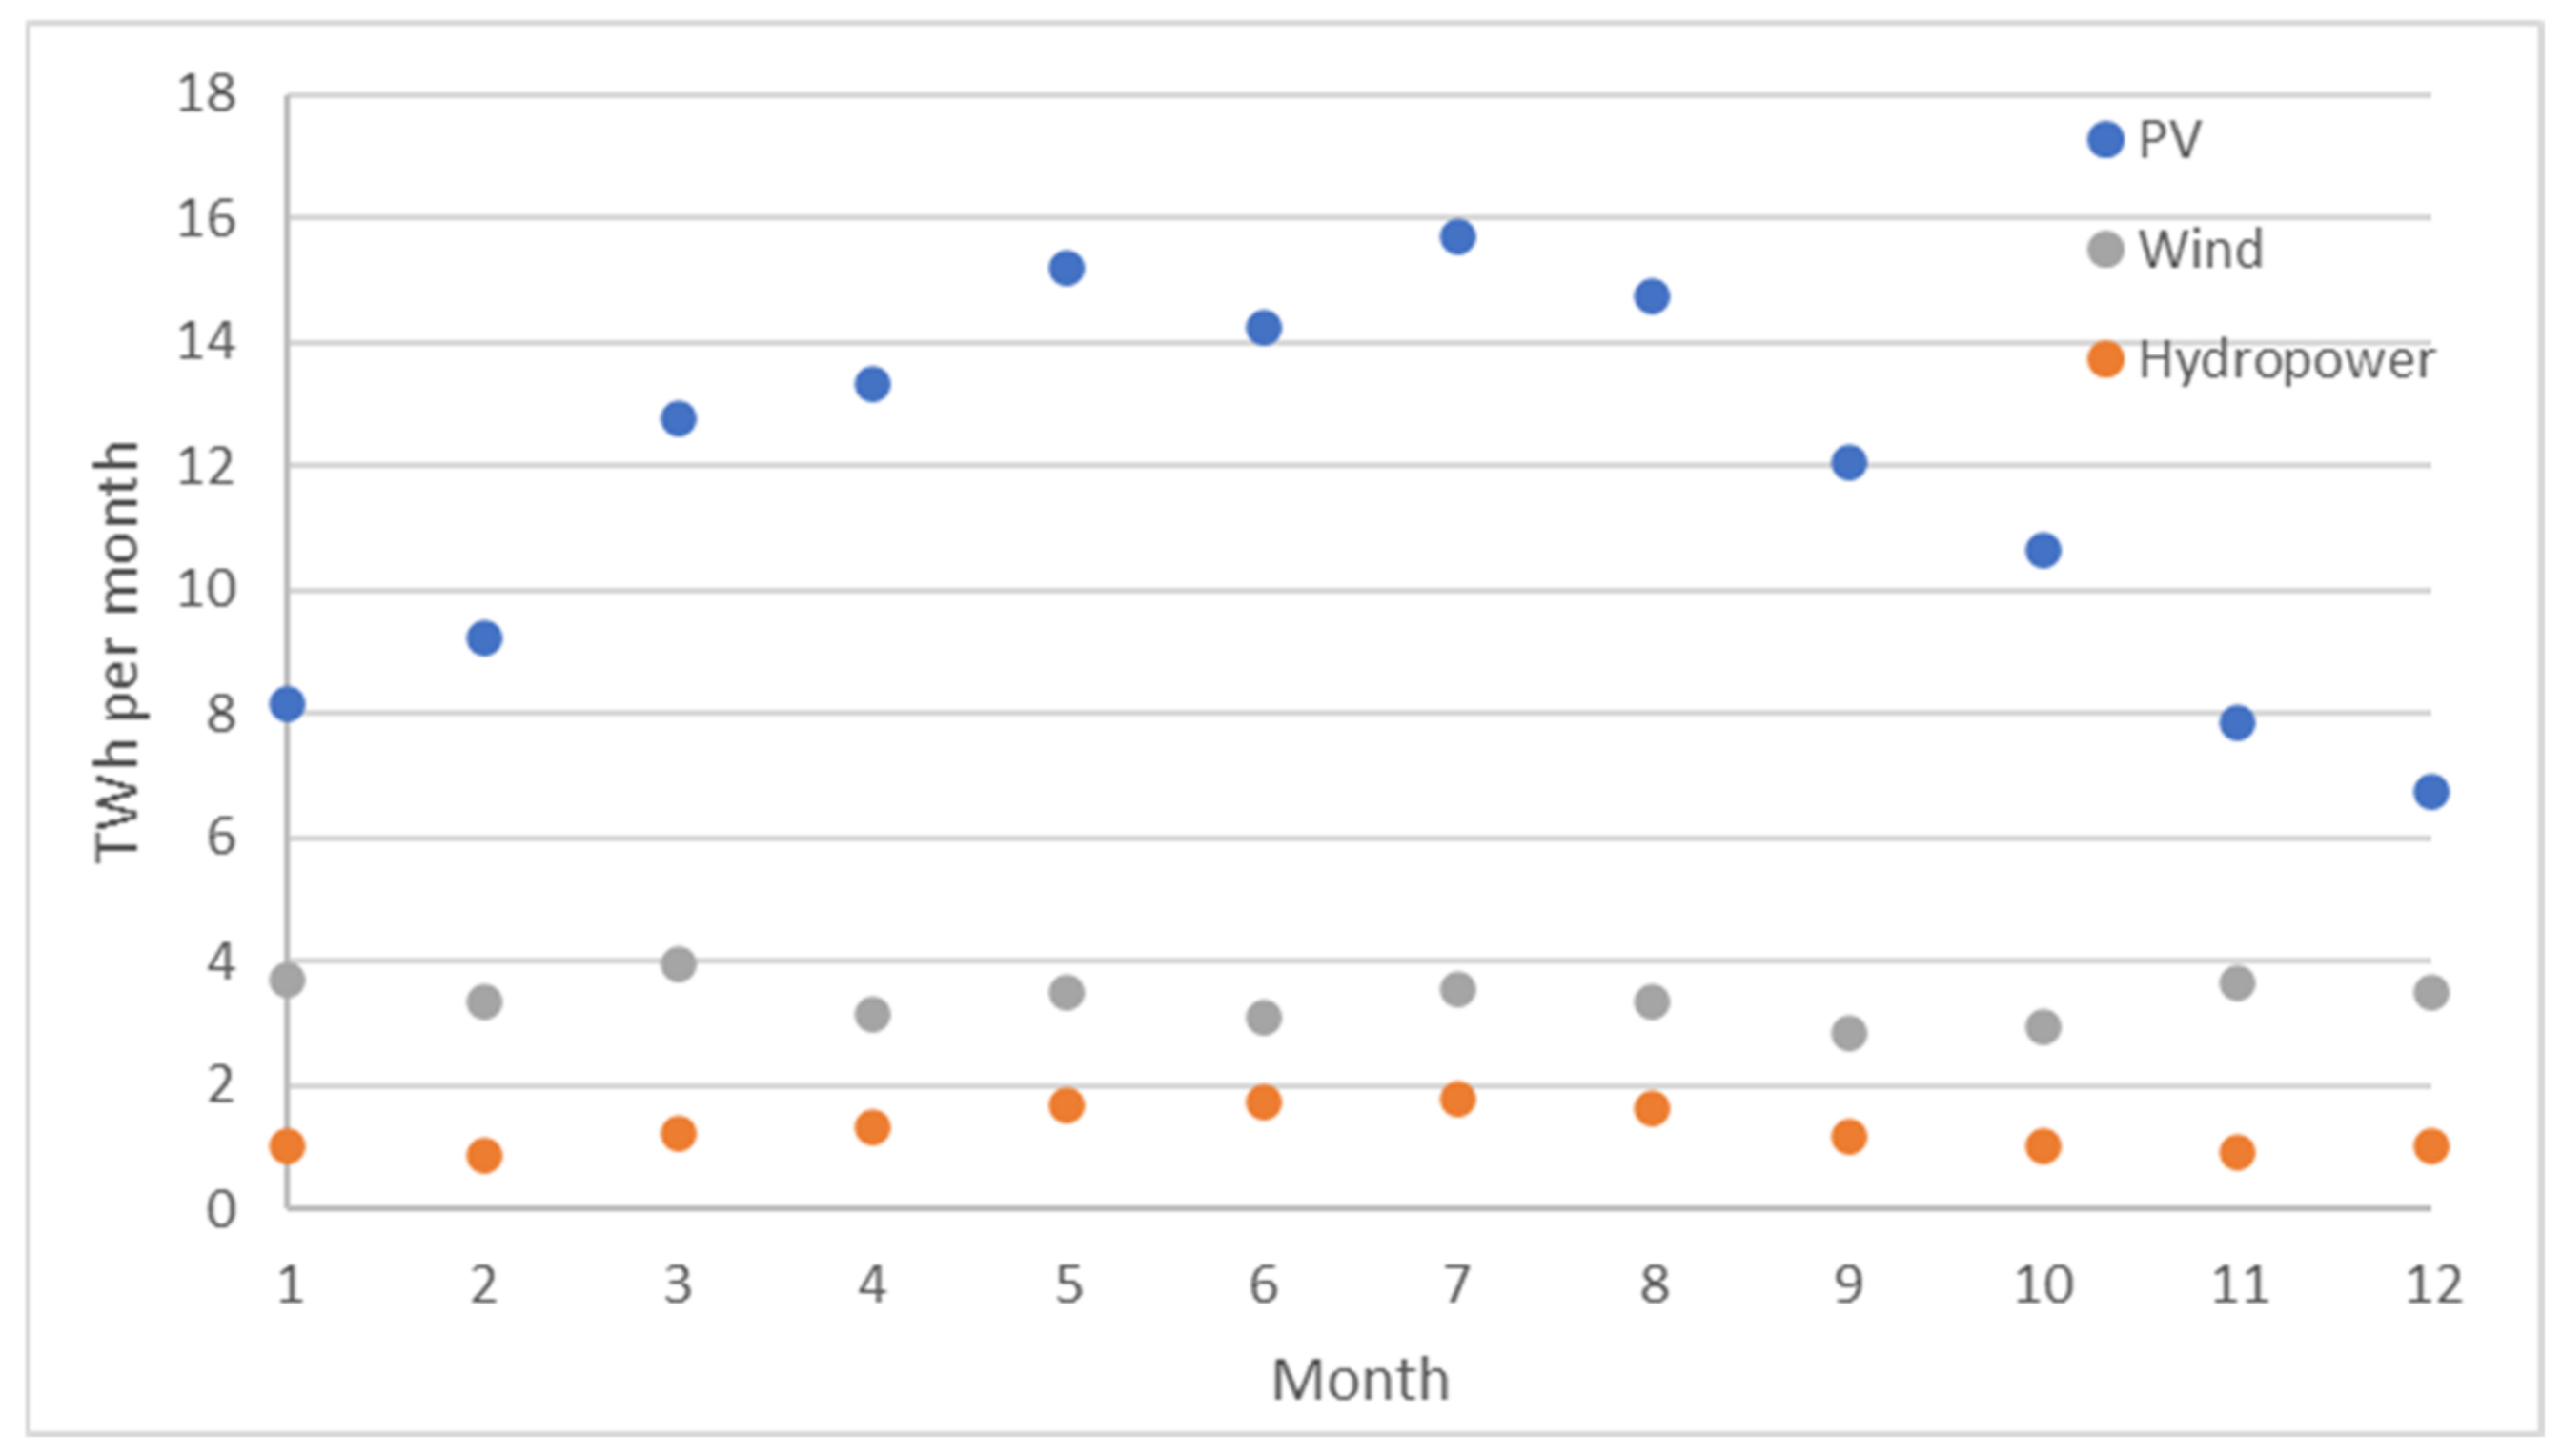
5. Renewable Energy Scenarios

Energy generation and energy consumption in Austria vary over the course of a year. In the following sections, the assumptions for energy consumption are shown, followed by the assumptions for energy generation in Austria.

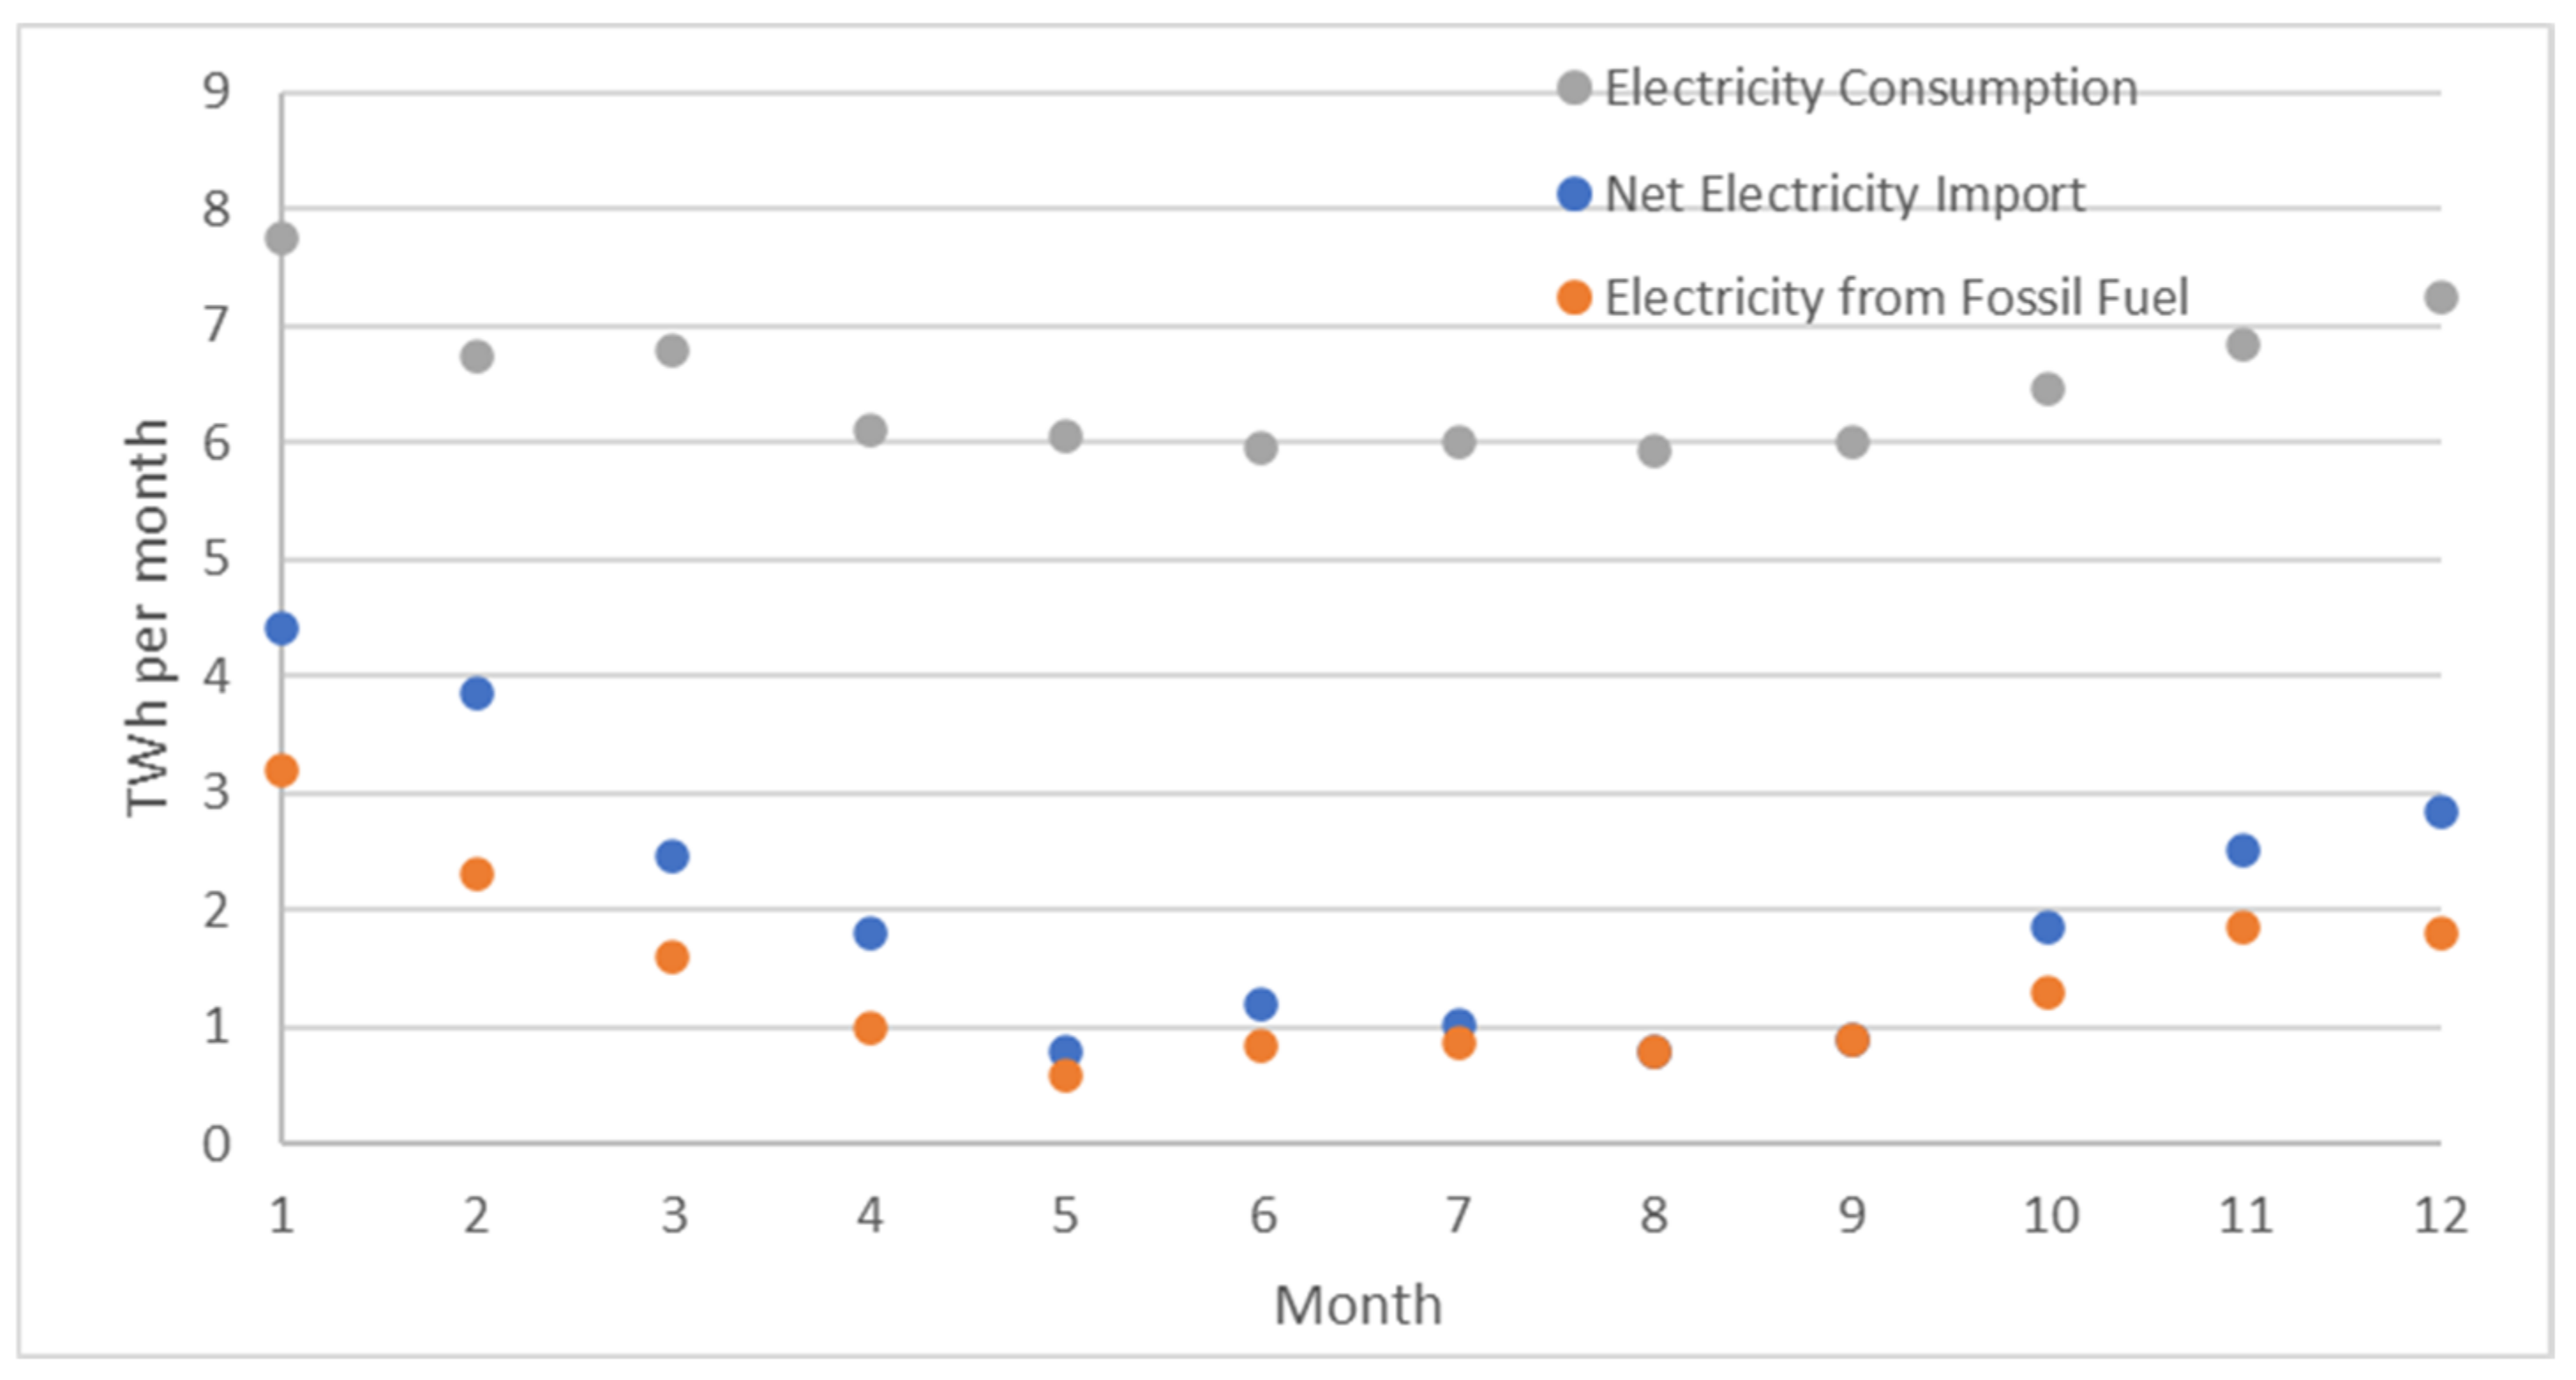
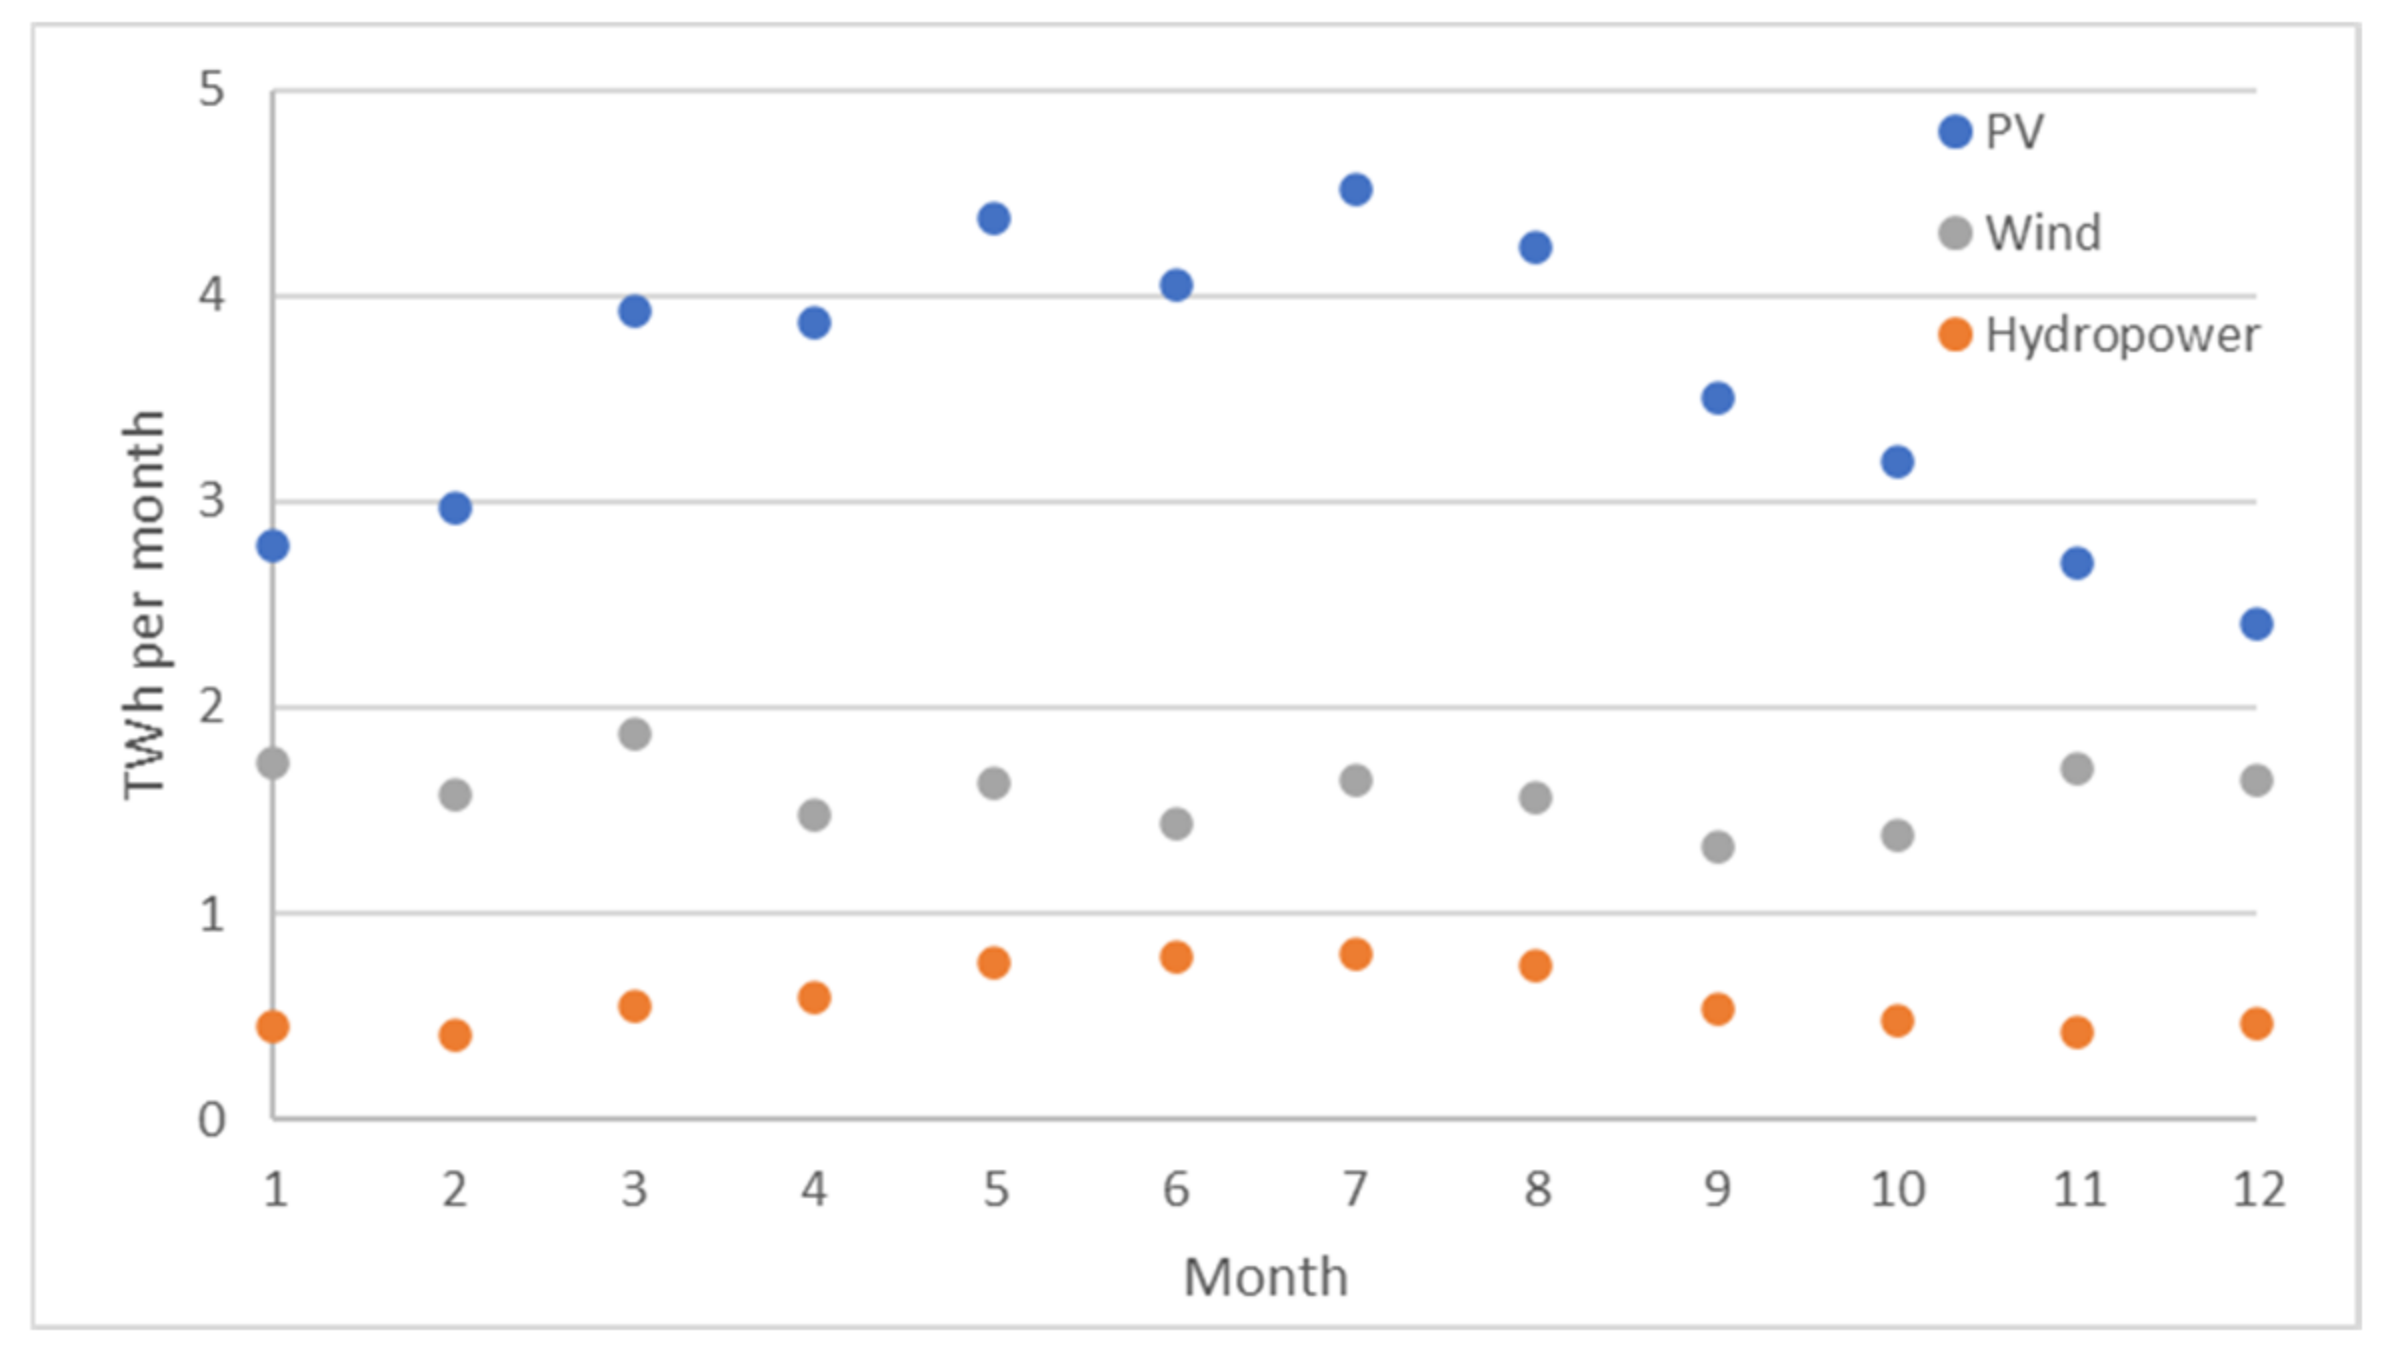
5.1. Current Energy Consumption

The electricity consumption in Austria was about 20% lower in summertime than in wintertime in 2017 [72]. To balance electricity generation and demand in Austria, in wintertime, the share of electricity generated from fossil energy is increasing and more electricity is imported (Figure 9).
Gas consumption in Austria shows a difference in summer- and wintertime as well. Overall gas consumption in Austria was distributed as follows: households 17.2 TWh, small business and industry 8.3 TWh, medium-sized industry 8 TWh, and large industry 57.2 TWh in 2020 [59].
The oil products that are consumed in Austria are distributed as follows: diesel fuel 62%, petrol 14.4%, jet oil 8.3%, heating oil 9.3%, bitumen 4.3%, and other products 1.2% [74]. About 1.07 mn t (12.54 TWh) light heating oil was used in Austria in 2019 [74]. For the gas used in heating and heating oil, the monthly distribution, as shown in Table 2, was considered.

5.2. Current Energy Generation

In 2017, 72.2% of the electrical energy was generated using REN [61]. Hydropower contributed 75%, wind 12.9%, and PV 2.4% to the REN electricity generation in Austria. These three technologies exhibit a significant difference in the monthly electricity generation. The power generation distribution within a year of the hydropower, wind and solar power is given in Table 3 [75]. Hydropower electricity generation varies over the course of the year due to the difference in run-off in summer- and wintertime. The run-off in wintertime is lower than in summer owing to lower precipitation in summertime and the precipitation as snow in winter. The factor of maximum to minimum monthly electricity generation from hydropower is 1.8. Electricity generation from wind shows a maximum to minimum variation of 2.0. Wintertime is windier than summertime, resulting in higher electricity generation from wind energy accordingly. PV electricity generation exhibits the largest variation from maximum in summertime to minimum in wintertime by a factor 3.8.

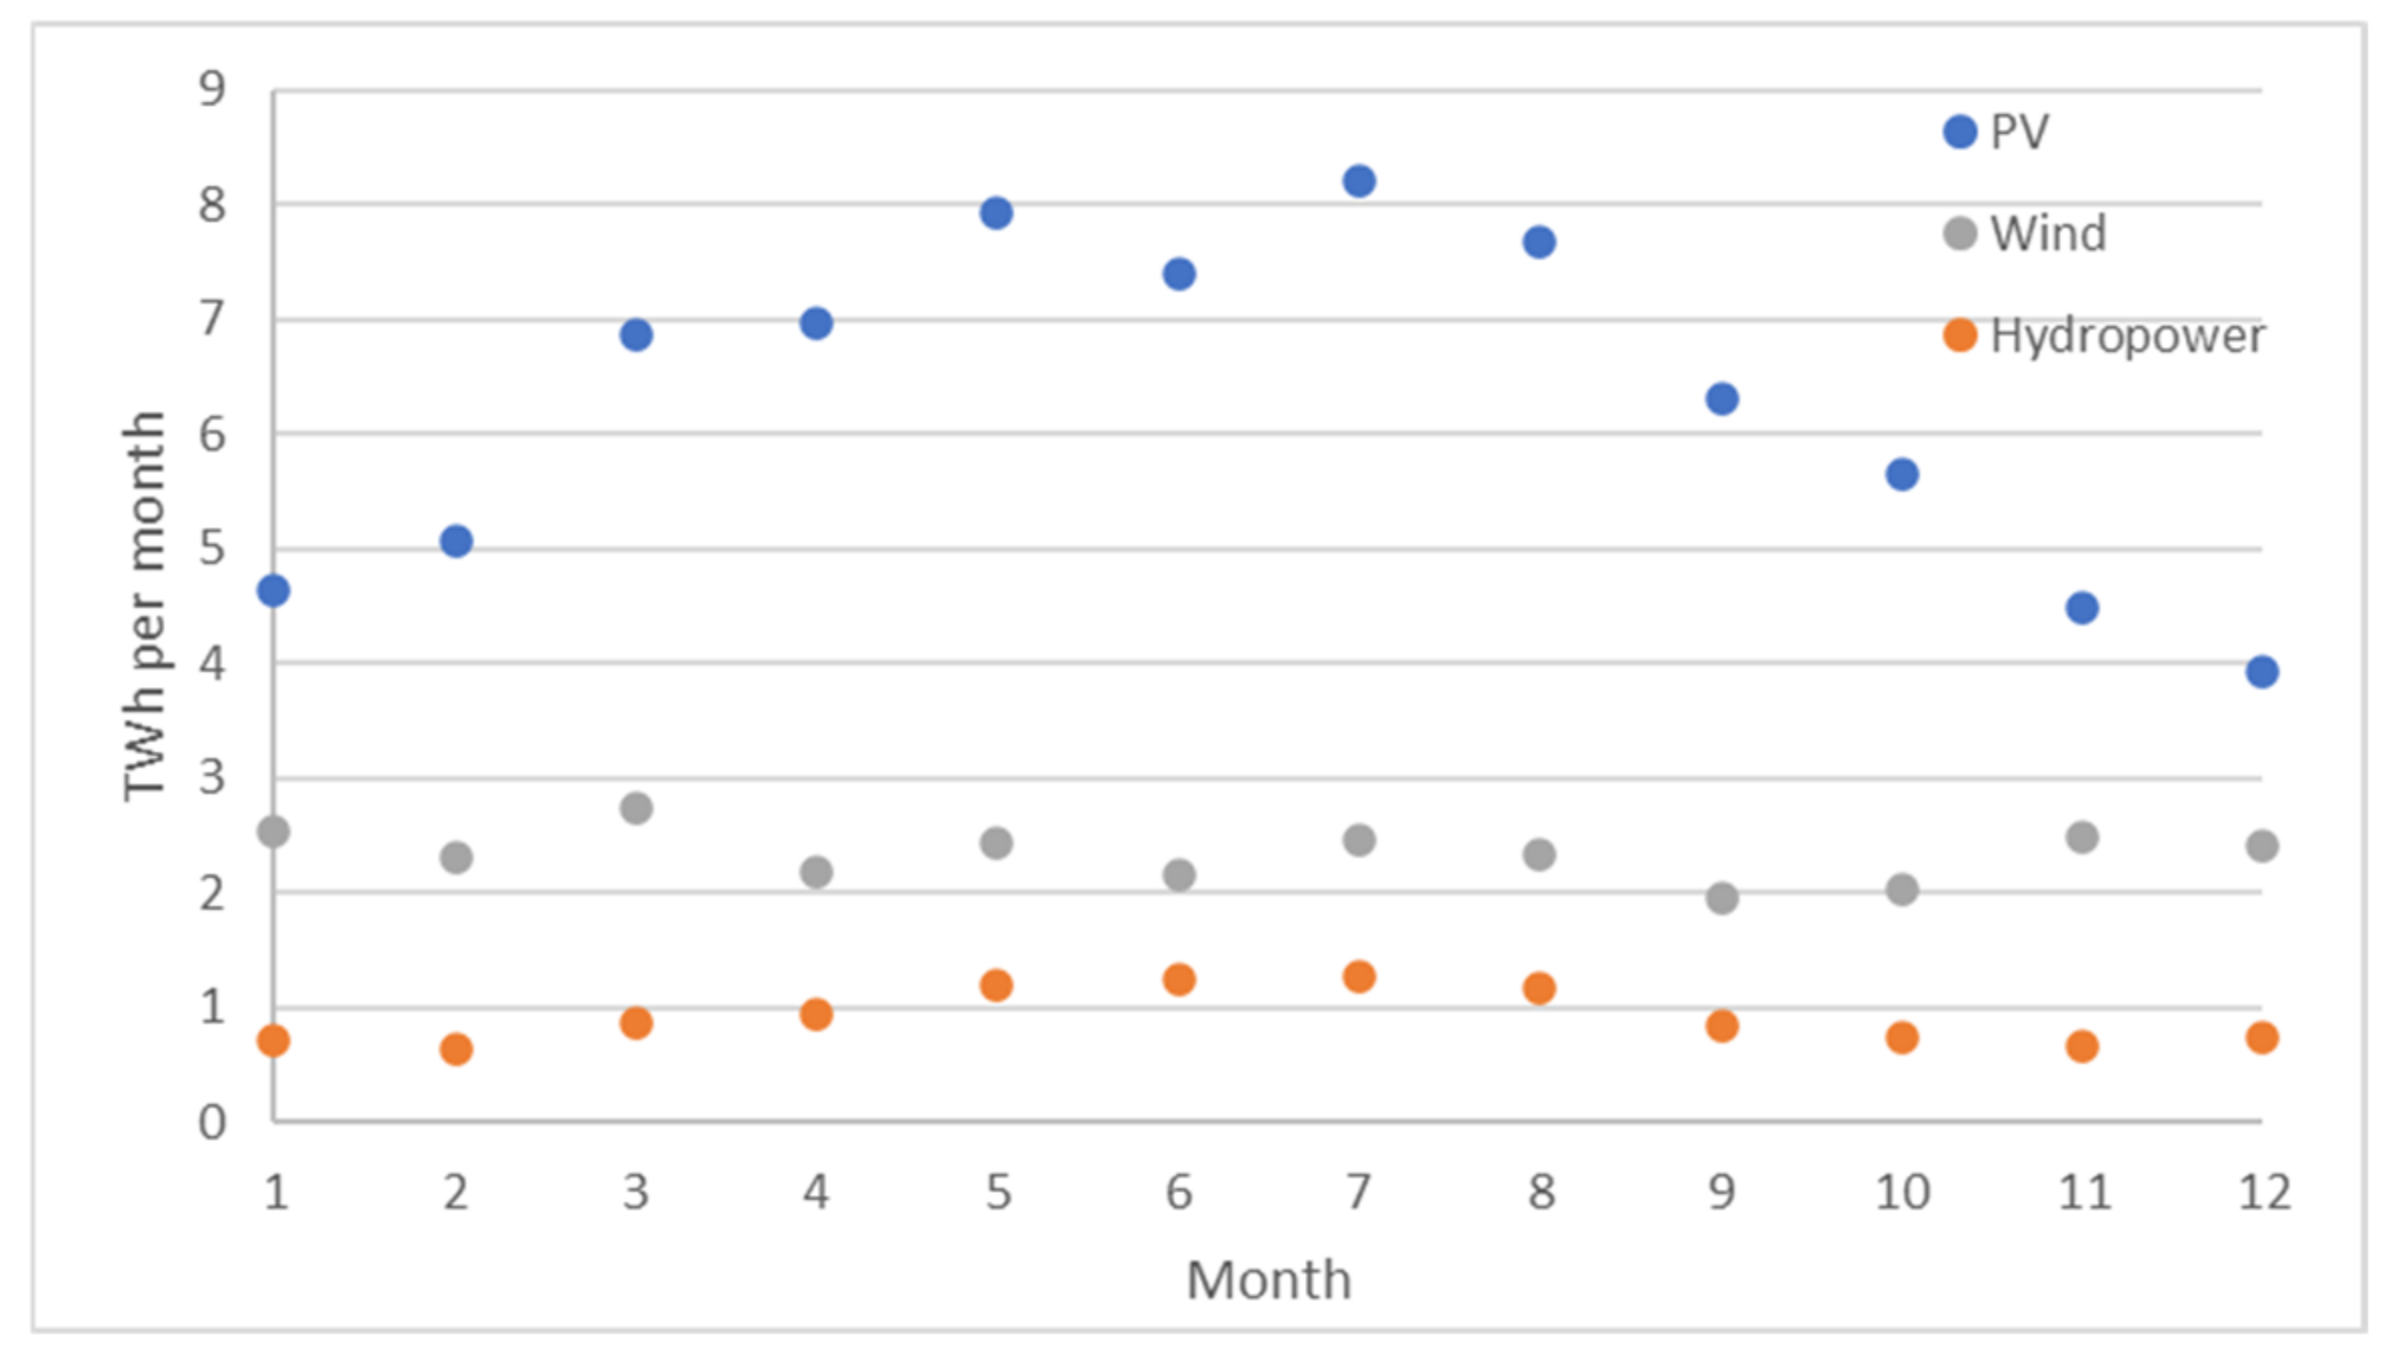
5.3. Scenarios for 2050

We evaluated three scenarios concerning decarbonization for Austria. All the scenarios assume that Austria is continuing to pursue the goal of net-zero greenhouse gas (GHG) emissions in 2040. The scenarios do not cover all Austrian GHG emissions but the emissions relevant for hydrogen storage. The scenarios differ by the REN generation in Austria.
We developed the following scenarios: Externally Dependent Scenario (EDS), Balanced Energy Scenario (BES), and Self-Sustained Scenario (SSS). For all scenarios, efficiency gains in heat consumption of households and transport are assumed, as described below.

5.3.1. Efficiency Gains in Heat Consumption in Households

The assumed efficiency gains are related to improved insulation and the increased use of heat pumps. Heat pumps have an efficiency factor of 3 to 5 of heat generated/electricity used, dependent on the type of heat pump (air, shallow depth, deep); this is on the high side of the range given by Kranzl et al. [76] to take technology improvements into account. However, if hydrogen is converted into electricity in wintertime to balance supply and demand, 40–65% of the energy efficiency is lost if turbines (open-cycle or combined-cycle gas turbines) are used [15]. In the case that fuel cells are applied, energy losses of 30% to 40% are expected, dependent on the fuel cell type [18]. Here, we assume an efficiency gain of 20% for the EDS, BES, and SSS, taking use of heat pumps with electricity, fuel cells, and technology advances into account.
Using the monthly distribution for households and the amount of gas and heating oil and applying a 20% efficiency gain leads to the monthly use of energy for heating, as shown in Figure 10.

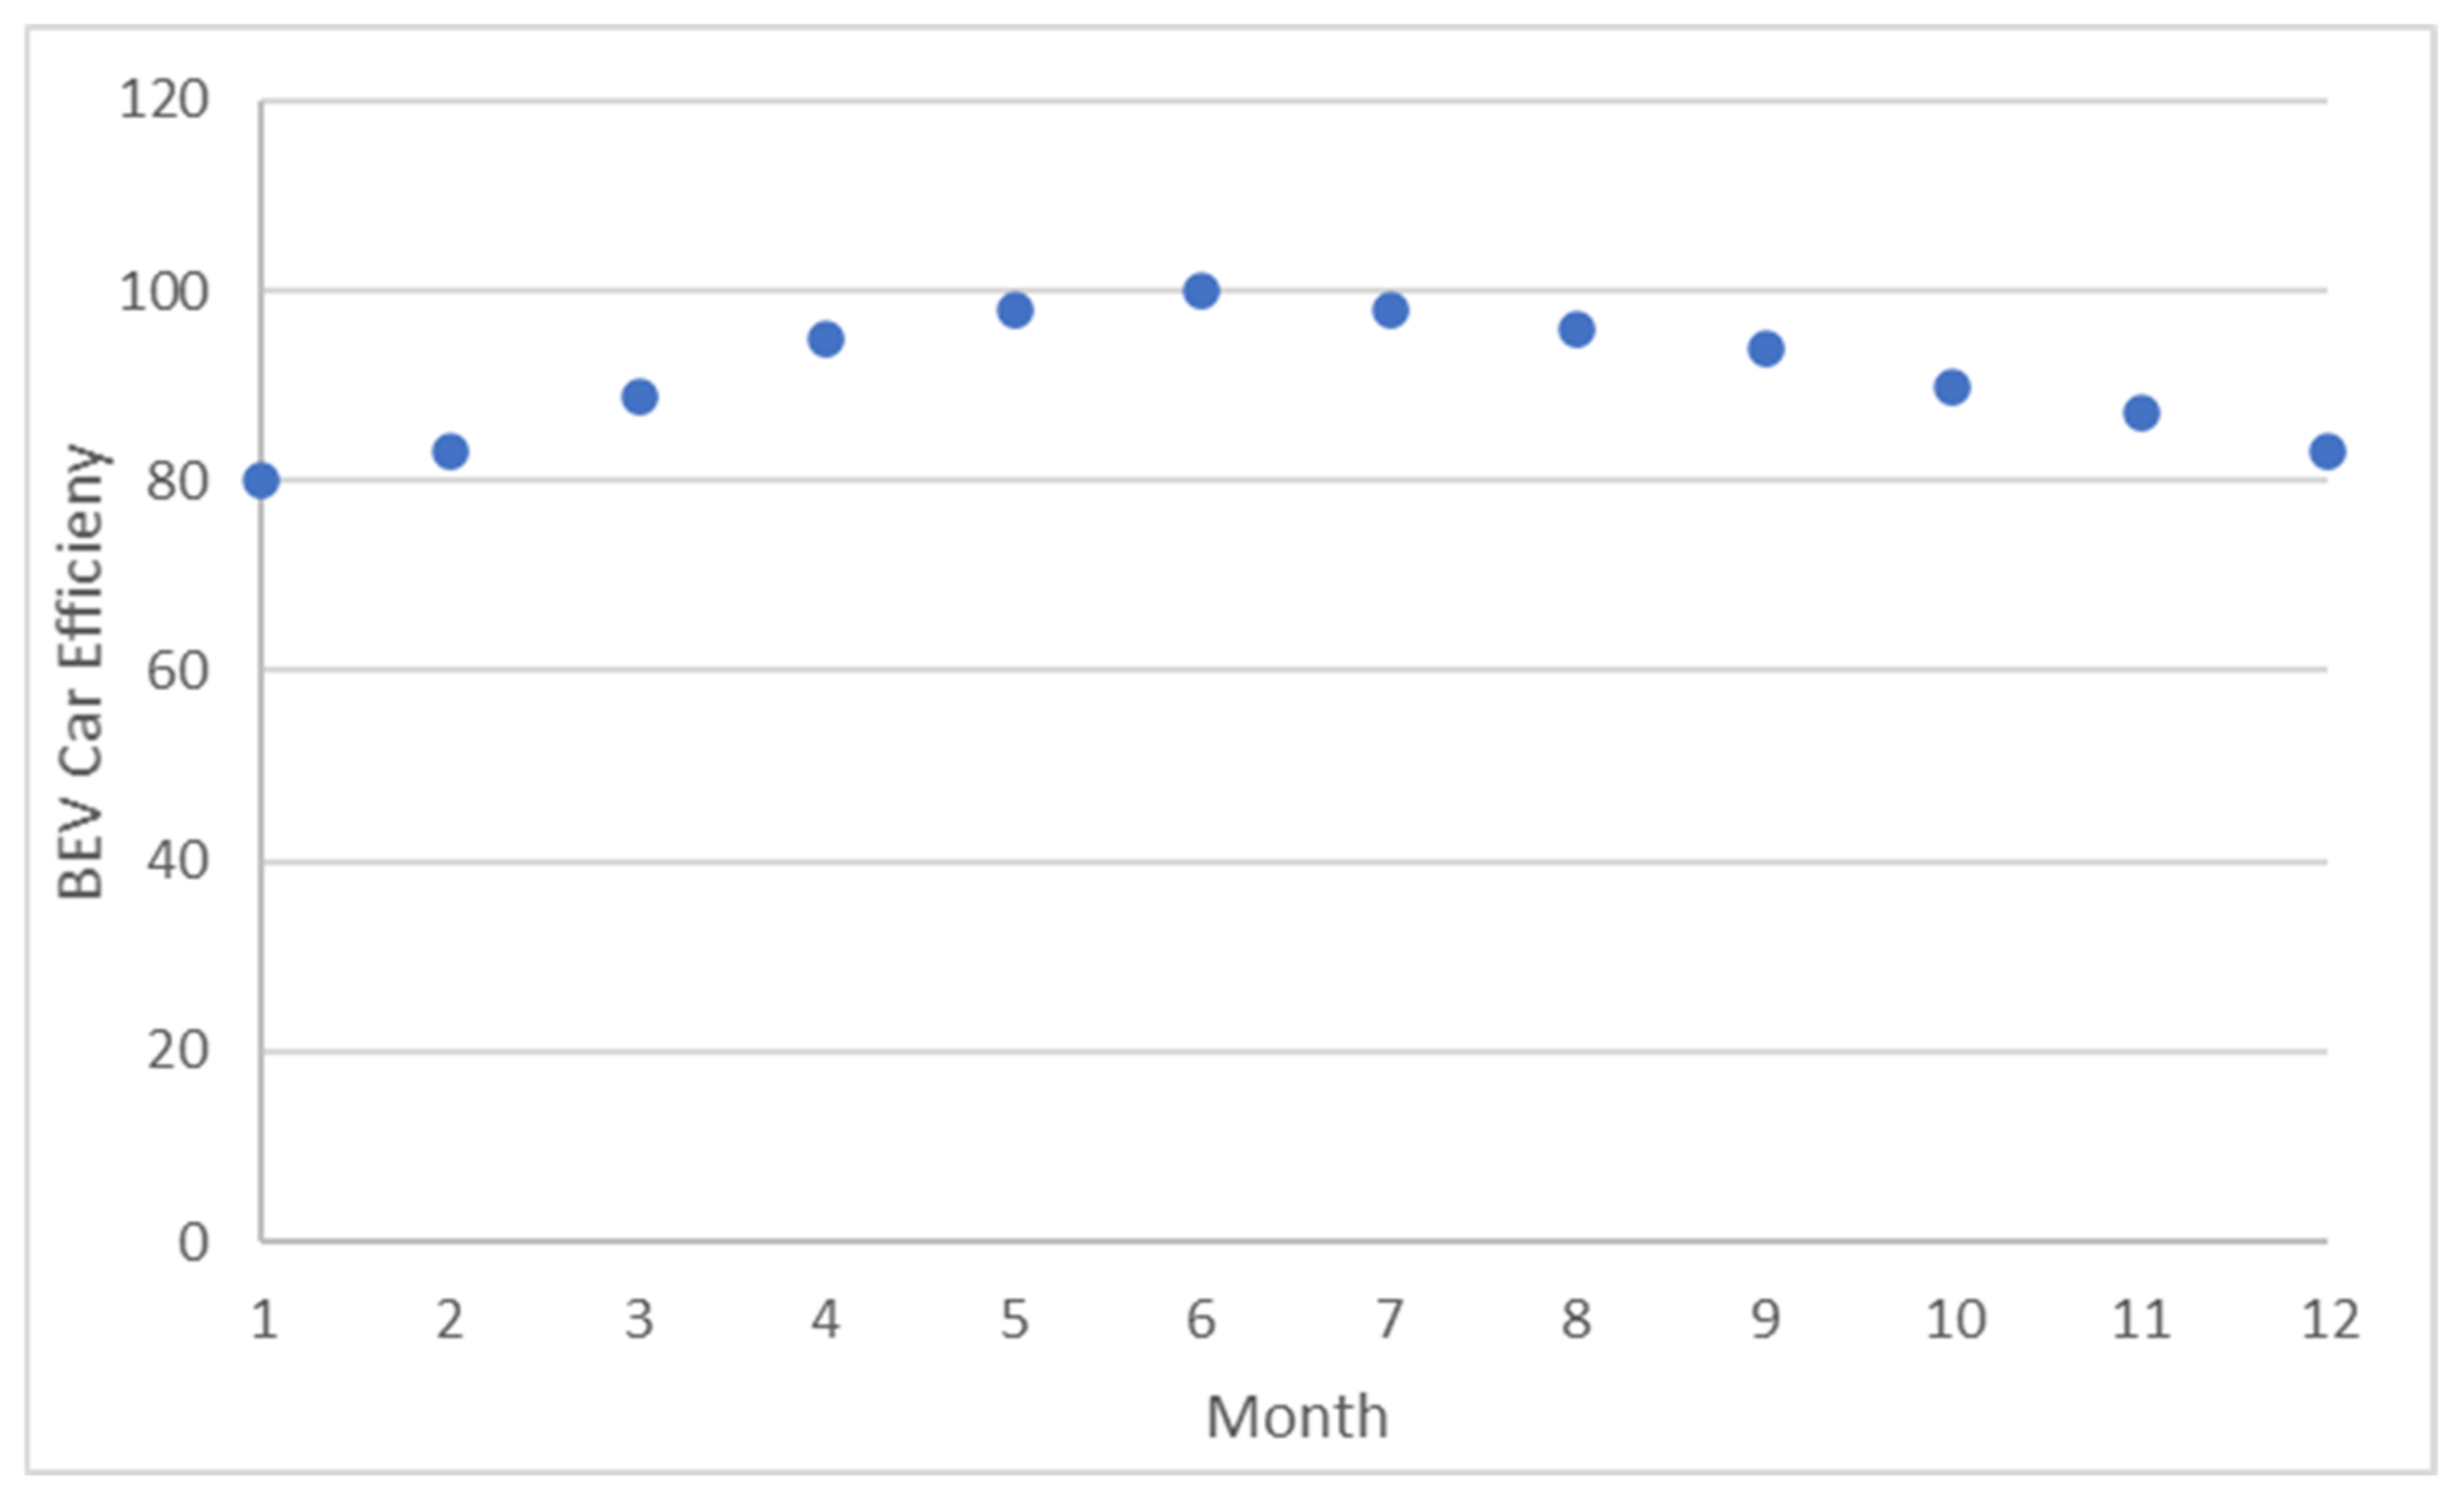
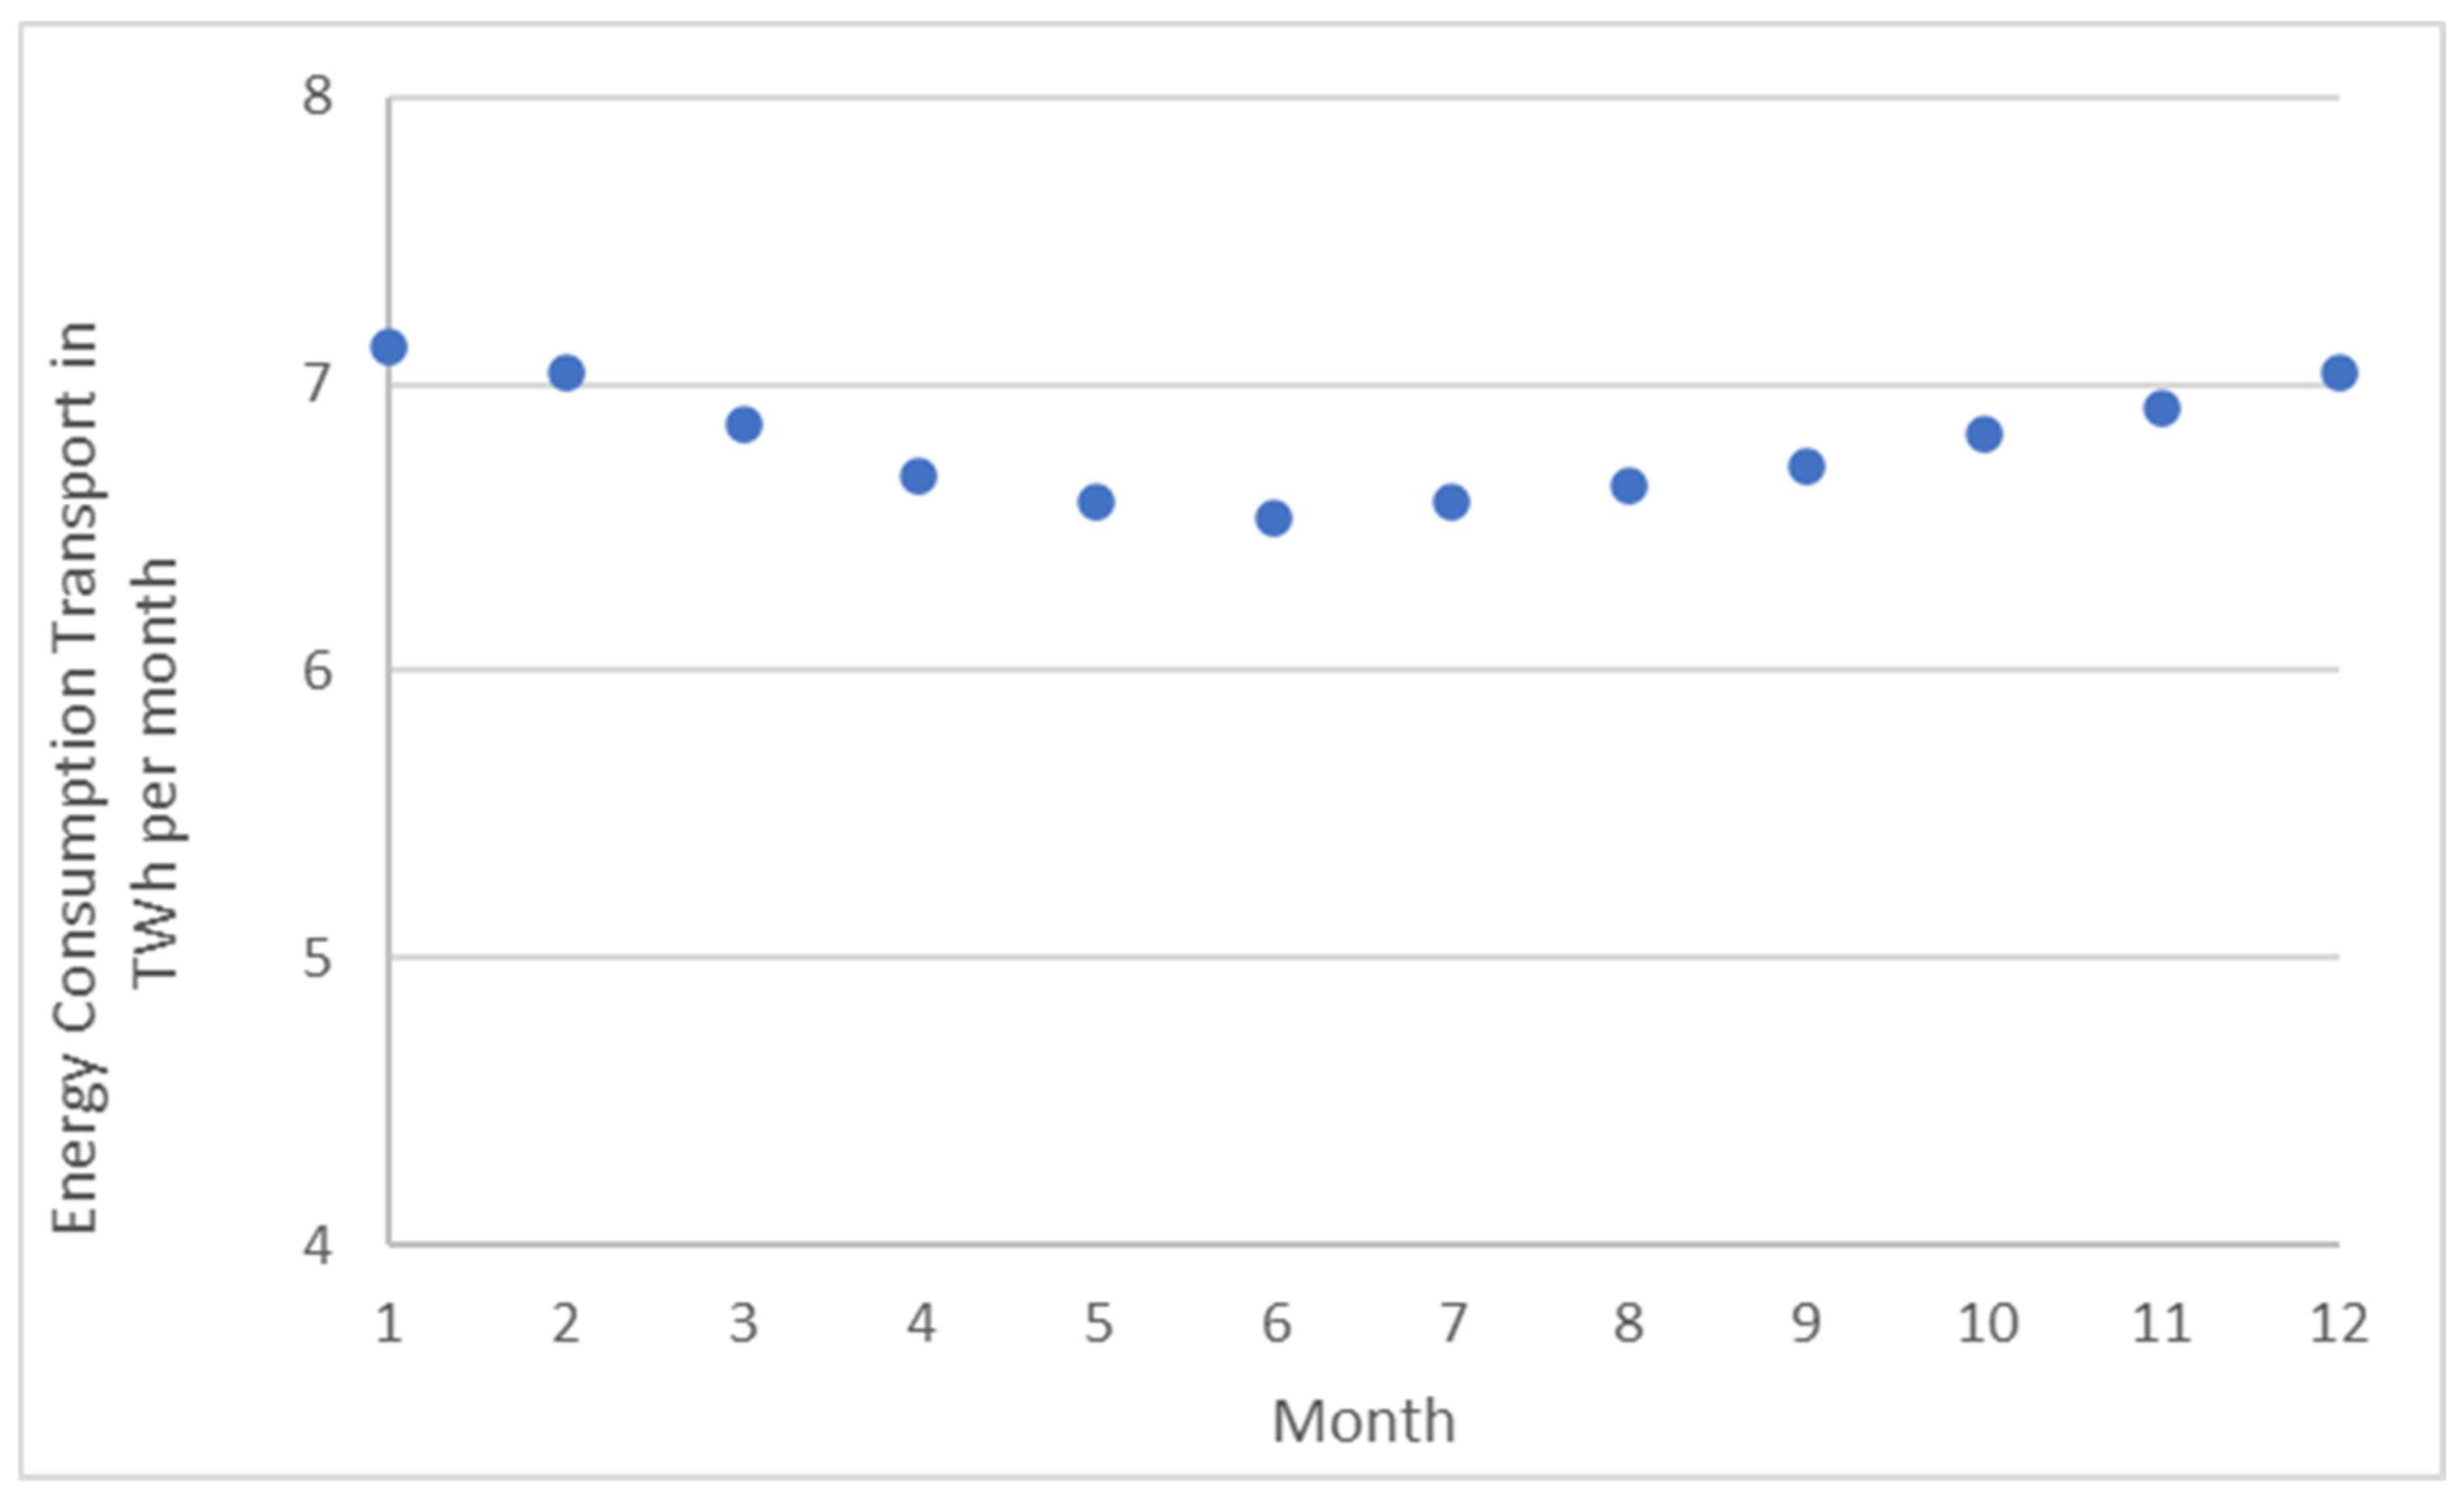
5.3.2. Efficiency Gains in Transport

Another area of energy efficiency gain is the transport sector. Hybrid Electric Vehicles are in the short-term reducing CO2 emissions [77], however in the long-term, Battery Electric Vehicles (BEV) are expected to gain a large share of the light-duty vehicles sales [78]. The other large part of transport is assumed to be taken by Fuel Cell Vehicles (FCV). For heavy-duty vehicles, fuels cells are seen as a viable alternative to battery vehicles in a net-zero emission scenario [79]. Internal Combustion Engine (ICE) cars have an efficiency from tank-to-wheel of 14–33% for gasoline ICE and 25–37% for diesel ICE [80]. The battery-to-wheel efficiency for BEV is about 66%, including losses in the distribution grid. However, if electricity is converted into hydrogen and back to electricity during peak demand, then 35% of energy is lost in converting electricity to hydrogen and 40–65% of the energy is lost in the turbines [81]. The efficiency of FCV (tank-to-wheel) is 50–60%. Due to transport, and the compression of hydrogen another 17% of the efficiency is lost [53]. Generation of hydrogen using electrolysis leads to another efficiency loss of 35%. Assuming that BEV cars are supplied with about 30% by electricity generation from hydrogen (assuming 45% average turbine efficiency) results in an overall efficiency of 51.5% for BEV compared with 25.1% for FCV (using an average of 55% fuel cell efficiency) and 30% for modern gasoline and 35% for modern diesel cars. Averaging BEV and FCV efficiency to 38.2% and comparing this efficiency with the average efficiency of diesel and gasoline cars (32.5%) leads to an improvement in energy use of 15%. Including additional efficiency gains, a slightly higher number of 20% efficiency improvement was applied to EDS, BES, and SSS. The efficiency of BEV cars in terms of kilometers per kWh is higher in summertime than in wintertime. During periods of high temperatures, the BEV efficiency is decreased due to the use of air conditioning. However, the decrease for high temperatures is small for the case of the Austrian climate and is neglected here. Figure 11 shows the difference of BEV efficiency over the course of a year and is based on data from Hao et al., 2020 [82].
Assuming 20% fuel cell light-duty vehicles and 60% fuel cell heavy-duty vehicles, and an efficiency gain of 30.7%, leads to the monthly energy consumption by transport shown in Figure 12.

5.3.3. Additional Fossil Energy Replacement

To replace electricity generation from fossil fuels and electricity import, REN needs to be used. To account for the replacement and the differences in winter- and summertime (see Figure 9), 11.4 TWh needs to be stored.
Furthermore, coal and gas, other than that used for electricity generation and heating, which amounted to 92.4 TWh in 2019, need to be replaced in 2050. For this amount, no significant difference over the course of the year is expected.
To calculate the amount of hydrogen needed, we assumed that 4380 h per year is used for generating hydrogen for peak shaving supply and demand. This is in the low part of the cost curve for LCOH using electrolysers (Figure A2) and is similar to the injection and production periods from current storage operations in Austria [59].
For all the three scenarios, it is assumed that the efficiency gains, as described above, are realized. As described above, 4380 h of hydrogen generation is used for the calculation of the difference in energy generation in summer- and wintertime. The resulting difference from summer to winter that needs to be balanced for all the three scenarios is: heat (gas and light oil) 12.7 TWh, 2.04 TWh transport, and 11.4 TWh to account for the fossil-fuel-generated electricity and electricity import, which is replaced by REN.
In the following sections, the three different scenarios investigated here are described.

5.4. Externally Dependent Scenario (EDS)

Generating a large amount of REN in Austria requires public acceptance and substantial investments. This scenario assumes that a substantial amount of the required REN in Austria will be supplied externally. Hydrogen generation costs in Austria utilizing wind and PV are lower than in many other European countries; however, the costs of hydrogen generation using REN are expected to be lower in several areas in Africa and the Middle East than in Austria [83]. Hydrogen production in low-cost areas leads to additional costs for shipping and dehydrogenation to supply the hydrogen to Austria [83]. There are plans to improve the electricity generation network, which will allow for balancing wind-generated electricity and PV-generated electricity. Furthermore, a hydrogen network might develop in Europe allowing one to transport hydrogen within Europe and from North Africa to Austria [84]. In the EDS scenario, it assumed that REN generated in Austria is supplemented by energy import as electricity or hydrogen.
In addition to the energy difference between summer- and wintertime, which is similar for all scenarios, it is assumed that the potential of REN electricity generation is not realized but energy is imported to Austria. Therefore, out of the total incremental potential for REN, 7 TWh of hydropower, 12 TWh wind energy and 23.55 TWh of PV are assumed. The distribution of the incremental REN within a year is depicted in Figure 13. In summertime (April to September), 6.6 TWh more is produced than in wintertime. Combining the difference in summer- and wintertime, which is the same for all scenarios with the difference for the EDS scenario, results in a total energy requirement difference from winter- to summertime of 32.74 TWh, which needs to be stored. The resulting required hydrogen storage is 10.82 bm3.

5.5. Balanced Energy Scenario (BES)

In this scenario, we assume that a larger part of the REN potential in Austria is realized than in EDS. The realized REN is related to the costs of generating REN in Austria and reflects the lower cost part of the REN potential. Energy imports of electricity and hydrogen complement the required energy. For this scenario, a limited amount of higher cost agrivoltaics is assumed. Incremental REN generation compared with 2019 of 11 TWh for wind, 17 TWh for wind, and 47.1 TWh for PV is used. The resulting energy production from hydropower, wind, and PV is depicted in Figure 14. The resulting requirement for hydrogen storage is 40.03 TWh or 13.34 bm3, including the contributions, which are the same for all scenarios.

5.6. Self-Sustained Scenario (SSS)

This scenario assumes that the major part of the energy used in Austria is generated within the country. The efficiency gains, as described above, are applied. To limit the amount of energy imported to Austria, it is assumed that the potential of REN, as described above, is realized. Owing to technology improvements (more efficient wind and hydropower turbines, better PV modules) and implementation of agrivoltaics, additional power generation is assumed to materialize by 2050. Incremental REN generation compared with 2019 of 15.2 TWh for wind, 25.3 TWh for wind, and 100.1 TWh for PV is applied. The resulting energy production from hydropower, wind, and PV is depicted in Figure 15. The resulting requirement for hydrogen storage is 56.06 TWh or 18.69 bm3, including the contributions, which are the same for all scenarios.
Changing the energy system from the use of fossil fuels to REN will dramatically modify the energy markets. We expect that the market will develop into a new Nash equilibrium (e.g., [85]). The actions of the various agents in the market will determine which of the scenarios will evolve.

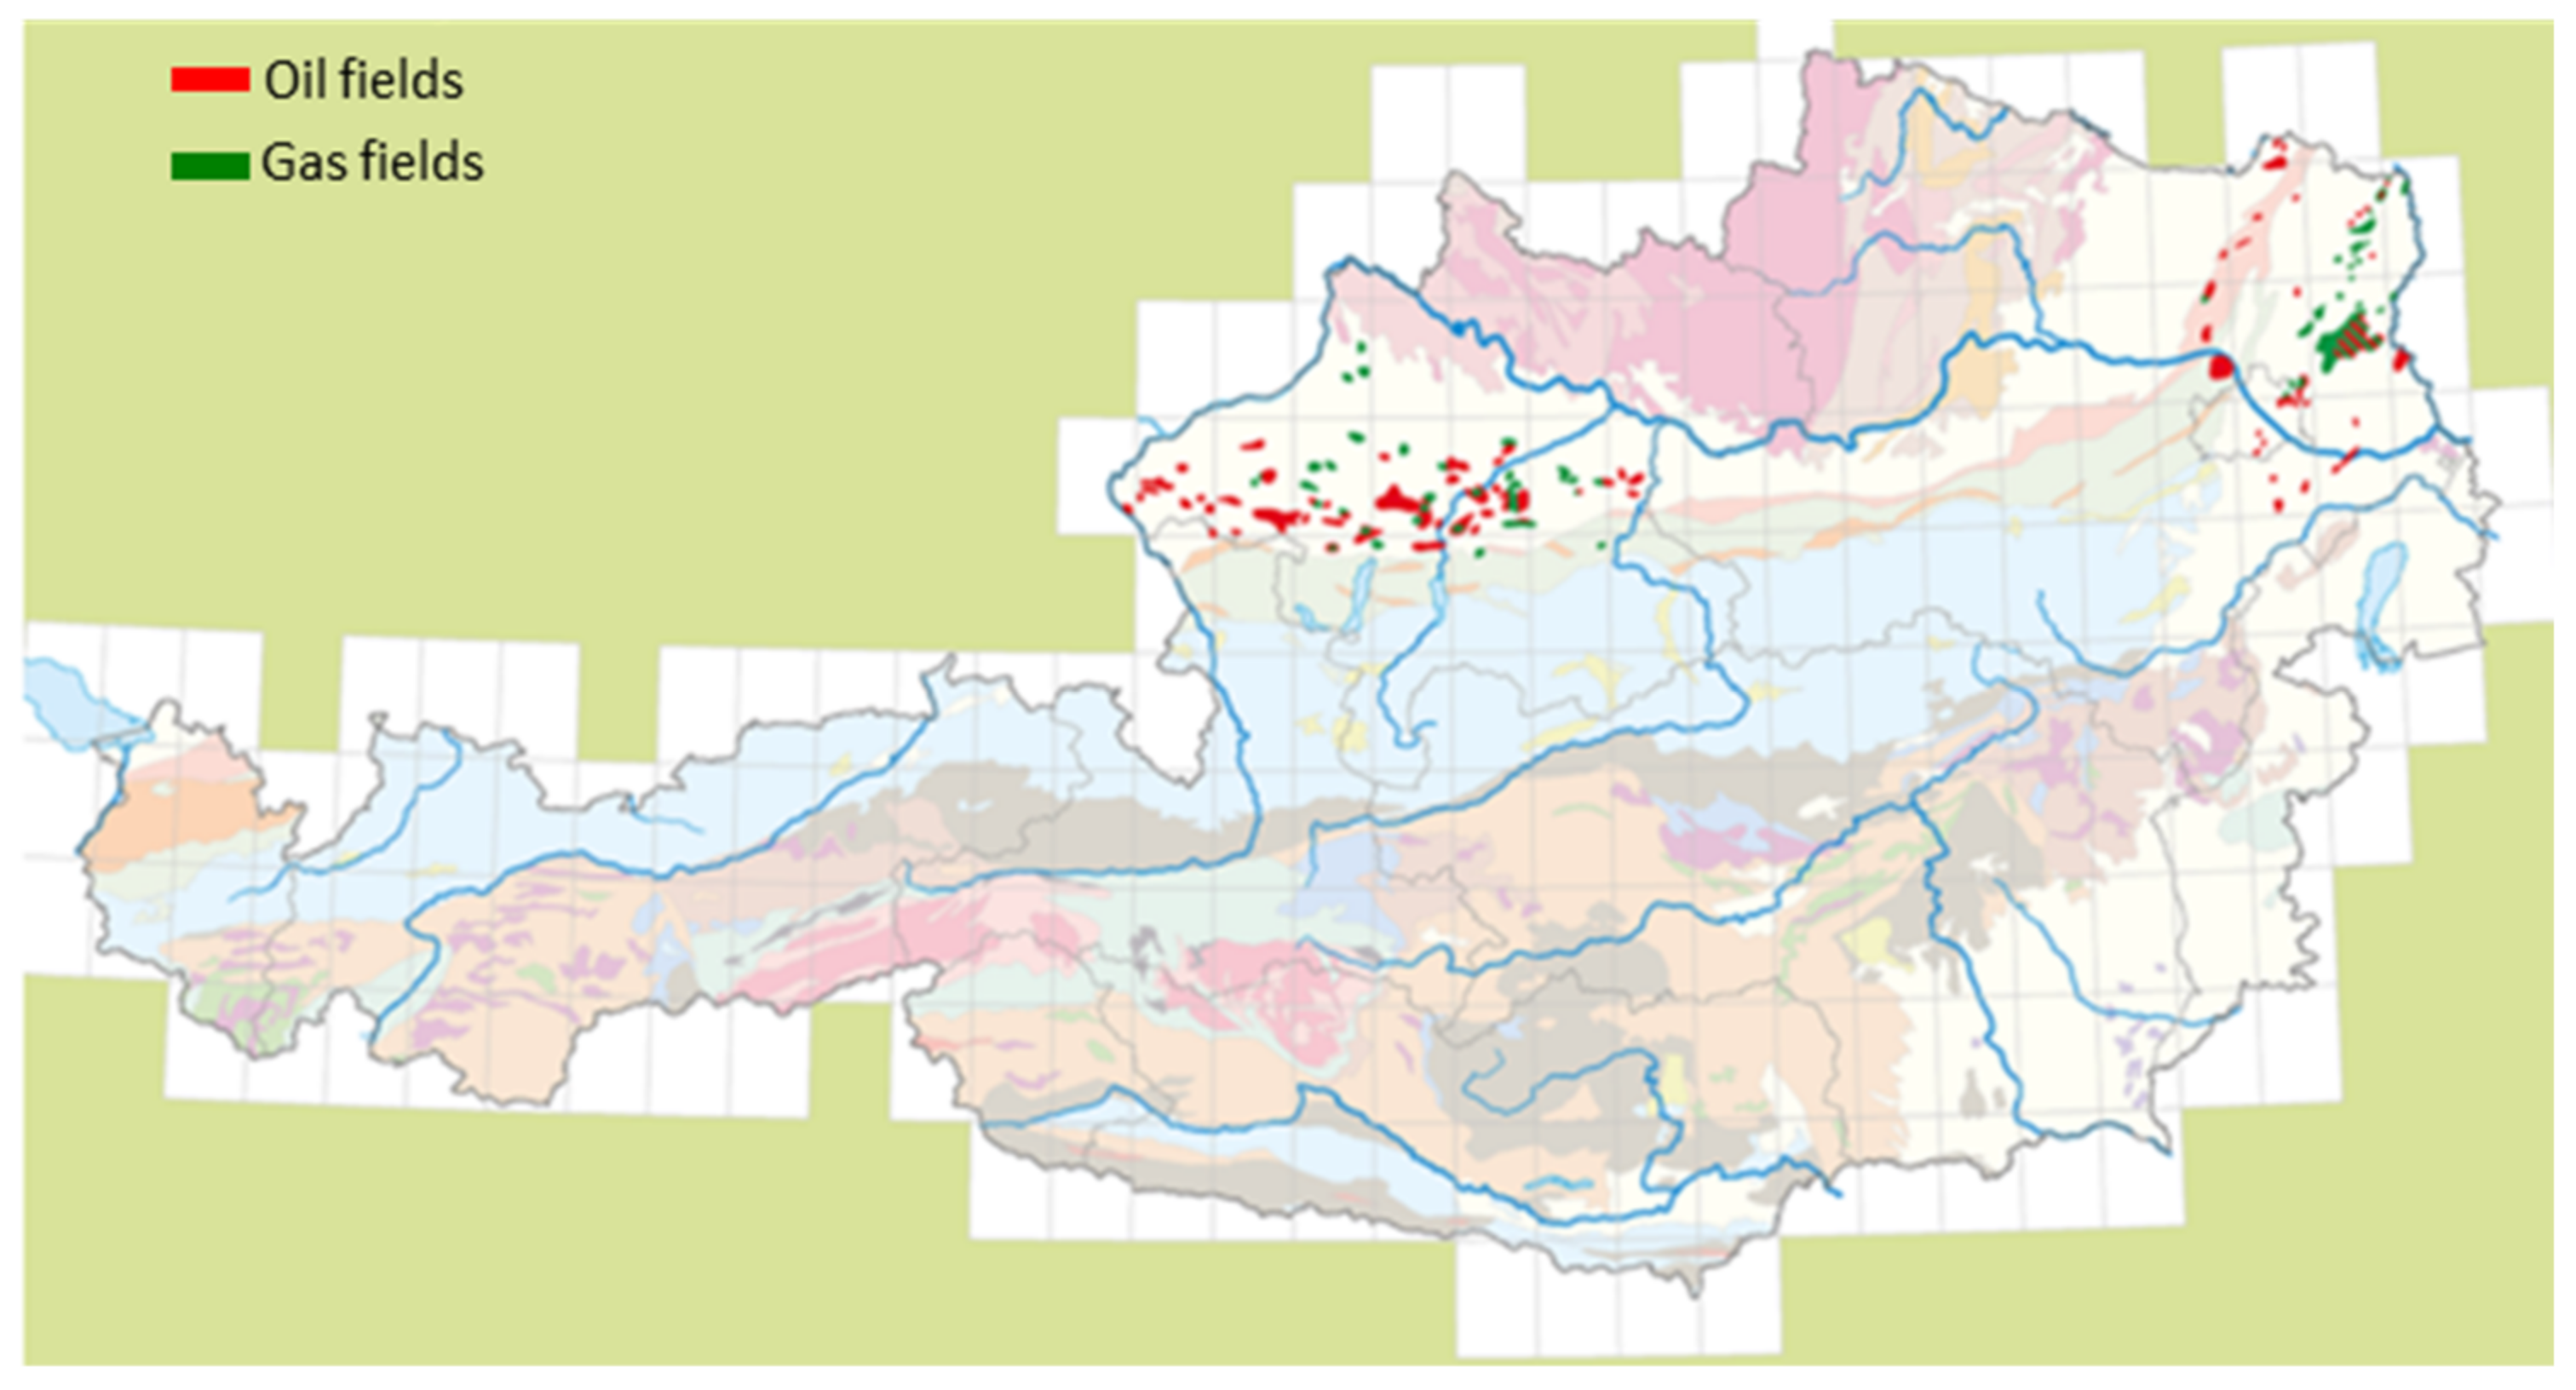
6. Underground Hydrogen Storage Opportunities in Austria

Energy consumption in Austria is higher in winter- than in summertime. Current electricity generation using REN in Austria is higher in summer- than in wintertime. Currently, the higher energy requirement in winter- than in summertime is balanced by imports of electricity with higher CO2 emissions than electricity generated in Austria and fossil fuels. The extended use of REN will require seasonal storage of large amounts of energy, which can be done by using UHS (Figure 1).
Within Austria, several large-scale aquifers, oil fields, and gas fields exist, which might be used for UHS. There are several technological challenges that need to be addressed in the selection of a structure for UHS. The caprock providing the seal for the UHS needs to be tight for hydrogen to prevent hydrogen leakage, as hydrogen might interact with the reservoir or caprock, resulting in hydrogen losses or contamination, bacterial activity might convert hydrogen leading to losses or contamination, hydrogen injection might lead to instable displacement owing to the low viscosity of hydrogen, and the hydrogen will show strong mixing effects due to the large diffusion coefficient of hydrogen, which might result in contamination of the gas, in particular, in reservoirs with strong permeability contrasts (e.g., [20,86]).
The most cost-efficient option of large-scale UHS is gas fields. The reasons are that no hydrogen–oil interactions need to be taken into account for gas fields, the amount of water is limited in the case of gas fields with limited aquifer support, the caprock was sealed during geological times for gas, which increases the probability that these reservoirs are suitable for hydrogen storage, and the reservoir characterization of gas fields is much better than the characterization of aquifers. In total, more than 70 bn m3 gas and 100 mn t of oil were produced in Austria 1935–2021 [87]. The hydrocarbon fields are located in two regions, the molasse basin north of the Alps and in the Vienna Basin north east of Vienna (Figure 16) (Geological Survey of Austria). In the molasse basin in upper Austria, UGS fields with a storage volume of about 6 bn m3 exist [59]. The gas storage volume in the Vienna basin is about 2 bn m3 [59]. The UGS reservoirs are well connected to an envisaged European hydrogen gas distribution grid [88] (Figure 17). In addition, there are aquifers in Austria, which might be used for hydrogen gas storage. Comparing the potential of hydrocarbon fields and aquifers, which might be used for UHS with the required hydrogen storage volumes, shows that there is expected to be sufficient capacity in Austria to balance the differences in energy generation using REN and energy demand in summer- and wintertime.

7. Recommendations for Decarbonization of Austria

A substantial percentage of Austria’s energy consumption is based on REN (32%). To decarbonize Austria, technologies need to be developed and infrastructure generated. Austria has significant potential to further increase REN generation. A number of technology developments are required to realize the full potential of REN in Austria. Areas of lower TRL are oxyfuel combustion of biomass, synthetic fuels out of hydrogen, efficient generation of electricity from hydrogen, and UHS. To achieve net zero in 2040, these technologies need to be developed at a high pace. A “Sustainable Energy Campus”, including electricity generation, hydrogen storage, and conversion, as well as oxyfuel combustion, would accelerate integrated technology development and energy-efficient integration of the various components could be envisaged. Such a “Sustainable Energy Campus” would accelerate technology development to achieve TRL 9 in time for deployment of the technologies. Some of the technologies can be implemented as modular systems (e.g., agrivoltaics, electrolysis), allowing for organic and fast growth of REN.
In addition, potential UHS locations need to be screened for the large-scale storage of hydrogen. The UHS locations need to meet reservoir characteristics (e.g., permeability, porosity, mineral composition), as well as proximity to hydrogen consumers or pipelines.
Furthermore, the energy infrastructure for electricity and hydrogen generation and distribution needs to be evaluated for suitability and potential for REN.

8. Conclusions

Achieving carbon neutrality for Austria in 2040 is challenging. In addition to Renewable Energy (REN) generation, the differences in energy generation using REN and energy consumption need to be addressed. Hydrogen will play an important role as an energy carrier and for CO2-emission-free industry feedstock. However, substantial additional REN generation is required to generate hydrogen. The energy efficiency loss when electricity generated by REN is transferred into hydrogen results in increases in energy requirements, partly offsetting efficiency gains. Several technology components in the integrated electricity–hydrogen systems are at Technology Readiness Levels (TRLs) of 5 or lower. Hence, significant technology development is required to reach technology maturity. As capital-intensive investments require a long time of payback, the TRLs of the various components need to be reached more than ten years prior to an envisaged carbon neutrality. One key component is the CAPEX per kWh of the electrolyser. Significant cost reduction needs to be achieved to reach cost competitiveness of hydrogen generation using REN. The second important factor is the cost of electricity with the load hours. Low electricity costs at times of high energy generation using REN and high electricity costs at times of low REN generation will lead to cost-efficient hydrogen generation (high REN electricity generation) and conversion of hydrogen to electricity (low REN electricity generation).
Austria has substantial potential for REN generation. The total contribution of REN was 32.6% in 2018, and additional potential is estimated to be up to 15 TWh for hydropower, 25 TWh for wind, and 100 TWh for photovoltaic (PV). The large potential for PV assumes the use of agrivoltaics. The annual fluctuations in REN generation require large amounts of energy storage. Dependent on the scenario, the Externally Dependent Scenario (EDS), Balanced Energy Scenario (BES), or Self-Sustained Scenario (SSS), various amounts of REN are expected to be imported. The resulting required hydrogen storage capacity in Austria ranges from 11 bn m3 to 19 bn m3. Which of the scenarios will materialize depends on political and market-driven factors.
Austria’s hydrogen storage potential in hydrocarbon fields and aquifers is expected to be sufficient to cover the storage requirements; furthermore, the gas fields are close to the envisaged European hydrogen pipeline system.
To accelerate the decarbonization of Austria, a “Sustainable Energy Campus”, in which various technologies as well as the synergies are tested and developed towards TRL 9, should be envisaged. In addition, UHS storage sites need to be screened and the readiness of the energy infrastructure for REN electricity and hydrogen assessed and developed.

Author Contributions

Conceptualization, M.C. and T.C.; methodology, T.C.; validation, T.C.; formal analysis, M.C. and T.C.; investigation, M.C. and T.C.; writing—original draft preparation, M.C. and T.C.; writing—review and editing, T.C.; visualization, M.C. and T.C.; supervision, T.C.; project administration, T.C. All authors have read and agreed to the published version of the manuscript.

Funding

This research received no external funding.

Institutional Review Board Statement

Not applicable.

Acknowledgments

Thanks to Keyvan Osivandi (OMV E&P) and Leo Bräuer (OMV E&P) for the discussions.

Conflicts of Interest

The authors declare no conflict of interest.

Abbreviations

BESBalanced Energy Scenario
BEVBattery Electric Vehicles
CAPEXCapital Expenditures
CCSCarbon Capture and Storage
EDSExternally Dependent Scenario
EUEuropean Union
ECSEfficient Consumption Scenario
FCVFuel Cell Vehicles
GHGGreenhouse Gas
IEAInternational Energy Agency
IGIPInitial Gas In Place
ICEInternal Combustion Engine
IPCCIntergovernmental Panel on Climate Change
LCOELevelized Costs of Electricity
LCOHLevelized Costs of Hydrogen
NZENet-Zero Emission Scenario of the International Energy Agency
OPEXOperating Expenditures
PHSPumped Hydro Storage
PVPhotovoltaic
RENRenewable Energy
SMRSteam Methane Reforming
SSSSelf-Sustained Scenario
TRLTechnology Readiness Level
UGSUnderground Gas Storage
UHSUnderground Hydrogen Storage

Appendix A. Economics of Hydrogen Generation

Currently, a cost-efficient production method for hydrogen is Steam Methane Reforming (SMR) (e.g., [89]). As such, 48% of current hydrogen production is steam reforming, 30% comes from petroleum fractions, 18% coal gasification and 4% by electrolysis [90]. Costs for hydrogen generation using REN are currently significantly higher than applying SMR (e.g., [91,92]). However, CO2 emissions related to hydrogen production using SMR are about 7 kg CO2/kg H2 (e.g., [93]). To reduce CO2 emissions from SMR, the produced CO2 can be captured and geologically stored (e.g., [94,95]). Costs for SMR with CO2 capture and storage are currently lower than hydrogen generation using REN; however, greenhouse gas emissions related to production and transport of gas need to be accounted for (e.g., [96]). Another method to generate hydrogen is thermal decomposition of methane by pyrolysis. Pyrolysis is at a lower TRL than the methods mentioned above (e.g., [97,98]). As for SMR with CO2 capture and storage (CCS), greenhouse gas emissions related to production and transport of gas need to be considered for pyrolysis [99]. CO2 geological storage is currently forbidden in Austria [100]. As additional greenhouse gas emissions related to hydrocarbon exploration and production, as well as transport, need to be considered for CCS, here, we focus on hydrogen production using REN. Hydrogen can be generated using nuclear energy (e.g., [101]); however, in Austria, the use of nuclear power stations is forbidden by law [102] and is, therefore, not considered here.
The generation of hydrogen using REN requires electrolysis. The electrolyser is the major part of capital expenditure (CAPEX) related to hydrogen generation using REN (e.g., [103]). The CAPEX for electrolysers is expected to decrease to a range of of 400–900 USD/kW for alkaline electrolysis and 250–750 USD/kW for proton exchange membrane technologies (Figure A1) [104].
The second important parameter concerning costs of producing hydrogen using REN is the utilization rate of the electrolyser (e.g., [105]). The third parameter is the cost of electricity. Figure A2 shows that the Levelized Costs of Hydrogen (LCOH)—accounting for all capital and operating costs of producing hydrogen—steeply decrease until about 3000 annual full load hours [81]. The reason is the decreasing influence of the CAPEX in this range. The lowest hydrogen costs are achieved in this example in the mid range, from 2500–6000 full load hours. Above 6000 h, the LCOH grow as the operating expenditure (OPEX) part related to electricity costs increases. The curve shown in Figure A1 is case dependent, the IEA assumed a discount rate of 8% and CAPEX of 800 USD/kWe and Japanese electricity spot prices in 2018.
The LCOH generation, as shown in Figure A1, depends on the CAPEX and electricity costs versus load hours. Increasing the use of REN for electricity generation will change the load duration curve (e.g., [17,47]). For a high percentage of REN penetration, van Gerwen et al. [47] showed that the load duration curve will significantly change. There will be periods of overproduction, which leads to low or zero electricity price [47]. For Austria, EIW estimates that excess energy could be available for 5500 h in 2030 [28].
Figure A1. Levelized Cost of Hydrogen (LCOH) as a function of annual full load hours. Up to 2500 h, CAPEX costs dominate and costs are decrease, OPEX other than electricity decreases as well and is included in CAPEX + OPEX. Above 6000 h OPEX related to electricity is most important. The optimum for this example case is between 2500 and 6000 h. (adapted from [81] with permission from IEA 2019).
Energies 15 03742 g0a1
Three different periods will emerge for a large contribution of REN to energy generation [47] (Figure A2):
A time during which the production of REN is higher than the demand. This will result in low electricity prices, which can be used to generate hydrogen;
A time during which hydrogen is used to balance production and demand;
A time of electricity shortage in which electricity prices are high and hydrogen can be electrified.
Figure A2. Example renewable energy generation and demand for a high penetration of REN). Three periods can be distinguished [47]: (1) production of hydrogen during REN surplus, (2) use of hydrogen, and (3) electrification of hydrogen.
Energies 15 03742 g0a2
The forecasted decreasing costs for electrolysers and increasing penetration of REN for electricity generation leads to a substantial reduction in the LCOH. Various authors forecast that in the early 2030s, the LCOH of hydrogen generation using REN will be lower than generation of hydrogen using fossil fuels (e.g., [47,83,106]). For Austria, EIW forecast 5500 h with excess electrical energy being available already in 2030 if the planned national Austrian strategy for electricity generation is executed [28].

References

  1. European Union. Establishing the Framework for Achieving Climate Neutrality and Amending Regulations (EC) No 401/2009 and (EU) 2018/1999 (‘European Climate Law’). Regulation (EU) 2021/1119 of the European Parliament and of the Council; European Commission: Brussels, Belgium, 2021. [Google Scholar]
  2. IPCC. Climate Change 2021: The Physical Science Basis. Contribution of Working Group I to the Sixth Assessment Report of the Intergovernmental Panel on Climate Change; IPCC: Geneva, Switzerland, 2021. [Google Scholar]
  3. European Commission. Council Directive EU 2018/2001: Promotion of Energy from Renewable Sources; European Commission: Brussels, Belgium, 2021. [Google Scholar]
  4. European Commission. The European Green Deal. Communication from the Commission to the European Parliament, the Council, the European Economic and Social Committee and the Committee of the Regions; European Commission: Brussels, Belgium, 2019. [Google Scholar]
  5. European Commission. A Hydrogen Strategy for a Climate-Neutral Europe. Communication from the Commission to the European Parliament, the Council, the European Economic and Social Committee and the Committee of the Regions; European Commission: Brussels, Belgium, 2020. [Google Scholar]
  6. IEA. Renewables 2021—Analysis and Forecast to 2026; IEA Report; IEA: Paris, France, 2021. [Google Scholar]
  7. IEA. Net Zero by 2050—A Roadmap for the Global Energy Sector; IEA Report; IEA: Paris, France, 2021. [Google Scholar]
  8. Republik Österreich. Erneuerbaren-Ausbau-Gesetz; Gesetz Republik Österreich: Vienna, Austria, 2021. [Google Scholar]
  9. European Commission. REPowerEU: Joint European Action for More Affordable, Secure and Sustainable Energy; Document 52022DC0108; European Commission: Brussels, Belgium, 2022. [Google Scholar]
  10. Austrian Energy Agency. Strategische Handlungsoptionen für Eine Österreichische Gasversorgung ohne Importe aus Russland; Report for Bundesministerum für Klimaschutz, Umwelt, Energie; Austrian Energy Agency: Vienna, Austria, 2022. [Google Scholar]
  11. Mauch, B.; Apt, J.; Carvalho, P.M.S.; Paulina, J. What day-ahead reserves are needed in electric grids with high levels of wind power? Environ. Res. Lett. 2013, 8, 034013. [Google Scholar] [CrossRef] [Green Version]
  12. Impram, S.; Nese, S.V.; Oral, B. Challenges of renewable energy penetration on power system flexibility: A survey. Energy Strategy Rev. 2020, 31, 100539. [Google Scholar] [CrossRef]
  13. Holttinenen, H.; Tuohy, A.; Milligan, M.; Silva, V.; Müller, S.; Söder, L. The Flexibility Workout: Managing Variable Resources and Assessing the Need for Power System Modification. IEEE Power Energy Mag. 2013, 11, 53–62. [Google Scholar] [CrossRef]
  14. Hillberg, E.; Zegers, A.; Herndler, B.; Wong, S.; Pompee, J.; Bourmaud, J.-Y.; Lehnhoff, S.; Migliavacca, G.; Uhlen, K.; Oleinikova, I.; et al. Power Transmission & Distribution Systems—Flexibility needs in the future power system. Discussion Paper. 2019. Available online: iea-isgan.org (accessed on 15 March 2022).
  15. Rüdisüli, M.; Teske, S.L.; Elber, U. Impact of an Increased Substitution of Fossil Energy Carriers with Electricity-Based Technologies on the Swiss Electricity System. Energies 2019, 12, 2399. [Google Scholar] [CrossRef] [Green Version]
  16. Argyrou, M.C.; Christodoulides, P.L.; Marouchos, C.C.; Kalogirou, S.A.; Florides, G.A.; Lazari, L. Overview of Energy Storage Technolgoeis and a Short-term Storage Applications for Wind Turbines. In Proceedings of the Twinty-Sixth International Ocan and Polar Engineering Conference, Rhodes, Greece, 26 June–1 July 2016. [Google Scholar]
  17. Dowling, J.A.; Rinaldi, K.Z.; Ruggles, T.H.; Davis, S.J.; Yuan, M.; Tong, F.; Lewis, N.S.; Caldeira, K. Role of Long-Duration Energy Storage in Variable Renewable Electricity Systems. Joule 2020, 4, 1907–1928. [Google Scholar] [CrossRef]
  18. IEA. Technology Roadmap—Hydrogen and Fuel Cells; IEA Report; IEA: Paris, France, 2015. [Google Scholar]
  19. Olabi, A.G.; Saleh Bahri, A.; Abdelghafar, A.A.; Baroutaji, A.; Sayed, E.T.; Alamim, A.H.; Rezk, H.; Abdelkareem, M.A. Large-vscale hydrogen production and storage technologies: Current status and future directions. Int. J. Hydrogen Energy 2021, 46, 23498–23528. [Google Scholar] [CrossRef]
  20. Zivar, D.; Kumar, S.; Foroozesh, J. Underground hydrogen storage: A comprehensive review. Int. J. Hydrogen Energy 2021, 46, 23436–23462. [Google Scholar] [CrossRef]
  21. Kruck, O.; Crotogino, F.; Prelicz, R.; Rudolph, T. Overview on All Known Underground Storage Technologies for Hydrogen. Report. HyUnder Grant Agreement No.: 303417 Deliverable No. 3.1. 2013. Available online: http://hyunder.eu/wp-content/uploads/2016/01/D3.1_Overview-of-all-known-underground-storage-technologies.pdf (accessed on 20 March 2020).
  22. Londe, L.F. Four Ways to Store Large Quantities of Hydrogen. In Proceedings of the Abu Dhabi International Petroleum Exhibition & Conference, Abu Dhabi, United Arab Emirates, 15–18 November 2021. SPE-208178. [Google Scholar]
  23. Ogden, J.M. Prospects for Building a Hydrogen Energy Infrastructure. Annu. Rev. Energy Environ. 1999, 24, 227–279. [Google Scholar] [CrossRef]
  24. Scafidi, J.; Wilkinson, M.; Gilfillan, S.M.V.; Heinemann, N.; Haszeldine, R.S. A quantitative assessment of the hydrogen storage capacity of the UK continental shelf. Int. J. Hydrogen Energy 2021, 46, 8629–8639. [Google Scholar] [CrossRef]
  25. Henkel, S.; Pudlo, D.; Werner, L.; Enzman, F.; Reitenbach, V.; Albrecht, D.; Würdeman, H.; Heister, K.; Gsnzer, L.; Gaupp, R. Mineral reactions in the geological underground induced by H2 and CO2 injections. Energy Procedia 2014, 63, 8026–8035. [Google Scholar] [CrossRef] [Green Version]
  26. Mahdi, D.S.; Al-Khadheeawi, E.A.; Yuan, Y.; Zhang, Y.; Iglauer, S. Hydrogen underground storage efficiency in a heterogeneous sandstone reservoir. Adv. Geo-Energy 2021, 5, 437–443. [Google Scholar] [CrossRef]
  27. Heinemann, N.; Alcalde, J.; Miocic, J.M.; Hangx, S.J.T.; Kallmeyer, J.; Ostertag-Hennning, C.; Hassanpouryouzband, A.; Thaysen, E.M.; Strobel, G.J.; Schmidt-Hattenberger, C.; et al. Enabling large-scale hydrogen storage in porous media—The scientific challenges. Energy Environ. Sci. 2021, 14, 853–864. [Google Scholar] [CrossRef]
  28. EIW. Wasserstoff Zentraler Baustein der Energiewende; EIWInsights, Wasserstoff; Energieinstitut der Wirtschaft EIW: Vienna, Austria, 2021. [Google Scholar]
  29. Lechinger, V.; Matzinger, S. So Heizt Österreich—Heizungsarten und Energieträger in österreichischen Haushalten im Sozialen Kontext. Report. AK Wirtschaftspolitik Standpunke 1. 2020. Available online: https://energytransition.klimafonds.gv.at/wp-content/uploads/sites/7/2020/05/So-heizt-%C3%96sterreich.pdf (accessed on 25 February 2022).
  30. ÖVGW. Gasbeschaffenheit. Richtlinie G B 210. Regulation. Regel der Österreichische Vereinigung für das Gas- und Wasserfach (ÖVGW). 2021. Available online: https://portal.ovgw.at/pls/f?p=101:203::::RP,203:P203_ID,P203_FROM_PAGE_ID:1075524,202 (accessed on 30 March 2022).
  31. Melaina, M.W.; Antonia, O.; Penev, M. Blending Hydrogen into Natural Gas Pipeline Networks: A Review of Key Issues; Technical Report NREL/TP-5600+51995; National Renewable Energy Laboratory: Golden, CO, USA, 2013. [Google Scholar]
  32. Cerniauskas, S.; Chavez Junco, A.J.; Grube, T.; Robinius, M.; Stolten, D. Options of natural gas pipeline reassignment for hydrogen: Cost assessment for a Germany case study. Int. J. Hydrogen Energy 2020, 45, 12095–12107. [Google Scholar] [CrossRef] [Green Version]
  33. VCÖ. Kurzbericht Entwicklung Kerosinverbrauch und CO2-Emissionen des Flugverkehrs in Österreich; Mobilität mit Zukunft. Bericht; VCÖ: Vienna, Austria, 2019. [Google Scholar]
  34. McKinsey. Hydrogen-Powered Aviation—A Fact-Based Study of Hydrogen Technology, Economics, and Climate Impact by 2020; Study for the Clean Sky 2 JU and Fuel Cells and Hydrogen 2 JU; McKinsey: Brussels, Belgium, 2020. [Google Scholar]
  35. Yusaf, T.; Fernandez, L.; Abu Talib, A.B.; Altarazi, Y.S.M.; Alrefae, W.; Kadirgama, K.; Ramasamy, D.; Jayasuriya, A.; Brown, G.; Mamat, R.; et al. Sustainable Aviation—Hydrogen Is the Future. Sustainability 2022, 14, 548. [Google Scholar] [CrossRef]
  36. Wang, A.; Jens, J.; Mavins, D.; Moultak, M.; Schimmel, M.; van der Leun, K.; Peters, D.; Buseman, M. Report: Analysing Future Demand, Supply, and Transport of Hydrogen. European Hydrogen Backbone. Report. June 2021. Available online: https://gasforclimate2050.eu/wp-content/uploads/2021/06/EHB_Analysing-the-future-demand-supply-and-transport-of-hydrogen_June-2021.pdf (accessed on 24 February 2022).
  37. Clemens, T.; Poeschko, M.; Lueftenegger, M. The Impact of the Advent of E-Cars on Transport Fuel Consumption. In Proceedings of the 22nd World Petroleum Congress, Istanbul, Turkey, 9–13 July 2017. [Google Scholar]
  38. Ball, M.; Wietschel, M. The future of hydrogen–opportunities and challenges. Int. J. Hydrogen Energy 2009, 34, 615–627. [Google Scholar] [CrossRef]
  39. Statista. 2021. Available online: https://de.statista.com/statistik/daten/studie/962273/umfrage/treibhausgas-emissionen-des-sektors-verkehr-in-oesterreich-nach-verursacher/ (accessed on 14 February 2022).
  40. Anderl, M.; Geiger, K.; Gugele, B.; Gössl, M.; Haider, S.; Heller, C.; Köther, T.; Krutzler, T.; Kuchel, V.; Lampert, C.; et al. Report: REP-0738 Umweltbundesamt. Klimaschutzbericht 2020. 2020. Available online: https://www.umweltbundesamt.at/fileadmin/site/publikationen/rep0738.pdf (accessed on 3 March 2022).
  41. Ali, M.B.; Saidur, R.; Hossain, M.S. A review on emission analysis in cement industries. Renew. Sustain. Energy Rev. 2011, 15, 2252–2261. [Google Scholar] [CrossRef]
  42. Benhelal, E.; Zahedi, G.; Shamsaei, E.; Bahadori, A. Global strategies and potentials to curb CO2 emissions in cement industry. J. Clean. Prod. 2013, 51, 142–161. [Google Scholar] [CrossRef]
  43. Vogl, V.; Ahman, M.; Nilsson, L.J. Assessment of hydrogen direct reduction for fossil-free steelmaking. J. Clean. Prod. 2018, 203, 736–745. [Google Scholar] [CrossRef]
  44. Toktarova, A.; Göransson, L.; Johnsson, F. Design of Clean Steel Production with Hydrogen: Impact of Electricity System Composition. Energies 2021, 14, 8349. [Google Scholar] [CrossRef]
  45. Holmes, K.J.; Zeitler, E.; Kerxhalli-Kleinfeld, M.; DeBoer, R. Scaling Deep Decarbonization Technologies. Earth’s Future 2021, 9, e2021EF002399. [Google Scholar] [CrossRef]
  46. Bundesministerium Klimaschutz, Umwelt, Energie, Mobilität, Innovation und Technologie. 2020. Report: Energie in Österreich–Zahlen, Daten, Fakten. 2021. Available online: https://www.bmk.gv.at/dam/jcr:f0bdbaa4-59f2-4bde-9af9-e139f9568769/Energie_in_OE_2020_ua.pdf (accessed on 19 February 2022).
  47. Van Gerwen, R.; Eijgelaar, M.; Bosma, T. Hydrogen in the Electricity Value Chain. DVN GL Group Technology & Research. Position Paper. 2019. Available online: https://energeia-binary-external-prod.imgix.net/Ev5fBfgzH3mvL3FOErMDpw0D3Zg.pdf?dl=DNV+GL+-+Hydrogen+in+the+Electricity+Value+Chain.pdf (accessed on 14 February 2022).
  48. Vandewalle, J.; Bruninx, K.; D’haeseleer, W. Effects of large-scale power to gas conversion on the power, gas and carbon sectores and their interactions. Energy Convers. Manag. 2015, 94, 28–39. [Google Scholar] [CrossRef] [Green Version]
  49. Prasad, V.N. Hydrogen as a Path to Sector-Coupled Deep Decarbonization. In Proceedings of the Abu Dhabi International Petroleum Exhibition & Conference, Abu Dhabi, United Arab Emirates, 9–12 November 2020. Paper SPE-202999. [Google Scholar]
  50. Mendonca, C.; Ferreira, A.; Santos, D.M.F. Towards the Commercialization of Solid Oxide Fuel Cells: Recent Advances in Materials and Integration Strategies. Fuels 2021, 2, 393–419. [Google Scholar] [CrossRef]
  51. Sher, F.; Pans, M.A.; Sun, C.; Snape, C.; Liu, H. Oxy-fuel combustion study of biomass fuels in a 20 kWth fluidized bed combustor. Fuel 2018, 215, 778–786. [Google Scholar] [CrossRef]
  52. Kosowska-Golachowska, M.; Luckos, A.; Kijo-Kleczkowska, A. Pollutant Emissions during Oxy-Fuel Combustion of Biomass in a Bench Scale CFB Combustor. Energies 2022, 15, 706. [Google Scholar] [CrossRef]
  53. Hänggi, S.; Elbert, P.; Bütler, T.; Cabalzar, U.; Teske, S.; Bach, C.; Onder, C. A review of synthetic fuels for passenger vehicles. Energy Rep. 2019, 5, 555–569. [Google Scholar] [CrossRef]
  54. Siegemund, S.; Schmidt, P.; Trommler, M.; Weindorf, W.; Kolb, O.; Zittel, W.; Zinnercker, V.; Raksha, T.; Zerhusen, J. E-Fuels Study, the Potential of Electricity-Based Fuels for Low-Emission Transport in the EU; Deutsche Energie Agentur: Berlin, Germany, 2017. [Google Scholar]
  55. Thomson, R.; Weichenhain, U.; Sachdeva, M.; Gupta, A.; Stern, C.; Trueman, N. Hydrogen: A Future Fuel for Aviation? Focus Roland Berger: Munich, Germany, 2020. [Google Scholar]
  56. Mankins, J.C. Technology Readiness Levels—A White Paper; NASA: Washington, DC, USA, 1995. [Google Scholar]
  57. IEAGHG. Global Assessment of Direct Air Capture Costs; IEAGHG Technical Report 2021-05; IEAGHG: Cheltenham, UK, 2021. [Google Scholar]
  58. Bloomberg NEF. Hydrogen Economic Outlook; Report; Bloomberg Finance L.P.: New York, NY, USA, 2020. [Google Scholar]
  59. E-Control. 2021. Statistikbrochüre. 2021. Available online: https://www.e-control.at/documents/1785851/1811582/E-Control-Statbro-2021.pdf/83442b63-df8c-a732-7152-8df34986c2c3?t=1636364279845 (accessed on 5 March 2022).
  60. IEA. Austria 2020—Energy Policy Review; IEA Report; IEA: Paris, France, 2020. [Google Scholar]
  61. Biermayr, P. Erneuerbare Energie in Zahlen 2018—Entwicklung in Österreich Datenbasis 2017; Report, e-Think; Zentrum für Energiewirtschaft und Umwelt: Vienna, Austria, 2018. [Google Scholar]
  62. Pöyry. Österreichs E-Wirtschaft—Wasserkraftpotenzialstudie Österreich; Aktualisierung 2018. Bericht 2018; Pöyry Austria GmBH: Vienna, Austria, 2018. [Google Scholar]
  63. Moser, S.; Goers, S.; de Bruyn, K.; Steinmüller, H.; Hofmann, R.; Panuschka, S.; Kienberger, T.; Sejkora, C.; Haider, M.; Werner, A.; et al. Abstimmung des Energiebedarfs von Industriellen Anlagen und der Energieversorgung aus Fluktuierenden Erneuerbaren. Report for Project Renewables4Industry. 2018. Available online: https://energieinstitut-linz.at/wp-content/uploads/2018/04/Renewables4Industry-Diskussionspapier.pdf (accessed on 14 February 2022).
  64. Wolf, G. Klimaschutz in Österreich: Maßnahmen und Investitionsbedarf—Ein Überblick; Analysen; Bank Austria: Vienna, Austria, 2020. [Google Scholar]
  65. Königshofer, K.; Domberger, G.; Gunczy, S.; Hingsamer, M.; Pucker, J.; Schreilechner, M.; Amtmann, J.; Goldbrunner, J.; Heiss, H.P.; Füreder, J.; et al. Potenzial der Tiefengeothermie für die Fernwärme- und Stromproduktion in Österreich. 2014. Available online: https://energieforschung.at/wp-content/uploads/sites/11/2020/12/834451-Endbericht-GeoEnergie2050-30062014-final.pdf (accessed on 21 January 2022).
  66. IEA. IEA Bioenergy Countries’ Report; IEA Bioenergy Report. Project Number N41029016; IEA: Paris, France, 2016. [Google Scholar]
  67. Resch, G.; Burghozer, B.; Totschnig, G.; Lettner, G.; Auer, H.; Geipel, J. Stromzukunft Österreich 2030—Analyse der Erfordernisse und Konsequenzen eines Ambitionierten Ausbaus Erneuerbarer Energien. Endbericht. May 2017. Available online: https://www.igwindkraft.at/mmedia/download/2018.02.05/1517824995073289.pdf (accessed on 1 February 2022).
  68. SolarGIS. GeoModel Solar, CC BY-SA 3.0. Available online: https://commons.wikimedia.org/w/index.php?curid=33523153 (accessed on 5 March 2022).
  69. Fechner, H. Ermittlung des Flächenpotentials für den Photovoltaik-Ausbau in Österreich: Welche Flächenkategorien sind für die Erschließung von besonderer Bedeutung, um das Ökostromziel realisieren zu können. Sudie im Auftrag von Österreichs Energie, Endbericht. 2020. Available online: https://oesterreichsenergie.at/fileadmin/user_upload/Oesterreichs_Energie/Publikationsdatenbank/Studien/2020/PV-Studie_2020.pdf (accessed on 4 February 2022).
  70. Trommsdorff, M.; Gruber, S.; Keinath, T.; Kopf, M.; Hermann, C.; Schönberger, F.; Högy, P.; Zikeli, S.; Ehmann, A.; Weselek, A.; et al. Agrivoltaics: Opportunities for Agriculture and the Energy Transition; Fraunhofer Institute for Solar Energy Systems ISE: Breisgau, Germany, 2020. [Google Scholar]
  71. Abidin, M.A.Z.; Mahyuddin, M.N.; Zainuri, M.A.A.M. Solar Photovoltaic Architecture and Agronomic Agrivoltaic System: A Review. Sustainability 2021, 13, 7846. [Google Scholar] [CrossRef]
  72. Österreichischer Biomasse-Verband 2019. Basisdaten 2019—Bioenergie. Österreichischer Biomasse-Verband. 2019. Available online: https://www.biomasseverband.at/wp-content/uploads/Basisdaten_Bioenergie_2019.pdf (accessed on 11 February 2022).
  73. Scharf, J.; Grieb, M.; Fritz, M. Agri-Photovoltaik—Stand und offene Fragen. Technologie- und Förderzentrum im Kompetenzzentrum für Nachwachsende Rohstoffe. Berichte aus dem TF/73. 2021. Available online: https://www.tfz.bayern.de/mam/cms08/rohstoffpflanzen/dateien/tfz_bericht_73_agri-pv.pdf (accessed on 5 February 2022).
  74. WKO. Branchenreport Mineralöl. Fachverband Mineralölindustrie; WKO: Wien, Austria, 2020. [Google Scholar]
  75. Christian, R.; Feichtinger, R.; Christian, R.; Bolz, R.; Windsperger, A.; Hummel, M.; Weish, P.; Pfnier, E. Zukunftsfähige Energieversorgung für Österreich. Berichte aus Energie- und Umweltforschung 13/2011; Innovation und Technologie; Bundesministerium für Verkehr: Berlin, Germany, 2011. [Google Scholar]
  76. Kranzl, L.; Müller, A.; Maia, I.; Büchele, R. Wärmewende 2030: Analyse der Erfordernisse und Konsequenzen—Teilbericht zur Wirtschaftlichkeitsanalyse von Heizsystmen. Bericht EEÖ—Erneuerbare Energy Österreich. November 2017. Available online: https://www.propellets.at/assets/upload/Presseaussendungen/16.11.2017%20TU%20Studie%20Heizkostenvergleich/Studie_Waermewende_2030.pdf (accessed on 26 February 2022).
  77. Clemens, M.; Clemens, T.; Zechner, M. BEV, PHEV, ICE Vehicles and the Role of Hydrogen Storage and Carbon Capture and Storage for Decarbonisation of Private Transport. In Proceedings of the ECEEE Summer Study Proceedings 2021, Virtual, 7–11 June 2021. Paper 6-017-21_Clemens. [Google Scholar]
  78. IEA. Global EV Outlook 2021; Report International Energy Agency; IEA: Paris, France, 2021. [Google Scholar]
  79. Cunanan, C.; Tran, M.-K.; Lee, Y.; Kwok, S.; Leung, V.; Fowler, M. A Review of Heavy-Duty Vehicle Powertrain Technologies: Diesel Engine Vehicles, Battery Electric Vehicles, and Hydrogen Fuel Cell Vehicles. Clean Technol. 2021, 3, 474–489. [Google Scholar] [CrossRef]
  80. Ablatayneh, A.; Assaf, M.N.; Alterman, D.; Jaradat, M. Comparison of the Overall Efficiency for Internal Combustion Engine Vehicles and Electric Vehicles. Environ. Clim. Technol. 2020, 24, 669–680. [Google Scholar]
  81. IEA. The Future of Hydrogen; International Energy Agency Report; IEA: Paris, France, 2019. [Google Scholar]
  82. Hao, X.; Wang, H.; Lin, Z.; Ouyang, M. Seasonal effects on electric vehicle energy consumption and driving range: A case study on personal, taxi, and ridesharing vehicles. J. Clean. Prod. 2020, 249, 119403. [Google Scholar] [CrossRef]
  83. Hydrogen Council. Hydrogen Insights—A Perspective on Hydrogen Investment, Market Development and Cost Competitiveness; Report; McKinsey & Company: Brussels, Belgium, 2021. [Google Scholar]
  84. Van Wijk, A. Hydrogen—A Carbon-Free Energy Carrier and Commodity; Hydrogen Europe: Bruxelles, Belgium, 2021. [Google Scholar]
  85. Navon, A.; Yosef, G.B.; Machlev, R.; Shapira, S.; Chowdhury, N.R.; Blikov, J.; Orda, A.; Levron, Y. Applications of Game Theory to Design and Operation of Modern Power Systems: A Comprehensive Review. Energies 2020, 13, 3982. [Google Scholar] [CrossRef]
  86. Ennis-King, J.; Michael, K.; Strand, J.; Sander, R.; Green, C. Underground Storage of Hydrogen: Mapping Out Options for Australia; Project Number: RP1-1.04, Deliverable 5: Final Summary Report; Future Fuels CRC: Vienna, Austria, 2021. [Google Scholar]
  87. Lipiarski, P. Erdöl- Erdgasdaten 2020—Österreich und weltweit. Zusammenfassung des GBA Erdölreferats 2020. 2021. Available online: https://opac.geologie.ac.at/ais312/dokumente/erdoelref_2020.pdf (accessed on 18 February 2022).
  88. Jens, J.; Wang, A.; van der Leun, K.; Peters, D.; Buseman, M. Extending the European Hydrogen Backbone—A European Hydrogen Infrastructure Vision Covering 21 Countries; Guidehouse: Utrecht, The Netherlands, 2021. [Google Scholar]
  89. Potter, I. Feasibility of hydrogen as an energy source. In Proceedings of the 20th World Petroleum Congress, Doha, Qatar, 4–8 December 2011. [Google Scholar]
  90. Franchi, G.; Capocelli, M.; de Falco, M.; Piemonte, V.; Barba, D. Hydrogen Production via Steam Reforming: A Critical Analysis of MR and RMM Technologies. Membrane 2020, 10, 10. [Google Scholar] [CrossRef] [PubMed] [Green Version]
  91. Noussan, M.; Raimondi, P.P.; Scita, R.; Hafner, M. The Role of Green and Blue Hydrogen in the Energy Transition—A Technological and Geopolitical Perspective. Sustainability 2021, 13, 298. [Google Scholar] [CrossRef]
  92. WEC. Hydrogen Demand and Cost Dynamics; World Energy Council Working Paper; WEC: London, UK, 2021. [Google Scholar]
  93. Soltani, R.; Rosen, M.A.; Dincer, I. Assessment of CO2 capture options from various points in steam methane reforming for hydrogen production. Int. J. Hydrogen Energy 2014, 39, 20266–20275. [Google Scholar] [CrossRef]
  94. Ehlig-Economides, C.; Hatzignatiou, D.G. Blue Hydrogen Economy—A New Look at an Old Idea. In Proceedings of the SPE Annual Technical Conference and Exhibition, Dubai, United Arab Emirates, 21–23 September 2021. Paper SPE 206282. [Google Scholar]
  95. Lau, H.C. The Role of Fossil Fuels in a Hydrogen Economy. In Proceedings of the International Petroleum Technology Conference, Virtual, 16 March 2021. Paper IPTC-21162. [Google Scholar]
  96. Liu, R.E.; Ravikumar, A.P.; Bi, X.T.; Zhang, S.; Nie, Y.; Brand, A.; Bergerson, J.A. Greenhouse Gas Emissions of Western Canadian Natural Gas: Proposed Emissions Tracking for Life Cycle Monitoring. Environ. Sci. Technol. 2021, 55, 9711–9720. [Google Scholar] [CrossRef] [PubMed]
  97. Sanchez-Bastardo, N.; Schlögl, R.; Ruland, H. Methane Pyrolysis for Zero-Emission Hydrogen Production: A Potential Bridge Technology from Fossil Fuels to a Renewable and Sustainable Hydrogen Economy. Ind. Eng. Chem. Res. 2021, 60, 11855–11881. [Google Scholar] [CrossRef]
  98. Msheik, M.; Rodat, S.; Abanades, S. Methane Cracking for Hydrogen Production: A Review of Catalytic and Molten Media Pyrolysis. Energies 2021, 14, 3107. [Google Scholar] [CrossRef]
  99. Howarth, R.W.; Jacobson, M.Z. How green is blue hydrogen? Energy Sci. Eng. 2021, 9, 1676–1687. [Google Scholar] [CrossRef]
  100. Republik Österreich. Verbot der geologischen Speicherung von Kohlenstoffdioxid sowie Änderung des Umweltverträglichkeitsprüfungsgesetzes 2000, des Bundes-Umwelthaftungsgesetzes, der Gewerbeordnung 1994 sowie des Mineralrohstoffgesetzes. Bundesgesetzblatt für die Republik Österreich. Ausgegeben am 28. Dezember 2011. Available online: https://www.ris.bka.gv.at/Dokumente/BgblAuth/BGBLA_2011_I_144/BGBLA_2011_I_144.pdfsig (accessed on 6 January 2022).
  101. El-Emam, R.S.; Özcan, H. Comprehensive review on the techno-economics of sustainable large-scale clean hydrogen production. J. Clean. Prod. 2019, 220, 593–609. [Google Scholar] [CrossRef]
  102. Republik Österreich. Bundesverfassungsgesetz für ein Atomfreies Österreich; Gesetz Republik Österreich: Vienna, Austria, 1999. [Google Scholar]
  103. Buttler, A.; Spliethoff, H. Current status of water electrolysis for energy storage, grid balancing and sector coupling via power-to-gas and power-to-liquids: A review. Renew. Sustain. Energy Rev. 2018, 82, 2440–2454. [Google Scholar] [CrossRef]
  104. L’Huby, T.; Gahlot, P.; Debarre, R. Hydrogen Applications and Business Models—Going Blue and Green? Kearney Energy Transition Institute: Chicago, IL, USA, 2020. [Google Scholar]
  105. Ingersoll, E.; Gogan, K. Missing Link to a Livable Climate: How Hydrogen-Enabled Synthetic Fuels Can Help Deliver the Paris Goals; Lucid Catalyst: London, UK, 2020. [Google Scholar]
  106. Goldman Sachs. Green Hydrogen—The Next Transformational Driver of the Utilities; Equity Research; Goldman Sachs: New York, NY, USA, 2020. [Google Scholar]
Figure 1. Storage options for electricity from renewable energy (adapted with permission from [18] IEA 2015). CAES = Compressed Air Energy Storage, PHS = Pumped Hydrostorage, T&D = Transmission and Distribution.
Energies 15 03742 g001
Figure 2. Generation, storage, and usage of hydrogen from renewable energy sources.
Energies 15 03742 g002
Figure 3. Development of the used energy mix in Austria 1970–2020 (adapted from [59] with permission from E-Control 2021).
Energies 15 03742 g003
Figure 4. Electricity balance in Austria in 2020 (adapted from [59] with permission from E-Control 2021).
Energies 15 03742 g004
Figure 5. Gas consumption in Austria (adapted from [59] with permission from E-Control 2021).
Energies 15 03742 g005
Figure 6. Contributions to Austrian heat (right) and electricity generation by REN in 2017 (adapted from [61] with permission from Biermayr 2018).
Energies 15 03742 g006
Figure 7. Horizontal solar power potential in Austria (© 2020 The World Bank, Source: Global Solar Atlas 2.0, Solar resource data: Solargis [68] SolarGIS 2011).
Energies 15 03742 g007
Figure 8. Usage of agricultural area in Austria in 2017 (based on [72] with permission from Österreichischer Biomasse-Verband 2019).
Energies 15 03742 g008
Figure 9. Electricity consumption over the course of a year in Austria in 2017 (modified after [72] with permission from Österreichischer Biomasse-Verband 2019).
Energies 15 03742 g009
Figure 10. Monthly distribution of energy consumption replacing gas for heating and heating oil for EDS, BES, and SSS.
Energies 15 03742 g010
Figure 11. BEV car efficiency (kilometer per kWh) over the course of a year based on Austrian climate.
Energies 15 03742 g011
Figure 12. Energy consumption over the course of the year by transport by 2050 for EDS, BES, and SSS.
Energies 15 03742 g012
Figure 13. Incremental electricity generation in 2050 compared with 2019 over the course of the year for EDS.
Energies 15 03742 g013
Figure 14. Incremental electricity generation in 2050 compared with 2019 over the course of the year for BES.
Energies 15 03742 g014
Figure 15. Incremental electricity generation in 2050 compared with 2019 over the course of the year for SSS.
Energies 15 03742 g015
Figure 16. Oil (green) and gas (red) fields in Austria (© GBA/Geo-Atlas Österreich).
Energies 15 03742 g016
Figure 17. Envisaged European hydrogen gas distribution grid with the location of the two areas with gas fields (red dots) in Austria.
Energies 15 03742 g017
Table 1. Potential of PV in Austria.
Technical Potential in TWh
Buildings13.4
Land Fills1.2
Along Roads and Railway Tracks4.5
Open Space28–32
Table 2. Monthly distribution of consumption of gas used for heating and heating oil.
JanuaryFeb.MarchAprilMayJuneJulyAugustSept.Oct.Nov.Dec
%16.11312.58.13.52.21.71.66.28.411.215.5
Table 3. Monthly distribution of electricity generation from hydropower, wind, and PV in Austria in %.
JanuaryFeb.MarchAprilMayJuneJulyAugustSept.Oct.Nov.Dec
Hydropower6.515.817.838.5110.8611.2211.510.667.66.786.096.63
Wind10.649.7710.987.387.255.417.056.786.637.5710.699.85
PV4.475.888.7710.1511.6811.1312.1711.389.247.674.243.22
Publisher’s Note: MDPI stays neutral with regard to jurisdictional claims in published maps and institutional affiliations.

