Article

Vibration Suppression of Hub Motor-Air Suspension Vehicle

School of Mechanical Engineering, Jiangsu University, Zhenjiang 212013, China
*
Author to whom correspondence should be addressed.
Energies 2022, 15(11), 3916; https://doi.org/10.3390/en15113916
Submission received: 22 March 2022 / Revised: 21 May 2022 / Accepted: 23 May 2022 / Published: 25 May 2022
(This article belongs to the Section E: Electric Vehicles)

Abstract

:
Aiming at the negative vibration effect caused by the increased unsprung mass of the hub motor-air suspension (HM-AS) vehicle and the unbalanced magnetic force (UMF) of the hub motor, a linear quadratic regulator (LQR) air suspension control strategy based on a genetic algorithm is proposed. Considering the coupling effect of road surface excitation and UMF, the model of the HM-AS vehicle is established. Then, according to optimal control theory and the genetic algorithm, the LQR controller is designed to suppress the vibration of the HM-AS vehicle, and the weight matrix of the LQR controller is optimized through the genetic algorithm. The simulation results show that the proposed LQR control strategy effectively improves the ride comfort and motor safety of the HM-AS vehicle.

1. Introduction

At present, the problems of environmental pollution and energy shortage are widely concerning around the world, which makes the automobile industry pay more attention to the development of electric vehicles. HM-AS vehicles have the advantages of saving energy, flexible control, and efficient transmission, and are considered to be the ideal design for future electric vehicles. The HM-AS system is a complex electromechanical coupling system composed of a wheel, hub motor, and air suspension. Integrating the hub motor into the wheel will have a significant impact on vehicle dynamics [1,2,3]. The eccentricity of the hub motor generated by the vehicle on uneven roads will cause the motor to generate UMF, which is transmitted to the wheels and car body, resulting in the deterioration of the car’s ride comfort.
In order to suppress the vibration of the air suspension, many scholars have conducted valuable research. Lou et al. [4] built an integrated controller of the semi-active suspension system and the ABS system, based on sliding mode control theory. Simulation results showed that the controller can prevent wheel locking, shorten braking distance and braking time, and improve vehicle comfort. Zhang et al. [5] designed an optimal state feedback vibration control law, which significantly improved the vibration reduction performance of the vehicle. Zhou et al. [6] proposed an active suspension LQG control strategy to improve handling stability and ride comfort. Sathishkumar et al. [7] compared the control effect of fuzzy controllers and PID controllers, based on the semi-active air suspension system. Yin et al. [8] proposed the concept of active energy regenerative suspension. The simulation results showed that active energy regeneration suspension has good ride comfort and energy regeneration potential. Ibrahim et al. [9] described fuzzy and H∞ control strategies for the automobile active suspension system. Zhang et al. [10] designed a sliding mode controller using a constant velocity approximation law. The simulation results showed that the chattering suppression of the neural sliding mode control is more stable. Fan et al. [11] proposed an adaptive neuro-fuzzy inference system for vibration control of vehicle active suspension systems. Bao et al. [12] studied the active fault-tolerant control strategy of suspension in the case of sensor failure and actuator failure, respectively, and improved the performance of the active fault-tolerant system, thereby improving the handling stability of the vehicle. Gokul et al. [13] applied the particle swarm optimization algorithm to the LQR controlled air suspension to determine the optimal control weight matrix. Rui [14] designed a nonlinear adaptive sliding mode controller for the semi-active air suspension system. Shalabi et al. [15] proposed a fuzzy inference system based on Z number to control the automobile air spring suspension system, which improved the performance of the air suspension. Wen et al. [16] used the sliding mode control strategy of the radial basis function neural network adaptive approximation to control the electromagnetic suspension system, which has stability and convergence for the control of complex nonlinear electromagnetic suspension systems. Zhang et al. [17] proposed an active suspension control method based on a multi-agent prediction algorithm to improve the ride comfort of the vehicle suspension. Ahmed et al. [18] compared an uncontrolled suspension system, a suspension system based on a neural network controller, and an active suspension system based on a linear quadratic regulator. Ma et al. [19] proposed a method for matching the stiffness and damping of a semi-active air suspension system to ensure the best ride comfort when the vehicle is driving on different levels of roads at different speeds. Li et al. [20] designed a model predictive controller and a constrained optimal controller to improve driving comfort and safety of the vehicle in response to the negative vertical vibration of the hub direct drive and the air suspension system. Shalabi et al. [21] proposed an adaptive neuro-fuzzy inference system control, which significantly reduced the sprung mass acceleration and improved the vehicle ride comfort. Yu et al. [22] used a genetic algorithm to determine the optimal solution of the objective function of the LQR controller, which improved the ride comfort of the vehicle. Jin et al. [23] proposed a robust constrained H∞ control strategy to improve the vehicle ride comfort and road holding ability. Jeong et al. [24] introduced a preview control of the automotive active suspension systems to improve ride comfort through vehicle-to-vehicle (V2V) communication. The above scholars suppressed the negative vibration of the air suspension by optimizing and controlling the suspension. However, there are few studies considering the vertical performance of the hub motor and air suspension coupling system, and most studies use a quarter vehicle model as the research object.
Therefore, it is necessary to propose a damping control method to suppress the vertical vibration of the HM-AS vehicle. The primary contributions of this study are as follows: (1) building an eleven-degree-of-freedom HM-AS vehicle model; (2) designing an LQR controller to suppress the vibration of the HM-AS vehicle.
This article is arranged as follows. In Section 2, according to dynamics and electromagnetics, an eleven-degree-of-freedom HM-AS vehicle mathematical model is built. In Section 3, the vehicle road test is conducted to prove the accuracy of the HM-AS vehicle model. In Section 4, an LQR air suspension control strategy is designed and the optimal control weight matrix of the LQR controller is determined through a genetic algorithm. In Section 5, the effectiveness of the control strategy is proved by running simulations.

2. HM-AS Vehicle Model

2.1. Motor Model

A permanent magnet brushless direct current (PM BLDC) motor has the advantages of high transmission efficiency, compact structure, and low noise. In this research, an outer rotor PM BLDC motor is used as the hub motor.
The current equation of the outer rotor PM BLDC is [25]:
[ u a u b u c ] = [ R 0 0 0 R 0 0 0 R ] [ i a i b i c ] + d d t [ L M 0 0 0 L M 0 0 0 L M ] [ i a i b i c ] + [ e a e b e c ]
where u a , u b , u c are phase voltages of three-phase windings; R is the equivalent resistance of stator windings; L is the self-inductance of stator windings; M is the mutual inductance of stator windings; i a , i b , i c are phase currents of three-phase windings; and e a , e b , e c are back electromotive forces of three-phase windings.
The electromagnetic torque equation of motor is [25]:
T e = 1 ω m ( e a i a + e b i b + e c i c )
where T e is the electromagnetic torque of motor, and ω m is the angular velocity of rotor.
The mechanical motion equation of motor is [25]:
J m d ω m d t + B ω m = T e T L
where J m is the moment of inertia of motor, T L is the load torque of motor, and B is the friction coefficient.

2.2. UMF Calculation Model

Due to the complex installation condition and mechanical environment of the hub motor, and due to the motor bearing a vertical load during operation, an eccentric distance is generated between the stator and rotor of the motor, resulting in an UMF. The eccentricity between the stator and rotor of the PM BLDC motor is shown in Figure 1.
In the eccentric state of the hub motor, the air gap radial magnetic field B er and the air gap tangential magnetic field B et are [26]:
B er ( r , α , t ) = [ B mr ( r , α , t ) + B α r ( r , α , t ) ] ε δ
B et ( r , α , t ) = [ B mt ( r , α , t ) + B α t ( r , α , t ) ] ε δ
where r is the air gap radius; α is the stator angle; t is the time; B mr is the radial magnetic field of permanent magnet; B α r is the radial magnetic field of armature reaction; B mt is the tangential magnetic field of permanent magnet; and B α t is the tangential magnetic field of armature reaction.
The vertical UMF F ez and the longitudinal UMF F ex of the hub motor are [26]:
F ez = L r 2 μ 0 0 2 π { [ B er ( r , α , t ) 2 B et ( r , α , t ) 2 ] sin α + 2 [ B er ( r , α , t ) · B et ( r , α , t ) ] cos α } d α
F ex = L r 2 μ 0 0 2 π { [ B er ( r , α , t ) 2 B et ( r , α , t ) 2 ] cos α 2 [ B er ( r , α , t ) · B et ( r , α , t ) ] sin α } d α
where L is the axial length of the motor, and μ 0 is the vacuum permeability.

2.3. Vehicle Vertical Vibration Model

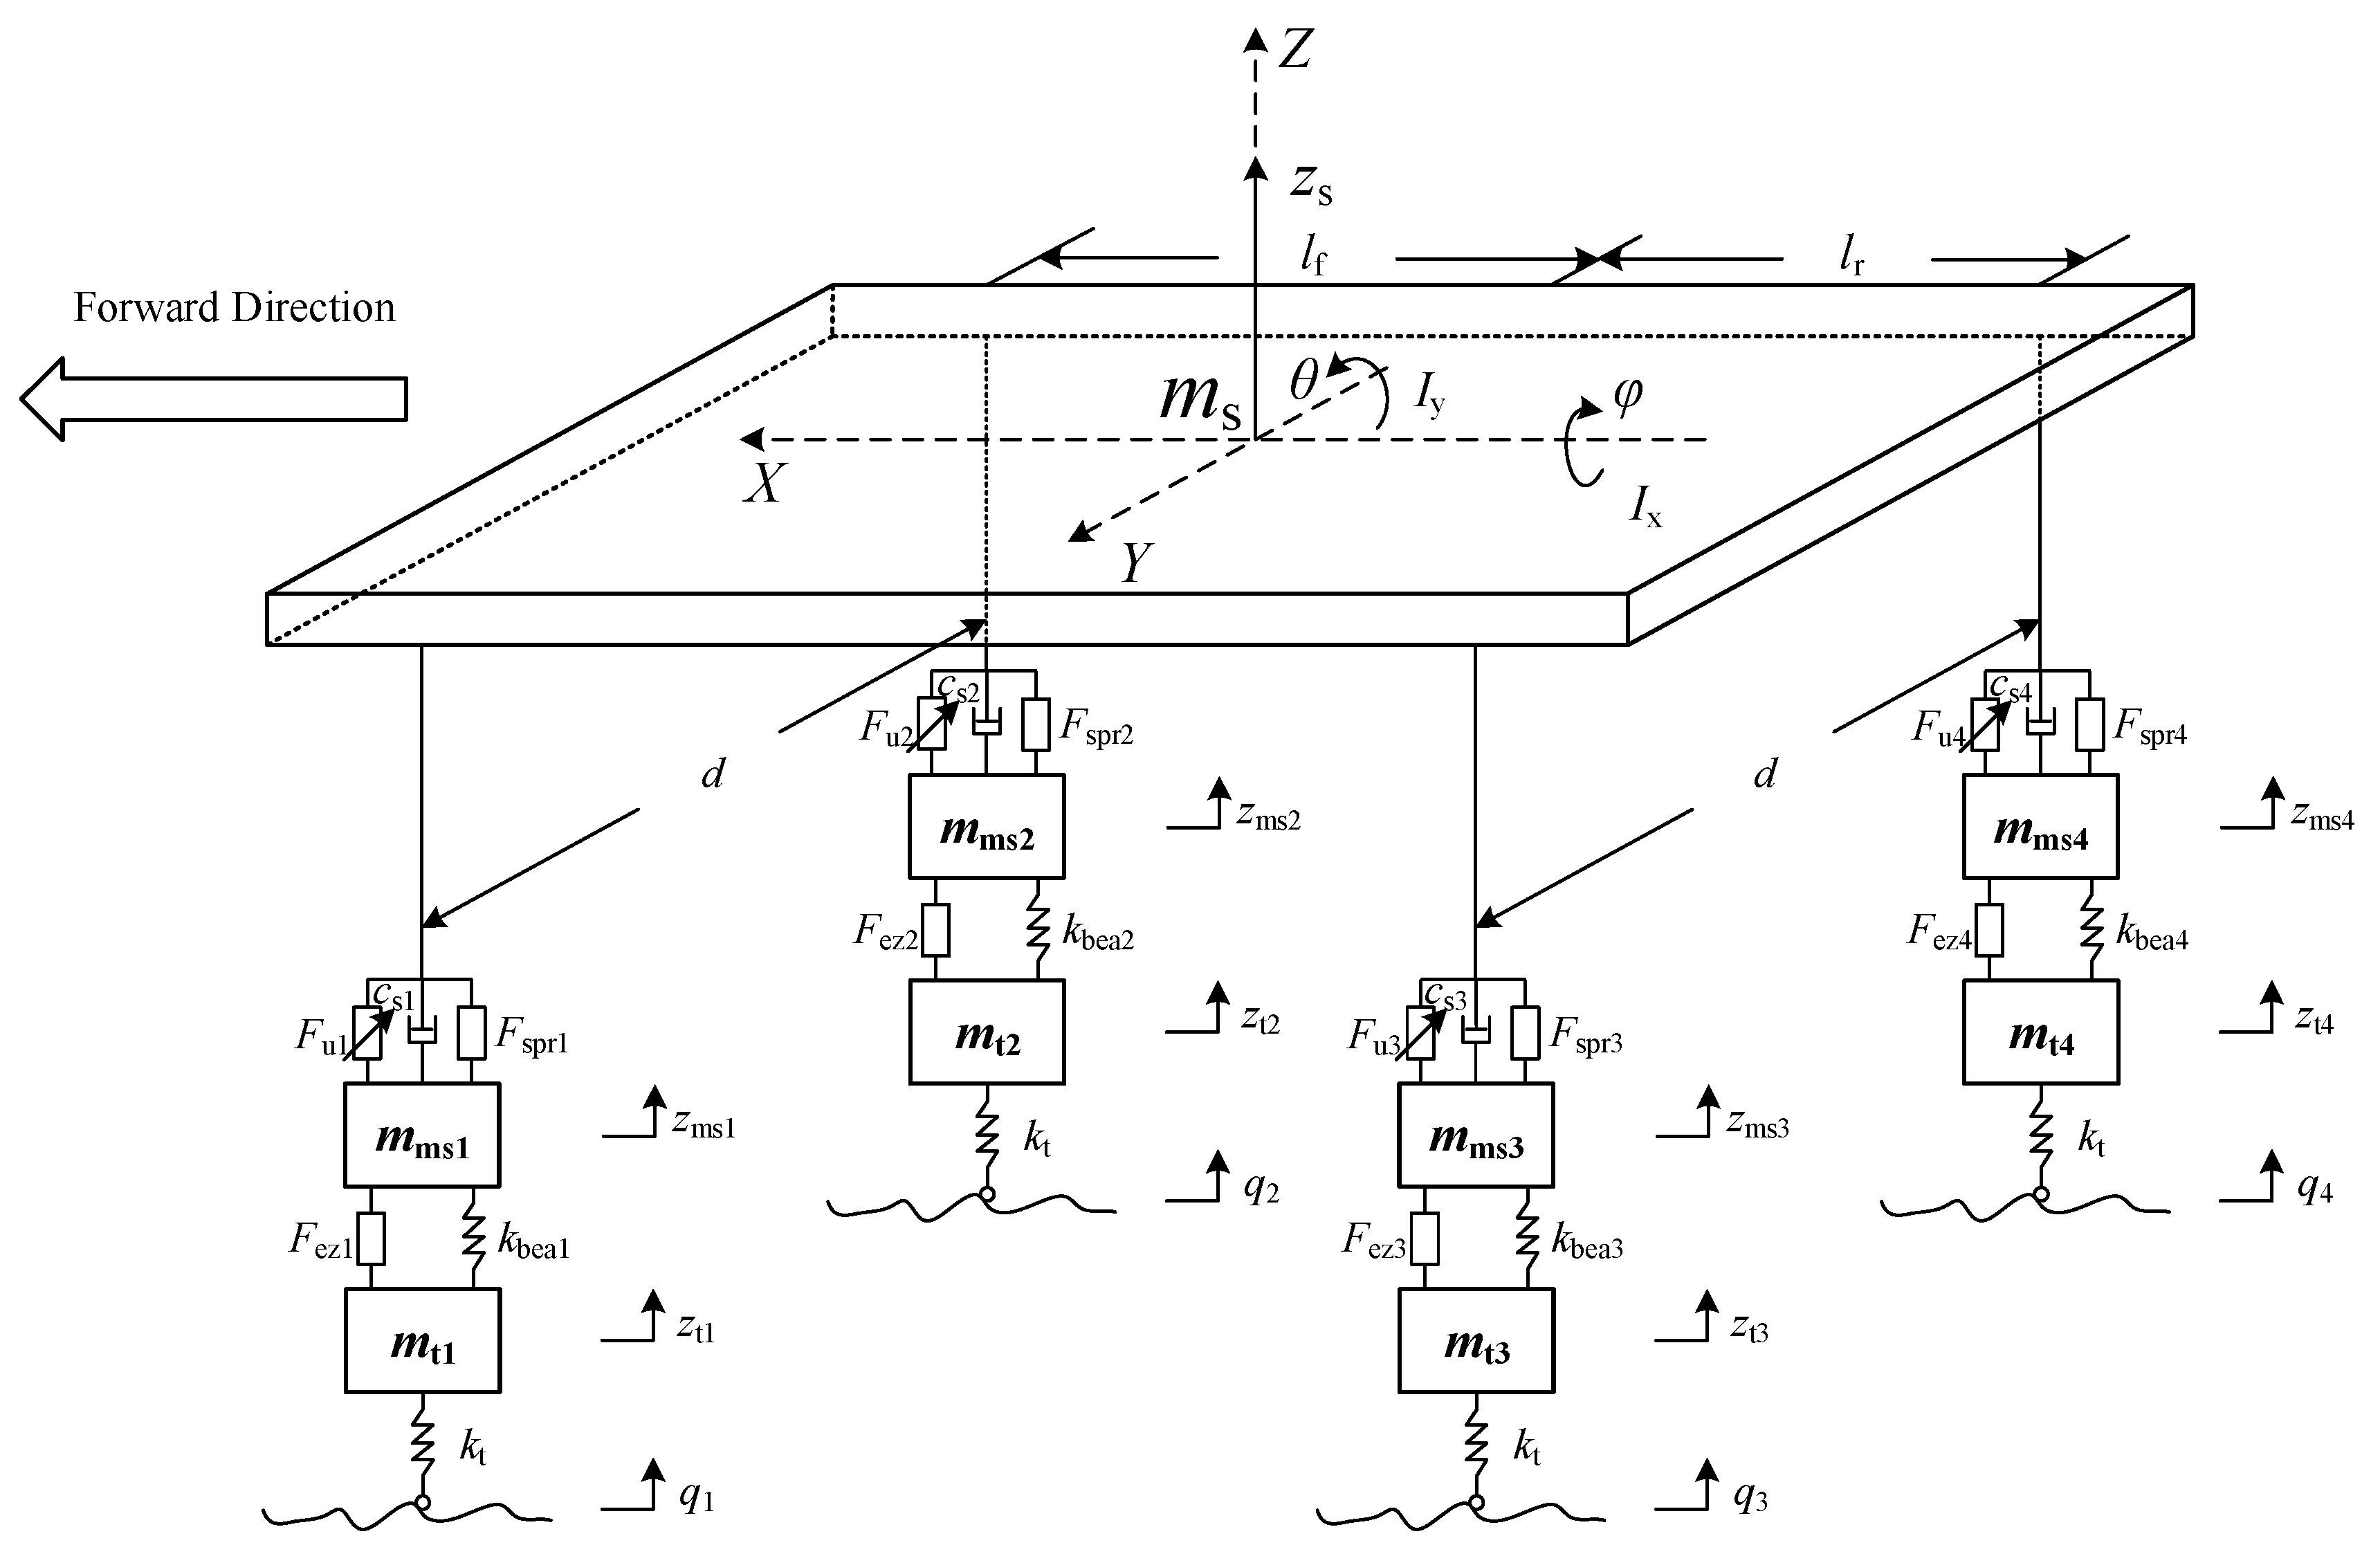
The eleven-degrees-of-freedom vehicle model is shown in Figure 2.
According to vehicle dynamics, the vehicle model can be expressed as:
{ m s z ¨ s = ( F s 1 + F s 2 + F s 3 + F s 4 ) I x φ ¨ = [ ( F s 2 F s 1 ) + ( F s 4 F s 3 ) ] d 2 I y θ ¨ = ( F s 1 + F s 2 ) l f ( F s 3 + F s 4 ) l r m msi z ¨ msi = F si F ezi F beazi m ti z ¨ ti = F ezi + F beazi F di
to be specific,
{ F si = F spri + c si f ˙ di F ui F di = k ti ( z ti q i ) F spri = ( k · P i · A e 2 · f di ) V 0 i f di = z si z msi P 1 = P 2 = m s · g · l r 2 ( l f + l r ) A e + P a P 3 = P 4 = m s · g · l f 2 ( l f + l r ) A e + P a F beazi = k beai ( z msi z ti )
where i = 1, 2, 3, 4, represent the front-left suspension, front-right suspension, rear-left suspension, and rear-right suspension, respectively; m s is the sprung mass; m msi is the mass of the stator core; m ti is the mass of the rotor core and wheel; l f is the distance from the center of the front wheel to the center of the vehicle’s mass; l r is the distance from the center of the rear wheel to the center of the vehicle’s mass; d is the distance between the two wheels; φ is the roll angle of the sprung mass; θ is the pitch angle of the sprung mass; I x is the moment of inertia of the sprung mass around the X axis; I y is the moment of inertia of the sprung mass around the Y axis; z s is the vertical displacement of the sprung mass; z si is the vertical displacement of the contact point of the suspension to the sprung mass; z msi is the vertical displacement of the stator core; z ti is the vertical displacement of the rotor core and wheel; q i is the road excitation; f di is the stroke of the suspension; c si is the damping of the suspension; F si is the force of the suspension; F di is the dynamic load of the tire; F ui is the damping control force of the suspension; F spri is the air spring force of the suspension; F ezi is the vertical UMF of the motor; F beazi is the vertical bearing force of the motor; k ti is the residual stiffness of the tire; k beai is the bearing stiffness of the motor; P i is the initial air pressure of the air spring; k is the adiabatic index; A e is the initial cross-sectional area of the air spring; V 0 i is the initial volume of the air spring; P a is the atmospheric pressure; and g is the acceleration of gravity. According to the test vehicle, the parameters of the HM-AS vehicle model are shown in Table 1.

2.4. Random Road Excitation Model

The left and right road surfaces are coherent, and the road surface traveled by the rear axle wheels has a lag when compared with the surface traveled by the front axle wheels. Therefore, to build a four-wheel random road excitation model, it is necessary to consider both the front axle road excitation and the rear axle road excitation.

2.4.1. Road Excitations of the Left and Right Wheels of the Front Axle

The road excitation obeys a normal distribution with zero mean, and its statistical characteristics are described by a power spectrum. The frequency spectral density of road roughness is [27]:
G q ( n ) = G q ( n 0 ) ( n n 0 ) W
where n is the spatial frequency; n 0 is the reference spatial frequency; G q ( n 0 ) is the power spectral density at reference spatial frequency; and W is the frequency index.
The speed power spectral density of road space frequency domain is [27]:
G v ( n ) = 4 π 2 n 0 2 G q ( n 0 ) v
where v is the vehicle speed.
The road elevation is a kind of colored noise with limited bandwidth, so the time domain signal of the road elevation can be generated by filtering white noise. The filter is [28]:
H ( s ) = 2 π G q ( n 0 ) v s + 2 π f 0
where f 0 is the cutoff frequency.
The road time domain signal is [29]:
q ˙ ( t ) = 2 π f 0 q ( t ) + 2 π G q ( n 0 ) v w ( t )
where w ( t ) is the white noise.
During the driving process of the vehicle, the road excitation of the left and right wheels is different from time to time, and they are not independent of each other, so the coherence function γ is used to describe the road excitation of the left and right wheels [30]:
γ ( n , T w ) = [ 1 + ( n T w a n 0 ) W ] p
where T w is the distance between two coaxial wheels, p is the reference factor, and a is the constant exponent of T w .
For given white noise road excitations q l ( t ) and q r ( t ) , the transfer function G ( s ) of q r ( t ) to q l ( t ) is:
G ( s ) = Q r ( s ) Q l ( s ) = a 0 + a 1 s + a 2 s 2 b 0 + b 1 s + b 2 s 2
where Q l ( s ) and Q r ( s ) are Laplace transforms of q l ( t ) and q r ( t ) , respectively.
Combining the Formulas (14) and (15), we get:
| G ( s ) | = | γ ( n , T w ) |
The road excitations of the left and right wheels of the front axle are:
q 1 ( t ) = q l ( t )
q 2 ( t ) = 1 { G ( s ) [ q 1 ( t ) ] + [ 1 G ( s ) ] [ q r ( t ) ] }

2.4.2. Road Excitations of the Left and Right Wheels of the Rear Axle

Assuming that the vehicle runs in a straight line, and that the road on which the rear wheels of the vehicle travel is roughly the same as the road on which the front wheels travel, there is a lag between the road excitation of the rear wheels and the road excitation of the front wheels. The road excitations of the left and right wheels of the rear axle are:
q 3 ( t ) = q 1 ( t τ )
q 4 ( t ) = q 2 ( t τ )
where τ is the lag time, which is the quotient of the vehicle wheelbase and the vehicle speed. t τ .
Considering that the lag is difficult to linearize, it is described by using a transfer function in the complex domain. The road excitations of the left and right wheels of the rear axle are:
q 3 ( t ) = 1 { G 3 ( s ) [ q 1 ( t ) ] }
q 4 ( t ) = 1 { G 4 ( s ) [ q 2 ( t ) ] }
where G 3 ( s ) and G 4 ( s ) are the transfer function of q 3 ( t ) to q 4 ( t ) , and the transfer function of q 4 ( t ) to q 3 ( t ) , respectively.

2.5. Bump Road Excitation Model

The longitudinal section profile of the bump belt is represented by a cosine function. The bump road excitations of the four wheels are:
{ q 1 ( t ) = q 2 ( t ) = { H b 2 { 1 cos [ 2 π v L b ( t t 0 ) ] } t 0 t t 0 + L b v 0 e l s e q 3 ( t ) = q 4 ( t ) = { H b 2 { 1 cos [ 2 π v L b ( t t 0 τ ) ] } t 0 + τ t t 0 + τ + L b v 0 e l s e
where H b is the height of the bump belt, L b is the width of the bump belt, and t 0 is the point at which the front wheels begin to contact the speed bump.

3. Model Validation

3.1. Test Vehicle Refitting and Sensor Arrangement

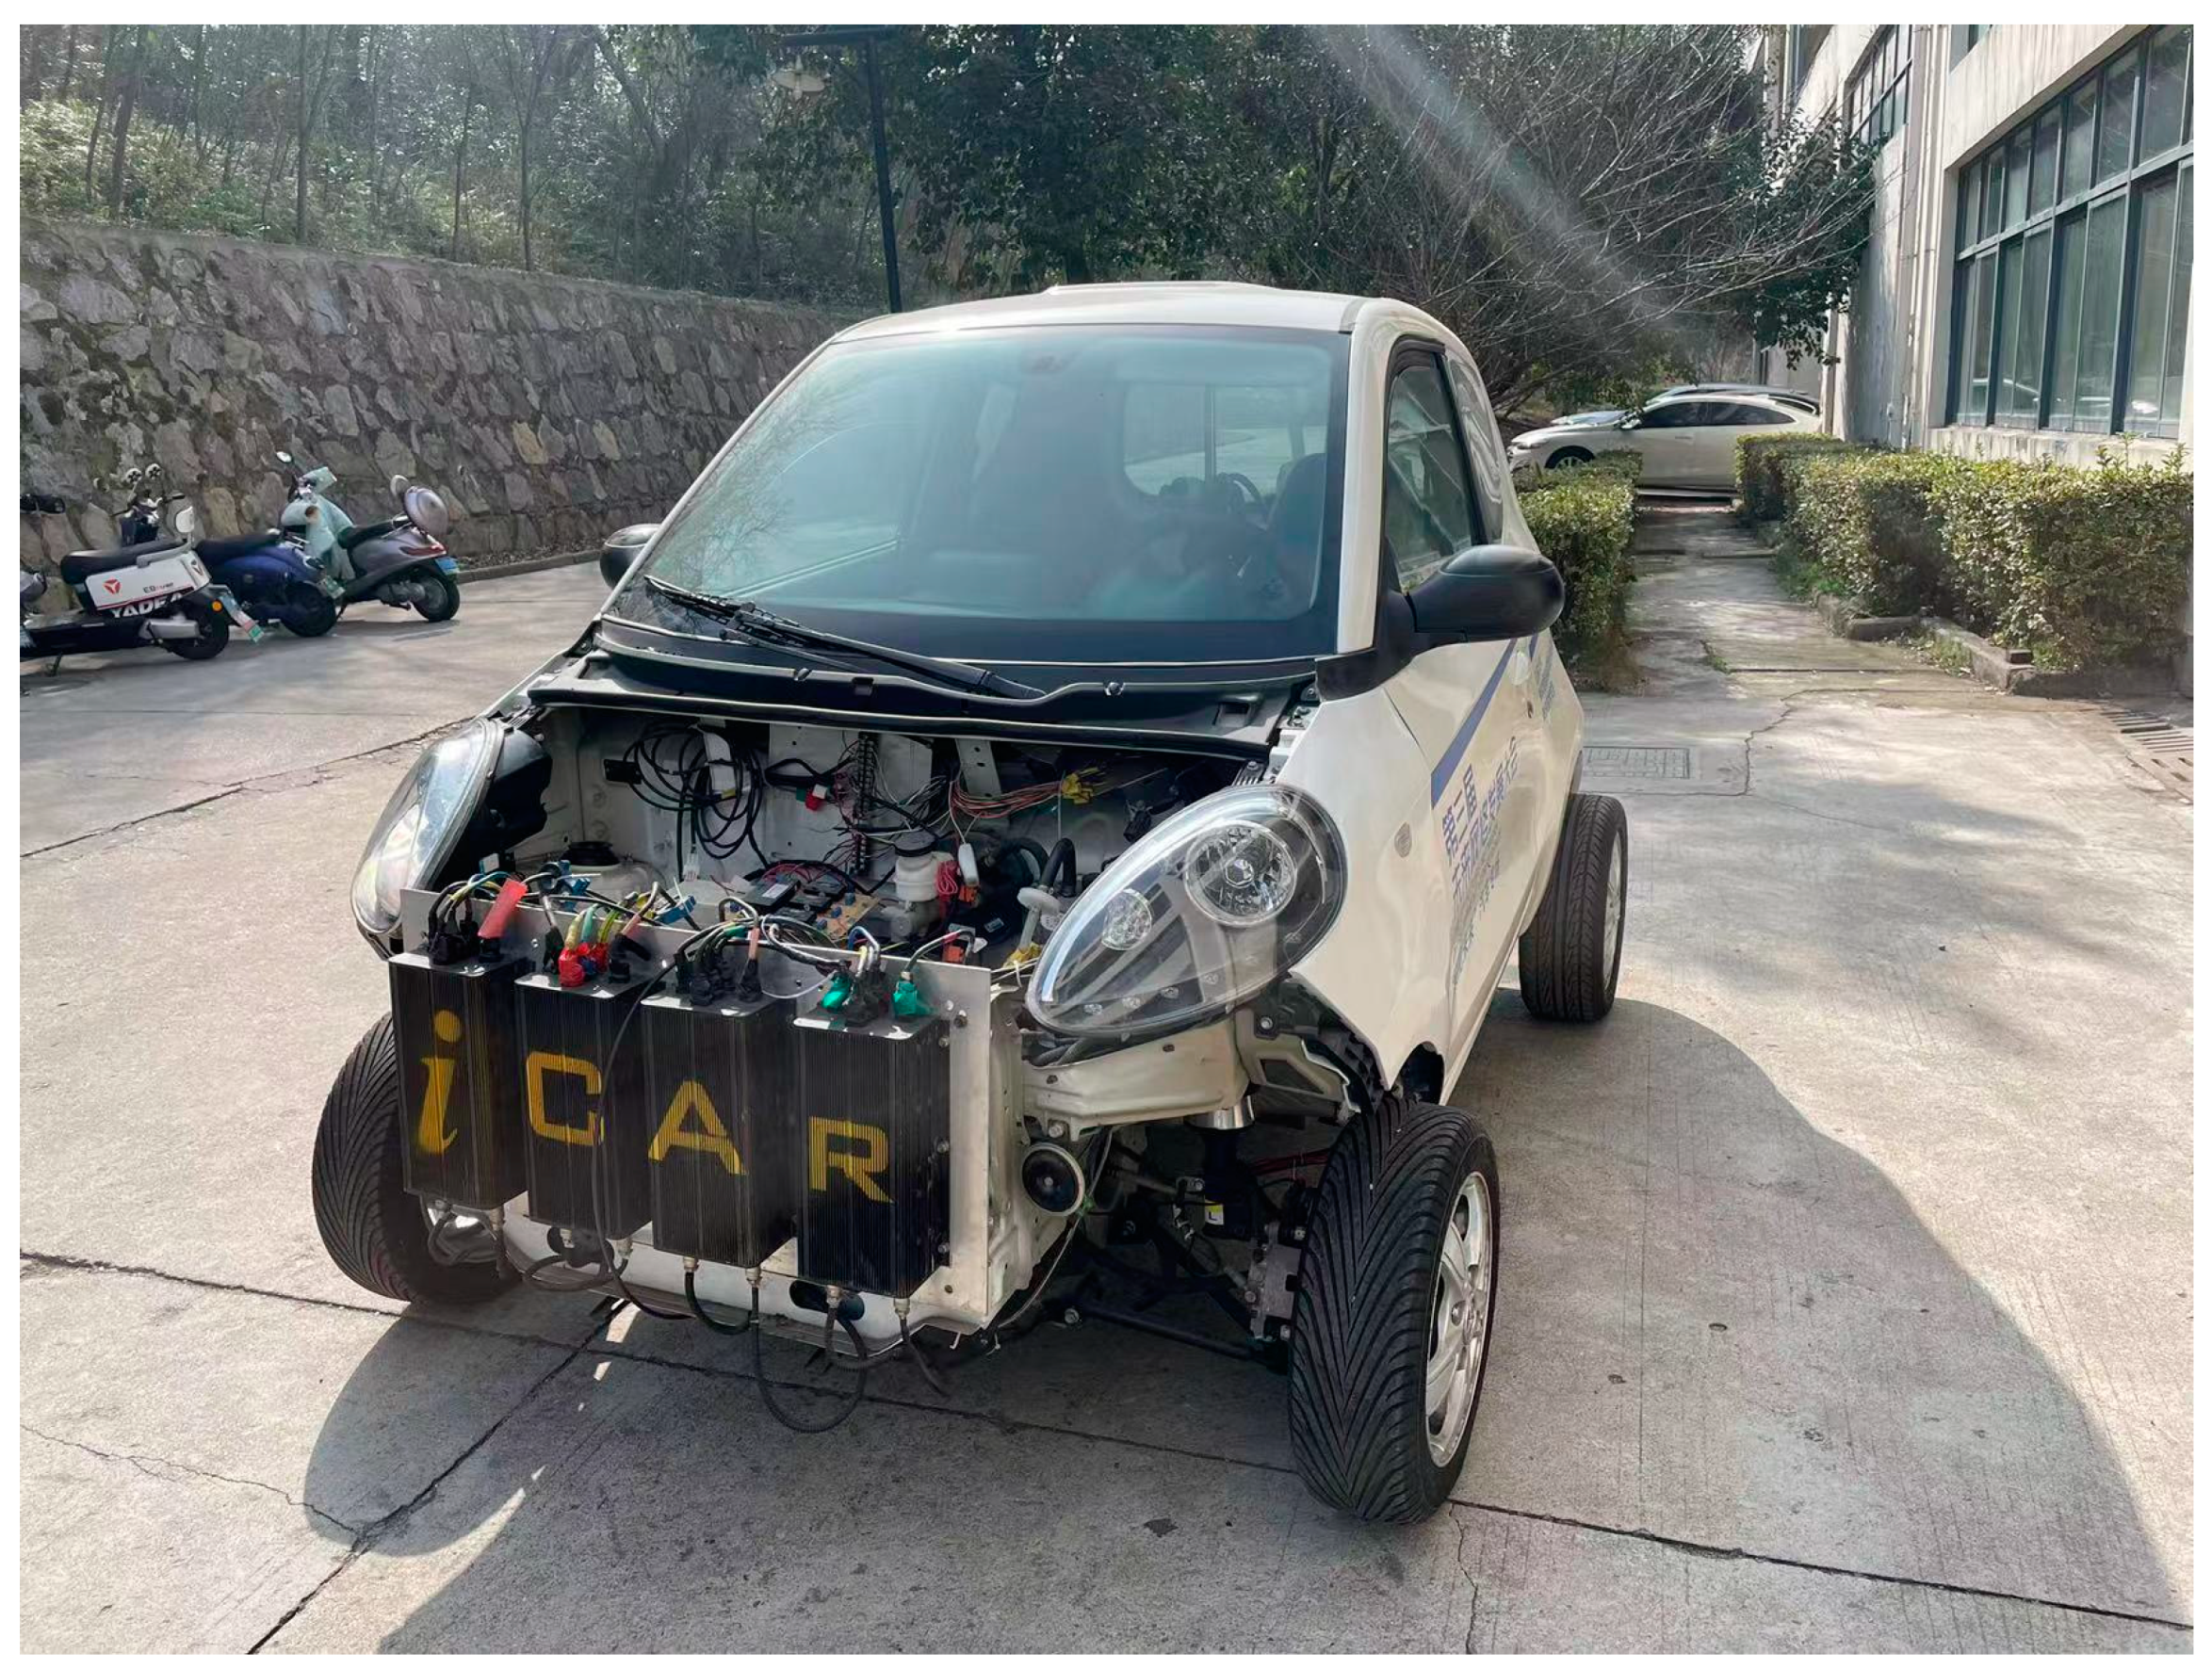
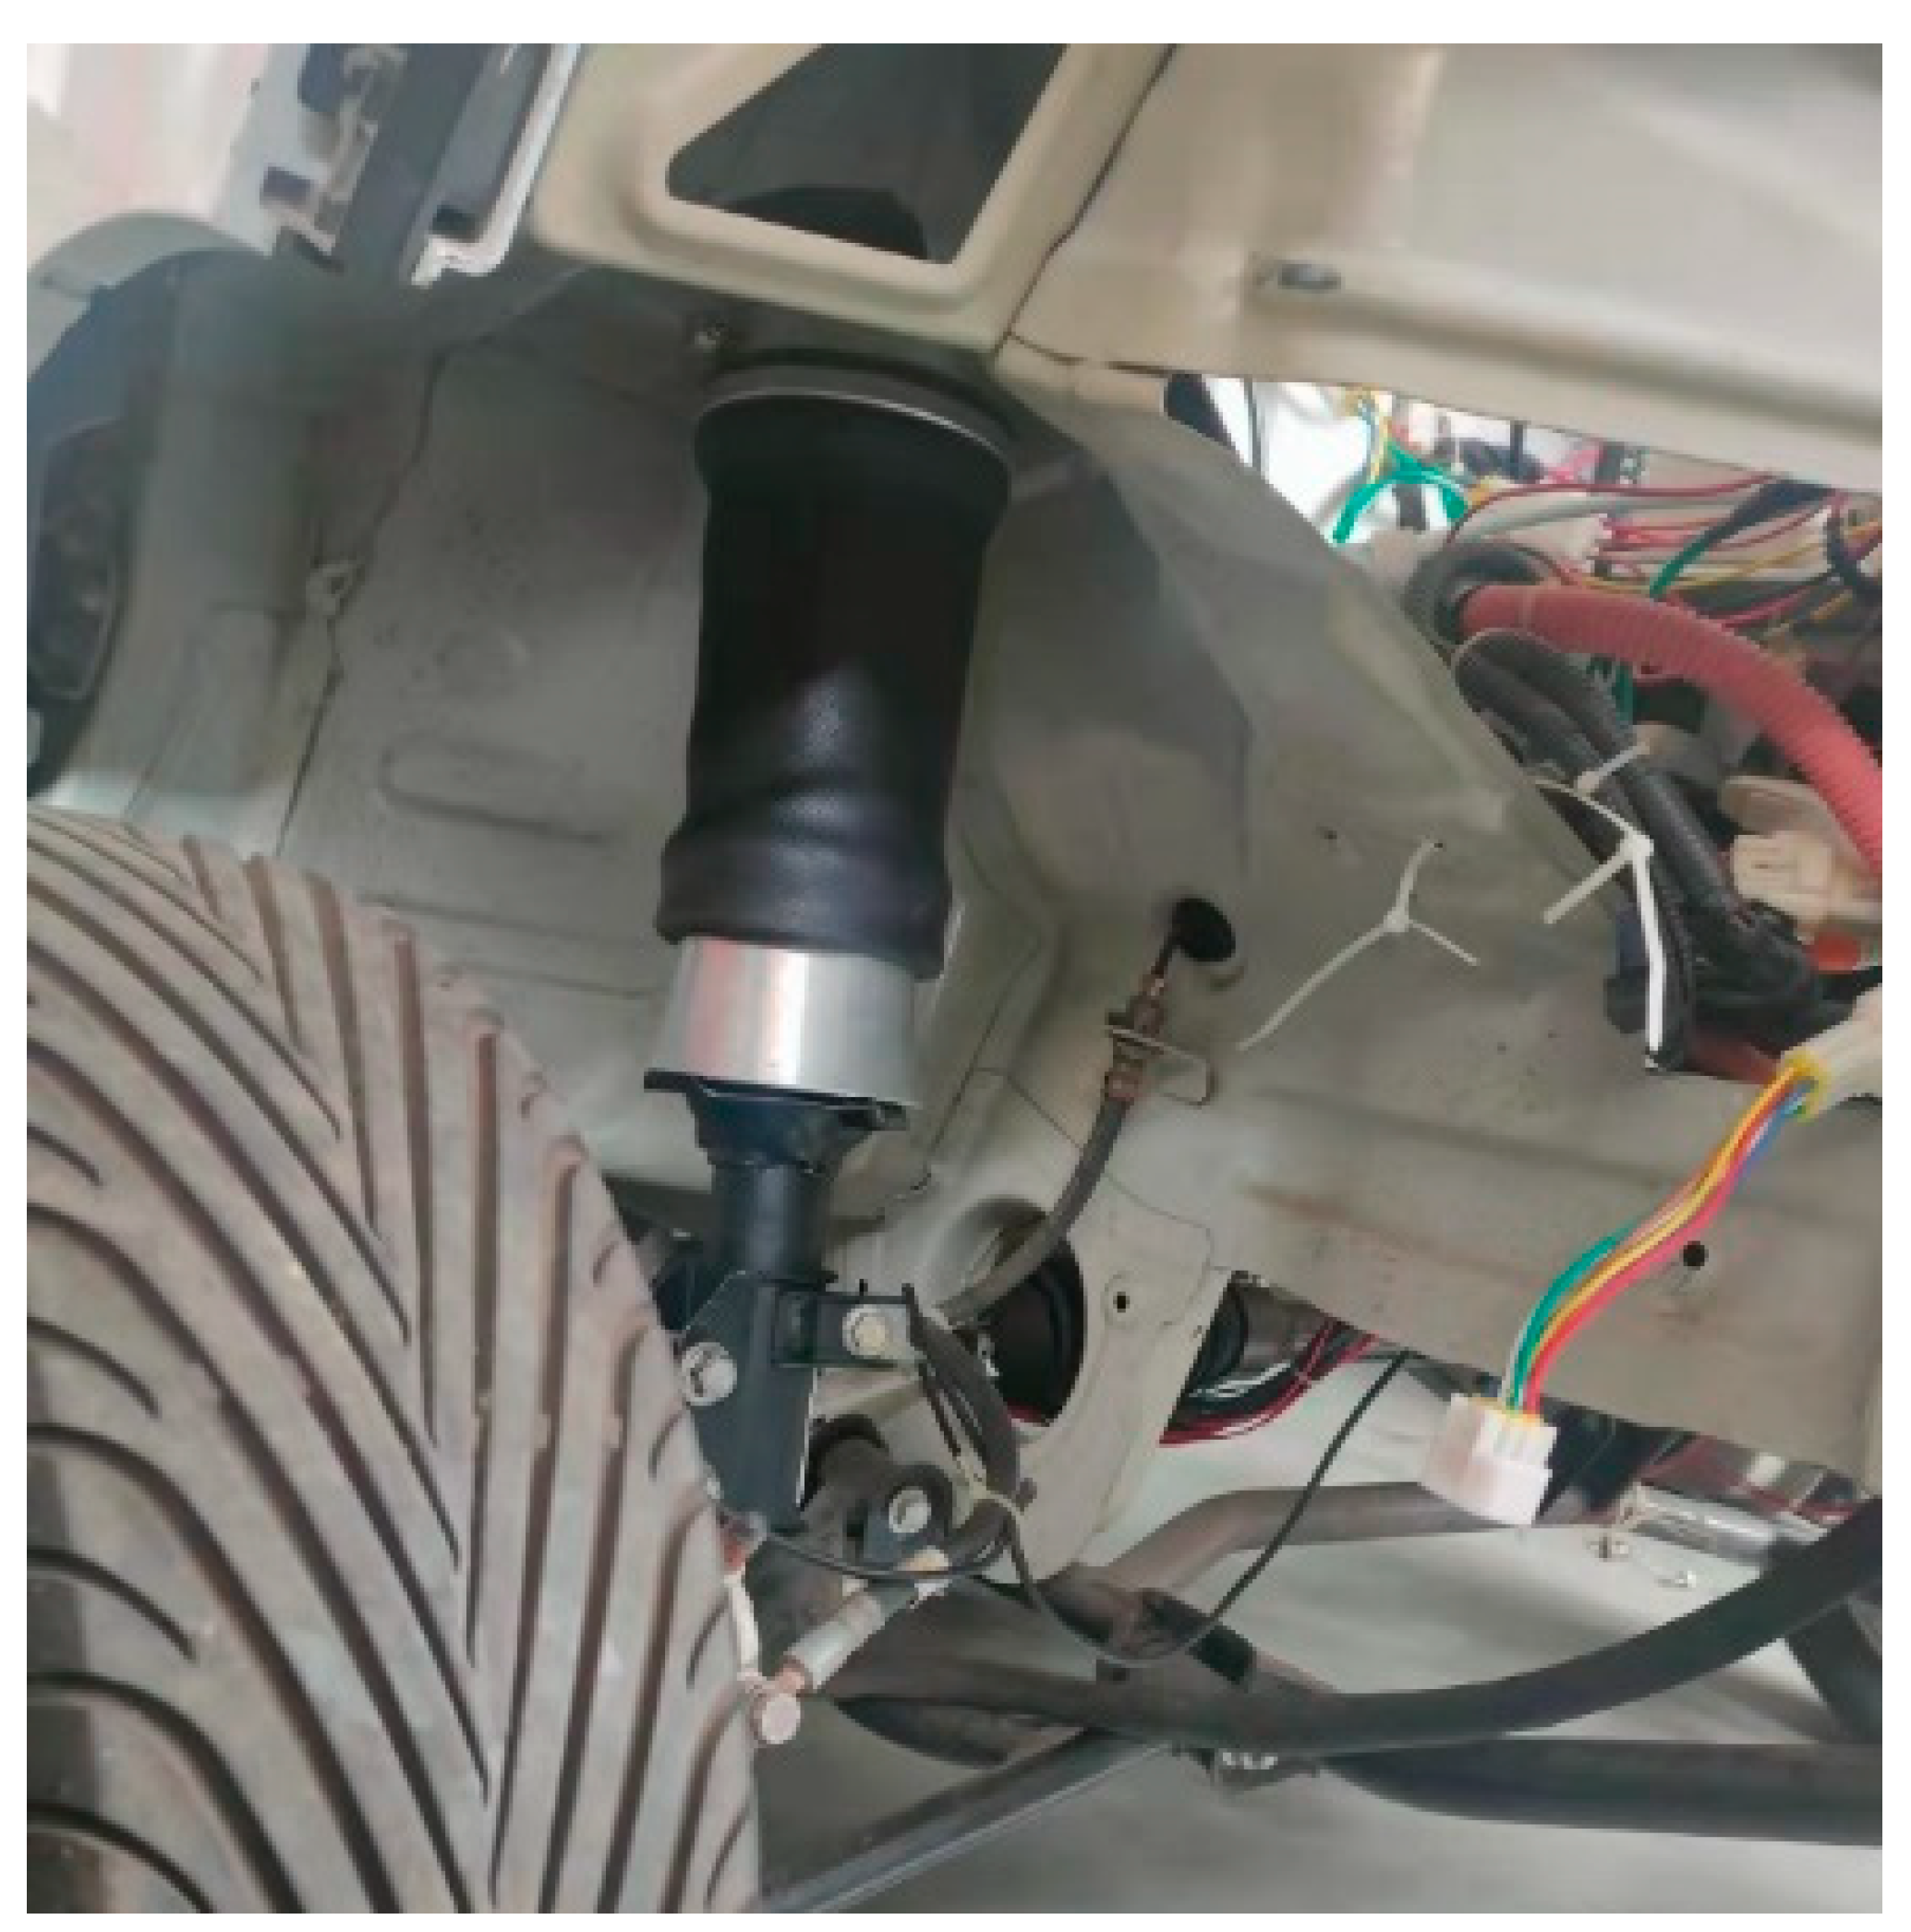
The vehicle road test is carried out to prove the correctness of the HM-AS vehicle model. The test vehicle is electric and has been modified for research purposes. The current vehicle features four hub motors and four air suspensions. The HM-AS test vehicle is shown in Figure 3. The air suspension is shown in Figure 4.
The sampling frequency of the sensor is up to 3 KHz, and the maximum range is up to 50 times the acceleration of gravity, which can meet the requirements of this experiment.
The signals collected by the sensor are the acceleration of sprung mass and the acceleration of unsprung mass at the front-left wheel and rear-left wheel. The sensor to collect the acceleration of sprung mass is installed on the upper end of the air suspension. The sensor to collect the acceleration of unsprung mass is installed on the lower end of the air suspension.

3.2. Vehicle Road Test

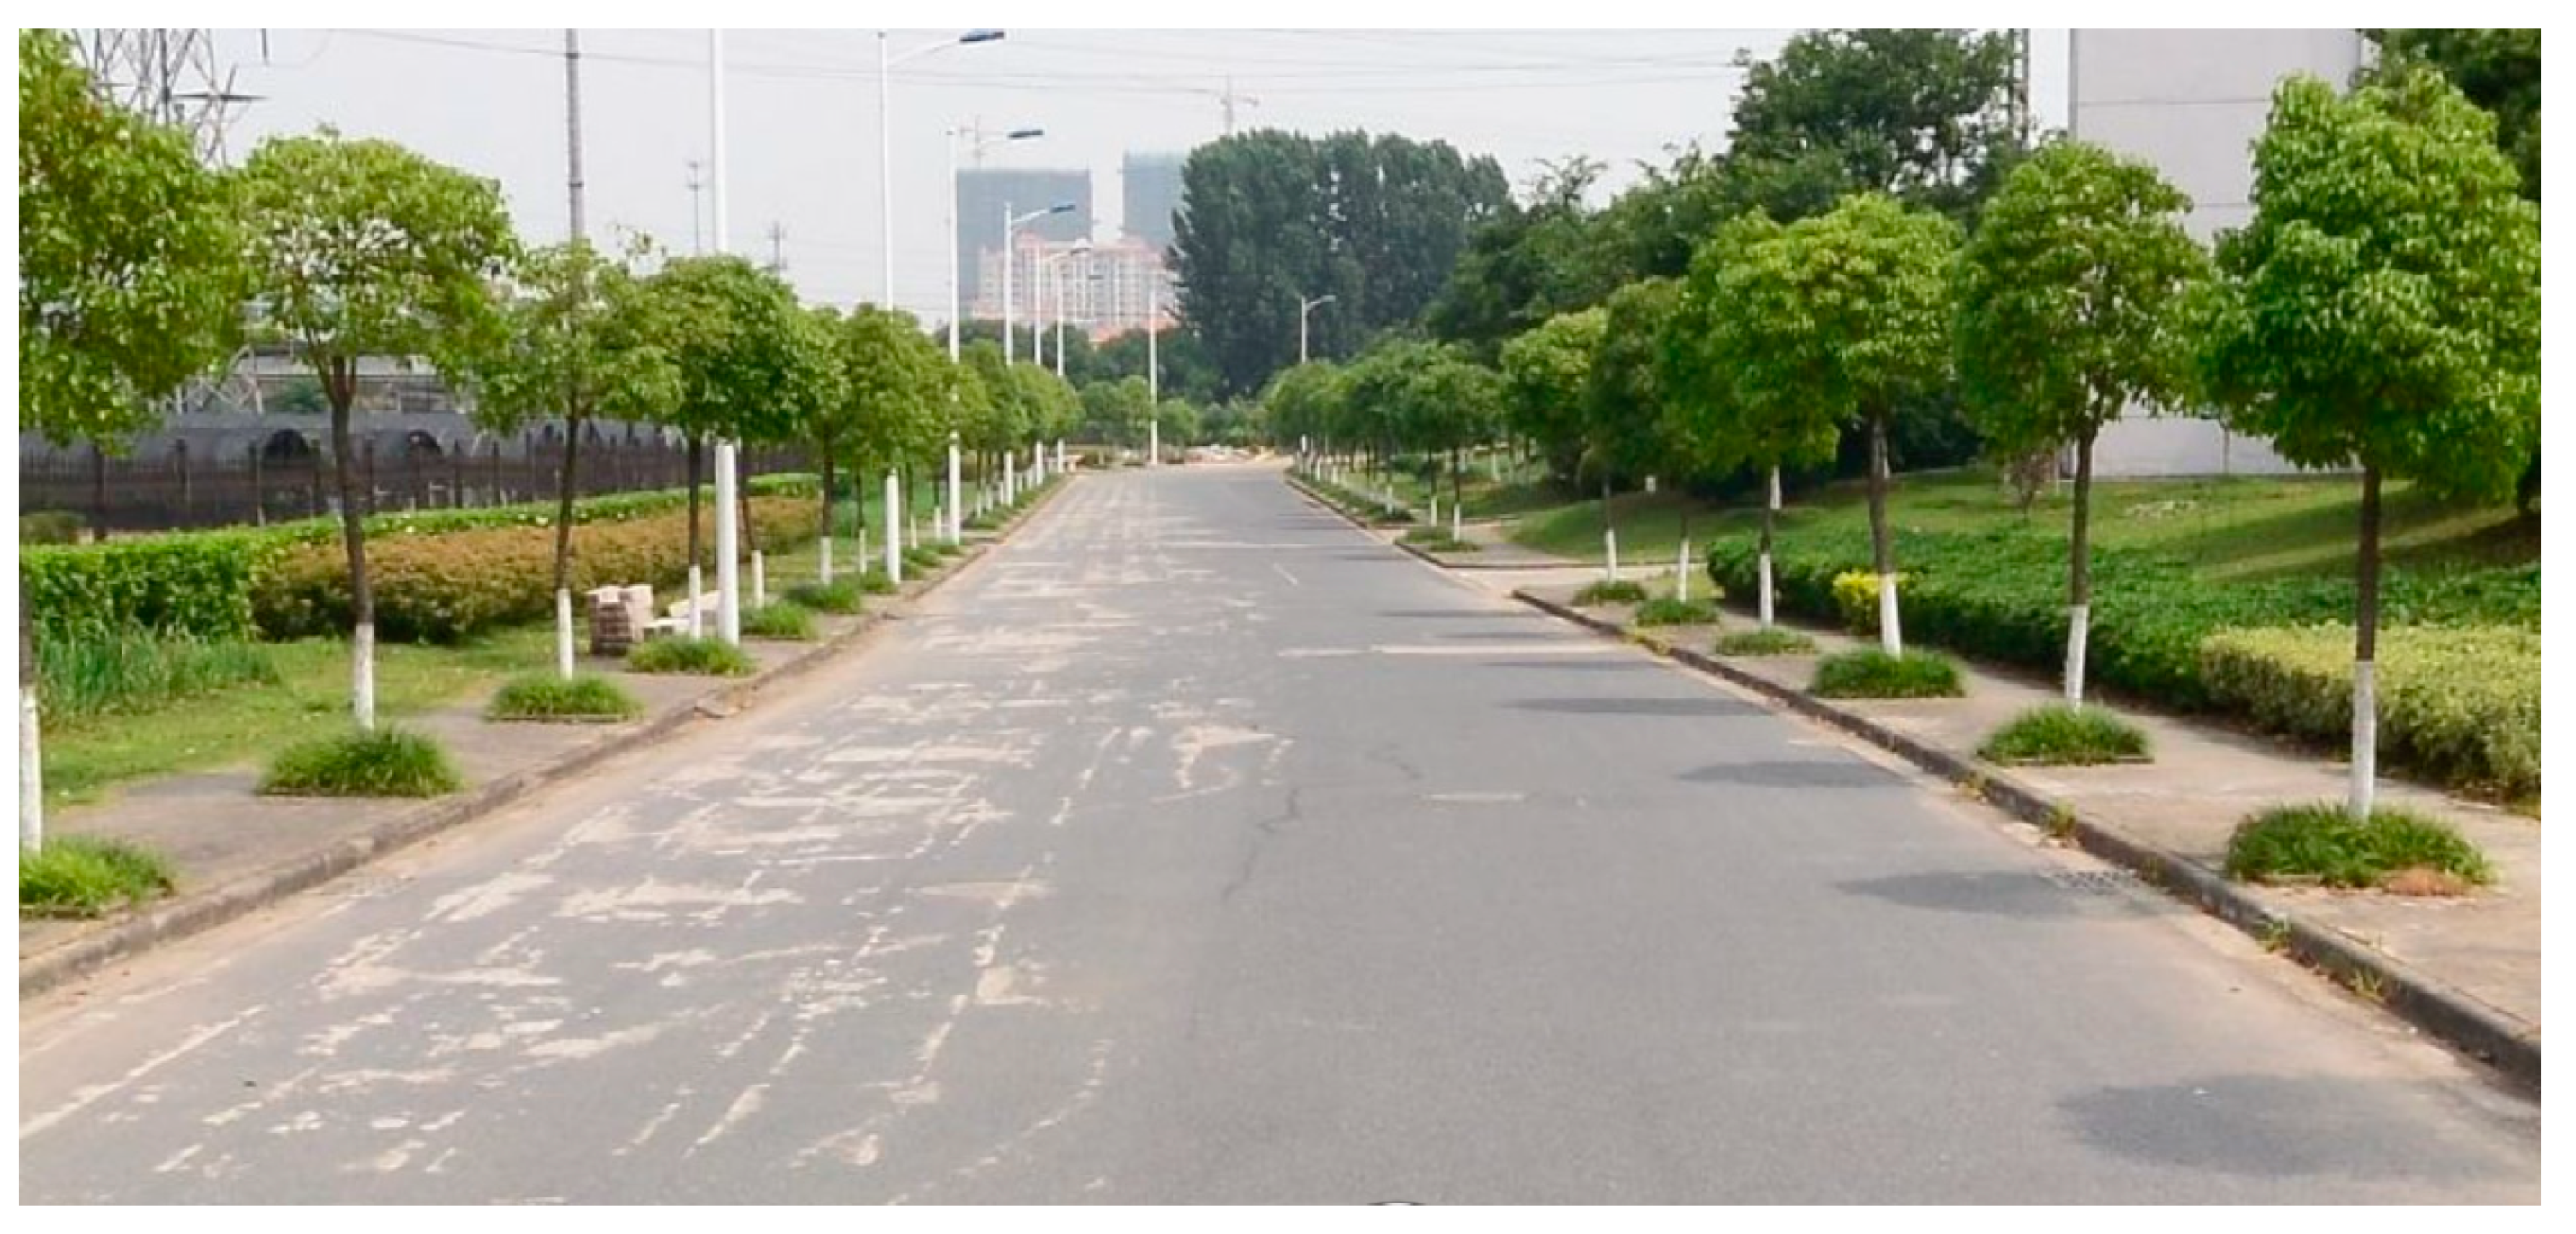
The random road was used in this test. The road selected is shown in the Figure 5. The road is asphalt pavement, which is flat and dry without protrusion.
The height of the vehicle driver and passenger is about 1.7 m and the weight is about 65 kg. The driver should start the vehicle and maintain the test speed about 50 m before crossing the test road. The data were recorded at the beginning of the test road and finished 10 s later.
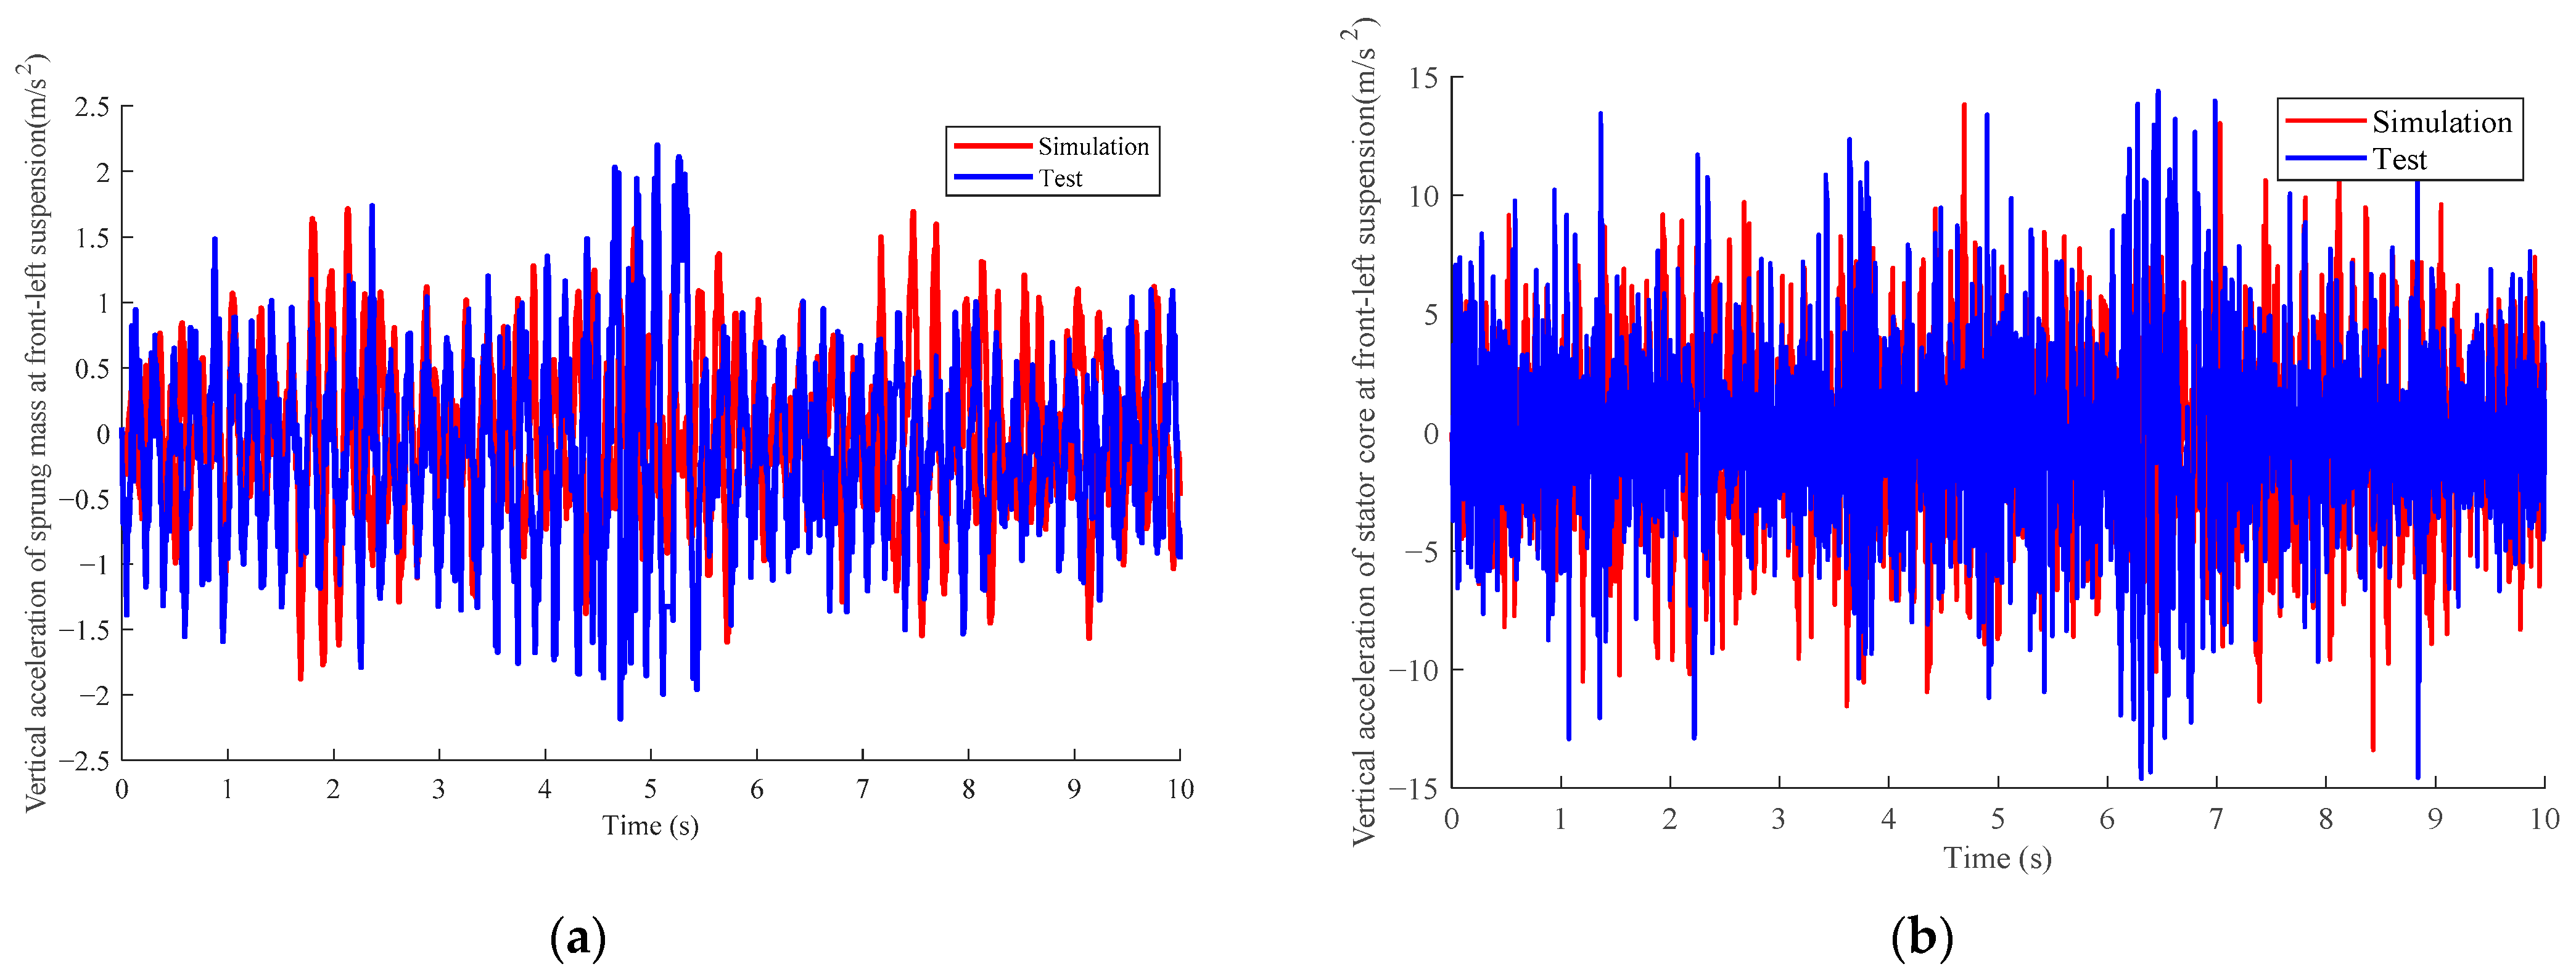
The data used for comparison are z ¨ s 1 and z ¨ ms 1 . Figure 6 shows the comparison of the simulation and test at a speed of 30 km/h, and the root-mean-square values of the simulation and test are shown in Table 2.
It can be seen from the comparison that the trend and amplitude of the simulation and test are basically the same, and the different values are about 10%. Therefore, the established dynamic model of the HM-AS vehicle can accurately reflect the real dynamic characteristics of hub-driven vehicles.

4. Optimal Control of the HM-AS Vehicle

4.1. LQR Controller Design

The state quantity of the HM-AS vehicle model is:
x = [ z s   φ   θ   z t 1   z t 2   z t 3   z t 4   z ms 1   z ms 2   z ms 3   z ms 4   z ˙ s   φ ˙   θ ˙   z ˙ t 1   z ˙ t 2   z ˙ t 3   z ˙ t 4   z ˙ ms 1   z ˙ ms 2   z ˙ ms 3   z ˙ ms 4 ] T
The control input of the HM-AS vehicle model is:
u = [ F u 1   F u 2   F u 3   F u 4 ] T
The disturbance input of the HM-AS vehicle model is:
ω = [ q 1   q 2   q 3   q 4   F ez 1   F ez 2   F ez 3   F ez 4 ] T
The output of the HM-AS vehicle model is:
y = [ z ¨ s   e 1   e 2   e 3   e 4   F d 1   F d 2   F d 3   F d 4   φ ¨   θ ¨ ] T
to be specific,
e i = z msi z ti
z ¨ s , e i , F di , φ ¨ , θ ¨ are selected to be evaluation indices. Among them, z ¨ s ,   φ ¨ ,   θ ¨ show ride comfort, e i shows motor safety, and F di shows handling stability. The smaller these evaluation indices, the better the performance of the HM-AS vehicle. In this research, the vehicle moves in a straight line at a constant speed, and therefore the ride comfort is the more important assessment criteria, especially z ¨ s . Considering the HM-AS vehicle is equipped with four hub motors, motor safety is necessary to be improved. Under the driving condition of constant speed, handling stability has a smaller weight.
The state space equation of the HM-AS vehicle model is:
{ x ˙ = A x + B u u + B ω ω y = C x + D u u + D ω ω
where A is the state matrix; B u and B ω are the input matrices; C is the output matrix; and D u and D ω are the feedforward matrices.
{ A = x ˙ x         B u = x ˙ u         B ω = x ˙ ω   C = y ˙ x         D u = y ˙ u         D ω = y ˙ ω
The performance index function of the LQR controller is:
J = 0 [ y T Q y + u T R u ] d t = 0 [ x u ] T [ Q c N c T N c R c ] [ x u ] d t
to be specific,
{ Q = d i a g [ p 1 p 2 p 3 p 4 p 5 p 6 p 7 p 8 p 9 p 10 p 11 ] R = d i a g [ s 1 s 2 s 3 s 4 ] Q c = C T Q C R c = D u T Q D u + R N c = C T Q D u
where Q is the state quantity weight matrix; p 1 ~ p 11 are the state quantity weight coefficients, corresponding to 11 evaluation indices, respectively; R is the control quantity weight matrix; s 1 ~ s 4 are the control quantity weight coefficients, corresponding to four suspension damping control forces, respectively; and Q c , R c , N c are the weighting matrices of the cross product terms.
Calling the LQR toolbox of MATLAB, the optimal feedback gain matrix K and the control input u of the system can be calculated.
{ K = l q r ( A , B u , Q c , R c , N c ) u = K x

4.2. Weight Distribution of the LQR Controller Based on Genetic Algorithm

Genetic algorithm (GA) is a computational model that simulates Darwin’s theory of evolution and Mendel’s theory of genetics. It obtains the optimal solution of a problem to be solved by continuously copying, crossing, and mutating with a group of chromosomes according to the principle of survival of the fittest. Different from other optimization algorithms, the genetic algorithm needs to convert the initial population from decimal to binary encoding, that is, to form a chromosome population. Then, according to the designed fitness function and crossover mutation probability, individuals in the chromosome population are passed on to the next generation through replication, crossover, and mutation. In the process of continuous repetition, the new generation of the chromosome population will meet the requirements of the fitness function more than the previous generation; the optimal solution in the last generation population is then decoded, which is the approximate optimal solution of problem to be solved.
The root-mean-square values of the evaluation indices of the HM-AS vehicle are selected to form the optimization objective function of the genetic algorithm, and the weight matrices Q and R of the LQR controller are selected as optimization variables. Due to the different dimensions of the optimization objectives, it is necessary to normalize each component of the objective function when constructing the fitness function. The sum of the ratios of the root-mean-square values of each evaluation index, both under LQR control and without control, is used as the fitness function:
H = R M S ( z ¨ s ) R M S ( z ¨ s ) u + R M S ( e 1 ) R M S ( e 1 ) u + R M S ( e 2 ) R M S ( e 2 ) u + R M S ( e 3 ) R M S ( e 3 ) u + R M S ( e 4 ) R M S ( e 4 ) u + R M S ( F d 1 ) R M S ( F d 1 ) u + R M S ( F d 2 ) R M S ( F d 2 ) u + R M S ( F d 3 ) R M S ( F d 3 ) u + R M S ( F d 4 ) R M S ( F d 4 ) u + R M S ( φ ¨ ) R M S ( φ ¨ ) u + R M S ( θ ¨ ) R M S ( θ ¨ ) u
where H is the fitness function value, and the subscript “ u ” represents the root mean square value of each evaluation index that is not controlled under the same working condition.
The constraints of the genetic algorithm are:
{ p 1 ~ 11 [ 1 , 1 × 10 15 ] s 1 ~ 4 [ 1 , 1 × 10 15 ] R M S ( z ¨ s ) 1.2 R M S ( z ¨ s ) u R M S ( e i ) 1.2 R M S ( e i ) u R M S ( F di ) 1.2 R M S ( F di ) u R M S ( φ ¨ ) 1.2 R M S ( φ ¨ ) u R M S ( θ ¨ ) 1.2 R M S ( θ ¨ ) u
Substitute the weight matrix, which is randomly generated by the genetic algorithm, into the model, and then calculate the value of the objective function according to Formula (34), that is, the fitness function required by the genetic algorithm. If each parameter output by the model operation satisfies the constraint of Formula (35), the fitness function is the output; otherwise, the fitness function value under this assignment is given a large positive number by the penalty function, so as to ensure the evolution of the population in the direction that satisfies the constraint.
Set the population size of the genetic algorithm to 100 and the number of iterations to 200.

5. Simulation Results

The simulation model is established in MATLAB/Simulink. The simulation is carried out under two driving conditions, namely a random road and a bump road.
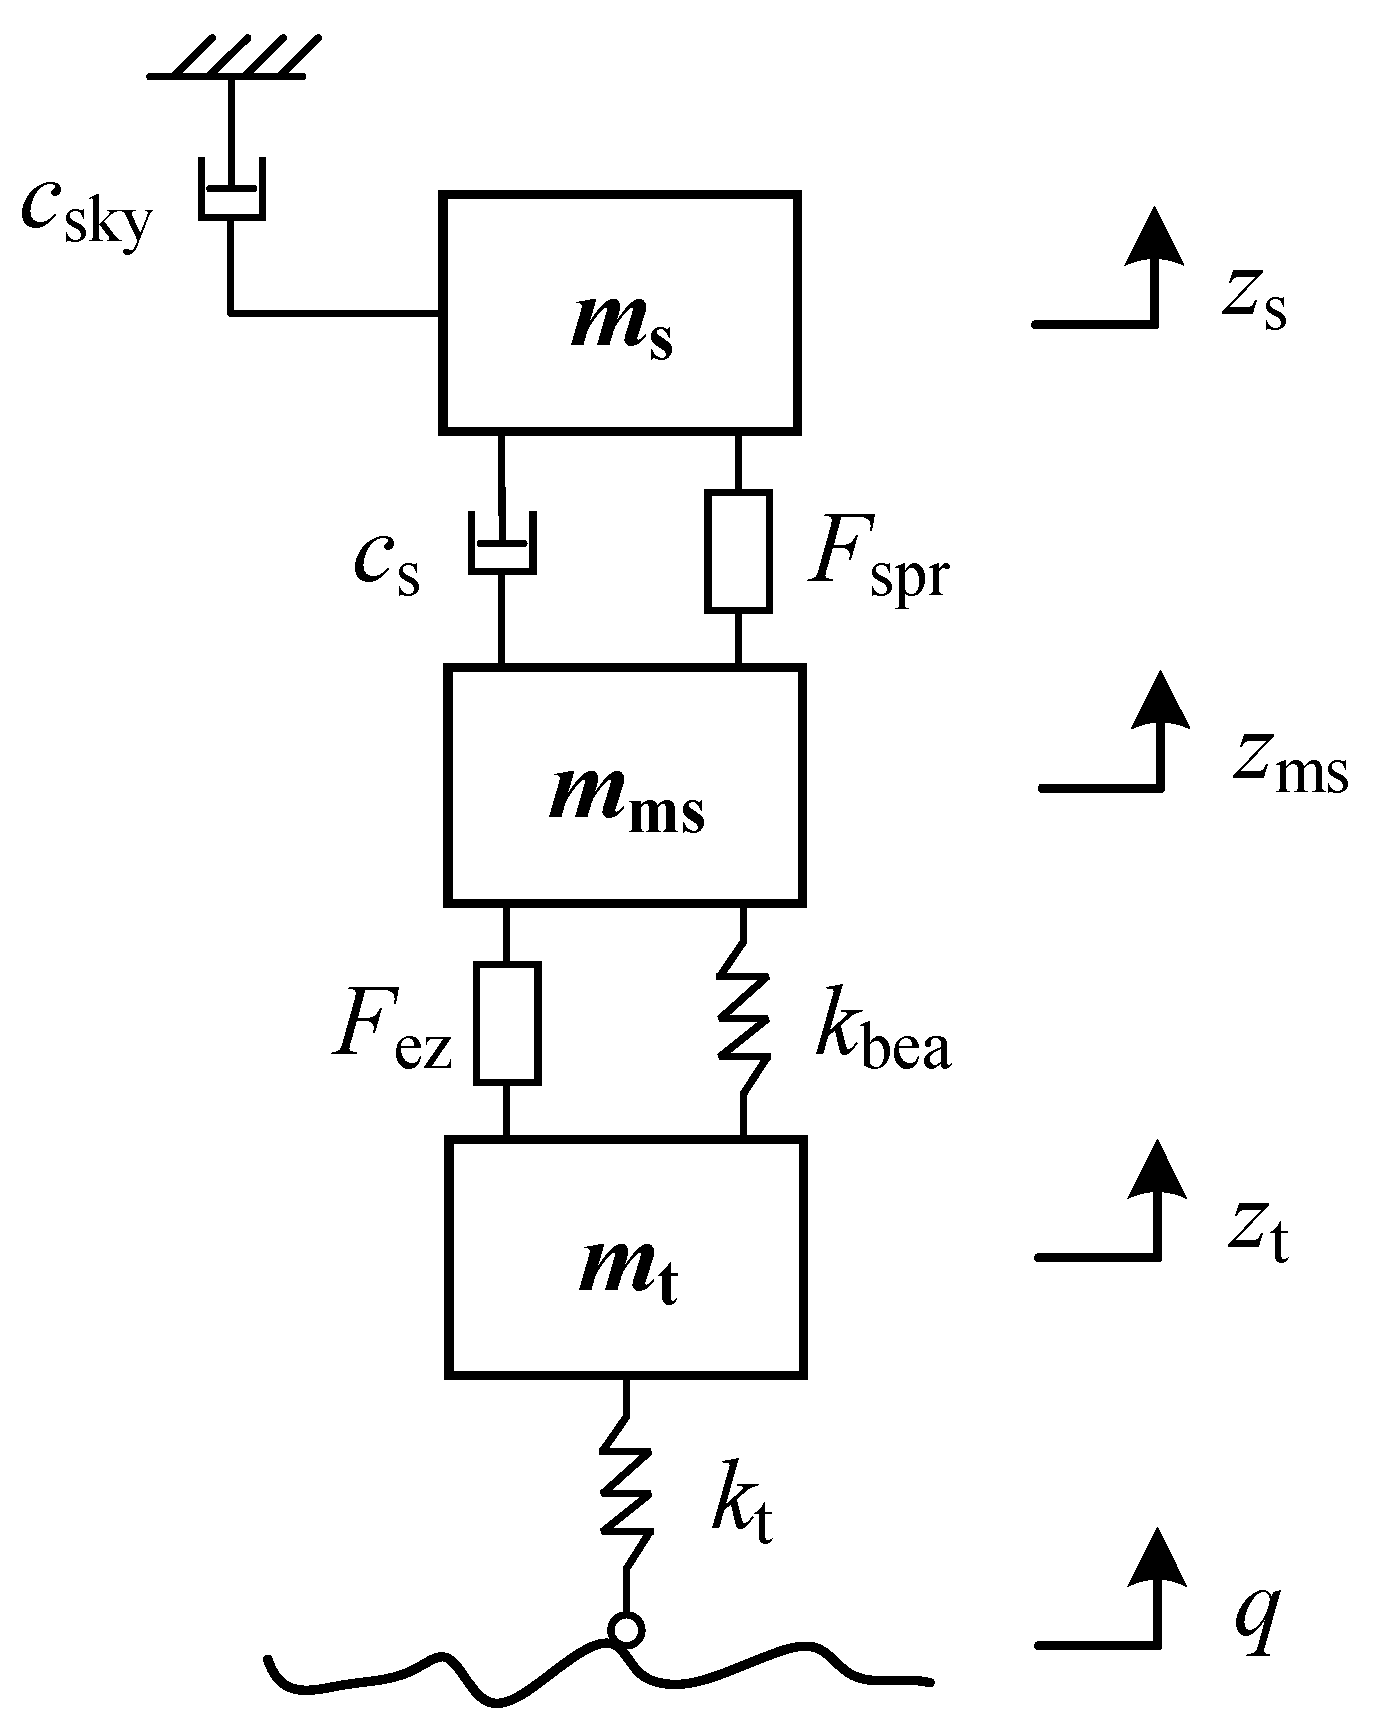
Skyhook damping control strategy is a classic vehicle suspension control method. Due to its simple structure and low cost, it is widely used in the study of suspension control and has been applied in some commercial models. The Skyhook control method assumes that the damper is mounted between the sprung mass and the virtual inertial space. The suspension is controlled by the feedback of the vertical vibration velocity of the sprung mass. The ideal Skyhook damping force is:
F skyi = c skyi z ˙ si
where c skyi is the Skyhook damping coefficient.
The Skyhook suspension control model is shown in Figure 7.
In order to show the superiority of the LQR controller, the Skyhook control is used as a comparison.

5.1. Simulation on Random Road

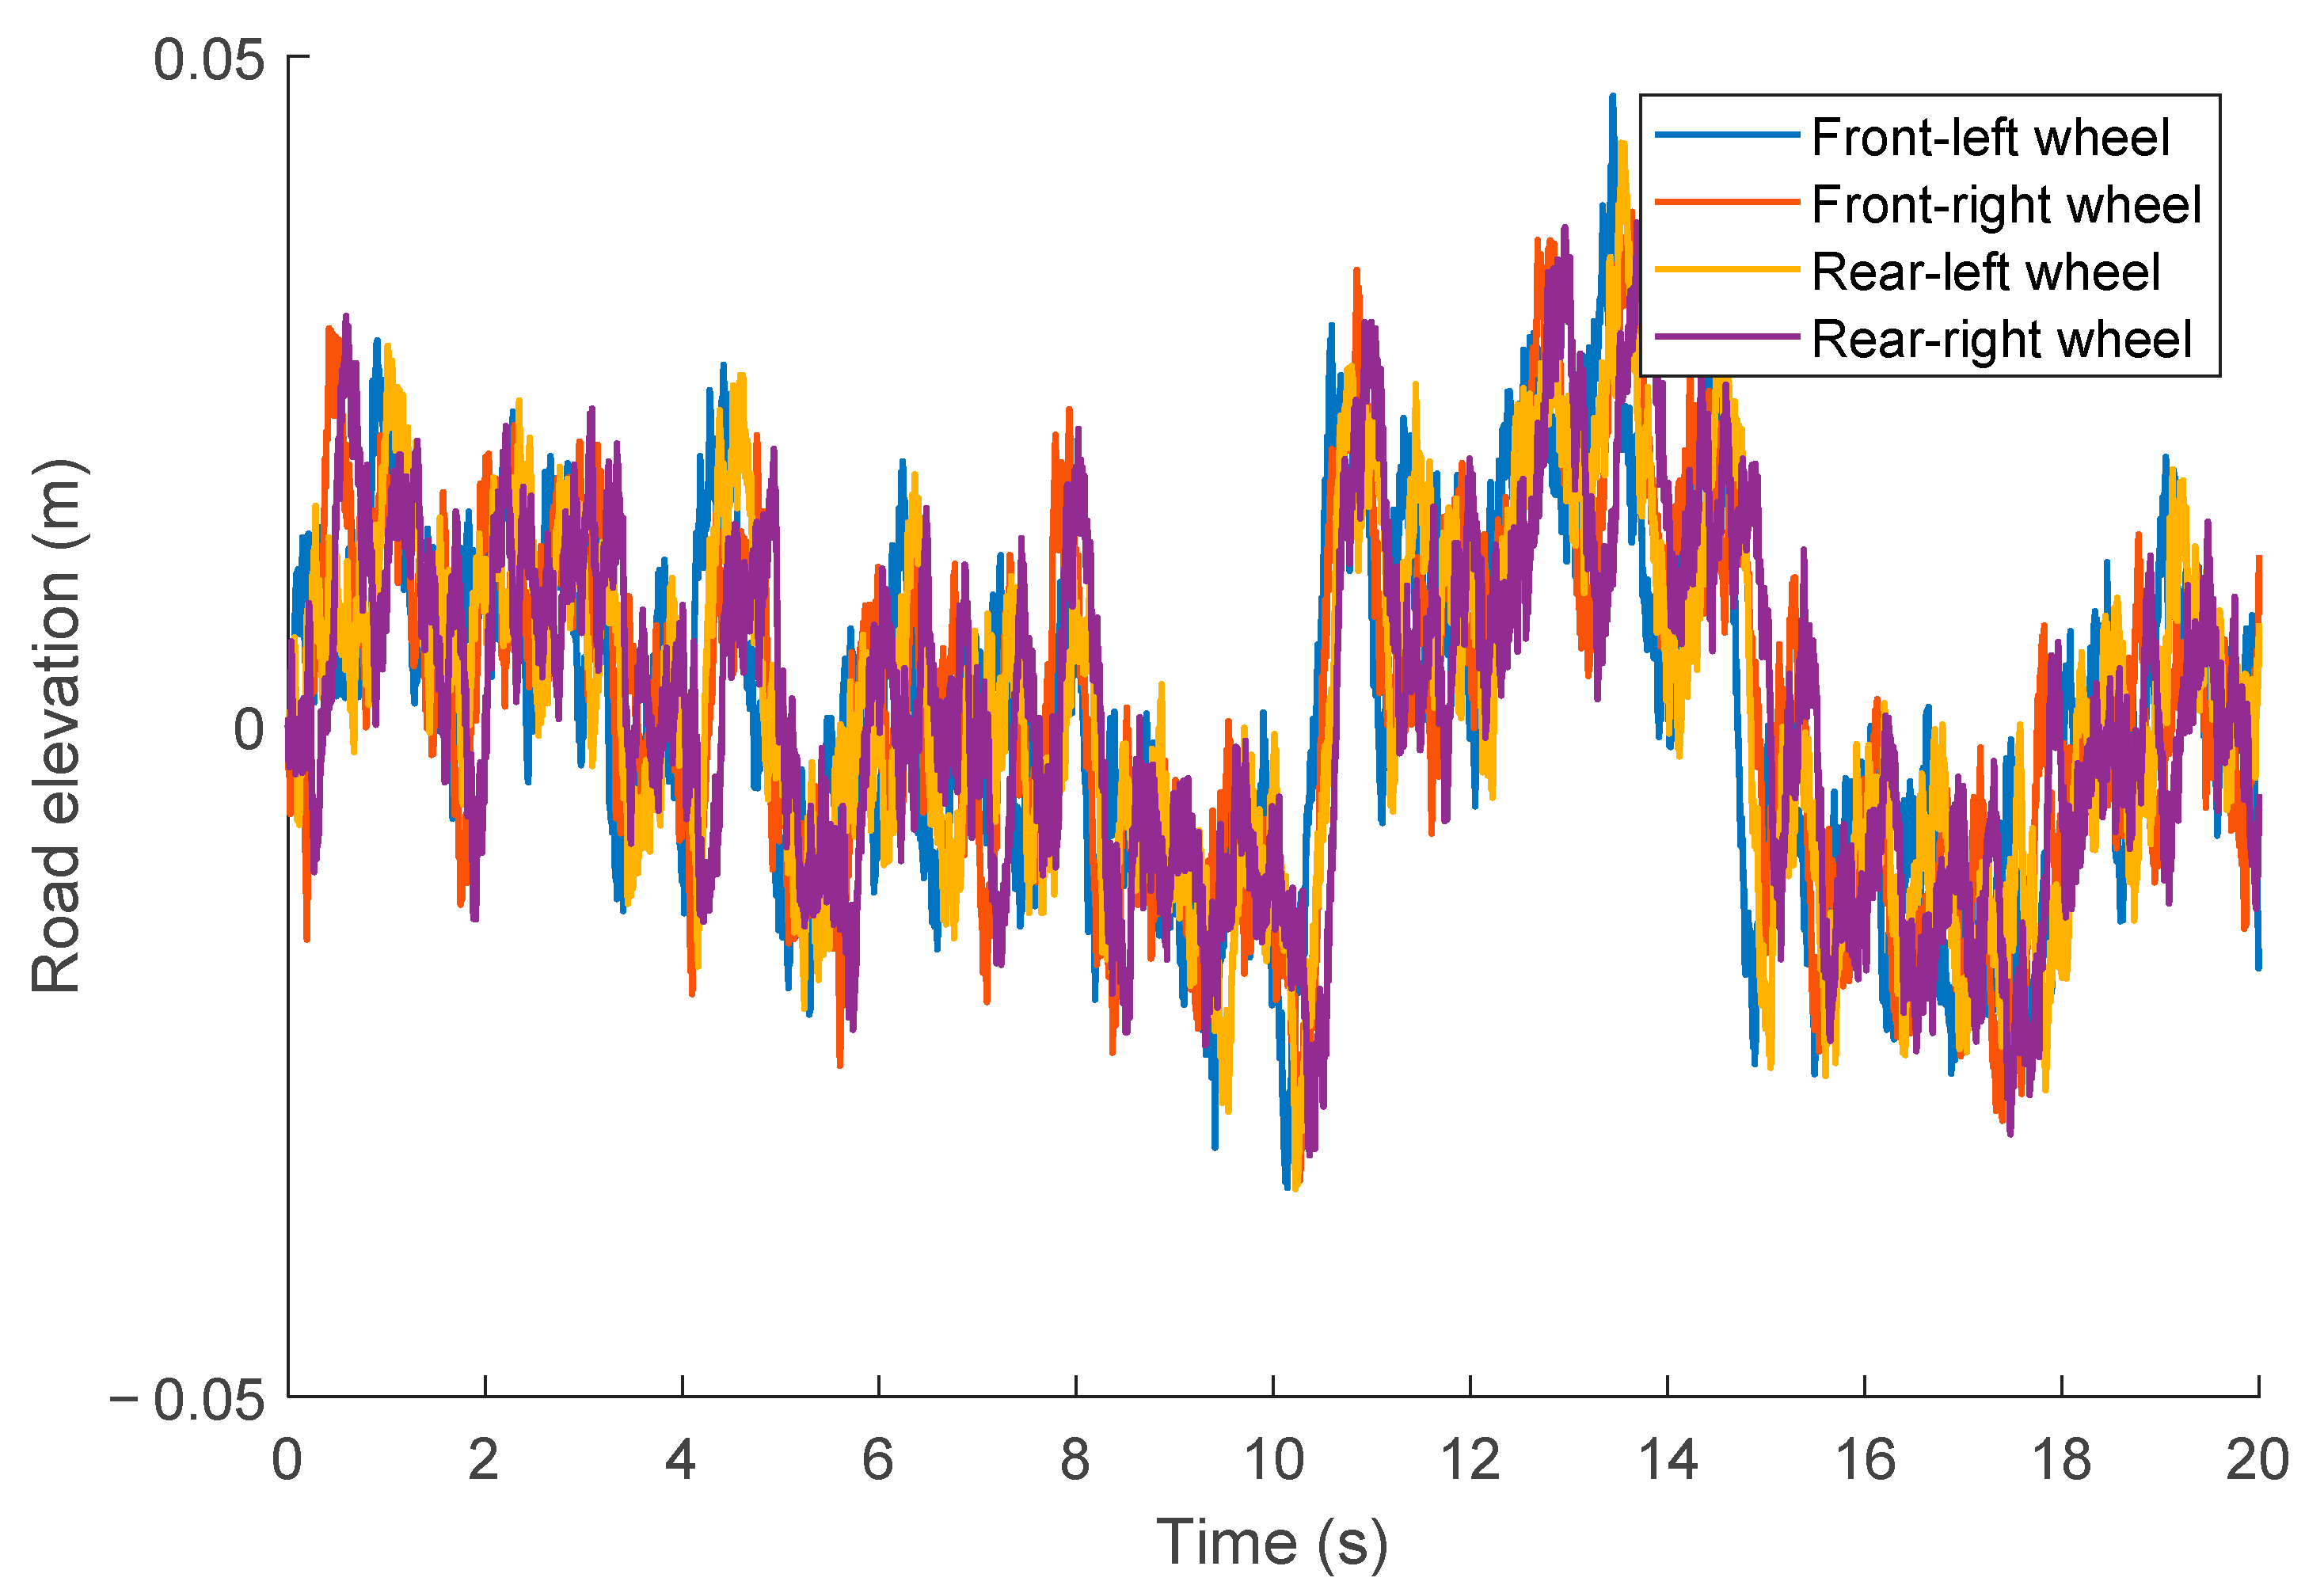
The input of the simulation model is the C-level random road excitation with the vehicle speed of 72 km/h, and the simulation time is 20 s. The road excitation amplitudes corresponding to the front-left, front-right, rear-left and rear-right wheels are shown in Figure 8.
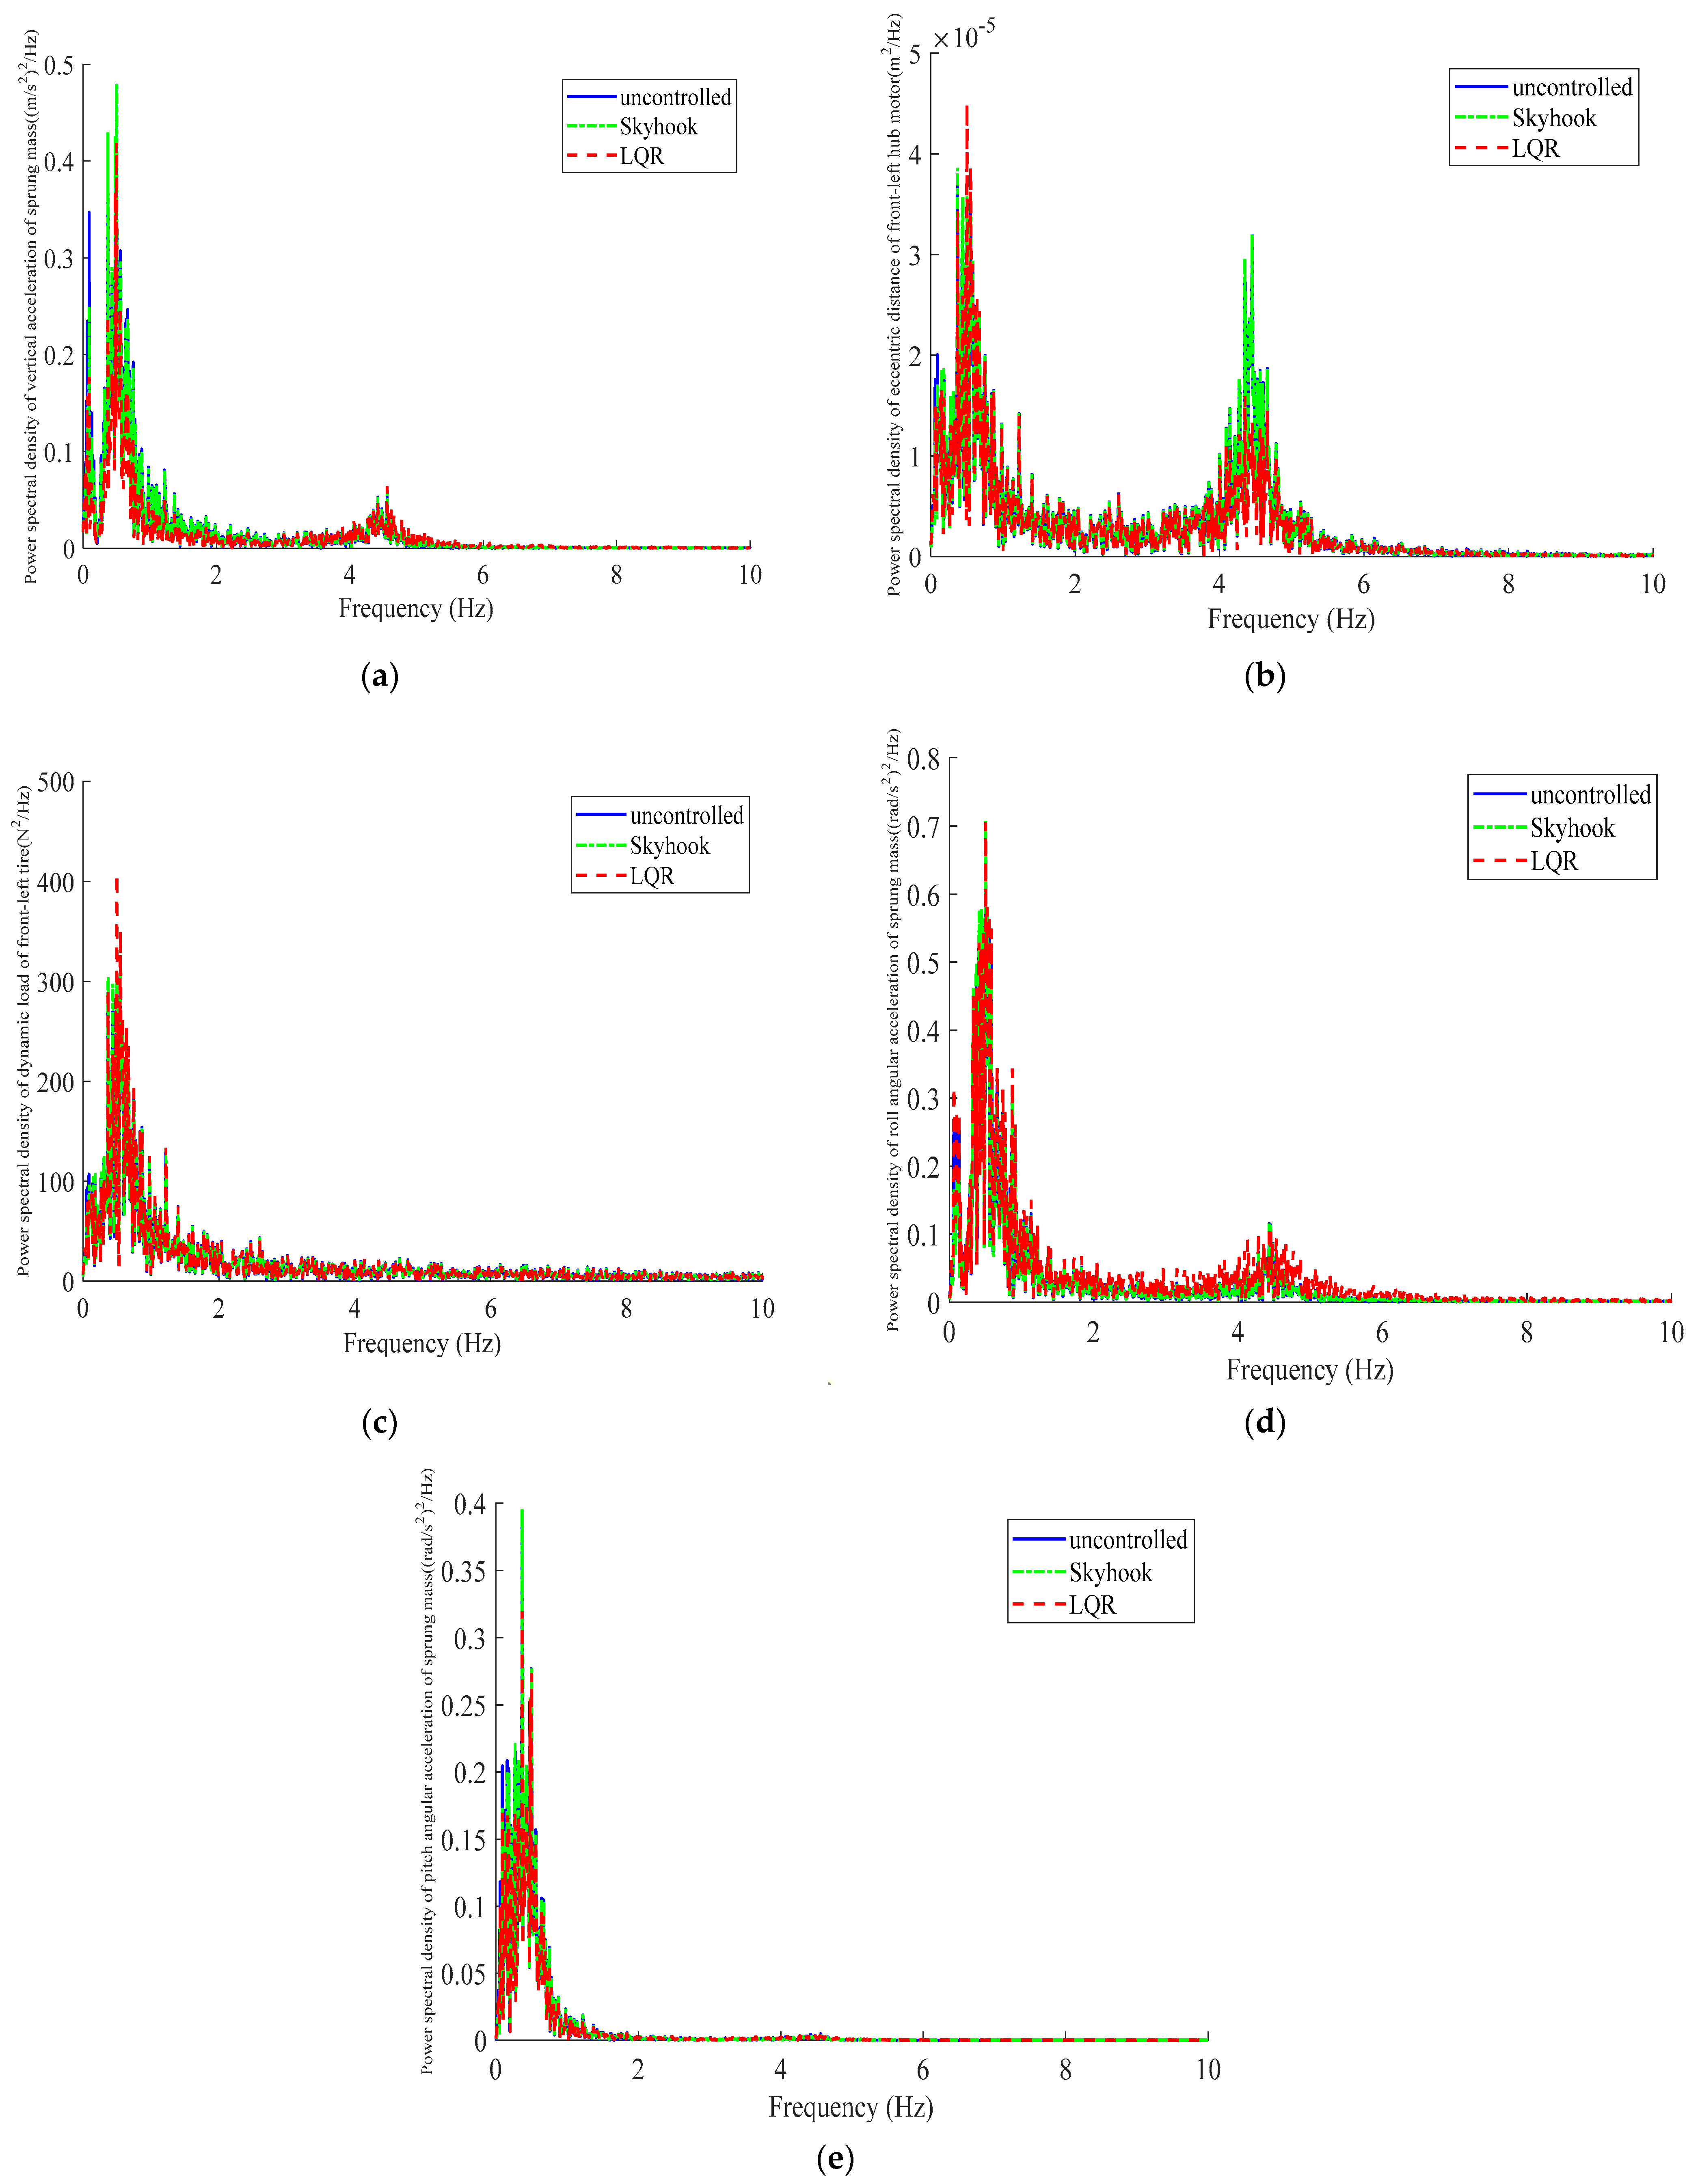
The root-mean-square values of the evaluation indices and improvement rates are shown in Table 3. The comparison in time domain is shown in Figure 9. The comparison in frequency domain is shown in Figure 10.
It can be seen from Table 3 and Figure 9 that the designed LQR controller can effectively improve z ¨ s , e i and θ ¨ , which means ride comfort and motor safety are optimized. However, when using the LQR controller, F di and φ ¨ deteriorate slightly.
The human body is sensitive to vibration frequencies between 4 and 8 Hz. As is shown in Figure 10, the power spectral density of z ¨ s has been improved a lot by the LQR controller and shows superiority between 4 and 8 Hz. With LQR control, the power spectral density of F di and the power spectral density of φ ¨ worsen slightly, whereas the power spectral density of e i and the power spectral density of θ ¨ become better than those with the Skyhook control.

5.2. Simulation on Bump Road

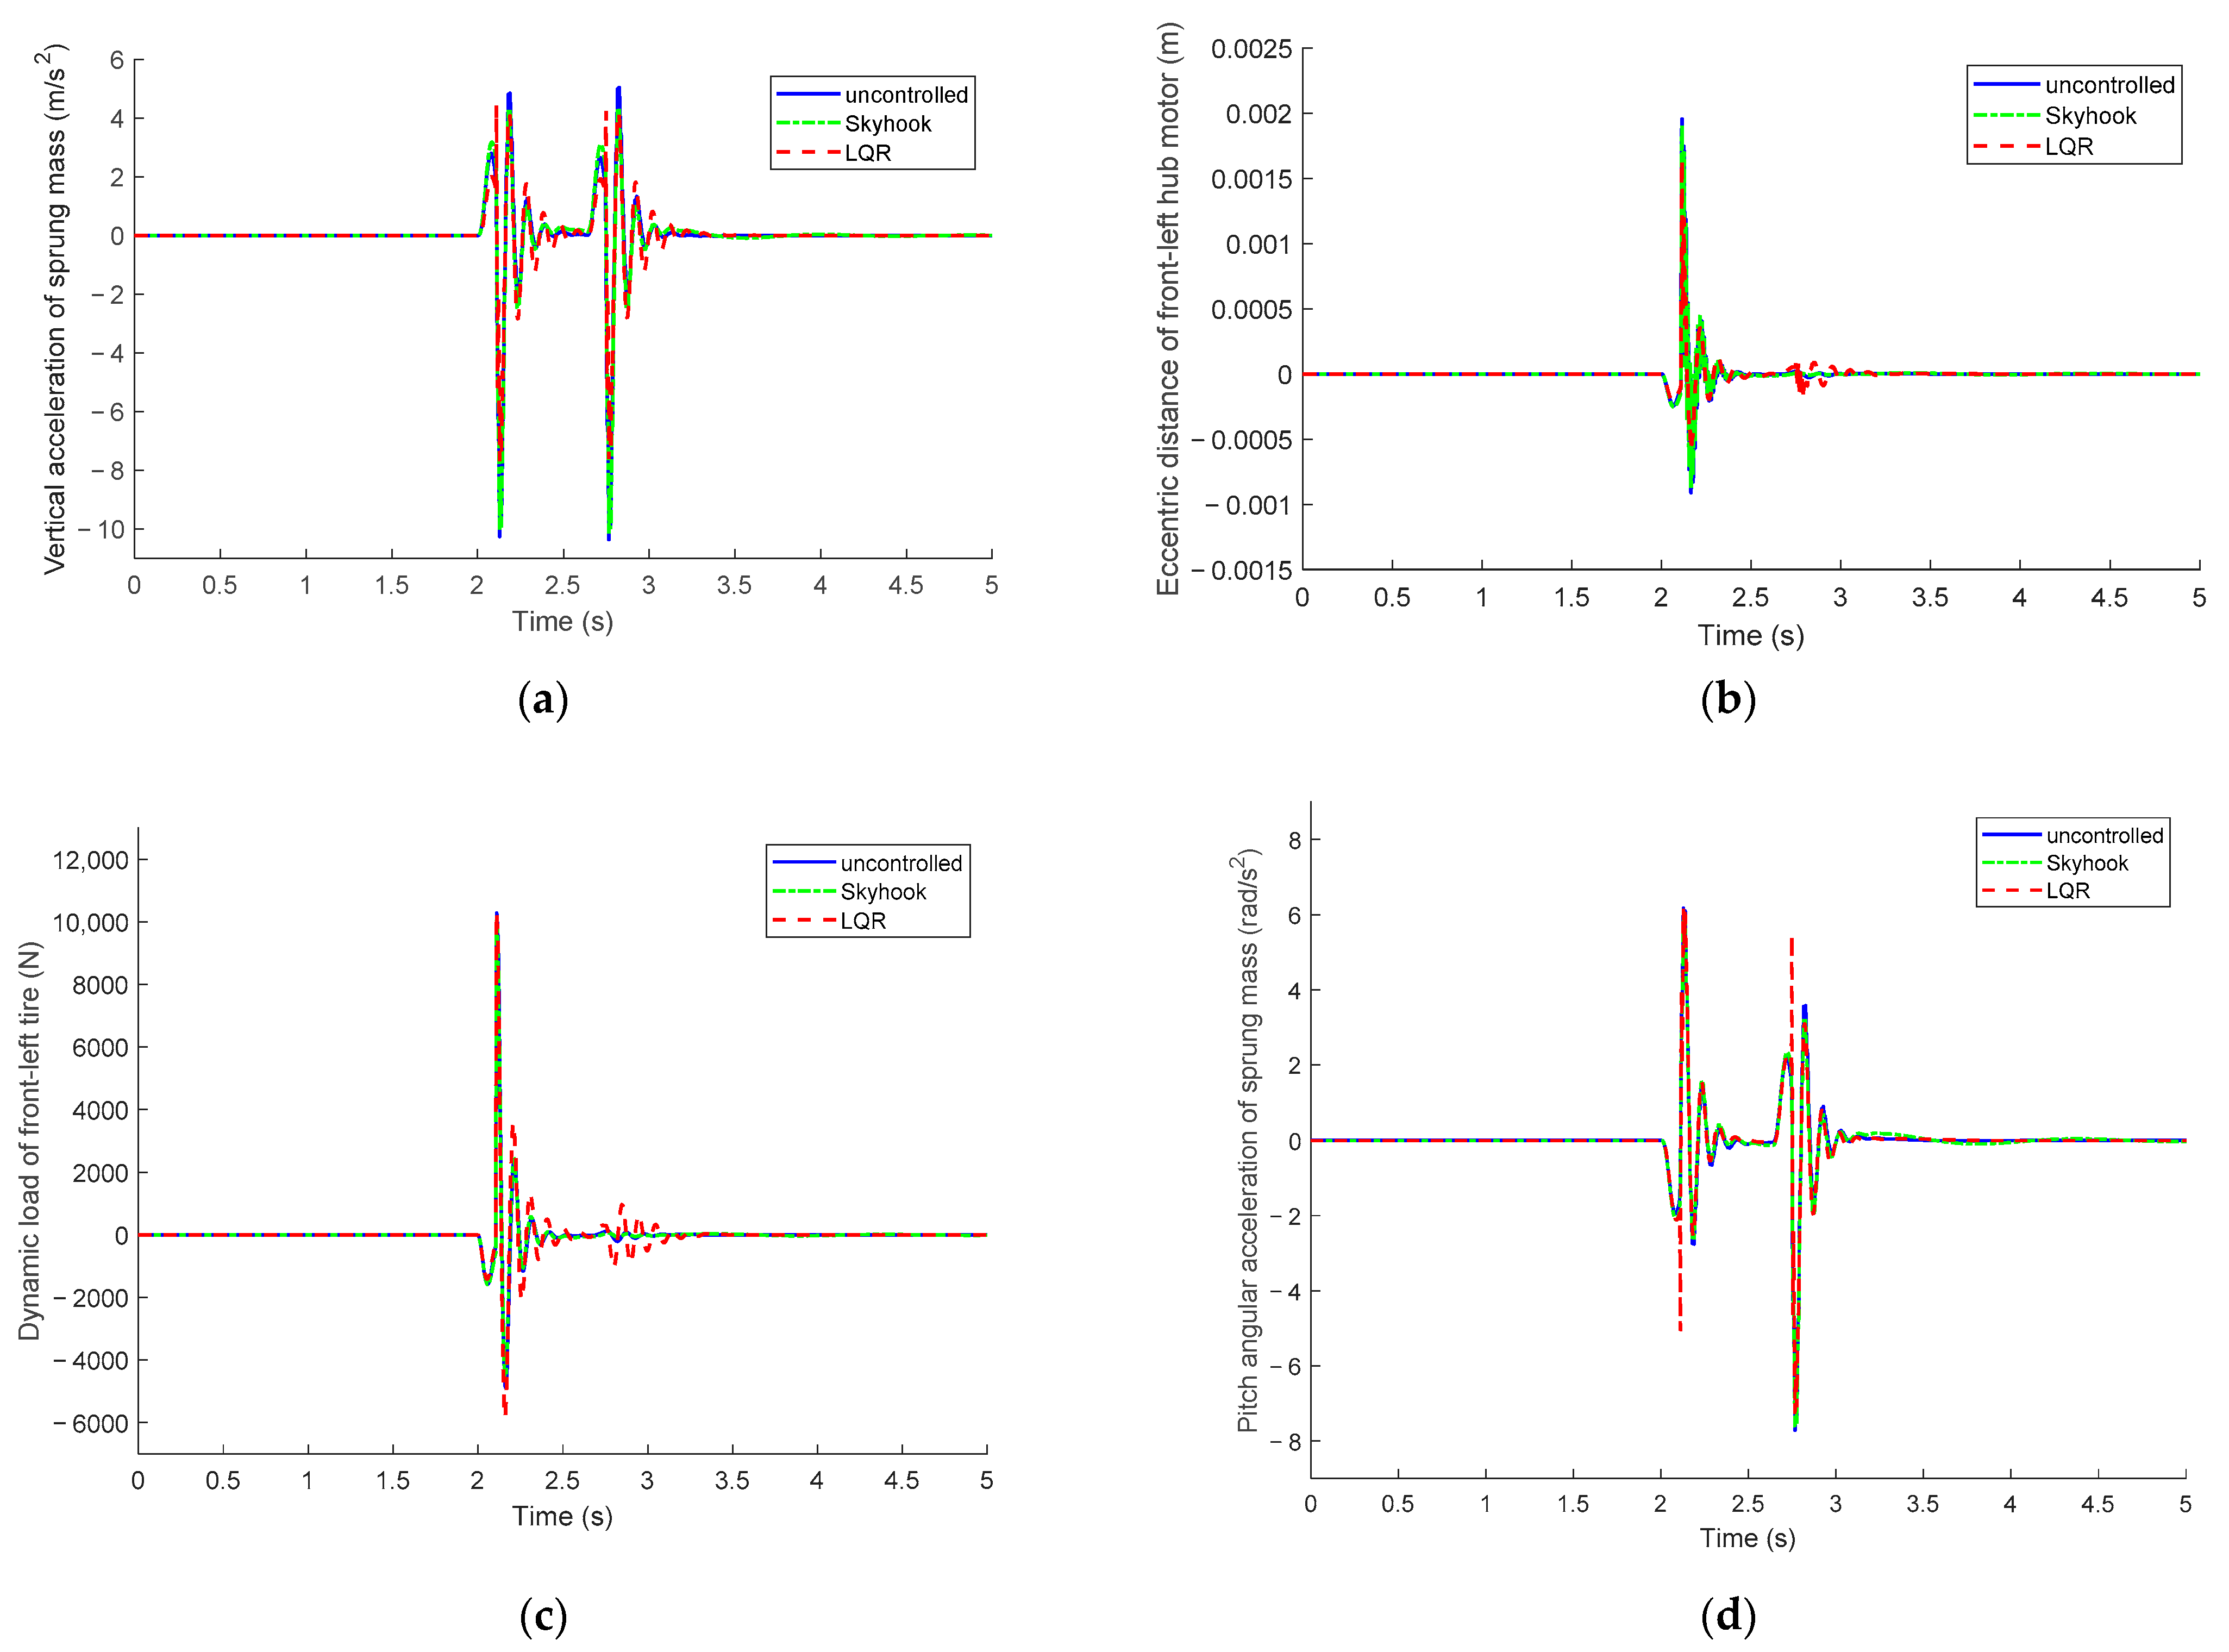
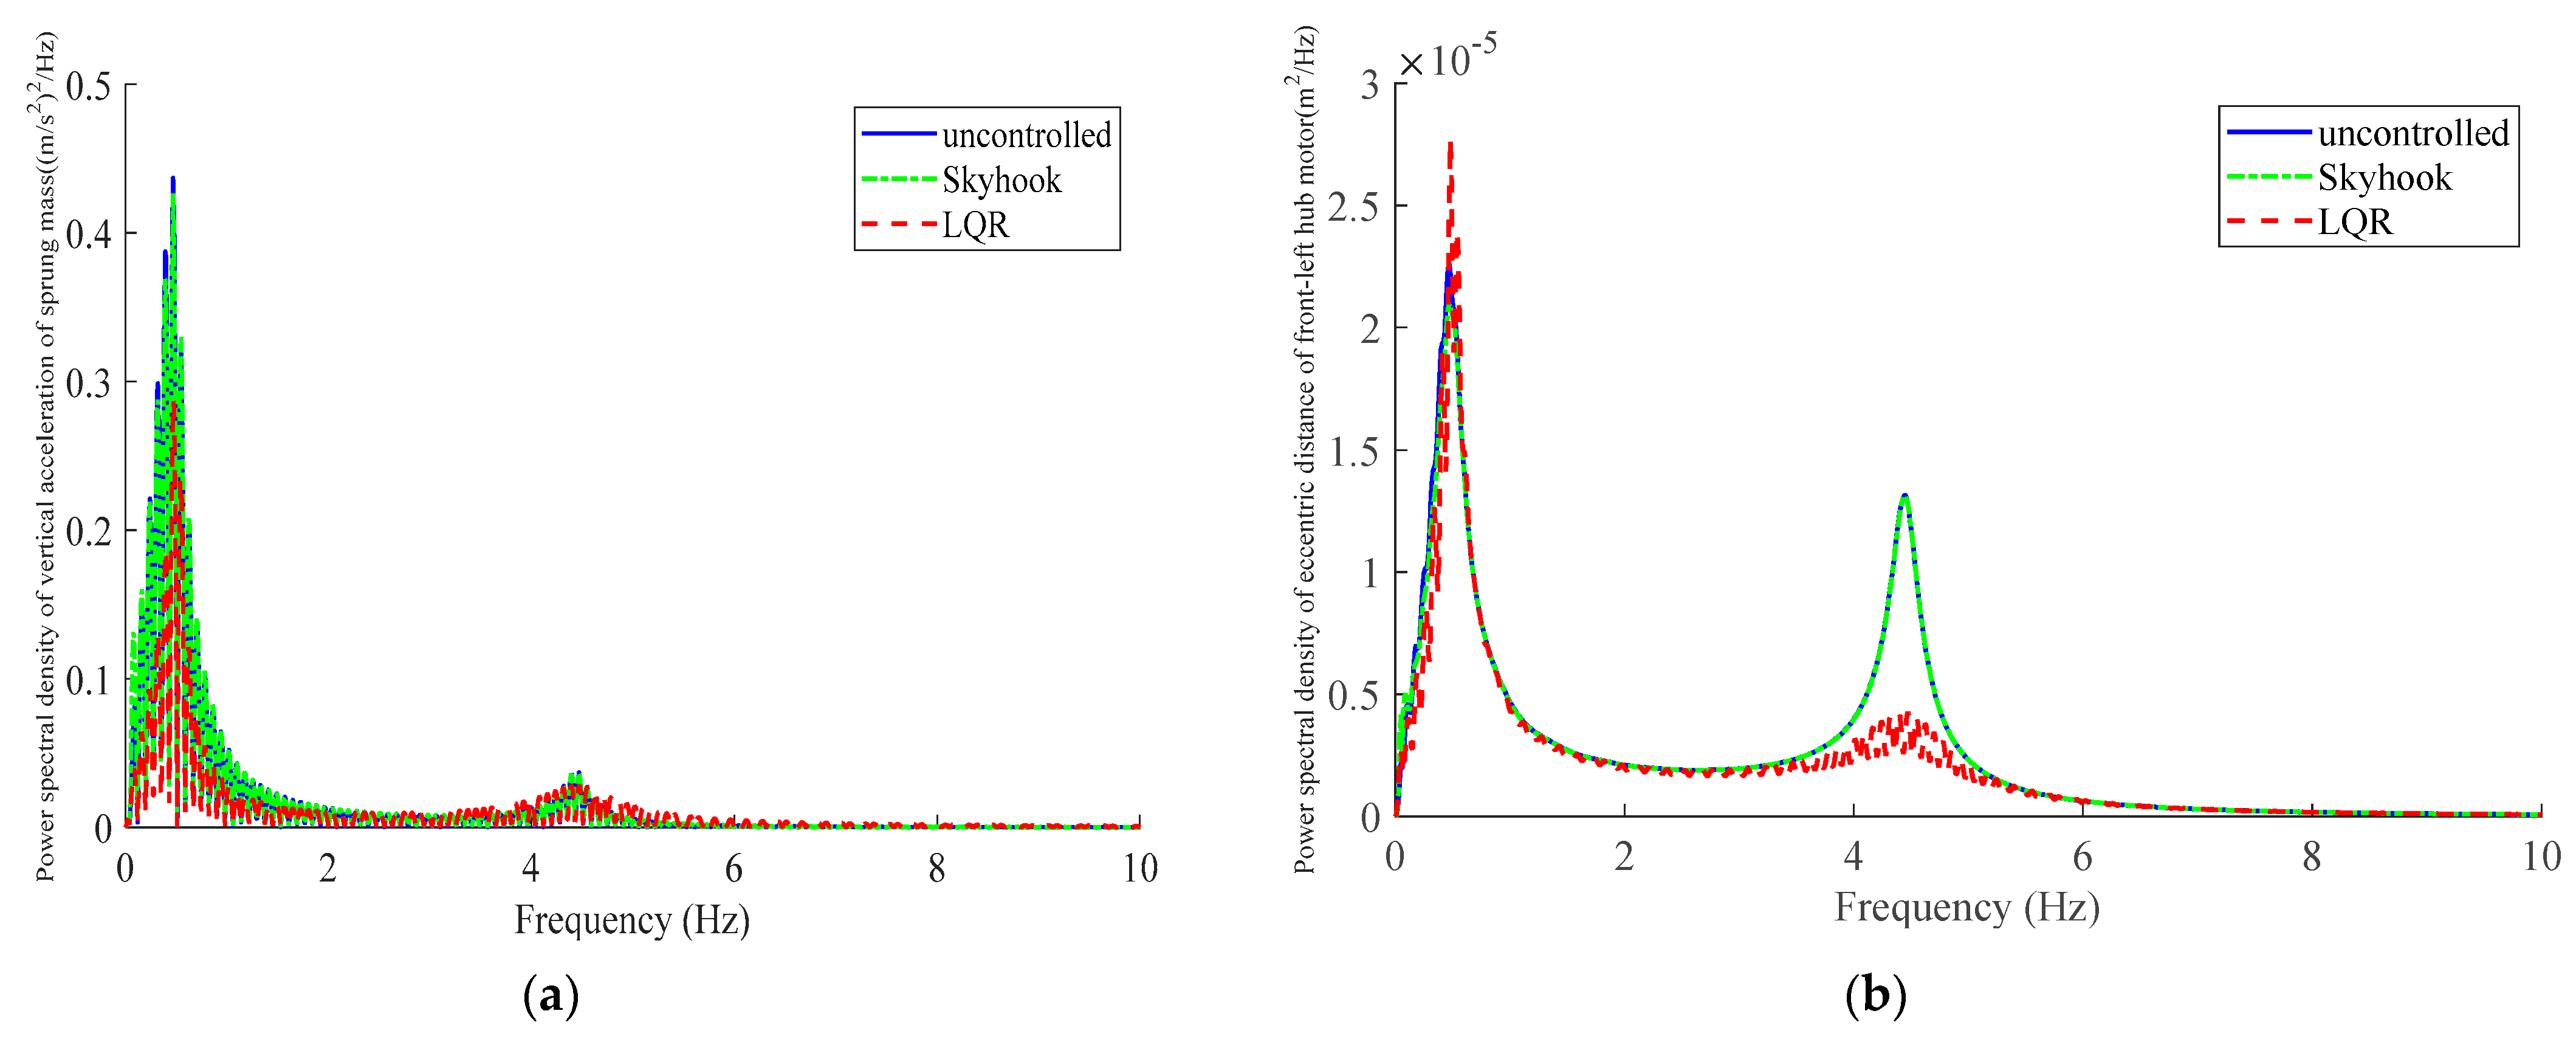
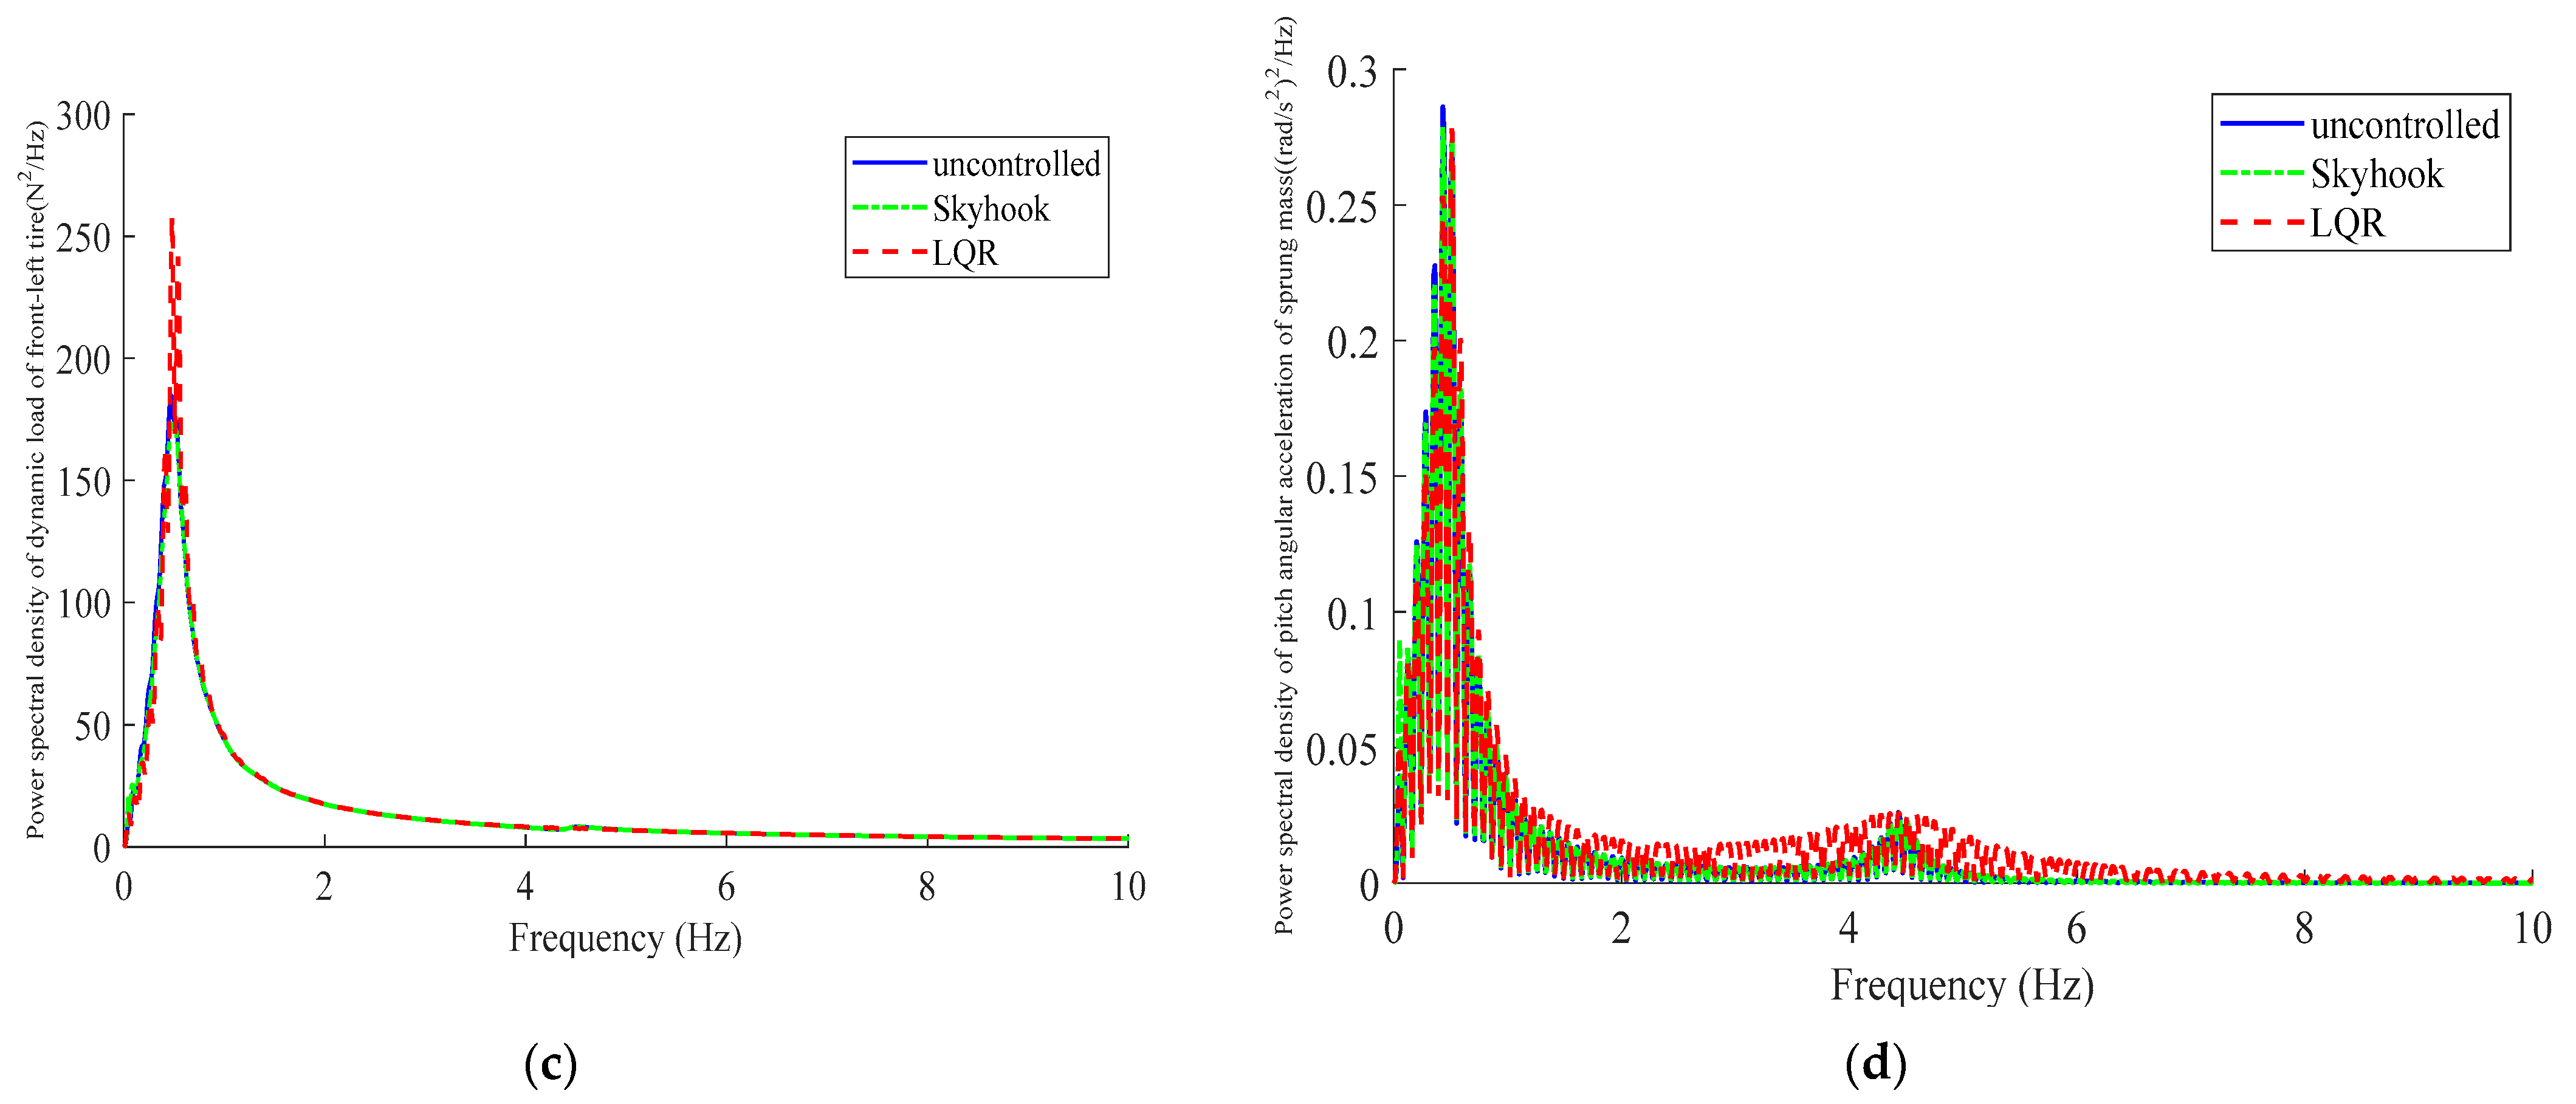
In the simulation, the HM-AS vehicle moves in a straight line at 10 km/h and hits the speed bump at 2 s. The simulation time is 5 s. The road excitation amplitudes corresponding to the front-left, front-right, rear-left and rear-right wheels are shown in Figure 11. Under this driving condition, the roll angular acceleration of sprung mass is 0. The root-mean-square values of the evaluation indices and improvement rates are shown in Table 4. The comparison in time domain is shown in Figure 12. The comparison in frequency domain is shown in Figure 13.
As is shown in Table 4 and Figure 12, the values of z ¨ s , e i are significantly decreased by the LQR controller, which makes the HM-AS vehicle more comfortable. At the same time, the RMS of F di increases slightly, and the RMS of θ ¨ is almost unchanged.
In Figure 13, the power spectral density of z ¨ s of the LQR control is lower than that of the Skyhook control by between 4 and 8 Hz. With LQR control, the power spectral density of F di and the power spectral density of θ ¨ worsen slightly, and the power spectral density of e i shows good results.

6. Conclusions

(1)
Based on electromagnetics and vehicle dynamics, the vertical vibration model of the HM-AS vehicle is established. The vehicle road test is carried out, and the simulation results are compared with the test results, which proves that the dynamic model is correct.
(2)
Vertical acceleration of sprung mass, eccentric distance of each hub motor, dynamic load of each tire, roll angular acceleration of sprung mass, and pitch angular acceleration of sprung mass are proposed as evaluation indices, which can show changes in vehicle’s ride comfort, motor safety, and handling stability.
(3)
An LQR controller is designed for the HM-AS vehicle, and the optimal control weight matrix is determined by genetic algorithm. Simulation analysis is carried out and compared with the Skyhook control strategy under random road excitation and bump road excitation. The simulation results are analyzed in the time domain and the frequency domain. As simulation results show, compared with the Skyhook controller, the LQR controller can effectively improve ride comfort and motor safety; however, handling stability deteriorates slightly.

Author Contributions

Methodology, H.J.; software, C.W.; validation, H.J.; writing—original draft preparation, C.W.; writing—review and editing, B.C.; project administration, H.J.; funding acquisition, H.J. All authors have read and agreed to the published version of the manuscript.

Funding

This research was funded by National Natural Science Foundation of China, grant number 51975254.

Institutional Review Board Statement

Not applicable.

Informed Consent Statement

Not applicable.

Data Availability Statement

The data presented in this study are available on request from the corresponding author. The data are not publicly available due to privacy.

Conflicts of Interest

The authors declare no conflict of interest.

References

  1. Ślaski, G.; Gudra, A.; Borowicz, A. Analysis of the influence of additional unsprung mass of in-wheel motors on the comfort and safety of a passenger car. Arch. Automot. Eng. 2014, 3, 51–64. [Google Scholar]
  2. Dukalski, P.; Będkowski, B.; Parczewski, K.; Wnęk, H.; Urbaś, A.; Augustynek, K. Dynamics of the vehicle rear suspension system with electric motors mounted in wheels. Maint. Reliab. 2019, 21, 125–136. [Google Scholar] [CrossRef]
  3. Dukalski, P.; Będkowski, B.; Parczewski, K.; Wnęk, H.; Urbaś, A.; Augustynek, K. Analysis of the Influence of Motors Installed in Passenger Car Wheels on the Torsion Beam of the Rear Axle Suspension. Energies 2022, 15, 222. [Google Scholar] [CrossRef]
  4. Lou, S.; Fu, Z.; Zhang, L.; Xu, C. Integrated Control of semi-active suspension and ABS based on sliding mode theory. In Proceedings of the 2010 29th Chinese Control Conference (CCC), Beijing, China, 29–31 July 2010. [Google Scholar]
  5. Zhang, Z.; Tang, G. Optimal Vibration Control for Vehicle Active Suspension Systems with Controller Delays. In Proceedings of the 2010 29th Chinese Control Conference (CCC), Beijing, China, 29–31 July 2010. [Google Scholar]
  6. Zhou, C.; Zhang, S.; Shi, P.; Zhang, P. Research on Active Suspension Control Strategy Based on the Model with Parameters of Hydraulic System. In Proceedings of the 2013 Fourth Global Congress on Intelligent Systems, Hong Kong, China, 3–4 December 2013. [Google Scholar] [CrossRef]
  7. Sathishkumar, P.; Jancirani, J.; John, D.; Arun, B. Controller Design for Convoluted Air Spring System Controlled Suspension. In Proceedings of the 16th International Mechanical Engineering Congress (IMEC), Tamil Nadu, India, 13–15 June 2014. [Google Scholar] [CrossRef]
  8. Yin, J.; Chen, X.; Li, J.; Qian, S. Performance Evaluation of an Active and Energy Regenerative Suspension Using Optimal Control. In Proceedings of the 2015 34th Chinese Control Conference (CCC), Hangzhou, China, 28–30 July 2015. [Google Scholar] [CrossRef]
  9. Ibrahim, K.; Ghazaly, N.; Ali, A.S. Simulation Control of an Active Suspension System Using Fuzzy Control & H∞ Control Methods. In Proceedings of the 2016 16th International Conference on Control, Automation and Systems (ICCAS), Gyeongju, Korea, 16–19 October 2016. [Google Scholar] [CrossRef]
  10. Zhang, N.; Li, Y.; Li, H.; Zhou, C. Design of Air Suspension System based on Neural Sliding Mode Control. In Proceedings of the 2016 13th International Computer Conference on Wavelet Active Media Technology and Information Processing (ICCWAMTIP), Chengdu, China, 16–18 December 2016. [Google Scholar] [CrossRef]
  11. Junyao, F.; Wenping, X.; Guohai, L. Vibration Control for Vehicle Active Suspension Based on ANFIS Method. In Proceedings of the 2017 36th Chinese Control Conference (CCC), Dalian, China, 26–28 July 2017. [Google Scholar] [CrossRef]
  12. Bao, L.; Chen, S.; Yu, S. Research on Active Fault-Tolerant Control on Active Suspension of Vehicle based on Fuzzy PID Control. In Proceedings of the 2017 Chinese Automation Congress (CAC), Jinan, China, 20–22 October 2017. [Google Scholar] [CrossRef]
  13. Prassad, G.S.; Mohan, M.K. A Contemporary Adaptive Air Suspension Using LQR Control For Passenger Vehicles. ISA Trans. 2019, 93, 244–254. [Google Scholar] [CrossRef]
  14. Rui, B. Nonlinear Adaptive Sliding-mode Control of the Electronically Controlled Air Suspension System. Int. J. Adv. Robot. Syst. 2019, 16, 1–6. [Google Scholar] [CrossRef]
  15. Shalabi, M.E.; El-Hussieny, H.; Abouelsoud, A.A.; Elbab, A.M.R.F. Control of Automotive Air-Spring Suspension System Using Z-Number Based Fuzzy System. In Proceedings of the 2019 IEEE International Conference on Robotics and Biomimetics (ROBIO), Dali, China, 6–8 December 2019. [Google Scholar] [CrossRef]
  16. Wen, T.; Zhai, M.; Long, Z.; Zhang, B. Adaptive Robust Synovial Electromagnetic Suspension Control Based on RBF Neural Network. In Proceedings of the 2019 Chinese Automation Congress (CAC), Hangzhou, China, 22–24 November 2019. [Google Scholar] [CrossRef]
  17. Zhang, N.; He, Y.; Whang, Y.; Whang, J. Active Suspension Control Based on Multi-Agent Predictive Algorithm. In Proceedings of the 2020 4th CAA International Conference on Vehicular Control and Intelligence (CVCI), Hangzhou, China, 18–20 December 2020. [Google Scholar] [CrossRef]
  18. Ahmed, A.A.; Jomah, O.S.M. Modeling and Control of Car Active Suspension System Using a Neural Network-based Controller and Linear Quadratic Regulator Controller. In Proceedings of the 2020 IEEE 2nd International Conference on Electronics, Control, Optimization and Computer Science (ICECOCS), Kenitra, Morocco, 2–3 December 2020. [Google Scholar] [CrossRef]
  19. Ma, R.; Do, C.M. Comfort-Oriented Semi-Active Matching Design with a Magneto-Rheological Air Suspension Mechanism. Iran. J. Sci. Technol. Trans. Mech. Eng. 2021, 45, 699–709. [Google Scholar] [CrossRef]
  20. Li, Z.; Liu, C.; Song, X.; Wang, C. Vibration Suppression of Hub Motor Electric Vehicle Considering Unbalanced Magnetic Pull. Proc. Inst. Mech. Eng. Part D J. Automob. Eng. 2021, 235, 3185–3198. [Google Scholar] [CrossRef]
  21. Shalabi, M.E.; Elbab, A.M.R.F.; El-Hussieny, H.; Abouelsoud, A.A. Neuro-Fuzzy Volume Control for Quarter Car Air-Spring Suspension System. IEEE Access 2021, 9, 77611–77623. [Google Scholar] [CrossRef]
  22. Yu, W.; Li, J.; Yuan, J.; Ji, X. LQR controller design of active suspension based on genetic algorithm. In Proceedings of the 2021 IEEE 5th Information Technology, Networking, Electronic and Automation Control Conference (ITNEC), Xi’an, China, 15–17 October 2021. [Google Scholar] [CrossRef]
  23. Jin, X.; Wang, J.; Yan, Z.; Li, Z.; Wang, Z. Development of Robust Constrained Control Strategy for Active Suspension System of Electric Vehicle with In-Wheel-Motor. In Proceedings of the 2021 40th Chinese Control Conference (CCC), Shanghai, China, 26–28 July 2021. [Google Scholar] [CrossRef]
  24. Jeong, J.-H.; Kim, S.Y.; Kwon, B.-S. Preview Control of Automotive Active Suspension Systems to Improve Ride Comfort Using V2V Communication. In Proceedings of the 2021 21st International Conference on Control, Automation and Systems (ICCAS), Jeju, Korea, 12–15 October 2021. [Google Scholar] [CrossRef]
  25. Vinatha, U.; Pola, S.; Vittal, K.P. Simulation of Four Quadrant Operation & Speed Control of BLDC Motor on MATLAB/SIMULINK. In Proceedings of the TENCON 2008–2008 IEEE Region 10 Conference, Hyderabad, India, 19–21 November 2008. [Google Scholar] [CrossRef]
  26. Wu, H.; Zheng, L.; Li, Y.; Zhang, Z.; Yu, Y. Robust Control for Active Suspension of Hub-Driven Electric Vehicles Subject to in-Wheel Motor Magnetic Force Oscillation. Appl. Sci. 2020, 10, 3929. [Google Scholar] [CrossRef]
  27. Dodds, C.J.; Robson, J.D. The Description of Road Surface Roughness. J. Sound Vib. 1973, 31, 175–183. [Google Scholar] [CrossRef]
  28. Zhu, S.; Wang, L.; Zhang, N.; Du, H. H∞ Control of a Novel Low-Cost Roll-Plane Active Hydraulically Interconnected Suspension: An Experimental Investigation of Roll Control under Ground Excitation. SAE Int. J. Passeng. Cars-Mech. Syst. 2013, 6, 882–893. [Google Scholar] [CrossRef]
  29. Tan, D.; Lu, C. The Influence of the Magnetic Force Generated by the In-Wheel Motor on the Vertical and Lateral Coupling Dynamics of Electric Vehicles. IEEE Trans. Veh. Technol. 2016, 65, 4655–4668. [Google Scholar] [CrossRef]
  30. Do, A.L.; Sename, O.; Dugard, L.; Soualmi, B. Multi-Objective Optimization by Genetic Algorithms in H∞/LPV Control of Semi-Active Suspension. IFAC Proc. Vol. 2011, 44, 7162–7167. [Google Scholar] [CrossRef] [Green Version]
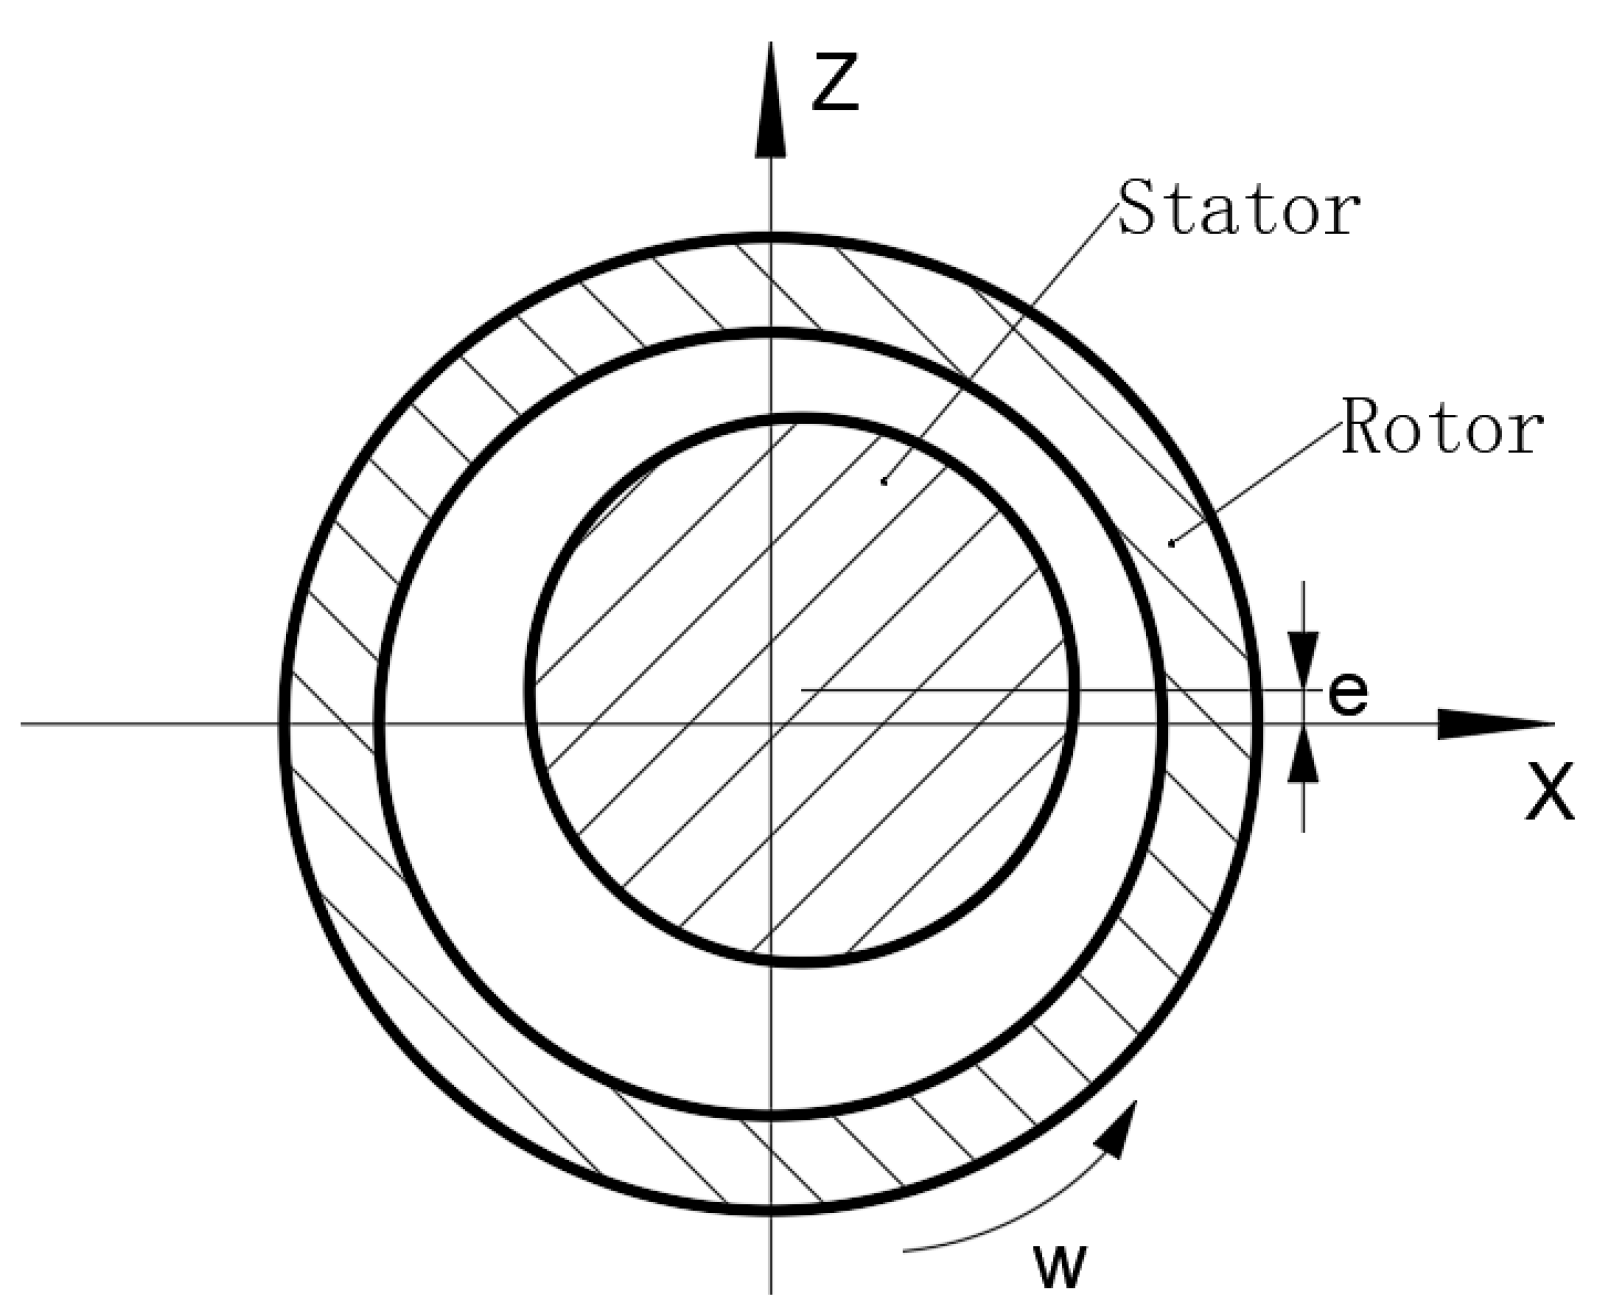
Figure 1. The eccentricity between the stator and rotor of the motor.
Energies 15 03916 g001
Figure 2. The eleven-degree-of-freedom vehicle model.
Energies 15 03916 g002
Figure 3. Test vehicle.
Energies 15 03916 g003
Figure 4. Air suspension.
Energies 15 03916 g004
Figure 5. Test road.
Energies 15 03916 g005
Figure 6. Comparison of the simulation and test at a speed of 30 km/h: (a) vertical acceleration of sprung mass at the front-left suspension; (b) vertical acceleration of the stator core at the front-left suspension.
Energies 15 03916 g006
Figure 7. Skyhook suspension control model (quarter vehicle).
Energies 15 03916 g007
Figure 8. Four-wheel random road excitation.
Energies 15 03916 g008
Figure 9. The comparison in time domain: (a) vertical acceleration of sprung mass; (b) eccentric distance of the front-left hub motor; (c) dynamic load of the front-left tire; (d) roll angular acceleration of sprung mass; (e) pitch angular acceleration of sprung mass.
Energies 15 03916 g009
Figure 10. The comparison in frequency domain: (a) vertical acceleration of sprung mass; (b) eccentric distance of the front-left hub motor; (c) dynamic load of the front-left tire; (d) roll angular acceleration of sprung mass; (e) pitch angular acceleration of sprung mass.
Energies 15 03916 g010
Figure 11. Four-wheel bump road excitation.
Energies 15 03916 g011
Figure 12. The comparison in time domain: (a) vertical acceleration of sprung mass; (b) eccentric distance of the front-left hub motor; (c) dynamic load of the front-left tire; (d) pitch angular acceleration of sprung mass.
Energies 15 03916 g012
Figure 13. The comparison in frequency domain: (a) vertical acceleration of sprung mass; (b) eccentric distance of the front-left hub motor; (c) dynamic load of the front-left tire; (d) pitch angular acceleration of sprung mass.
Energies 15 03916 g013aEnergies 15 03916 g013b
Table 1. Parameters of the HM-AS vehicle model.
ParameterValueParameterValue
m s   ( kg ) 710 m msi   ( kg ) 30.4
m ti   ( kg ) 34.4 d   ( m ) 1.55
l f   ( m ) 0.795 l r   ( m ) 0.975
I x   ( kg · m 2 ) 340 I y   ( kg · m 2 ) 910
k ti   ( N / m ) 260,000 k beai   ( N / m ) 5,000,000
c si   ( N · s / m ) 1767 k 1.4
A e   ( m 2 ) 0.007 V 0 i   ( m 3 ) 0.0024
P a   ( Pa ) 100,000 g   ( m / s 2 ) 9.8
Table 2. The root-mean-square values of the simulation and test.
Evaluation IndexSimulationTestRelative Error
z ¨ s 1   ( m / s 2 ) 0.6098 0.6866 11.19 %
z ¨ ms 1   ( m / s 2 ) 3.6335 3.3067 9.88 %
Table 3. The root-mean-square values of the evaluation indices and improvement rates.
Evaluation IndexUncontrolled
(RMS)
Skyhook
(RMS)
LQR without GA
(RMS)
LQR
(RMS)
z ¨ s   ( m / s 2 ) 1.0755 1.0363 ( 3.65 % ) 0.9652 ( 10.26 % ) 0.8533 ( 20.66 % )
e 1   ( m ) 1.4282 × 10 4 1.4453 × 10 4 ( 1.19 % ) 1.3800 × 10 4 ( 3.38 % ) 1.2598 × 10 4 ( 11.79 % )
e 2   ( m ) 1.3803 × 10 4 1.3937 × 10 4 ( 0.97 % ) 1.3309 × 10 4 ( 3.58 % ) 1.2165 × 10 4 ( 11.87 % )
e 3   ( m ) 1.3965 × 10 4 1.4302 × 10 4 ( 2.42 % ) 1.3737 × 10 4 ( 1.63 % ) 1.2780 × 10 4 ( 8.49 % )
e 4   ( m ) 1.3544 × 10 4 1.3805 × 10 4 ( 1.92 % ) 1.3328 × 10 4 ( 1.60 % ) 1.2520 × 10 4 ( 7.56 % )
F d 1   ( N ) 974.9738 1002.3197 ( 2.80 % ) 981.7208 ( 0.69 % ) 1009.0915 ( 3.50 % )
F d 2   ( N ) 958.6238 982.3319 ( 2.47 % ) 963.5110 ( 0.51 % ) 991.6134 ( 3.44 % )
F d 3   ( N ) 927.0863 946.1489 ( 2.06 % ) 951.9213 ( 2.68 % ) 987.6471 ( 6.53 % )
F d 4   ( N ) 917.3267 931.1189 ( 1.50 % ) 945.5256 ( 3.07 % ) 992.1608 ( 8.16 % )
φ ¨   ( rad / s 2 ) 1.7435 1.7178 ( 1.48 % ) 1.7838 ( 2.31 % ) 1.8358 ( 5.39 % )
θ ¨   ( rad / s 2 ) 0.7555 0.7508 ( 0.62 % ) 0.7022 ( 7.05 % ) 0.6544 ( 13.39 % )
” means improving, “ ” means deteriorating.
Table 4. The root-mean-square values of the evaluation indices and improvement rates.
Evaluation IndexUncontrolled
(RMS)
Skyhook
(RMS)
LQR without GA
(RMS)
LQR
(RMS)
z ¨ s   ( m / s 2 ) 1.1826 1.1789 ( 0.32 % ) 1.1237 ( 4.98 % ) 0.9266 ( 21.65 % )
e 1   ( m ) 1.0380 × 10 4 1.0108 × 10 4 ( 2.62 % ) 9.5080 × 10 5 ( 8.40 % ) 8.7936 × 10 5 ( 15.28 % )
e 2   ( m ) 1.0380 × 10 4 1.0108 × 10 4 ( 2.62 % ) 9.5080 × 10 5 ( 8.40 % ) 8.7936 × 10 5 ( 15.28 % )
e 3   ( m ) 1.0523 × 10 4 1.0204 × 10 4 ( 3.03 % ) 9.7054 × 10 5 ( 7.77 % ) 8.8847 × 10 5 ( 15.57 % )
e 4   ( m ) 1.0523 × 10 4 1.0204 × 10 4 ( 3.03 % ) 9.7054 × 10 5 ( 7.77 % ) 8.8847 × 10 5 ( 15.57 % )
F d 1   ( N ) 726.9732 750.7347 ( 2.92 % ) 743.9668 ( 2.34 % ) 786.1485 ( 8.14 % )
F d 2   ( N ) 726.9732 750.7347 ( 2.92 % ) 743.9668 ( 2.34 % ) 786.1485 ( 8.14 % )
F d 3   ( N ) 738.1623 712.5902 ( 3.46 % ) 765.4318 ( 3.69 % ) 794.3556 ( 7.61 % )
F d 4   ( N ) 738.1623 712.5902 ( 3.46 % ) 765.4318 ( 3.69 % ) 794.3556 ( 7.61 % )
φ ¨   ( rad / s 2 ) 0 0 0 0
θ ¨   ( rad / s 2 ) 0.8111 0.8091 ( 0.24 % ) 0.7443 ( 8.24 % ) 0.8048 ( 0.77 % )
” means improving, “ ” means deteriorating.
Publisher’s Note: MDPI stays neutral with regard to jurisdictional claims in published maps and institutional affiliations.