Article

Comprehensive Control Strategy Considering Hybrid Energy Storage for Primary Frequency Modulation

1
School of Electric Power, Civil Engineering and Architecture, Shanxi University, Taiyuan 030006, China
2
North China Electric Power Research Institute Co., Ltd., Beijing 100045, China
*
Author to whom correspondence should be addressed.
These authors contributed equally to this work.
Energies 2022, 15(11), 4079; https://doi.org/10.3390/en15114079
Submission received: 17 May 2022 / Revised: 30 May 2022 / Accepted: 31 May 2022 / Published: 1 June 2022

Abstract

:
The increase in the number of new energy sources connected to the grid has made it difficult for power systems to regulate frequencies. Although battery energy storage can alleviate this problem, battery cycle lives are short, so hybrid energy storage is introduced to assist grid frequency modulation. In this paper, a hybrid energy storage system composed of battery energy storage and super-capacitor energy storage systems was studied, and a comprehensive control strategy was proposed. Firstly, by setting the frequency dead zone of the energy storage to be smaller than that of the thermal power unit, the frequent action of the thermal power unit was avoided. Secondly, virtual inertial control and virtual droop control were effectively combined. Then, the state of charge of battery energy storage and super-capacitor energy storage was considered so that they could operate in harmony. Finally, a simulation model was built in MATLAB/SIMULINK, and case studies were conducted to verify the proposed control strategy. Results showed that the proposed control strategy could effectively reduce the frequency deviation of the power grid, and maintain the state of charge, reduce the number of operated batteries, and improve cycle life.

1. Introduction

With the intensification of the energy crisis, countries worldwide are accelerating the use of new energy, and the integration of new energy into the grid has led to huge developments [1]. A large proportion of new energy systems involves wind power and photovoltaics, which are volatile and random. Therefore, they create pressure on grid frequency modulation (GFM) [2]. However, energy storage systems with rapid response characteristics can be used as auxiliary means of GFM [3].
Sanduleac et al. [4] simulated the operation of battery storage and verified that battery storage can participate in the primary frequency modulation (PFM) of a power grid but did not investigate the control strategy. Cheng et al. [5] proved that the frequency regulation capacity of a battery energy storage system was 3.6 times that of thermal power units, but they ignored the climbing rate constraint related to thermal power units. Mu et al. [6] determined that a simple model of an energy storage system did not have a large impact on frequency modulation, so battery storage can be equated to a first-order inertial loop. However, the most important aspect of energy storage in GFM is the control strategy; advanced control strategies can more effectively enable an energy storage system to perform GFM and can also reduce the energy storage requirements and improve the economic benefits of an energy storage system [7]. Kottick et al. [8] used an energy storage battery to simulate the output of a traditional power unit. The results show that the virtual inertia control of an energy storage battery can significantly reduce the frequency deviation caused by instantaneous load fluctuations, but it cannot reduce steady-state frequency deviation. Almeida et al. [9] proposed the use of drooping control based on a constant drooping coefficient to reduce steady-state frequency deviation, but the state of charge (SOC) was not taken into account, which may have led to the overcharge and the over-discharge of the energy storage system. Knap et al. [10] proposed the use of drooping control based on a variable drooping coefficient with the SOC but could not reduce the rate of frequency descent. Yoon et al. [11], combining the control methods of the previous articles, proposed the use of a combination of virtual droop control (VDC) and virtual inertia control (VIC) to participate in the PFM of the power system, which could reduce the frequency change rate and steady-state frequency deviation, but the control strategy was relatively simple and the FM effect was not ideal. Zhang et al. [12] considered SOC recovery when the frequency is in the dead zone, but the frequency modulation phase and the recovery phase were found to be independent, and the limitation of the energy storage system state on SOC recovery were not fully considered, which likely caused the frequency to not be in the dead zone. Fang et al. [13] proposed the use of virtual negative inertia control during frequency recovery to prevent inertia control from hindering the system’s frequency recovery, but the problem of the dead zone in inertia control was not considered, which meant the frequency difference curve was not smooth. Yan et al. [14] calculated the operating life and annual average cost of energy storage batteries under different frequency regulation dead zones and SOCs on this basis, and the results are helpful when considering the participation of energy storage batteries in the auxiliary service market. However, the battery energy storage cycle life is short, which increases the operating cost.
The studies mentioned above used BES to participate in GFM, but energy storage batteries only have a small number of cycles, and the life of these batteries is greatly affected by high-frequency changes in a power grid. Nadeem et al. [15] analyzed the structure, performance, and characteristics of different energy storage systems and combined power-based energy storage and energy-based energy storage systems by exploiting their merits. Zhang et al. [16] proposed a power allocation strategy using BES and super-capacitor energy storage (SES) systems, but BES is preferred in the provision of transient power, which reduces its lifetime to some extent. Ibrahim et al. [17] used filter decomposition to divide unbalanced power into high and low frequencies—which are regulated by SES and BES systems, respectively—but this type of procedure may result in the BES or SES system not being able to take on the allocated unbalanced power and may cause some frequency deviations to not be adjusted. Santucci et al. [18] found optimal power split strategies for hybrid energy storage (HES) systems using the objective function, but the performance was not guaranteed when the actual load was different from the preset load.
As far as we know, all the control strategies of energy storage participating in the primary frequency regulation in the existing literature have disadvantages. Some methods use battery energy storage alone without taking into account its cycle life. Although some other methods use hybrid energy storage, the frequency modulation effect is not guaranteed. To tackle these problems, this paper analyzes the merits of BES and SES systems and then proposes a comprehensive control strategy for a HES system to participate in the PFM of a power grid. The comprehensive control strategy combines VIC, VDC and VNIC under different conditions. When the frequency deviation is greater than the set dead zone of frequency modulation, VDC is adopted during the entire period of frequency modulation. When the frequency deviation rate is greater than the dead zone of frequency deviation change rate, VIC is adopted. VIC is adopted during frequency deterioration, and VNIC is adopted during frequency recovery. The SES system is preferentially used for charging and discharging, and the BES system is used when SES is insufficient for FM. Finally, a comprehensive control strategy is simulated and verified under different disturbances, and the results show that the proposed control strategy has a good effect on the FM, that its comprehensive index is best, and that it can also reduce the number of operations of battery energy storage and improve cycle life.

2. PFM Control Model with HES

Firstly, we need to select the hybrid energy storage that participates in the primary frequency regulation of the power grid, and the selection of suitable energy storage can better assist the frequency regulation of the power grid. In this section, we select hybrid energy storage and build its inner mathematical models.

2.1. HES System

Energy storage systems can be divided into energy-type and power-type systems, and the performance of each energy storage system type is shown in Table 1.
It can be seen from the characteristics of different energy storage types in Table 1 that a single energy storage system cannot possess every advantageous characteristic. By choosing a power-type energy storage system and an energy-type energy storage system to form a hybrid energy storage system, the frequency regulation of a power grid can be more effectively realized. In this paper, lithium batteries and super-capacitors are chosen to form a HES system to participate in PFM after comprehensive consideration.

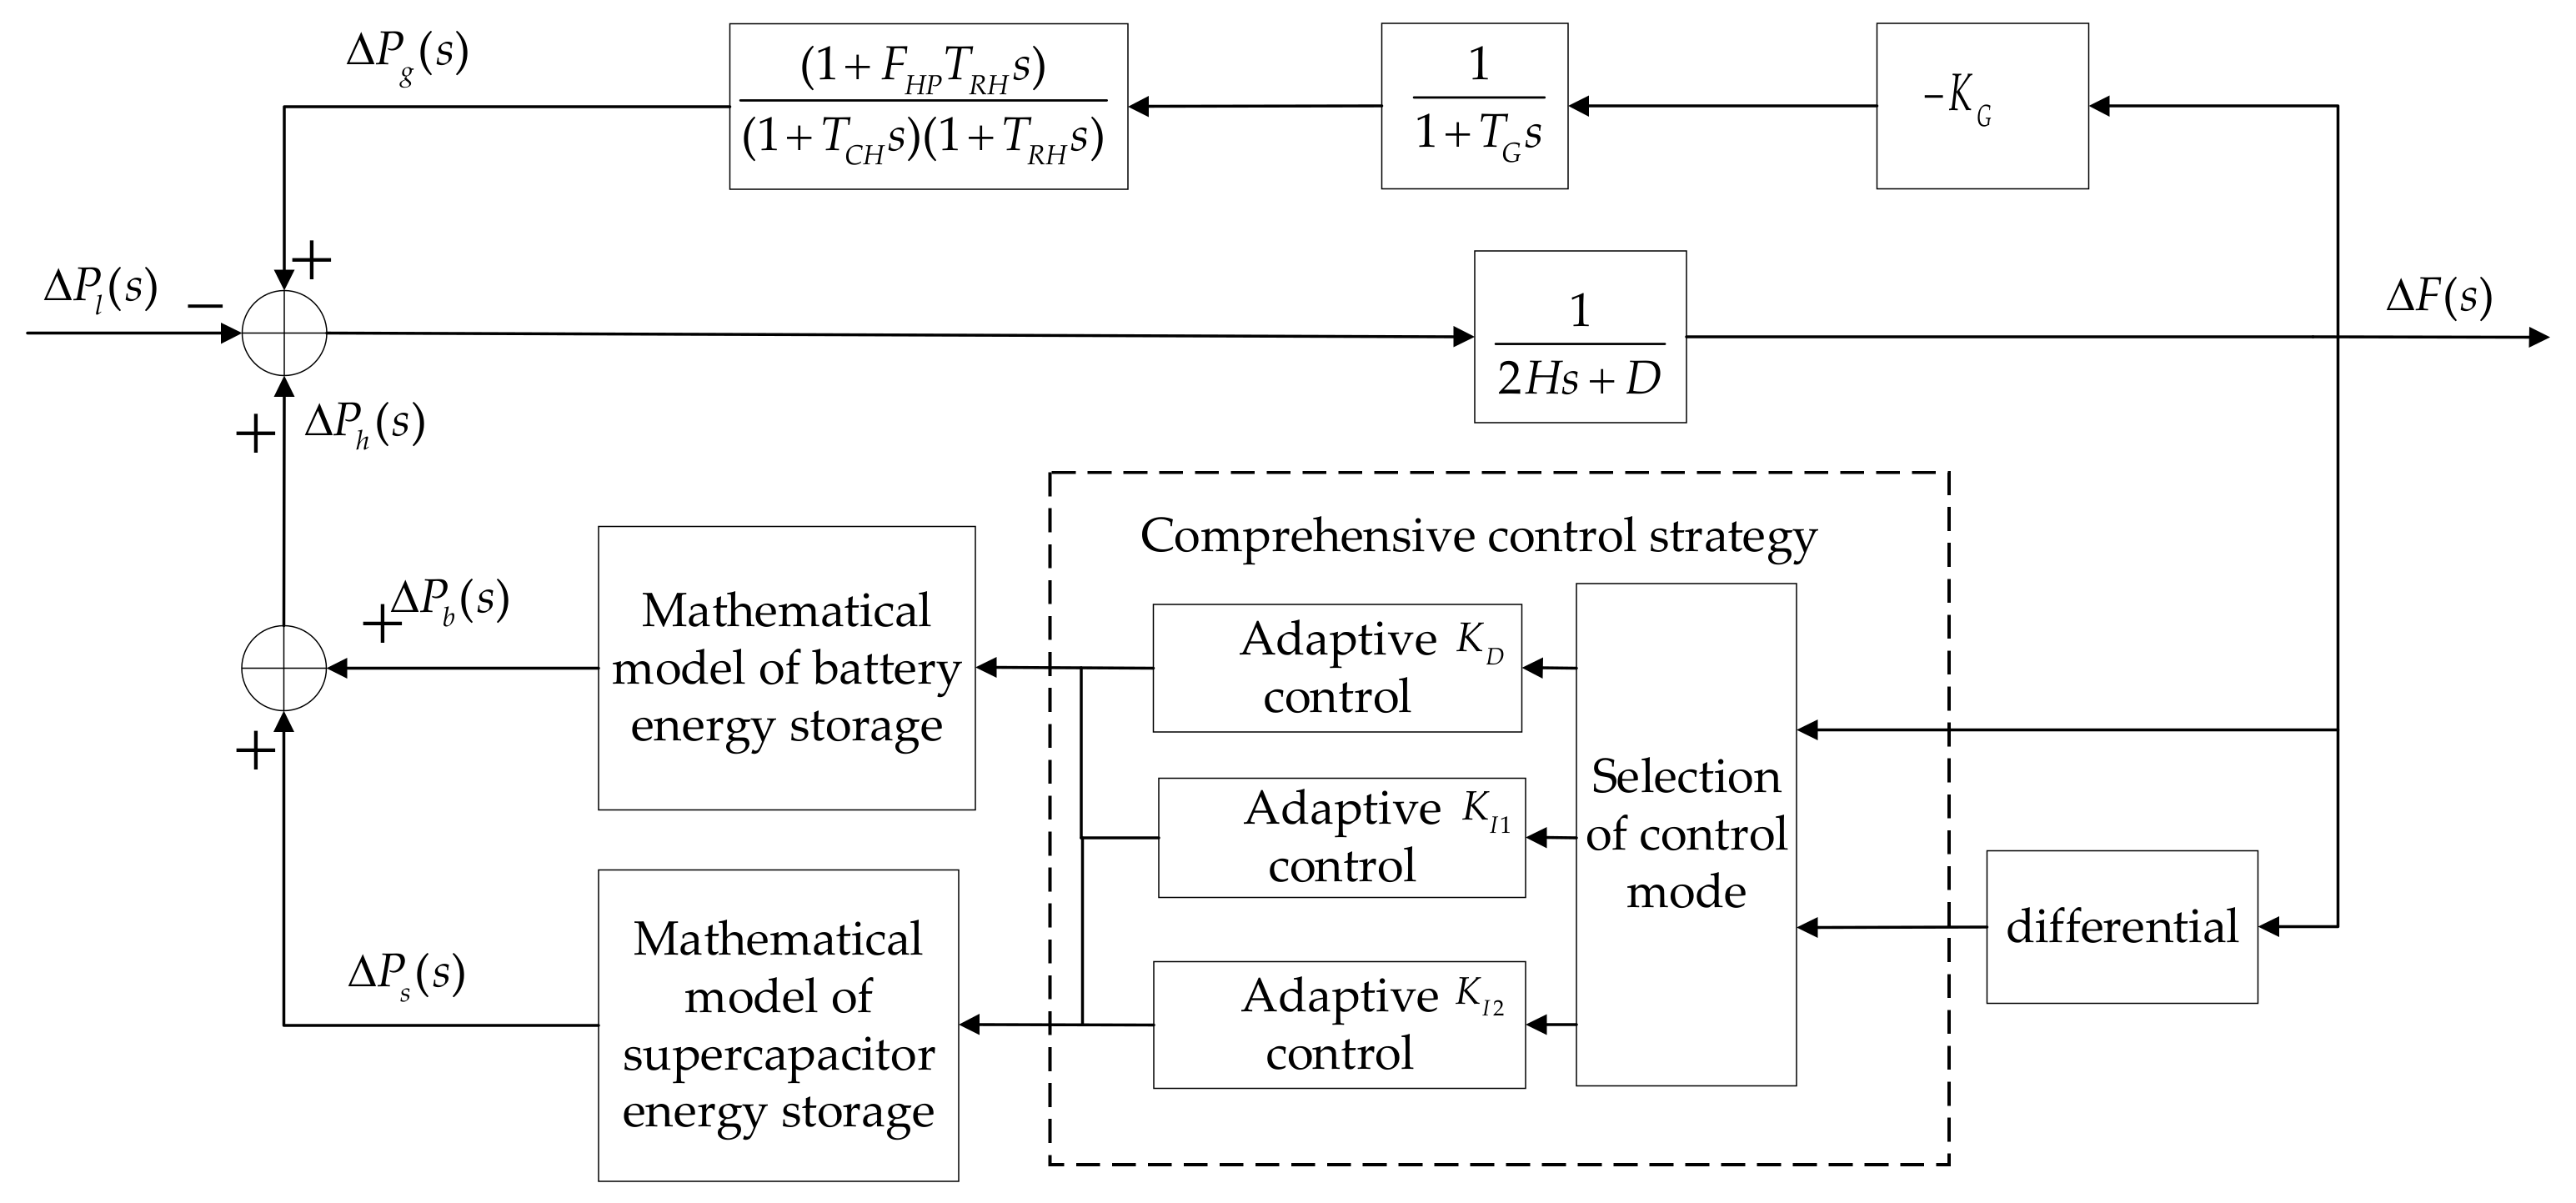
2.2. Regional Power Grid Frequency Modulation Model

Figure 1 shows a regional power grid frequency modulation model with HES participating in the PFM of a power grid. Here, s is the Rasch operator; Δ P L s is the load disturbance; Δ P G s is the output of the traditional FM unit; Δ P H s is the output of the HES; Δ F s is the frequency deviation of the regional power grid; F H P is the reheater gain; T R H , T C H , and T G are the reheater time constant, the turbine time constant, and the governor time constant for conventional FM units, respectively; K G is the droop coefficient of the traditional unit; H and D are the inertia time constant and the load damping coefficient for the grid, respectively; K I 1 , K D , and K I 2 are the virtual inertia coefficient, the virtual droop coefficient, and the virtual negative inertia coefficient, respectively.
The model in the figure can be analyzed as follows:
Δ P g s = K G G g s Δ F s
Δ P h s = Δ P b s + Δ P s s
Δ P g s + Δ P h s Δ P l s = 2 H s + D Δ F s
Here, Δ P b s and Δ P s s are the outputs of the BES and SES systems, respectively; G g s is the model of the traditional unit, and its mathematical expression is as follows:
G g s = 1 + F H P T R H s 1 + T C H s 1 + T R H s 1 + T G s

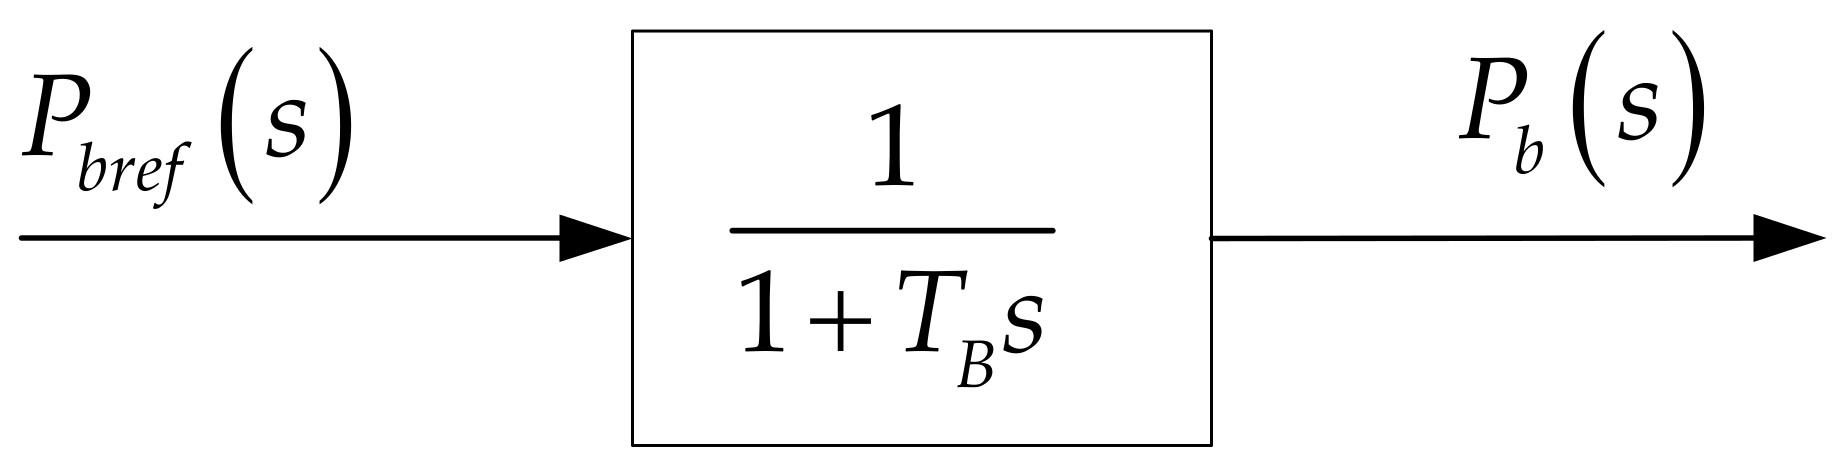
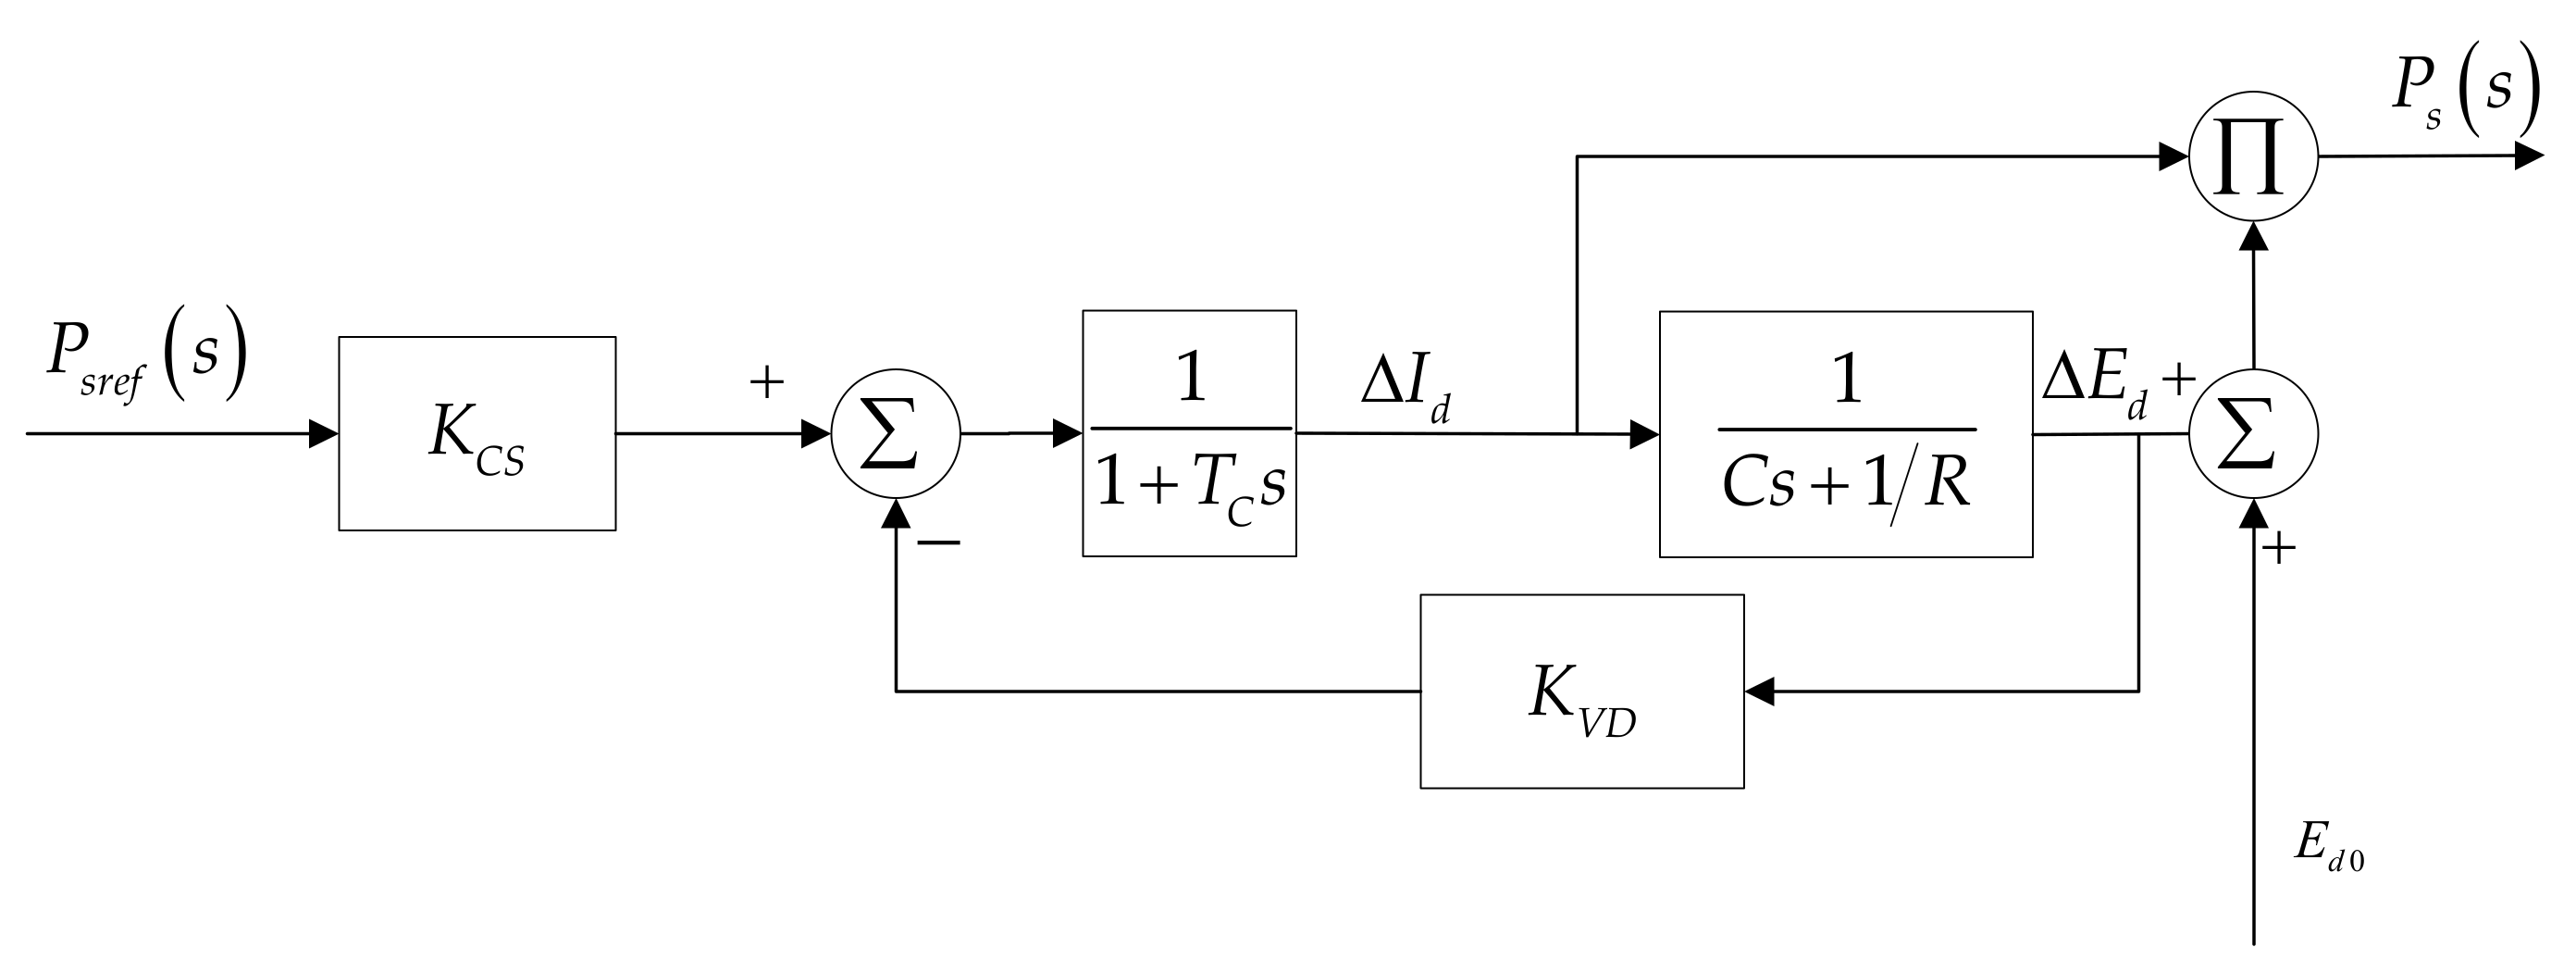
2.3. HES System Model

When a battery energy storage system participates in grid frequency regulation, its internal dynamic response process is mostly at the millisecond level, so it can be ignored. Therefore, the battery energy storage during frequency modulation is often equivalent to a first-order inertial loop, and its mathematical model involved in frequency modulation is shown in Figure 2.
Here, P b r e f s is the reference output value of BES. T B is the time constant in the first-order inertial link.
In the past, super-capacitors were often equated with parallel circuits of resistors and capacitors, but when considering the initial voltage of a capacitor, a voltage feedback loop was often introduced to quickly stabilize the voltage. The mathematical model is shown in Figure 3 [19].
Here, P s r e f s is the reference power output value of the super-capacitor storage energy; Δ I d and Δ E d are the current variation and voltage variation, respectively; E d 0 is the initial voltage of the super-capacitor; K C S and K V D are the power control gain and voltage control gain, respectively; T C is the time constant; R and C are the equivalent resistance and capacitance, respectively.
The following equations can be obtained from Figure 3.
Δ I d = 1 1 + T C s K C S P s r e f s K V D Δ E d
Δ E d = R 1 + R C s Δ I d
P s s = Δ E d + E d 0 Δ I d

3. Control Strategy of Energy Storage System Participating in PFM

The common control methods to enable energy storage to participate in power GFM are VIC, VDC, and VNIC. It is of practical value to study the effect of these methods on power systems. In this paper, a comprehensive control strategy based on frequency deviation and SOC is proposed which combines VIC, VDC, and VNIC to improve the performance of three control methods.

3.1. VDC

The VDC strategy involves adjusting the active power output of the energy storage system by simulating the traditional unit according to the deviation between the grid frequency and the rated frequency, which can effectively change the steady-state value of the frequency deviation [20]. The expression of VDC is as follows:
Δ P D = K D Δ f , Δ f f d 0 ,   Δ f < f d  
Here, K D is the virtual droop coefficient; Δ f is the frequency deviation value; and f d is the FM dead zone of VDC. If the absolute value of the frequency deviation exceeds the dead zone, VDC is adopted.
The drooping control based on the fixed maximum droop coefficient during the entire FM period can achieve a better FM effect at the beginning of the disturbance, but the energy storage system can easily be overcharged and over-discharged. Thus, it is not conducive to the entire FM process. Therefore, the virtual droop coefficient can be adaptively changed according to the SOC of the energy storage system. If the SOC is good, the energy storage system is charged and discharged with the largest droop coefficient, and if the SOC is poor, the droop coefficient is reduced to prevent the overcharge and over-discharge of the energy storage system and to reduce the loss of life. Here, we show an example of super-capacitor energy storage; the state of charge is divided into five intervals. S O C max is the upper limit of the SOC; S O C h i g h is the high value of the SOC; S O C l o w is the low value of the SOC; and S O C min is the lower limit of the SOC. The virtual droop coefficient is determined by the value of the SOC and the charge and discharge condition of the energy storage system. If Δ f is negative or positive, the virtual droop coefficient is the discharge droop coefficient or the charging droop coefficient, respectively. The formula is as follows:
K D = K d , Δ f < 0 K c , Δ f > 0

3.1.1. The Charging Process of a Super-Capacitor

(1)
When S O C S O C h i g h
K c = K max ,
where K max is the maximum droop coefficient.
(2)
When S O C h i g h < S O C S O C max
K c = S O C max S O C S O C max S O C h i g h K max ,
(3)
When S O C max < S O C 1
K c = 0 .

3.1.2. The Discharging Process of a Super-Capacitor

(1)
When S O C l o w < S O C 1
K d = K max ,
(2)
When S O C min < S O C S O C l o w
K d = S O C S O C min S O C l o w S O C min K max ,
(3)
When S O C S O C min
K d = 0 .
The droop coefficient changes in the super-capacitor charge and discharge processes are shown in Figure 4.

3.2. VIC

VIC refers to the use of an energy storage system to approximate the inertial response process of a traditional unit. By increasing the system damping, the frequency change rate during sudden system failures is slowed down, and the system stability is enhanced. However, VIC cannot change the steady-state value of the frequency deviation [20]. The expression of VIC is as follows:
Δ P I P = K I P d Δ f / d t , d Δ f / d t d f d 0 , d Δ f / d t < d f d
Here, d Δ f / d t is the change rate of frequency; d f d is the dead zone of VIC. If the change rate of frequency deviation exceeds the dead zone, VIC is adopted; K I P is the virtual inertia coefficient. The formula is as follows:
K I P = α K c , d Δ f / d t d f d α K d , d Δ f / d t < d f d

3.3. VNIC

VIC can suppress frequency change, which is beneficial to a system during frequency deterioration and harmful to a system during frequency recovery. Therefore, this paper adopts VNIC, the principle of which is similar to VIC, but the output of VNIC is opposite to that of VIC [13]. The mathematical expression of VNIC is as follows:
Δ P I N = K I N d Δ f / d t , d Δ f / d t d f d 0 , d Δ f / d t < d f d
Here, d Δ f / d t is the frequency change rate; d f d is the dead zone of VNIC. If the change rate of frequency deviation exceeds the dead zone, VNIC is adopted. K I N is the virtual negative inertia coefficient, and its change is as follows:
K I N = α K d , d Δ f / d t d f d α K c , d Δ f / d t < d f d

4. Comprehensive Control Strategy and Frequency Modulation Evaluation Index of Energy Storage System Participating in PFM

In the analysis of the classic control methods presented above, the timing and depth of frequency modulation achieved using various methods are different, and only a battery energy storage system is used. This cannot achieve a positive effect of frequency modulation, and the life of the battery energy storage is relatively short. Therefore, this section proposes that a hybrid energy storage system should participate in frequency modulation. Firstly, the dead zone of energy storage participation in power grid frequency regulation is analyzed. Then, the comprehensive control strategy is analyzed. Finally, the strategy must be verified according to the example, so this section selects the appropriate frequency modulation evaluation index.

4.1. Analysis of Energy Storage System Participating in the Frequency Modulation Dead Zone

Some studies in the literature set the FM dead zone of energy storage as the FM dead zone of the unit [21]. If the frequency deviation is greater than the FM dead zone, the energy storage system and the traditional unit start to participate in FM at the same time. It is difficult for energy storage to exert its rapid power throughput, and it will not reduce the action time of the traditional unit and is not conducive to the long-term use of the traditional unit. In this paper, the FM dead zone of energy storage is set to be smaller than the FM dead zone of the traditional unit. However, if the dead zone of energy storage is set too small, this will lead to frequent actions of the energy storage system and damage the life of the system. Therefore, in order to select the appropriate dead zone, in this paper, the FM dead zone of energy storage is set to 100, 80, 60, 40, and 20% of the FM dead zone of the unit, and the frequency deviation of the comprehensive control strategy proposed in this paper is observed for 3 min of continuous load disturbance.

4.2. Selection Strategy of Different Energy Storage

The charging and discharging times of a super-capacitor energy storage (SES) system are much higher than those of BES systems. Therefore, if the frequency deviation is greater than the FM dead zone, the SES acts first. Then, the charging and discharging times in the BES system will be reduced, and the life of the BES system will be extended. SOC1 and SOC2 represent the SOC of SES and BES. S O C max is the upper limit, S O C h i g h is the high value, S O C l o w is the low value, and S O C min is the lower limit. SOC is divided into five intervals. The selection strategy for energy storage is shown in Figure 5, which is illustrated here by taking the discharging process ( Δ f < 0 ) of energy storage as an example.
(1)
When S O C 1 S O C 1 l o w , then the SES system alone is activated.
(2)
When S O C 1 min S O C 1 < S O C 1 l o w and S O C 2 S O C 2 min , then the SES and BES systems are both activated.
(3)
When S O C 1 min S O C 1 < S O C 1 l o w and S O C 2 < S O C 2 min , then the SES system alone is activated.
(4)
When S O C 1 < S O C 1 min and S O C 2 S O C 2 min , then the BES system alone is activated.
(5)
When S O C 1 < S O C 1 min and S O C 2 < S O C 2 min , then the SES and BES systems are both not activated.
The charging process ( Δ f > 0 ) of energy storage is similar to the process described above. Therefore, it is not discussed here.

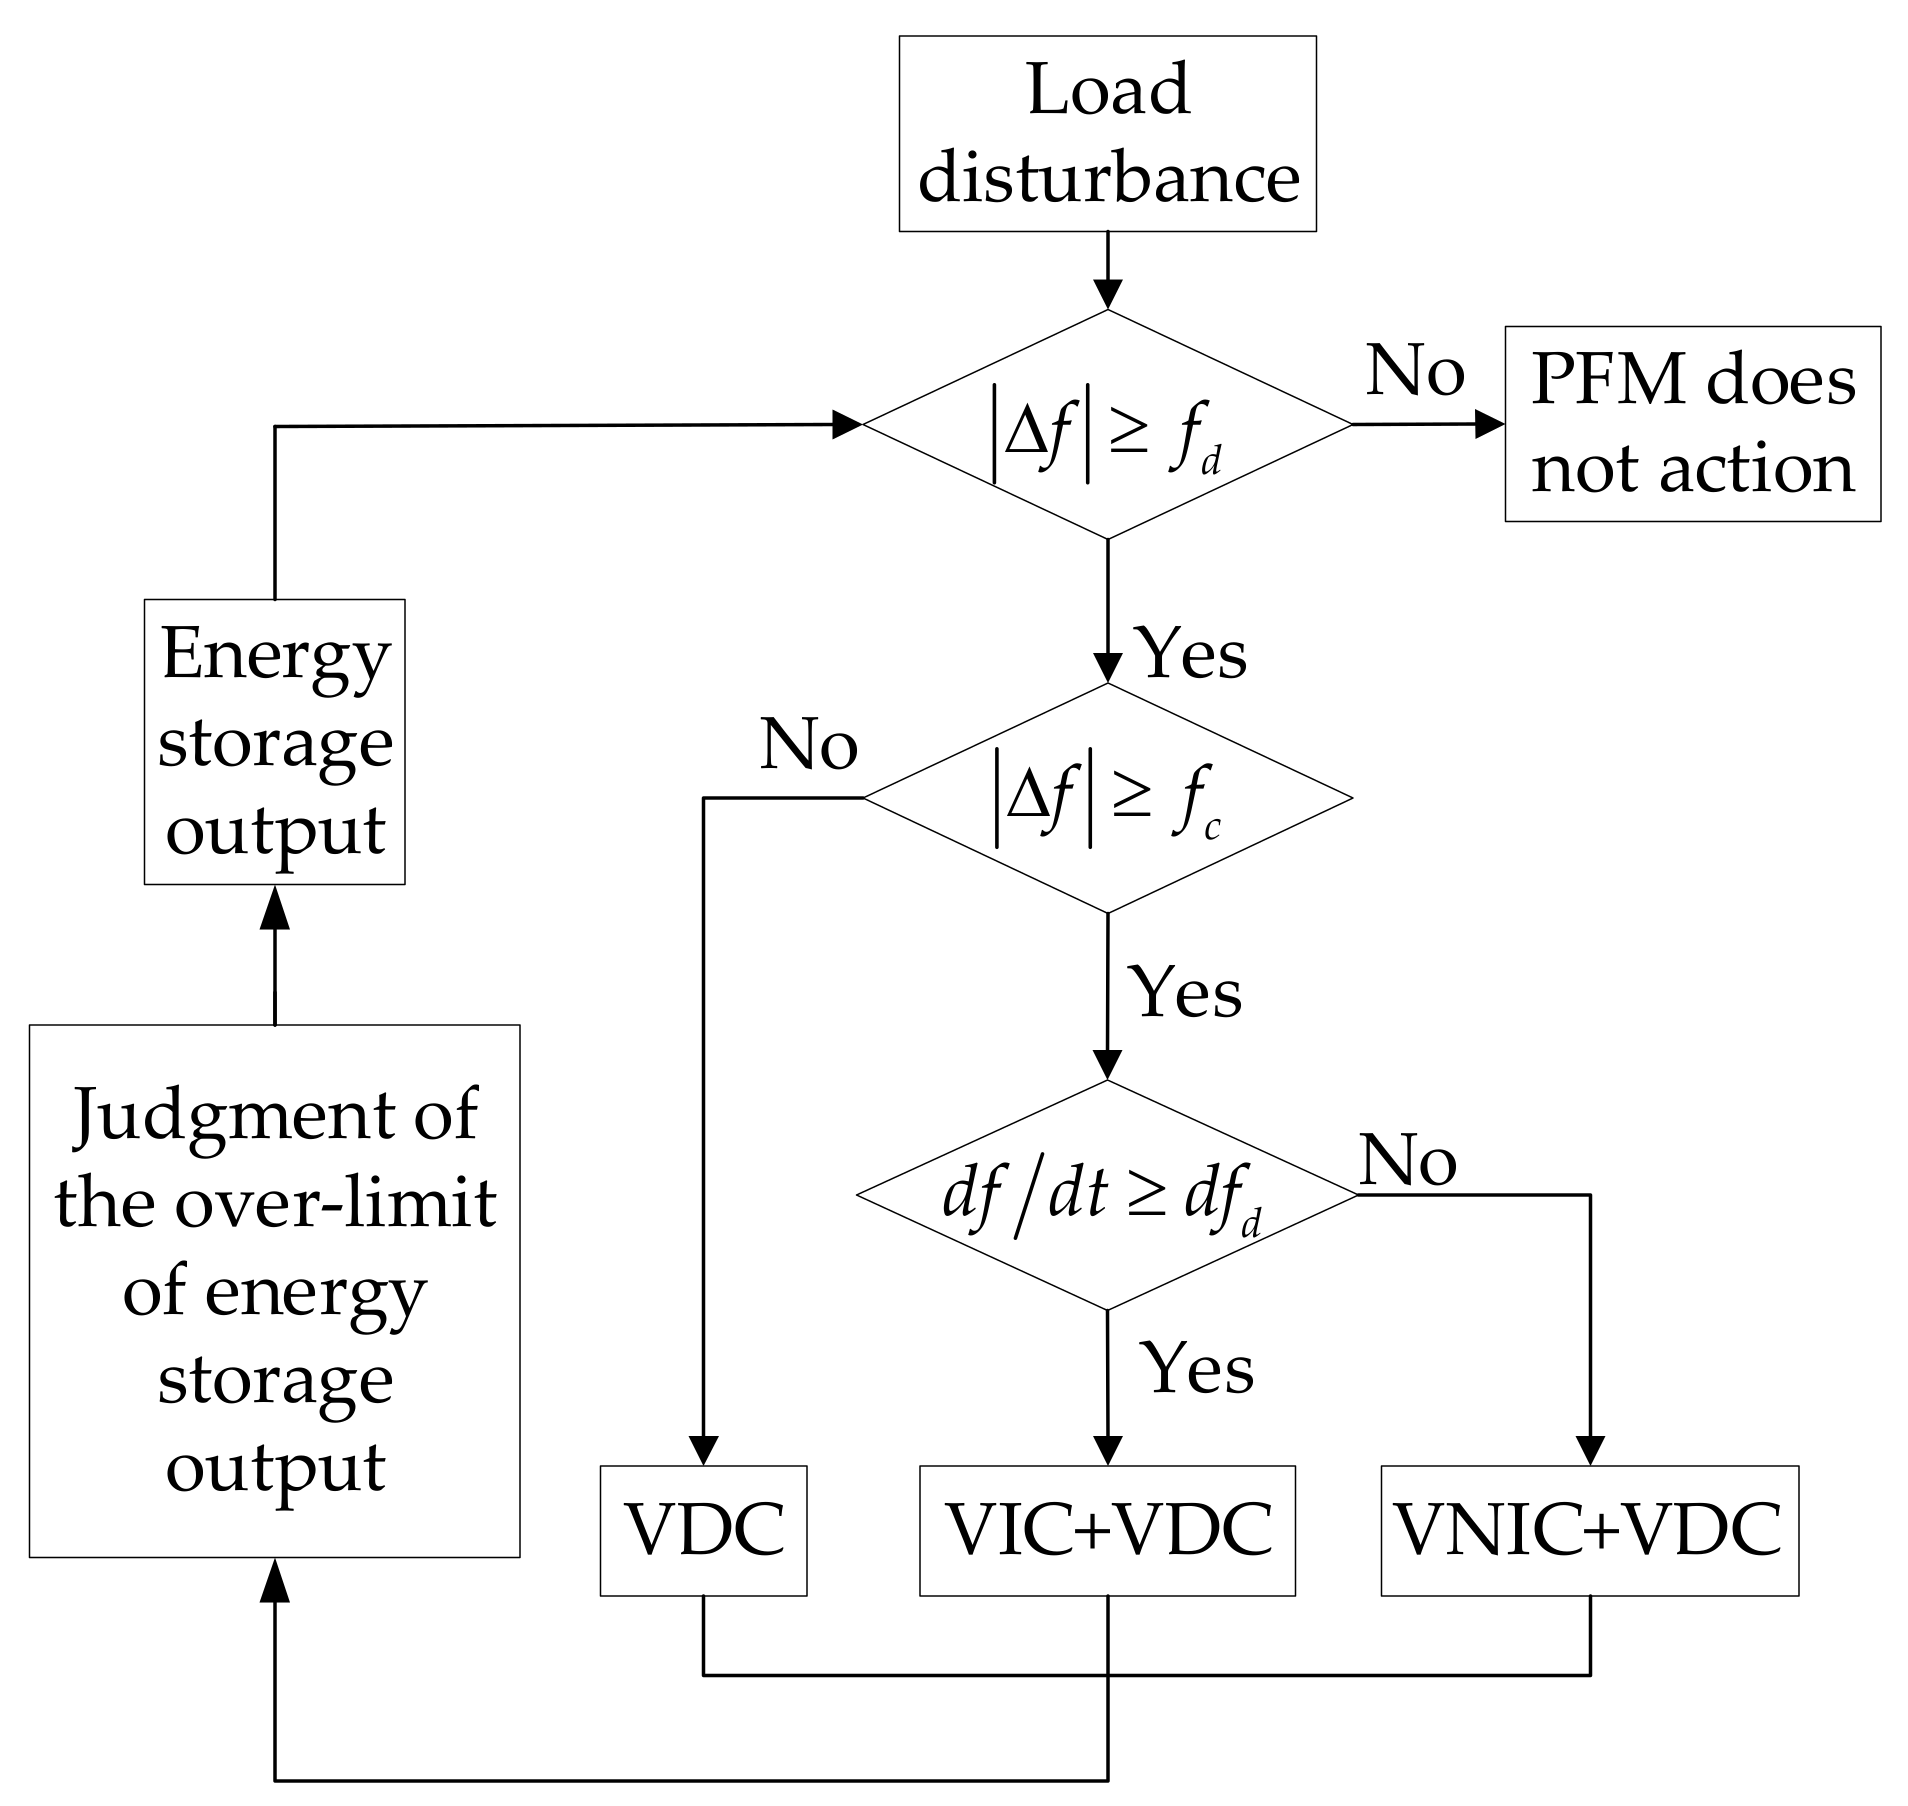
4.3. Selection Strategy of Control Mode

The selection strategy for the control mode is shown in Figure 6, which is illustrated here by taking the discharging process ( Δ f < 0 ) of energy storage as an example.
(1)
When f d < f < 0 , the frequency deviation is small. The energy storage system does not participate in the FM at this time to prevent the frequent charging and discharging of energy storage.
(2)
When f c < f f d , the frequency deviation is larger than the FM dead zone, but it is smaller than the virtual inertia value. If VIC is used, the virtual inertia output may be larger, or energy storage will overshoot due to the sudden increase in the frequency deviation rate. Therefore, this interval only adopts VDC.
(3)
When f f c and d f d f d , the frequency deviation is very large and the frequency deviation rate is positive and exceeds the dead zone of frequency deviation rate. Therefore, the combination of VIC and VDC is adopted.
(4)
When f f c and d f d f d , the frequency deviation is very large, the frequency deviation rate is negative and its absolute value exceeds the dead zone of frequency deviation rate. Therefore, the combination of VNIC and VDC is adopted.
(5)
When the power output of an energy storage system exceeds the upper limit and the rated power, the power output is set at the rated power.

4.4. Evaluation Index of Energy Storage System Participates in the FM

Load disturbances are divided into step load disturbance and continuous load disturbance in power grid operation. Step load disturbance refers to the start and end of large-capacity motors, and continuous load disturbance refers to a load which changes with time. To verify the effectiveness of the proposed control strategy in this paper, two types of evaluation indexes are proposed according to the type of load disturbance.

4.4.1. Step Load Disturbance

For step load disturbance, the effectiveness of the control strategy is illustrated by comparing the maximum frequency deviation Δ f max , the time t s to reach the steady state, and the frequency deviation Δ f s of the steady state. The smaller the Δ f max , the larger the disturbance the power grid can withstand. The smaller the t s , the faster the FM response and the better the stability of the power grid. The smaller the Δ f s , the more conducive it is to secondary FM. This indicates that the control strategy is more effective. Several FM evaluation indicators are as small as possible, but individual comparison may be biased. In order to compare the comprehensive effect more intuitively, an indicator I is defined by the empowerment method to quantitatively compare Δ f max , t s , and Δ f s . The maximum frequency deviation in the PFM process can reflect the disturbance the power grid can withstand; the smaller the maximum frequency deviation, the larger the disturbance. Therefore, the weights of Δ f max and Δ f s are set to 40%, and the weight of t s is set to 20%. The formula is as follows:
I = 0.4 × 10000 × Δ f max + Δ f s + 0.2 × t s
Here, the maximum frequency deviation Δ f max and steady-state frequency deviation Δ f s are increased by 10,000 times. Therefore, their magnitudes are the same as t s .

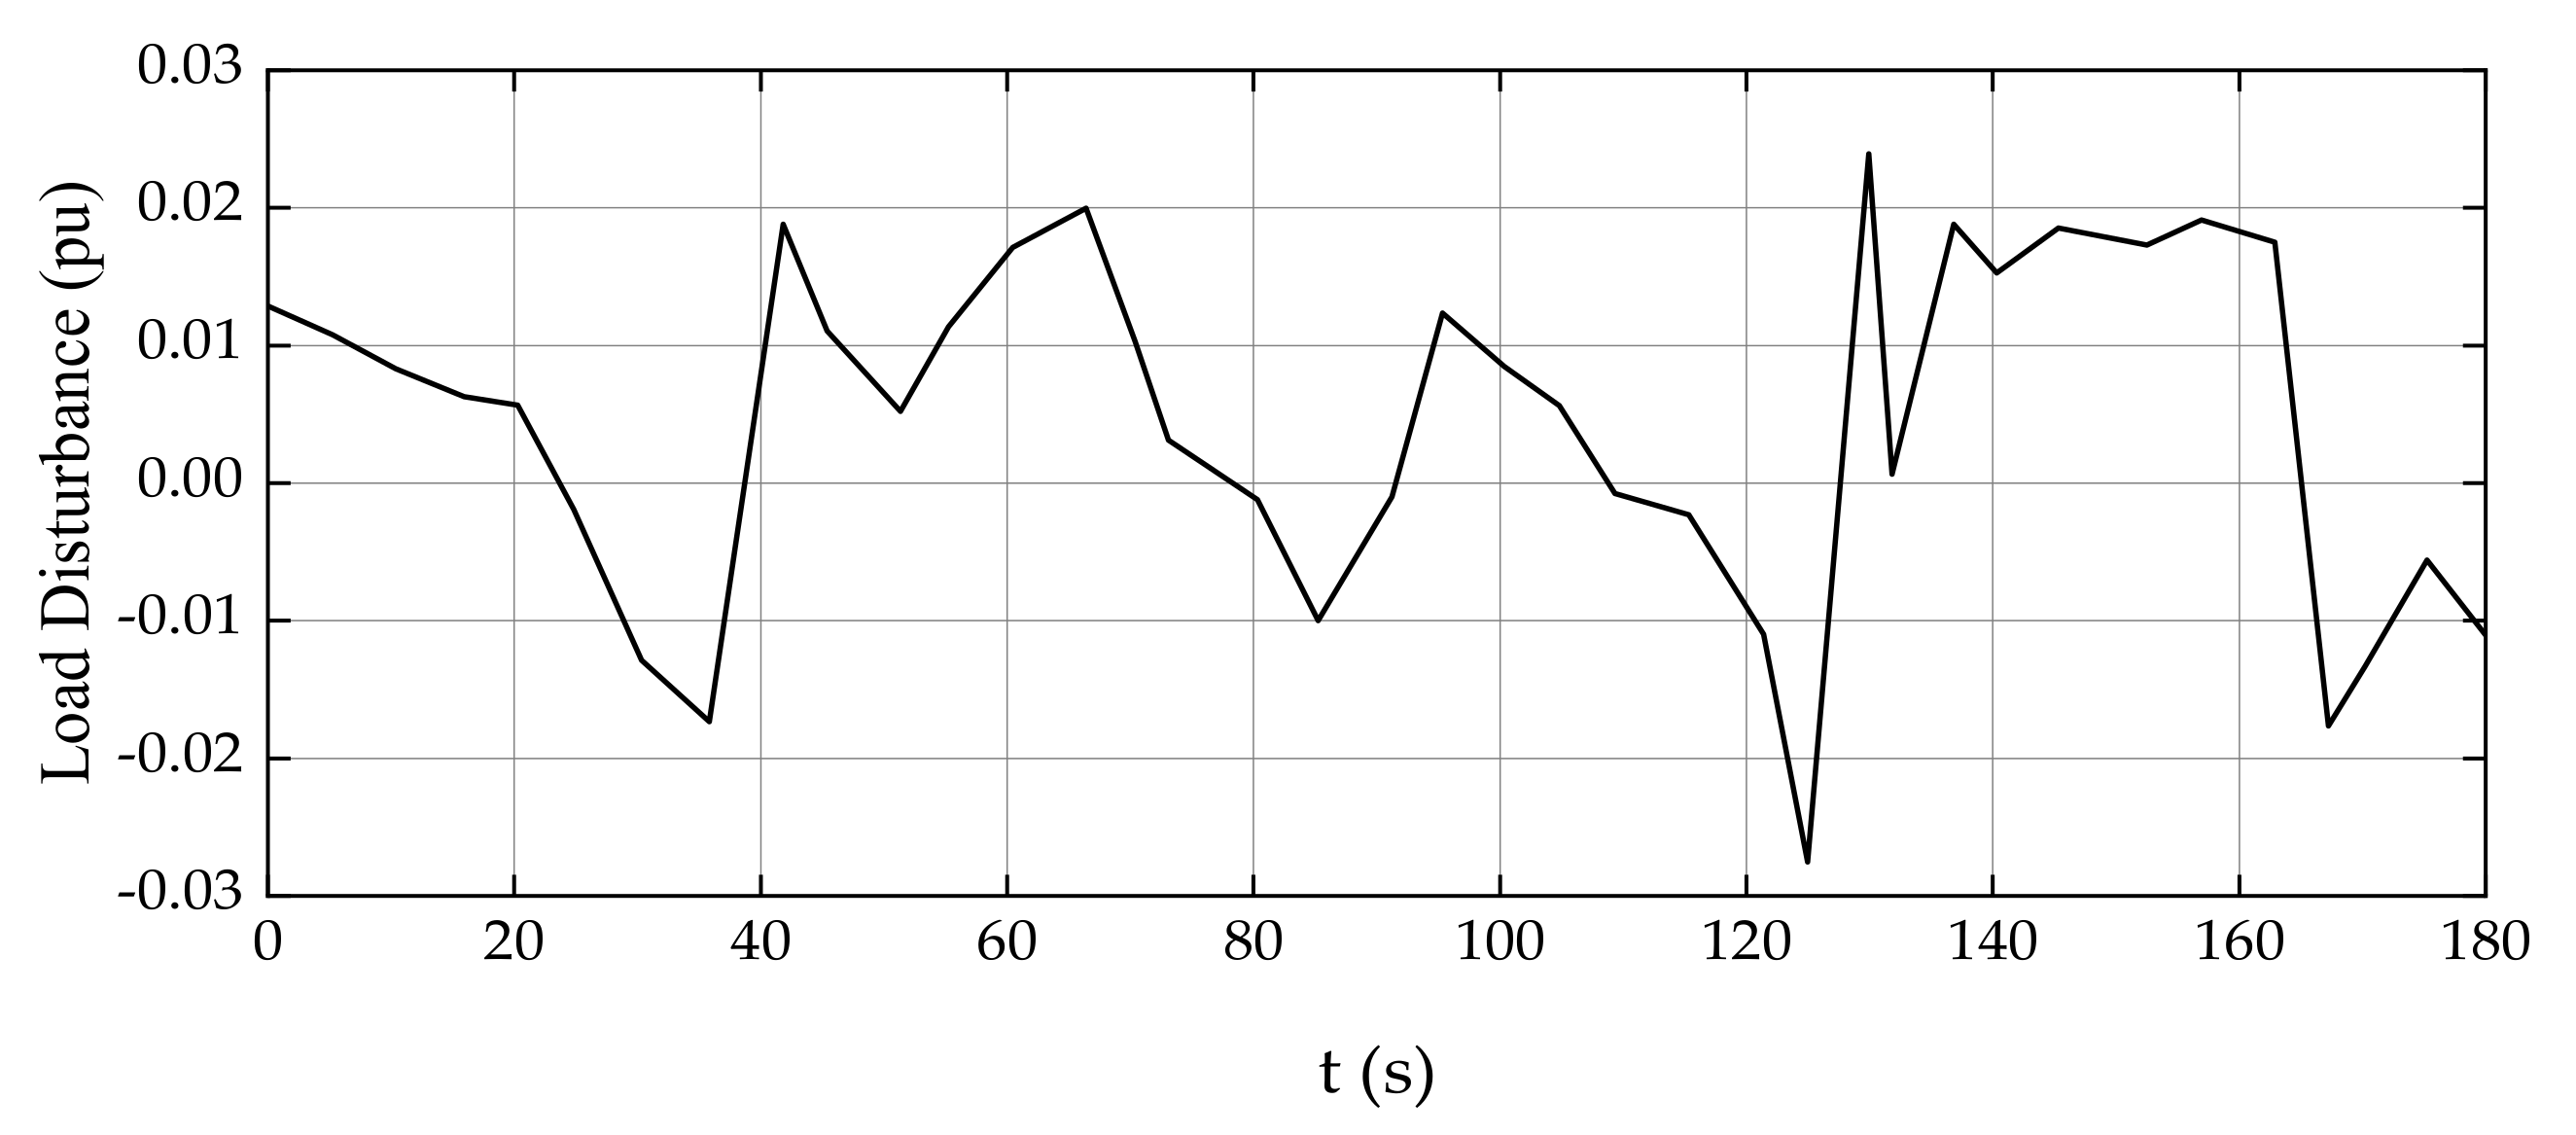
4.4.2. Continuous Load Disturbance

For continuous load disturbance, the root mean square value of frequency deviation and the SOC deviation are generally used as the evaluation indexes. The former reflects the degree of frequency deviation. The smaller the root mean square value of frequency deviation, the better the effect of FM. The latter reflects the retention effect of SOC. The smaller the root mean square value of SOC deviation, the better the retention effect of SOC and the more feasible it is for use in the control strategy. The formula is as follows:
Δ f r m s = 1 N i = 1 N f i f 0 2
S O C r m s = 1 N i = 1 N S O C i S O C 0 2
Here, N is the total number of sample points, f i is the frequency at sample point i , f 0 is the rated frequency (50 Hz), S O C i is the SOC at the sample point i , and S O C 0 is the initial SOC. One of the purposes of using a HES system is to reduce the charging and discharging times of the BES system. Therefore, the switch time A for the charging and discharging of the BES system is also used as an evaluation index.
To select the appropriate FM dead zone of energy storage, the proposed comprehensive control strategy is added to the 3-min continuous load disturbance, and the FM dead zone of energy storage is set to 100, 80, 60, 40, and 20% of the unit. In order to observe the frequency deviation, the evaluation index still uses the root mean square value of the frequency deviation.

5. Simulation Analysis

In order to illustrate the effectiveness of the proposed comprehensive control strategy, we built a regional GFM simulation model in MATLAB/SIMULINK, as shown in Figure 1. The rated power of the unit is set to 100 MW, other parameters are standardized by the rated power of the unit, and rated frequency (50 Hz) is the reference value. In Figure 1, F H P = 0.5, T R H = 10 s, T C H = 0.3 s, T G = 0.08 s, H = 5 and D = 1. The rated parameter of the BES system is 3.5 MW/1 MW·h. The rated parameter of the SES system is 10 MW/0.1 MW·h. The sampling period of the data is 5 s, and since the transfer function is used to simulate the energy storage to participate in the frequency regulation of the grid, the operation time of the energy storage is in the millisecond level, which makes the simulation results completely credible.

5.1. Simulation of Energy Storage under Different FM Dead Zones

The continuous load disturbance is shown in Figure 7, and in this paper, the control strategy adopts the comprehensive control strategy to observe the frequency deviation. The frequency deviations under different FM dead zones are shown in Figure 8, and the FM evaluation index is shown in Table 2.
It can be seen from Figure 8 that when the dead zone of energy storage is set to 100% or 80% of the dead zone of the unit, the effect of FM is relatively poor. The effect is best at 20%, followed by 40 and 60%, but in some intervals, the FM effects shown at 20, 40, and 60% are the same. It can also be seen from Table 2 that from 60 to 40%, the root mean square value of the frequency deviation decreases. Therefore, considering that under the premise of fully utilizing the fast power throughput capacity of an energy storage system, the FM dead zone of energy storage cannot be set too small; it is most appropriate to set the FM dead zone of energy storage at 60% of the dead zone of the unit.

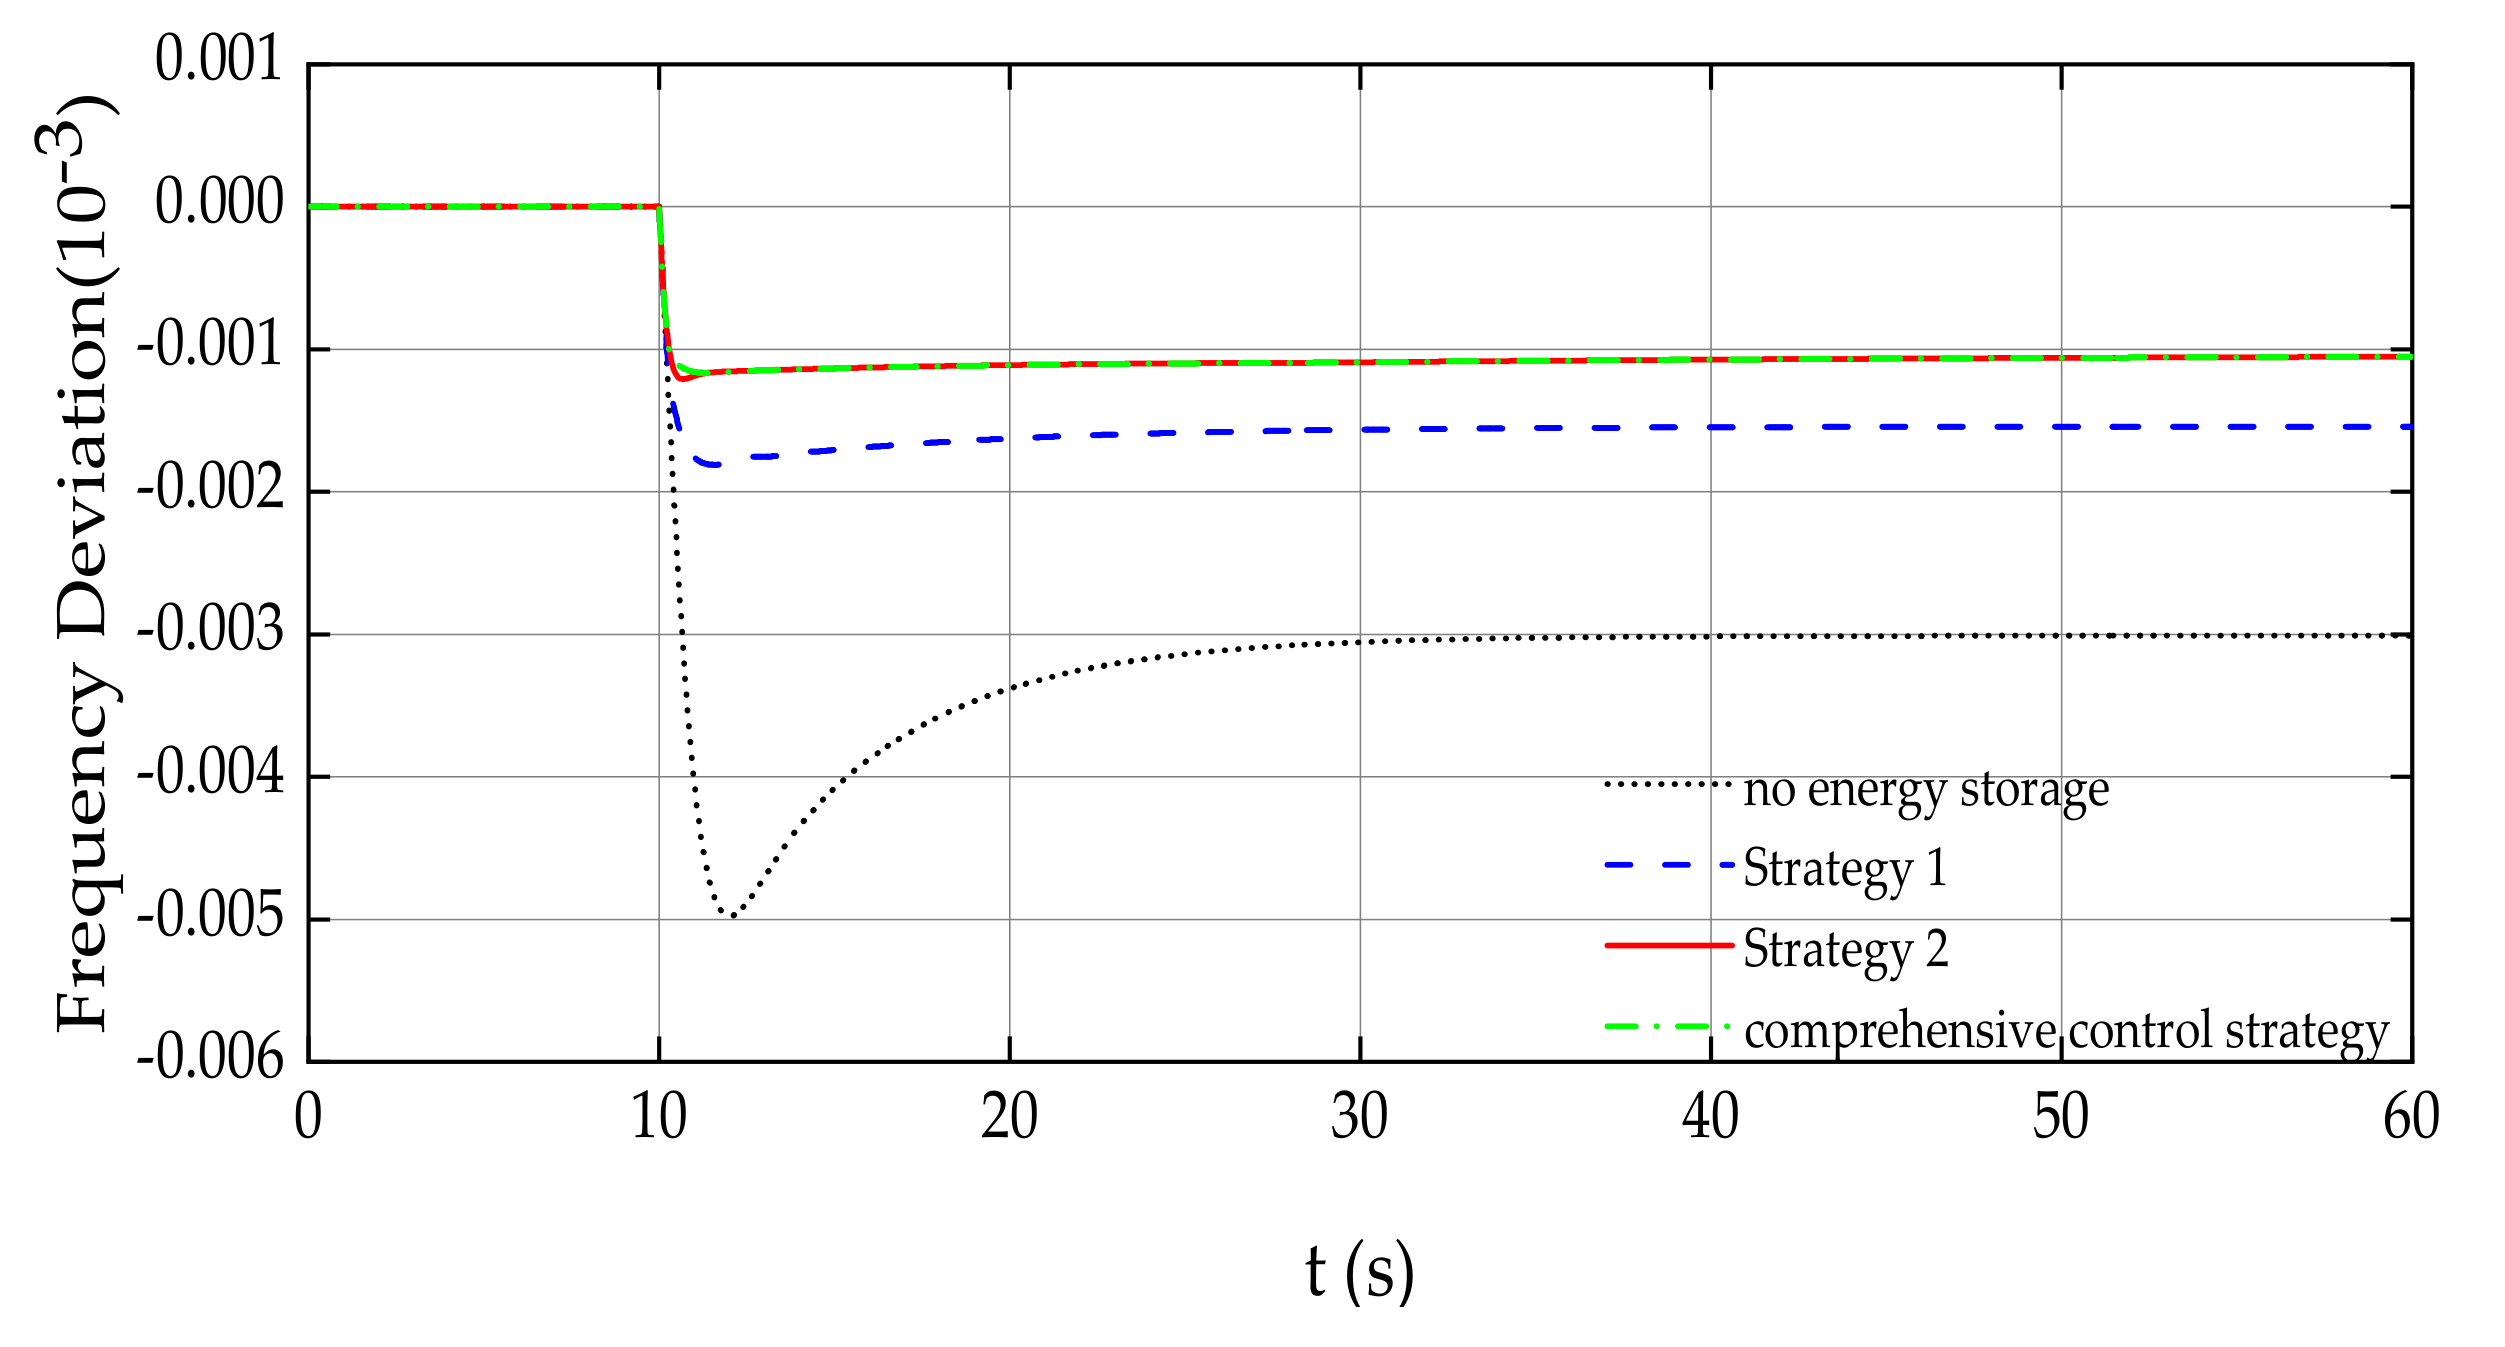
5.2. Step Load Disturbance

Step disturbance corresponds to the start or stop of large-capacity motor, which will cause power imbalance in the power grid, so we must first verify the effectiveness of the control strategy under step disturbance. The amplitude of the step load disturbance is 0.05. The comprehensive control strategy proposed in this paper compares the control strategy with no energy storage; the combination of VIC, VDC, and VNIC for the BES system (referred to as “strategy 1”); and the VDC for the HES system (referred to as “strategy 2”). Strategy 1 compared to no energy storage participation illustrates the superiority of battery energy storage using VIC, VDC, and VNIC; strategy 2 increases supercapacitor energy storage, but only uses VDC, so the frequency modulation effect is not ideal. A comprehensive control strategy is proposed in this paper. These methods were compared to show the advantages of comprehensive control strategy, which was proposed in this paper The simulation results for the frequency deviation and the SOC are shown in Figure 9 and Figure 10, and the evaluation indexes are shown in Table 3.
Figure 9 shows that the frequency decreases linearly under various control strategies in the early stage of load disturbance, and the frequency decreases the most and its rate is the largest when there is no energy storage and the steady-state frequency deviation is also the largest. For the maximum frequency deviation, the change rates of frequency deviation, and the steady-state frequency deviation, strategy 1 and strategy 2 are significantly reduced, but strategy 2 is more reduced. This shows that the super-capacitor has superiority in terms of response time and power density. Compared with strategy 2, the frequency decline rate and maximum frequency deviation are reduced, which indicates the effectiveness of the proposed comprehensive control strategy.
According to Figure 10, if the BES system is used alone, the SOC of the BES system decreases significantly when there is a load disturbance. If the HES system is used, the SOC of the BES system remains unchanged because only the super-capacitor functions at the beginning of the step load disturbance. If the disturbance is small, the BES system will not function, and the charge and discharge frequency of the BES system will be reduced, which can prolong life. However, in terms of the maintenance of the SOC, the proposed comprehensive control strategy has displays improvement compared to strategy 2.

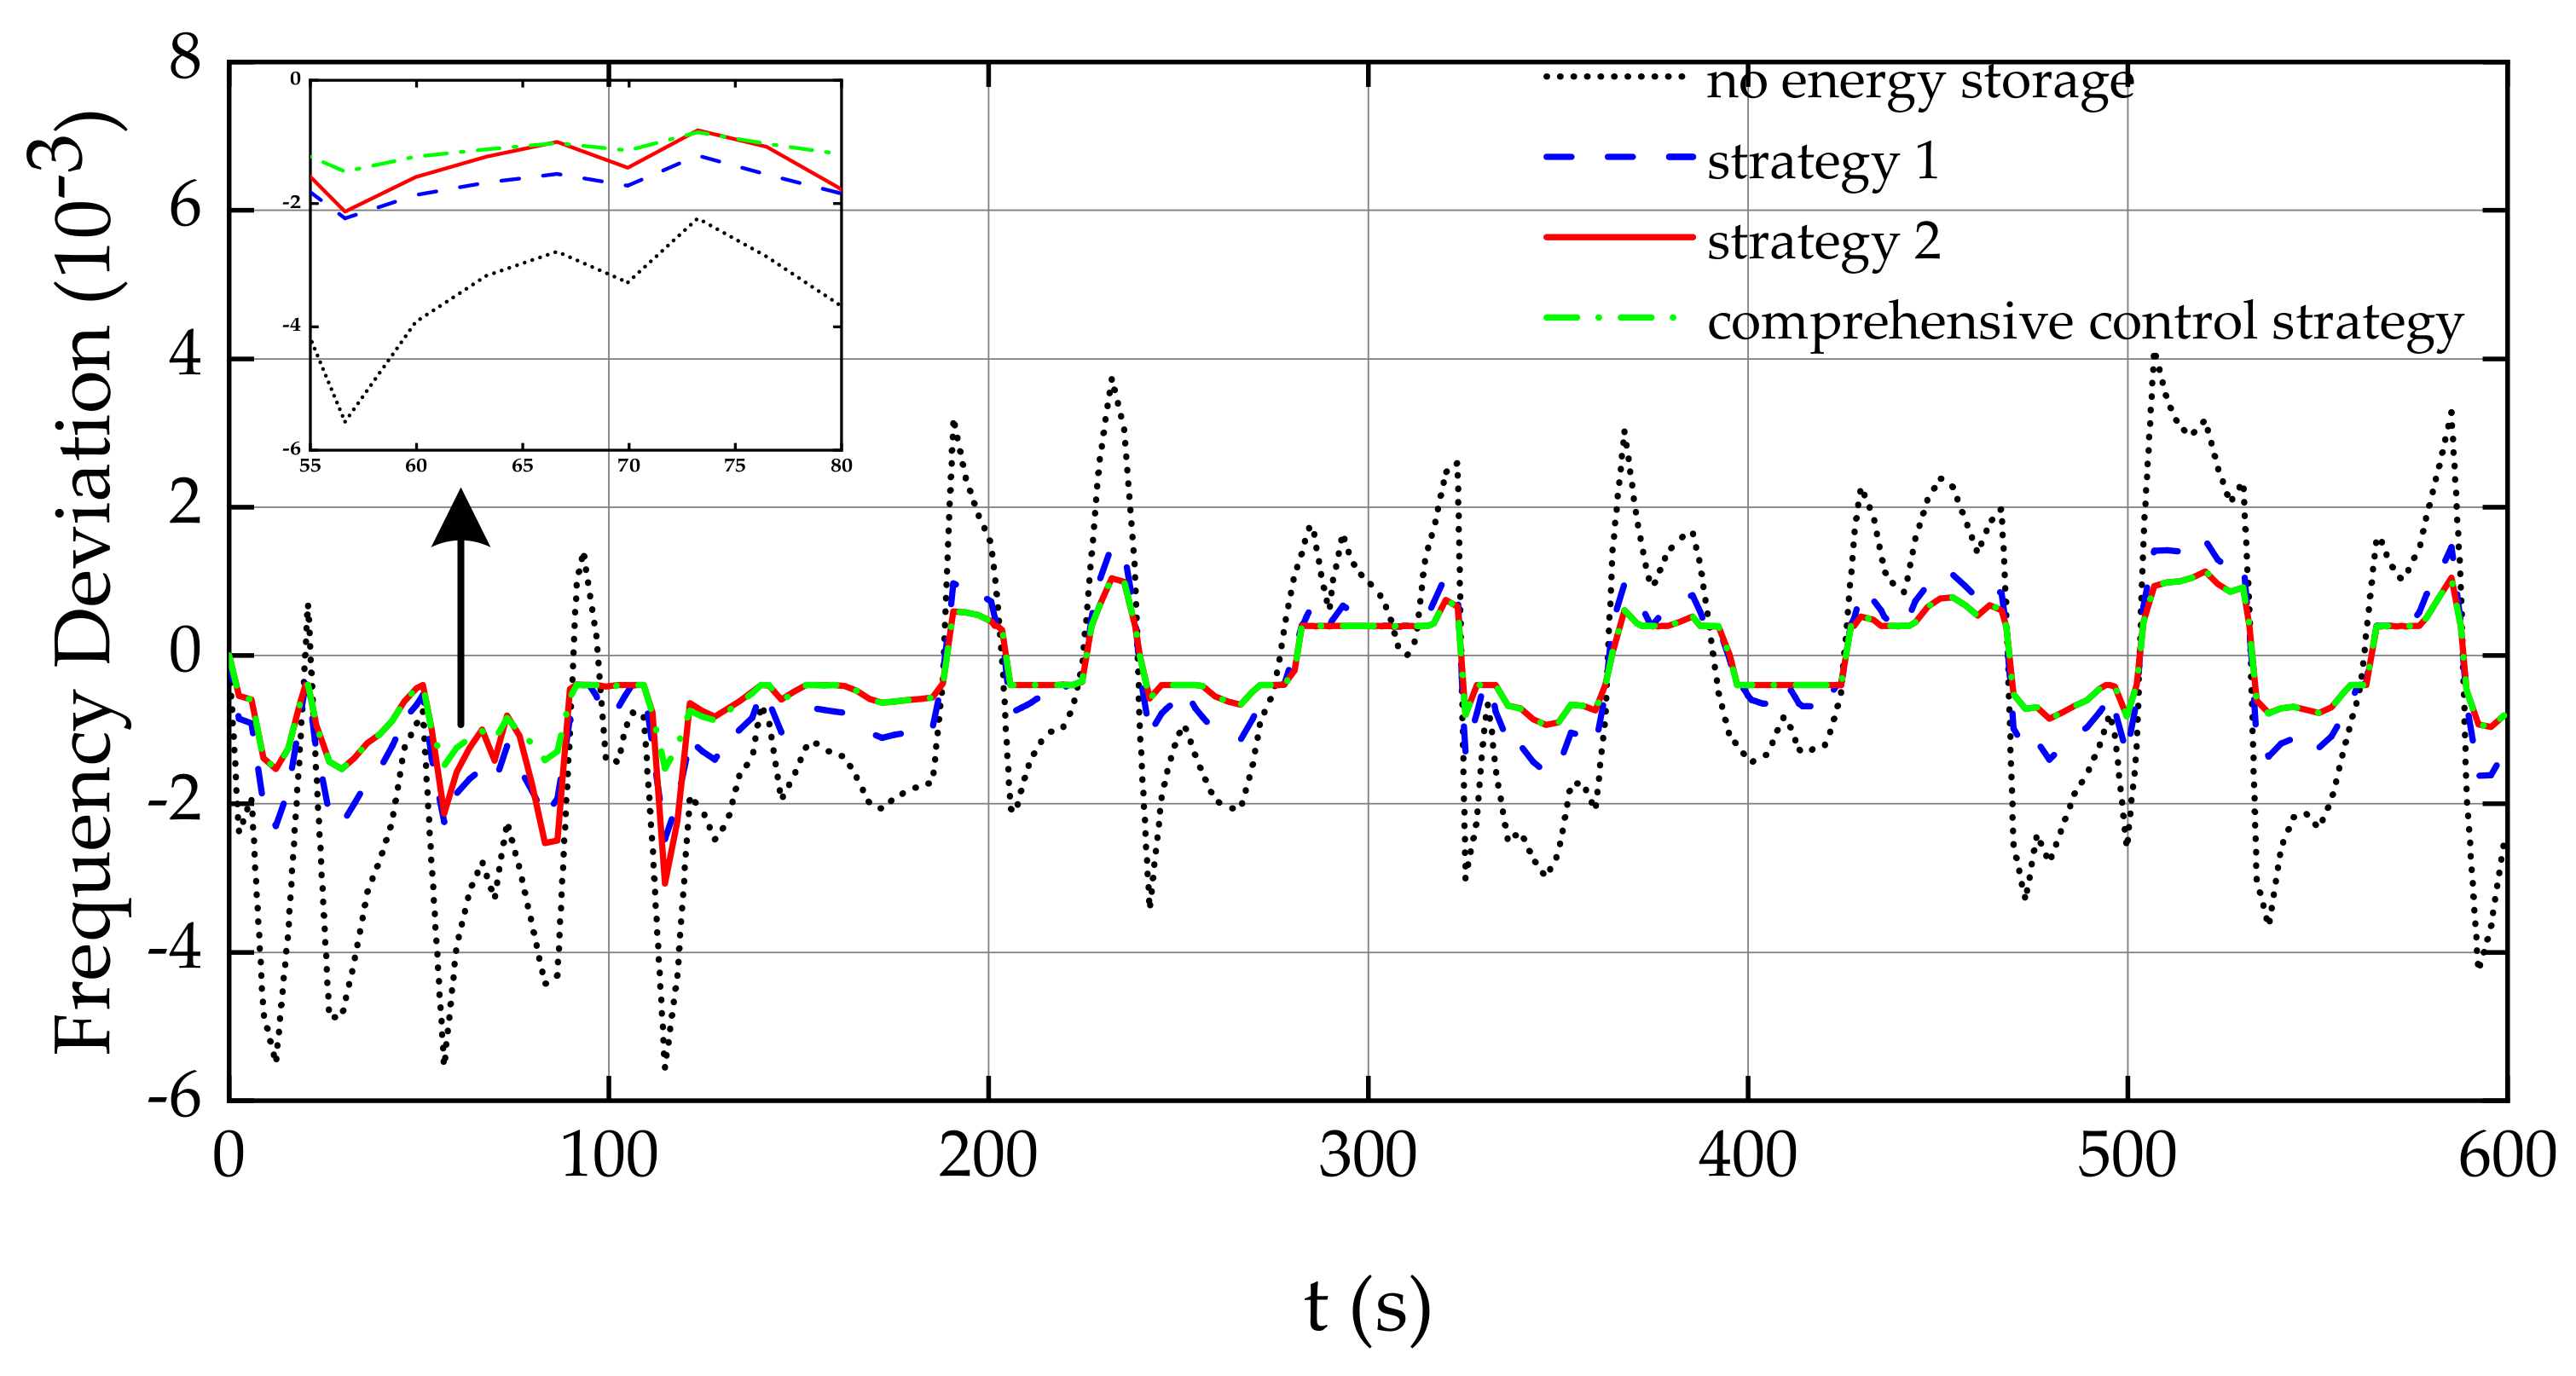
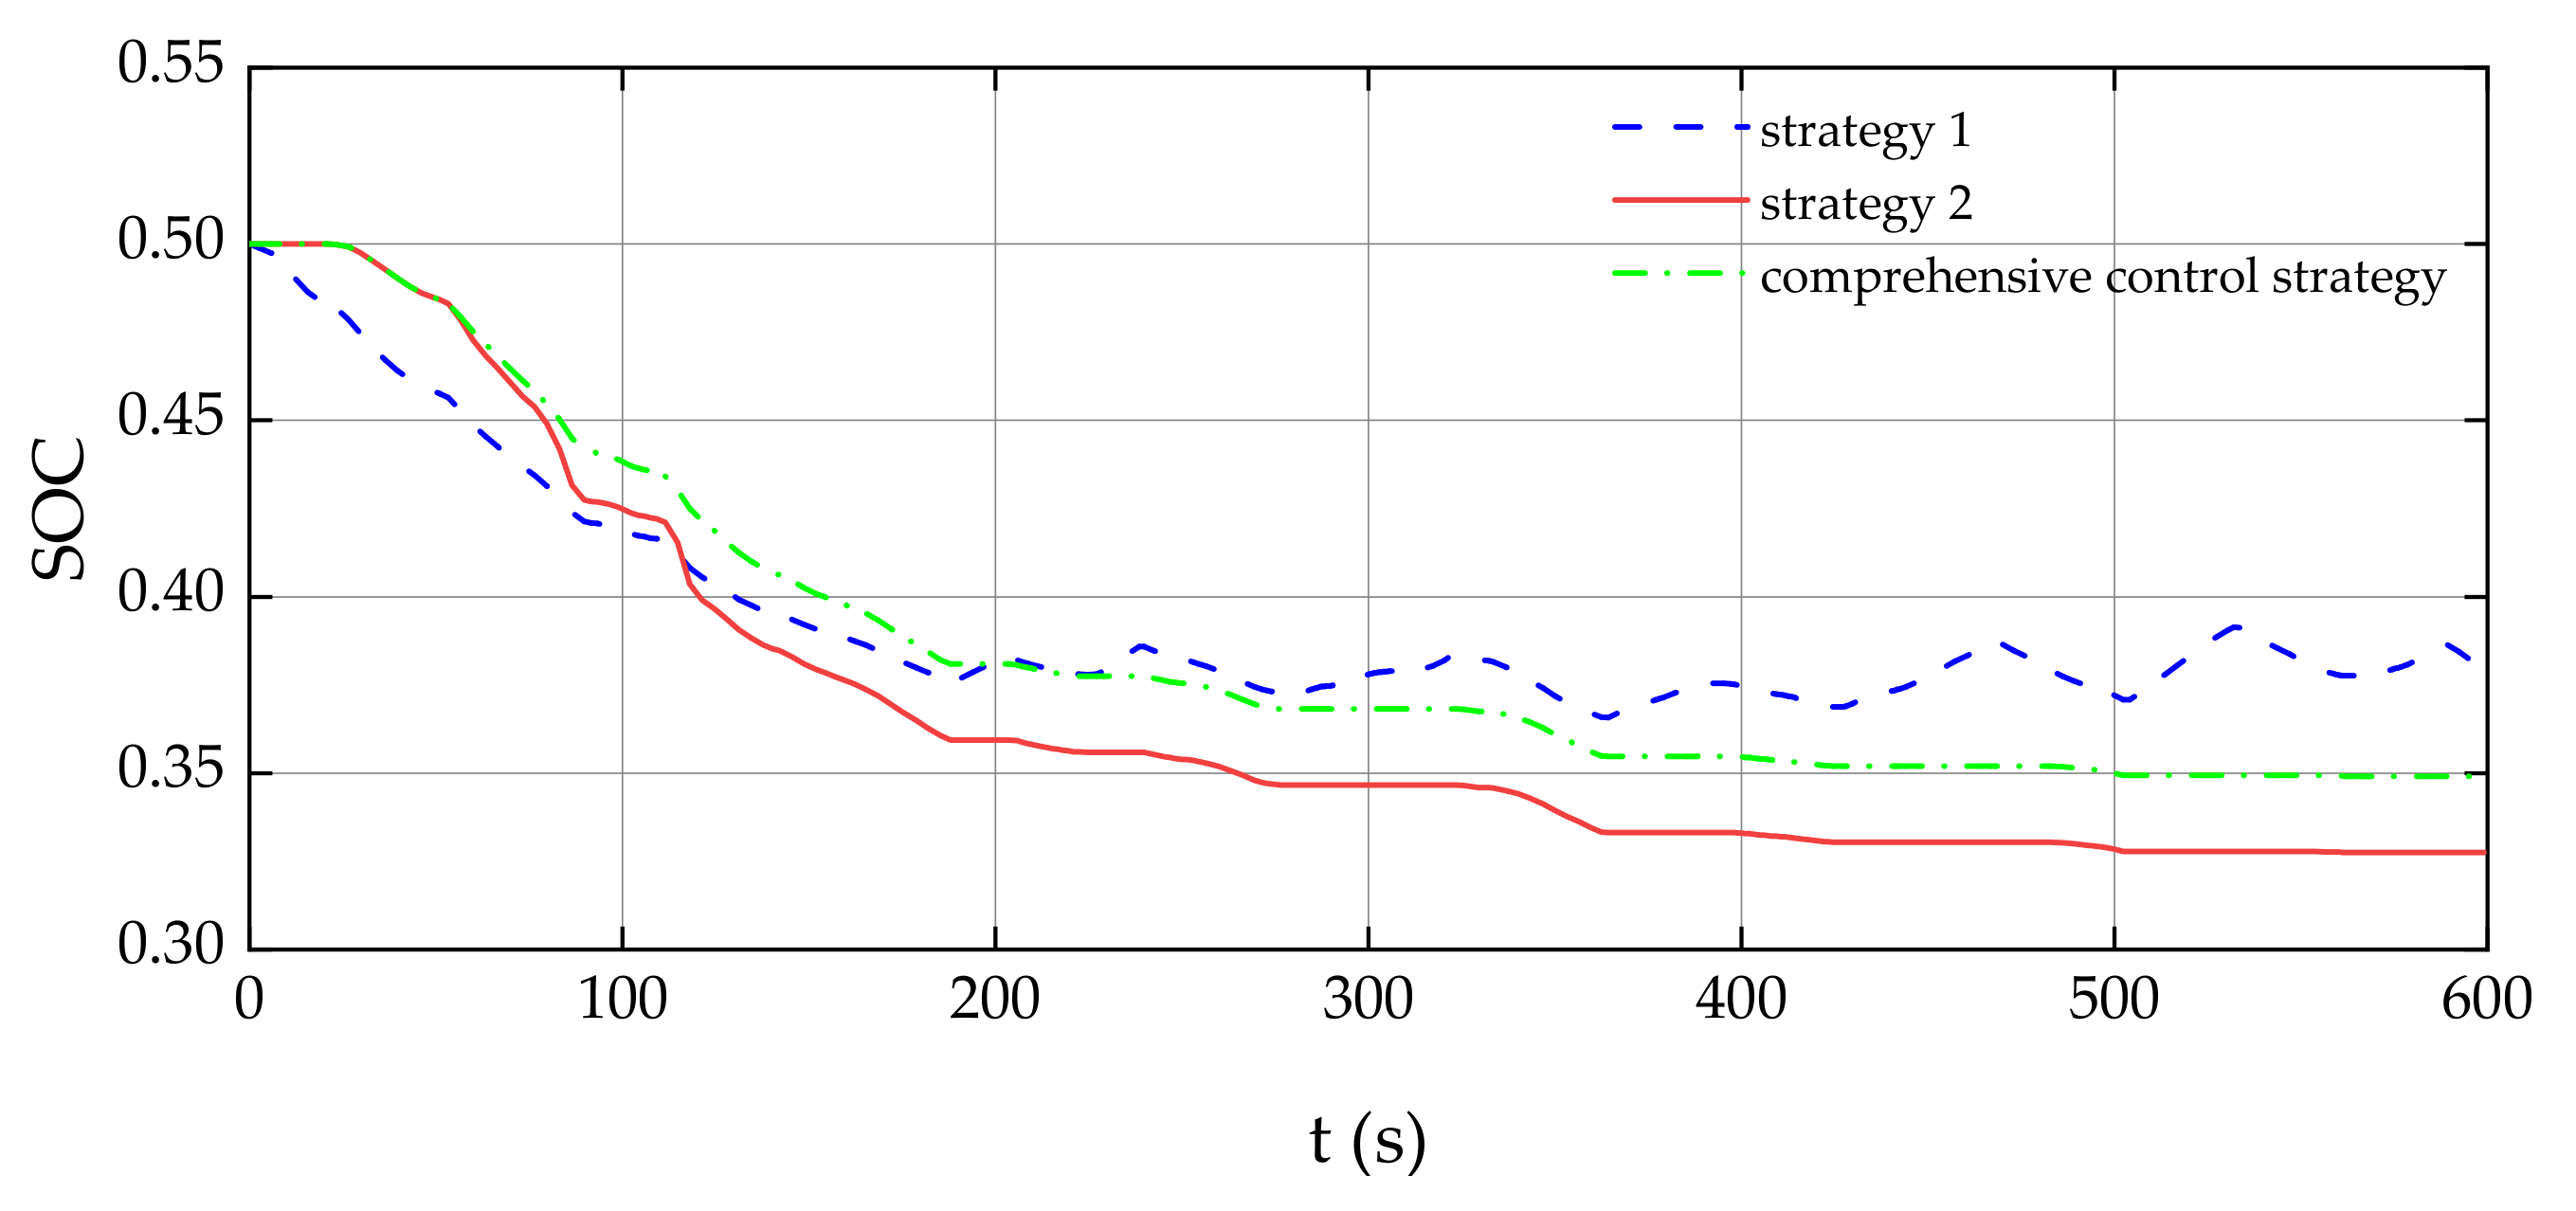
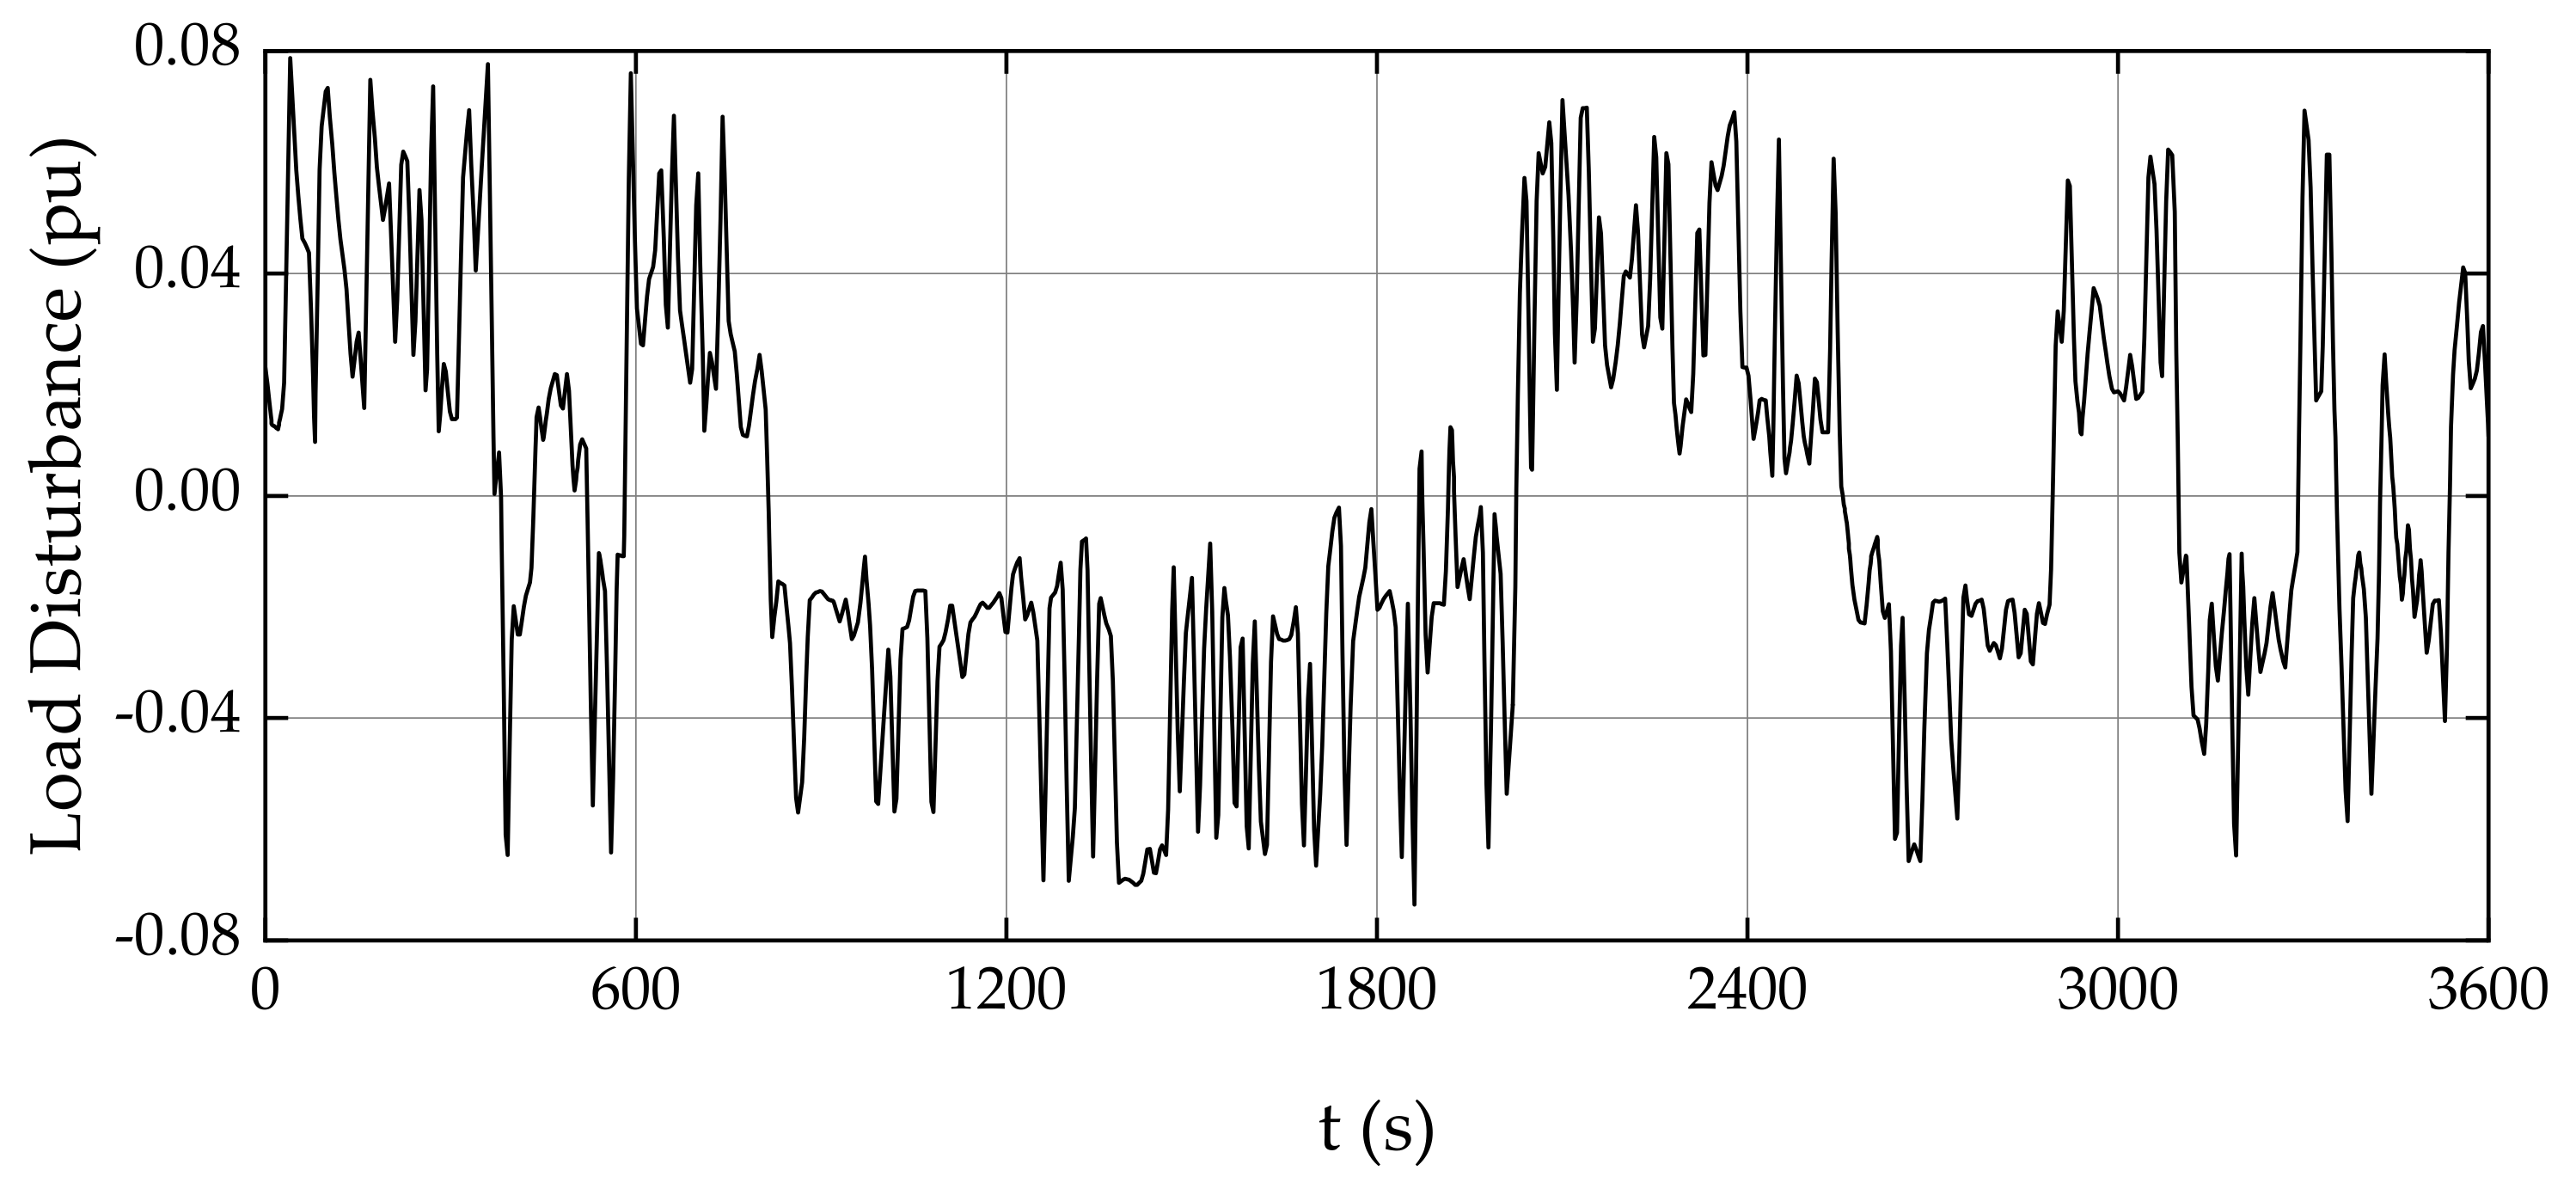
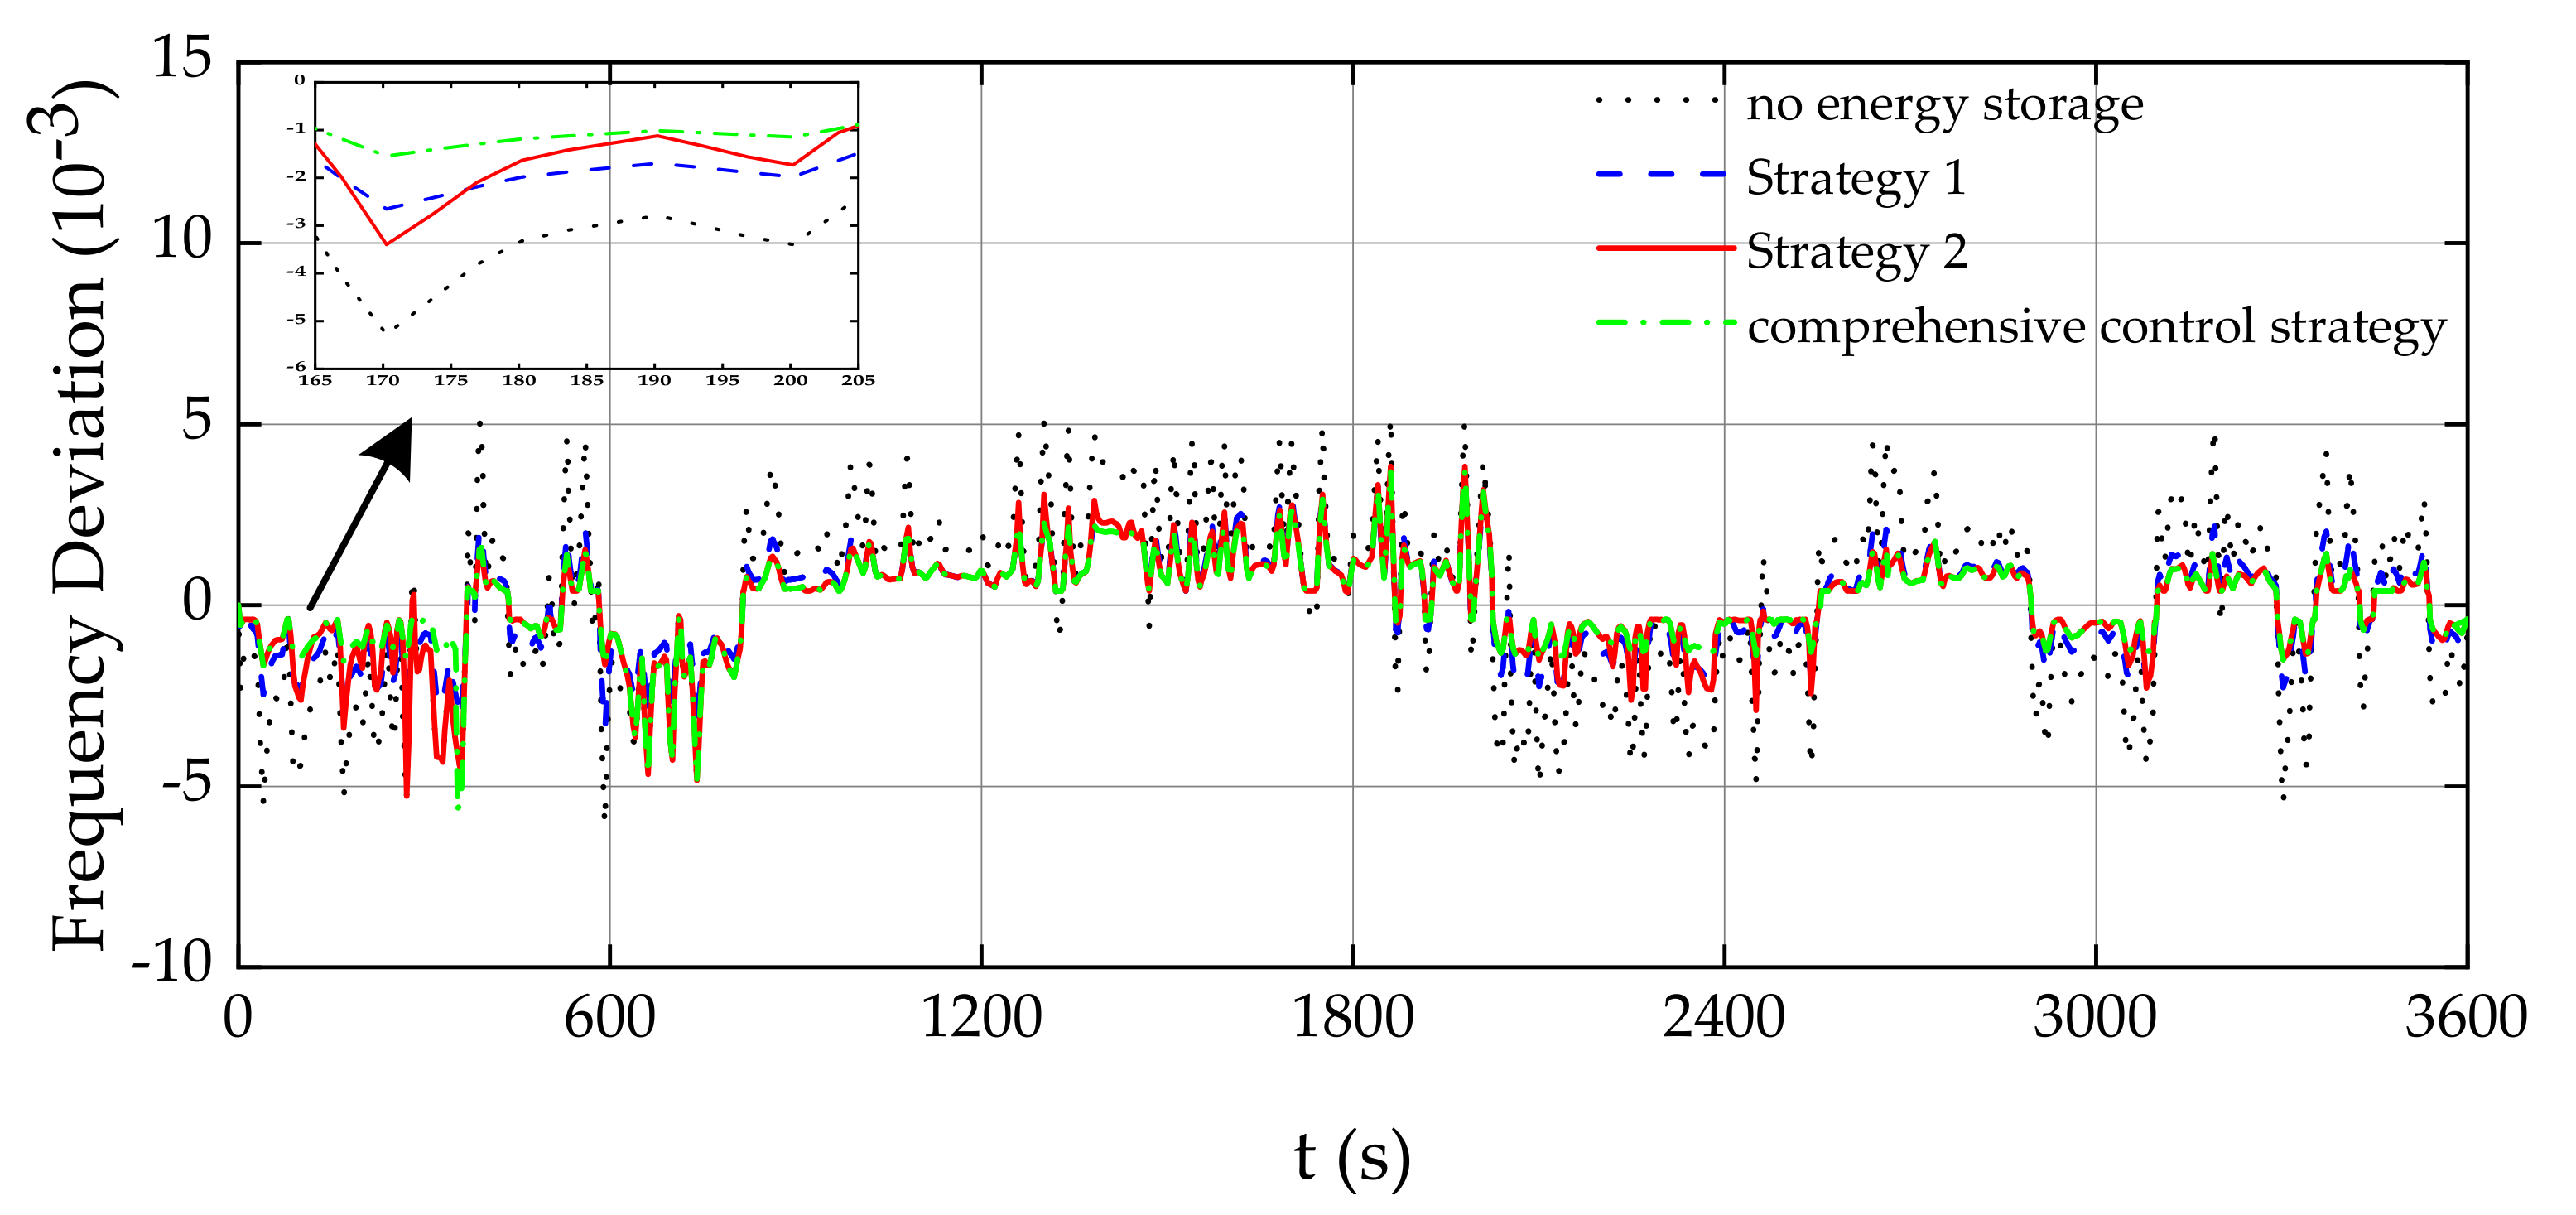
5.3. Continuous Load Disturbance

The previous comparison of the frequency modulation results of various control strategies under step load disturbance shows that the frequency modulation effect of the comprehensive control strategy is optimal, in order to verify the effectiveness of the comprehensive control strategy under continuous load disturbance, the continuous load disturbance is added to the regional power grid model. The 10 min load disturbances are shown in Figure 11. The frequency deviation curves under each control strategy are shown in Figure 12. The SOCs of the BES system are shown in Figure 13, and the evaluation indexes of FM are shown in Table 4.
It can be seen from Figure 12, Figure 13, and Table 4 that under the continuous load disturbance shown in Figure 11, the effect of FM is the worst when no energy storage is involved. For strategy 1, the effect of FM is worse than strategy 2 and the comprehensive control strategy, but the SOC maintenance of the BES system is better. For strategy 2, the effect of FM and the SOC maintenance of the BES system are not as good as the comprehensive control strategy. For the comprehensive control strategy, the effect of FM is the best, and the time taken in the actions of the BES system is half of the time taken in strategy 1, which effectively reduces the charge time and discharge time. This can extend the life of the BES system, but the action of the SES system is negative when the load disturbance is negative after the discharge of the BES system; the SOC of the BES system is not effectively supplemented, resulting in the maintenance of the SOC being poorer than that in strategy 1.
To further verify the effectiveness of the comprehensive control strategy under long-term load disturbance, a 60 min continuous load disturbance is added to the system, as shown in Figure 14. The frequency deviation curves and the SOC curves of the BES system under different control strategies are shown in Figure 15 and Figure 16, and the evaluation indexes are shown in Table 5.
According to Figure 15 and Figure 16 and Table 5, the same conclusion as that of the 10-min continuous load disturbance can be drawn. This indicates that the proposed comprehensive control strategy is still effective for long-term load disturbance, and the damage to the BES system is reduced, its economy is improved, and its engineering application is promoted in the GFM.

6. Conclusions

In this paper, a comprehensive control strategy for the HES system’s participation in the PFM of a power grid is proposed, and the following conclusions are drawn:
(1)
The comprehensive control strategy proposed in this paper has an effective FM effect under step disturbance and continuous load disturbance. The FM effect is better than strategy 1 under step disturbance and continuous load disturbance; there is no obvious advantage over strategy 2 under continuous disturbance, but the maximum frequency deviation can be reduced under step disturbance.
(2)
The FM dead zone of energy storage is set as lower than the FM dead zone of the unit, which is conducive to the FM effect. The FM dead zone of energy storage is set to 60% of the dead zone of the unit after consideration.
(3)
The use of a HES system and a super-capacitor prior to output can reduce the times taken for charging and discharging in the BES system. Under the continuous load disturbance of 10 min and 60 min, the BES system acts 18 and 30 times using strategy 1. However, the comprehensive control strategy only acts 9 and 16 times; this effectively extends the service life of the BES system.

Author Contributions

L.Y. and T.S. conceived the research. T.S. participated in the analysis of the data and in writing the initial manuscript. T.X., M.W., N.M. and K.L. revised the manuscript and adjusted the data presentation. All authors have read and agreed to the published version of the manuscript.

Funding

This research received no external funding.

Conflicts of Interest

The authors declare no conflict of interest.

References

  1. Gholami, M.; Pisano, A. Model Predictive Operation Control of Islanded Microgrids under Nonlinear Conversion Losses of Storage Units. Electricity 2022, 3, 3. [Google Scholar] [CrossRef]
  2. Xie, X.; Guo, Y.; Wang, B.; Dong, Y.; Mou, L.; Xue, F. Improving AGC performance of coal-fueled thermal generators using multi-MW scale BESS: A practical application. IEEE Trans. Smart Grid 2018, 9, 1769–1777. [Google Scholar] [CrossRef]
  3. Tan, Y.; Muttaqi, K.M.; Ciufo, P.; Meegahapola, L.; Guo, X.; Chen, B.; Chen, H. Enhanced Frequency Regulation Using Multilevel Energy Storage in Remote Area Power Supply Systems. IEEE Trans. Power Syst. 2019, 34, 163–170. [Google Scholar] [CrossRef]
  4. Sanduleac, M.; Toma, L.; Eremia, M.; Boicea, V.A.; Sidea, D.; Mandis, A. Primary Frequency Control in a Power System with BES Systems. In Proceedings of the 2018 IEEE International Conference on Environment and Electrical Engineering and 2018 IEEE Industrial and Commercial Power Systems Europe (EEEIC/I&CPS Europe), Palermo, Italy, 12–15 June 2018; p. 5. [Google Scholar]
  5. Cheng, Y.; Tabrizi, M.; Sahni, M.; Povedano, A.; Nichols, D. Dynamic Available AGC Based Approach for Enhancing Utility Scale Energy Storage Performance. IEEE Trans. Smart Grid. 2014, 5, 1070–1078. [Google Scholar] [CrossRef]
  6. Mu, Y.F.; Wu, J.Z.; Ekanayake, J.; Jenkins, N.; Jia, H.J. Primary frequency response from electric vehicles in the great britain power system. IEEE Trans. Smart Grid 2013, 4, 1142–1150. [Google Scholar] [CrossRef]
  7. Jin, J.L.; Xu, Y.J. Optimal Storage Operation Under Demand Charge. IEEE Trans. Power Syst. 2017, 32, 795–808. [Google Scholar] [CrossRef]
  8. Kottick, D.; Blau, M.; Edelstein, D. Battery energy storage for frequency regulation in an island power system. IEEE Trans. Energy Convers. 1993, 8, 455–459. [Google Scholar] [CrossRef]
  9. Almeida, P.M.R.; Lopes, J.A.P.; Soares, F.J.; Seca, L. Electric vehicles participating in frequency control: Operating islanded systems with large penetration of renewable power sources. In Proceedings of the 2011 IEEE Trondheim PowerTech, Trondheim, Norway, 19–23 June 2011; pp. 5–10. [Google Scholar]
  10. Knap, V.; Chaudhary, S.K.; Stroe, D.I.; Swierczynski, M.; Craciun, B.I.; Teodorescu, R. Sizing of an Energy Storage System for Grid Inertial Response and Primary Frequency Reserve. IEEE Trans. Power Syst. 2016, 31, 3447–3456. [Google Scholar] [CrossRef] [Green Version]
  11. Yoon, M.; Lee, J.; Song, S.; Yoo, Y.; Jang, G.; Jung, S.; Hwang, S. Utilization of Energy Storage System for Frequency Regulation in Large-Scale Transmission System. Energies 2019, 12, 3898. [Google Scholar] [CrossRef] [Green Version]
  12. Zhang, Y.J.A.; Zhao, C.; Tang, W.; Low, S.H. Profit-maximizing planning and control of battery energy storage systems for primary frequency control. IEEE Trans. Smart Grid 2018, 9, 712–723. [Google Scholar] [CrossRef] [Green Version]
  13. Fang, C.; Tang, Y.; Ye, R.; Lin, Z.; Zhu, Z.; Wen, B.; Ye, C. Adaptive control strategy of energy storage system participating in primary frequency regulation. Processes 2020, 8, 687. [Google Scholar] [CrossRef]
  14. Yan, G.; Liu, D.; Li, J.; Mu, G. A cost accounting method of the Li-ion battery energy storage system for frequency regulation considering the effect of life degradation. Prot. Control Mod. Power Syst. 2018, 3, 1–9. [Google Scholar] [CrossRef]
  15. Nadeem, F.; Hussain, S.M.S.; Tiwari, P.K.; Goswami, A.K.; Ustun, T.S. Comparative Review of Energy Storage Systems, Their Roles, and Impacts on Future Power Systems. IEEE Access 2019, 7, 4555–4585. [Google Scholar] [CrossRef]
  16. Zhang, Y.; Jiang, Z.; Yu, X. Control strategies for battery supercapacitor HES systems. In Proceedings of the 2008 IEEE Energy 2030 Conference, Atlanta, GA, USA, 17–18 November 2008; pp. 5–10. [Google Scholar]
  17. Ibrahim, M.; Jemei, S.; Wimmer, G.; Hissel, D. Nonlinear autoregressive neural network in an energy management strategy for battery/ultra-capacitor hybrid electrical vehicles. Electr. Power Syst. Res. 2016, 136, 262–269. [Google Scholar] [CrossRef]
  18. Santucci, A.; Sorniotti, A.; Lekakou, C. Power split strategies for HES systems for vehicular applications. J. Power Sources 2014, 258, 395–407. [Google Scholar] [CrossRef] [Green Version]
  19. Mufti, M.U.D.; Lone, S.A.; Iqbal, S.J. Super-capacitor based energy storage system for improved load frequency control. Electr. Power Syst. Res. 2009, 79, 226–233. [Google Scholar] [CrossRef]
  20. Meng, L.; Zafar, J.; Khadem, S.K.; Collinson, A.; Murchie, K.C.; Coffele, F.; Burt, G.M. Fast Frequency Response from Energy Storage Systems—A Review of Grid Standards, Projects and Technical Issues. IEEE Trans. Smart Grid 2020, 11, 1566–1581. [Google Scholar] [CrossRef] [Green Version]
  21. Yao, M.; Shoults, R.R.; Kelm, R. AGC logic based on NERC’s new Control Performance Standard and Disturbance Control Standard. IEEE Tran. Power Syst. 2000, 15, 852–857. [Google Scholar] [CrossRef]
Figure 1. Regional power grid frequency modulation model with HES participating in PFM.
Energies 15 04079 g001
Figure 2. Mathematical model of BES.
Energies 15 04079 g002
Figure 3. Mathematical model of super-capacitor.
Energies 15 04079 g003
Figure 4. Droop coefficient changes in super-capacitor charge and discharge processes.
Energies 15 04079 g004
Figure 5. Selection strategies for different energy storage systems.
Energies 15 04079 g005
Figure 6. Control mode selection strategy.
Energies 15 04079 g006
Figure 7. Continuous load disturbance curve.
Energies 15 04079 g007
Figure 8. Frequency deviation comparison under the different FM dead zones of energy storage.
Energies 15 04079 g008
Figure 9. Frequency deviation curve under step load disturbance.
Energies 15 04079 g009
Figure 10. SOC curve of BES under step load disturbance.
Energies 15 04079 g010
Figure 11. 10-min continuous load disturbance curve.
Energies 15 04079 g011
Figure 12. Frequency deviation curve under 10 min continuous load disturbance.
Energies 15 04079 g012
Figure 13. SOC curve of BES system under 10 min continuous load disturbance.
Energies 15 04079 g013
Figure 14. 60-min continuous load disturbance change curve.
Energies 15 04079 g014
Figure 15. Frequency deviation curve under 60 min continuous load disturbance.
Energies 15 04079 g015
Figure 16. SOC change curve of BES system under 60 min continuous load disturbance.
Energies 15 04079 g016
Table 1. Performance comparison of energy storage types.
CharacteristicsPerformance
Energy-Based Energy StoragePower-Type Energy Storage
Lithium BatteryFlow BatteriesFlywheelSuper-
Capacitor
Superconducting
Magnetic
Energy densityHighHighLowLowMiddle
Power densityLowLowHighHighHigh
Cyclic lifeShortLongLongLongLong
Response timeMiddleLongFastFastFast
CostLowHighHighMiddleHigh
Table 2. Modulation evaluation indexes under different FM dead zones of energy storage.
Dead Zone Size100%80%60%40%20%
Δ f r m s / 10 4 pu 6.555.264.143.413.17
Table 3. Evaluation indexes of FM under step load disturbance.
Control Policies Δ f max / 10 3   pu t s / s Δ f s / 10 3   pu I
No energy storage4.976603.00943.940
Strategy 11.811301.54519.424
Strategy 21.209301.07515.136
Comprehensive control strategy1.166301.07514.964
Table 4. Evaluation index of FM under 10 min continuous load disturbance.
Control Policies Δ f r m s / 10 3   pu S O C r m s A
No energy storage1.882//
Strategy 10.8800.11518
Strategy 20.6590.14810
Comprehensive control strategy0.5960.1289
Table 5. Evaluation index of FM under 60 min continuous load disturbance.
Control Policies Δ f r m s / 10 3   pu S O C r m s A
No energy storage2.282//
Strategy 11.2420.16730
Strategy 21.2160.19216
Comprehensive control strategy1.0870.17716
Publisher’s Note: MDPI stays neutral with regard to jurisdictional claims in published maps and institutional affiliations.

