Article

Oil Retention and Its Main Controlling Factors in Lacustrine Shales from the Dongying Sag, Bohai Bay Basin, Eastern China

1
State Key Laboratory of Organic Geochemistry, Guangzhou Institute of Geochemistry, Chinese Academy of Sciences, Guangzhou 510640, China
2
CAS Center for Excellence in Deep Earth Science, Guangzhou 510640, China
3
School of Energy Resources, China University of Geosciences (Beijing), Beijing 100083, China
*
Author to whom correspondence should be addressed.
Energies 2022, 15(12), 4270; https://doi.org/10.3390/en15124270
Submission received: 20 April 2022 / Revised: 21 May 2022 / Accepted: 6 June 2022 / Published: 10 June 2022
(This article belongs to the Special Issue New Challenges in Shale Gas and Oil)

Abstract

:
The investigation of the shale oil development potential of the lower third section–upper fourth section (ES33–ES41) of the Eocene–Oligocene Shahejie Formation in the Dongying Sag, Bohai Bay Basin, eastern China, continues to be a scientific challenge. A total of 23 shale samples was collected from these strata, and the organic petrology, organic geochemistry, mineral composition, porosity, and pore structure of these samples and their relationships with the retained oils were investigated. The results indicated that these shales with type I–IIa kerogen are rich in lamalginite and its debris, and the Ro values of these shales range from 0.70% to 1.00%. The non-micropores (>2 nm) that are mainly developed from inorganic minerals are greater than the micropores (<2 nm) that largely contributed from the organic matter of the shale. The retained oil contents presented by the free hydrocarbons (S1) and extracted organic matter (EOM) exhibited significantly positive relationships with the total organic carbon (TOC) contents and micropore volumes, which may indicate that the retained oils are largely stored in organic matter micropores resulting from the volume swelling of kerogen. The total oils and their light compositions, as well as the S1/TOC and EOM/TOC values, increase with the burial depth of the shales, indicating that the content and mobility of the retained oils are largely controlled by the maturity of shales. This study predicts that the burial depth of favorable shale oil reservoirs in the Dongying Sag should be greater than 3500 m (Ro > 0.90%), and the siltstone or carbonate rock interlayer, especially with laminated or layered textures, will further control the sweet spot intervals of shale oil. This study provides new geological evidence for revealing the retention mechanism of shale oils and has practical significance for shale oil exploration and development in the Dongying Sag, Bohai Bay Basin.

1. Introduction

Shale oil and gas development in the United States has achieved large success in the past 10 years [1,2,3], inducing global activities in shale oil and gas exploration and development as well as expanding related research. In China, marine shale gas has been commercially developed [4,5], but the developments of shale oils are currently in a preliminary stage [4,6]. Distinct from the marine shale oil reservoirs in the United States, the shales with oil potential in China are mostly lacustrine facies [6]. Although lacustrine shale oil reservoirs are widely distributed in many Mesozoic and Cenozoic petroliferous basins in China and have high resource potential [7,8,9], they are generally characterized by low porosity, low permeability, and high viscosity shale oils [6,10]. Therefore, the exploration of shale oils and the selection of favorable targets in China still face large challenges [4,11].
The Dongying Sag is a typical representative for a series of subdepressions in the Bohai Bay Basin, eastern China. Thick organic-rich shale strata were extensively developed in the lower third section–upper fourth section of the Eocene–Oligocene Shahejie Formation strata (ES33–ES41) of the sag, with a cumulative thickness of 300–500 m [12]. This set of shale strata not only contributes a large scale of oil resources to conventional reserves, but also retains plenty of shale oil in its nanopore systems. For example, according to the prediction from Zhu et al. [13], the shale oil resources in the ES33 shale strata in the Dongying Sag is estimated to be 11.39–11.57 × 10⁸ t. In recent years, numerous studies have been carried out on the ES33–ES41 shale strata in the Dongying Sag, including the petrological characteristics and sedimentary microfacies [14,15,16], reservoir properties [17,18,19,20,21,22], oil-bearing properties [21,23,24,25,26,27], and prediction of the shale oil sweet spots in the reservoirs [13,28,29,30,31]. Some basic geological properties have been achieved with respect to this set of shales. The ES33–ES41 shale strata in the Dongying Sag include a variety of sedimentary lithofacies and organic microfacies. For example, Chen et al. [14] reported seven sedimentary lithofacies, including massive hybrid rock, laminated hybrid rock, laminated limestone, interbedded limestone, layered clay rock, massive dolomite, and layered fine siltstone; they also believed that organic-rich laminated limestone and interbedded limestone were the most favorable targets for shale oil development. Xie et al. [15] identified eight types of organic microfacies (A–H), referring to the petrographic textural relationships among individual maceral components, kerogen-rich laminae, and inorganic mineral matrix, and believed that the combination of petrographic and OSI (oil saturation index) analysis appears to be a promising method for characterizing shale oil systems. The shale porosity in the Dongying Sag varies significantly, with complex pore structures [17,18,19,20]. In addition to the lithofacies, lithological types, and organic matter and mineral compositions [17,18], shale oil potentials are also restricted by the burial depth (i.e., diagenesis or maturity) and the sedimentary textures (layered, laminated, and massive) of the shales [12,31,32]. Shale oils can exist in various types of nanopores [26,33], but the pore size, pore connectivity, and surface wettability dominantly determine the enrichment and occurrence state of shale oil [26]. The connectivity of shale pores is mainly controlled by small pore throats [19], and the pore size thresholds of shale oil occurrence, free oil occurrence, and free oil enrichment are 5, 10, and 30 nm, respectively [17,26]. The total oil content and movable oil content of the shales vary greatly and are dominantly controlled by the burial depth (or maturity) and lithofacies’ type of the shales [13,29,30]. Light hydrocarbon components, TOC content, and porosity are the main factors contributing to the proportion of movable oils [26]. It is generally believed that laminated organic-rich shale with a buried depth >3000–3200 m or a Ro of 0.70% can be used to indicate shale oil sweet spots [30,31,32].
Although the above understanding has important guidance for the exploration and development of shale oils in the Dongying Sag, little expected progress has been made in this sag [9,34,35,36]. In predicted exploration blocks, the test wells generally have a low production, with a rapid decrease in production, resulting in little economic benefits. The exploration and development of shale oil in the Dongying Sag has progressed slowly [30,35]; thus, systematic and insightful fundamental recognition with respect to the occurrence, enrichment, and accumulation of shale oils is required for the next stage of exploration in this region. Previous studies have mostly focused on the controls and exploitability of shale oil based on geological and geochemical factors, while few studies have revealed the retention mechanism of shale oil in reservoirs. This study conducted comprehensive research on the Shahejie shale samples from the Dongying Sag on their organic petrology, geochemistry, reservoir properties, and retained oil properties. The purpose was to explore the retention mechanism and controlling factors of shale oil in this sag and provide theoretical guidance for shale oil evaluation and sweet spot prediction.

2. Samples and Experiments

2.1. Samples

The studied samples were collected from the ES33–ES41 strata from the three wells, Fanye 1 (FY1), Niuye 1 (NY1), and Liye 1 (LY1), in the Dongying Sag, Bohai Bay Basin, eastern China. The geological background of the Dongying Sag and the locations and stratigraphy of the three wells have been reported in several studies (e.g., [16,17,26,29,31]). A brief description of the basic characteristics of the collected sample is provided here. Since the three wells are located in different sub-sags of the Dongying Sag [32,37], their ES33–ES41 strata have obviously different burial depths. The samples from the FY1, NY1, and LY1 wells had depths of 3172–3376 m, 3342–3482 m, and 3600–3835 m, respectively. The FY1 and NY1 shale samples were laminated or layered shales, while the LY1 shale samples included laminated shales and layered siltstones. Since the Dongying Sag underwent continuous subsidence after the ES33–ES41 strata were deposited, the current burial depth of the shale samples can indicate their thermal maturity [9,27]. According to the correlation diagram between the Ro value and burial depth of shales in the Dongying Sag [9], the maturities of the FY1, NY1, and LY1 samples ranged from an early oil window to a late oil window, spanning the complete oil generation window. The basic geological and geochemical information of the samples is presented in Table 1.

2.2. Experiments

2.2.1. TOC Content and Rock-Eval Analysis

Dried shale powered samples less than 80 mesh were used for TOC content analysis and Rock-Eval pyrolysis. The TOC was measured using a LECO CS-200 analyzer after the samples were treated with diluted hydrochloric acid to remove their carbonates. Rock-Eval pyrolysis was carried out using a Rock-Eval 6 instrument following the measuring procedure proposed by Behar and Beaumont [38] to obtain the amount of free hydrocarbons (S1), the amount of pyrolysis hydrocarbons (S2), and the temperature with a maximum pyrolysis yield (Tmax).

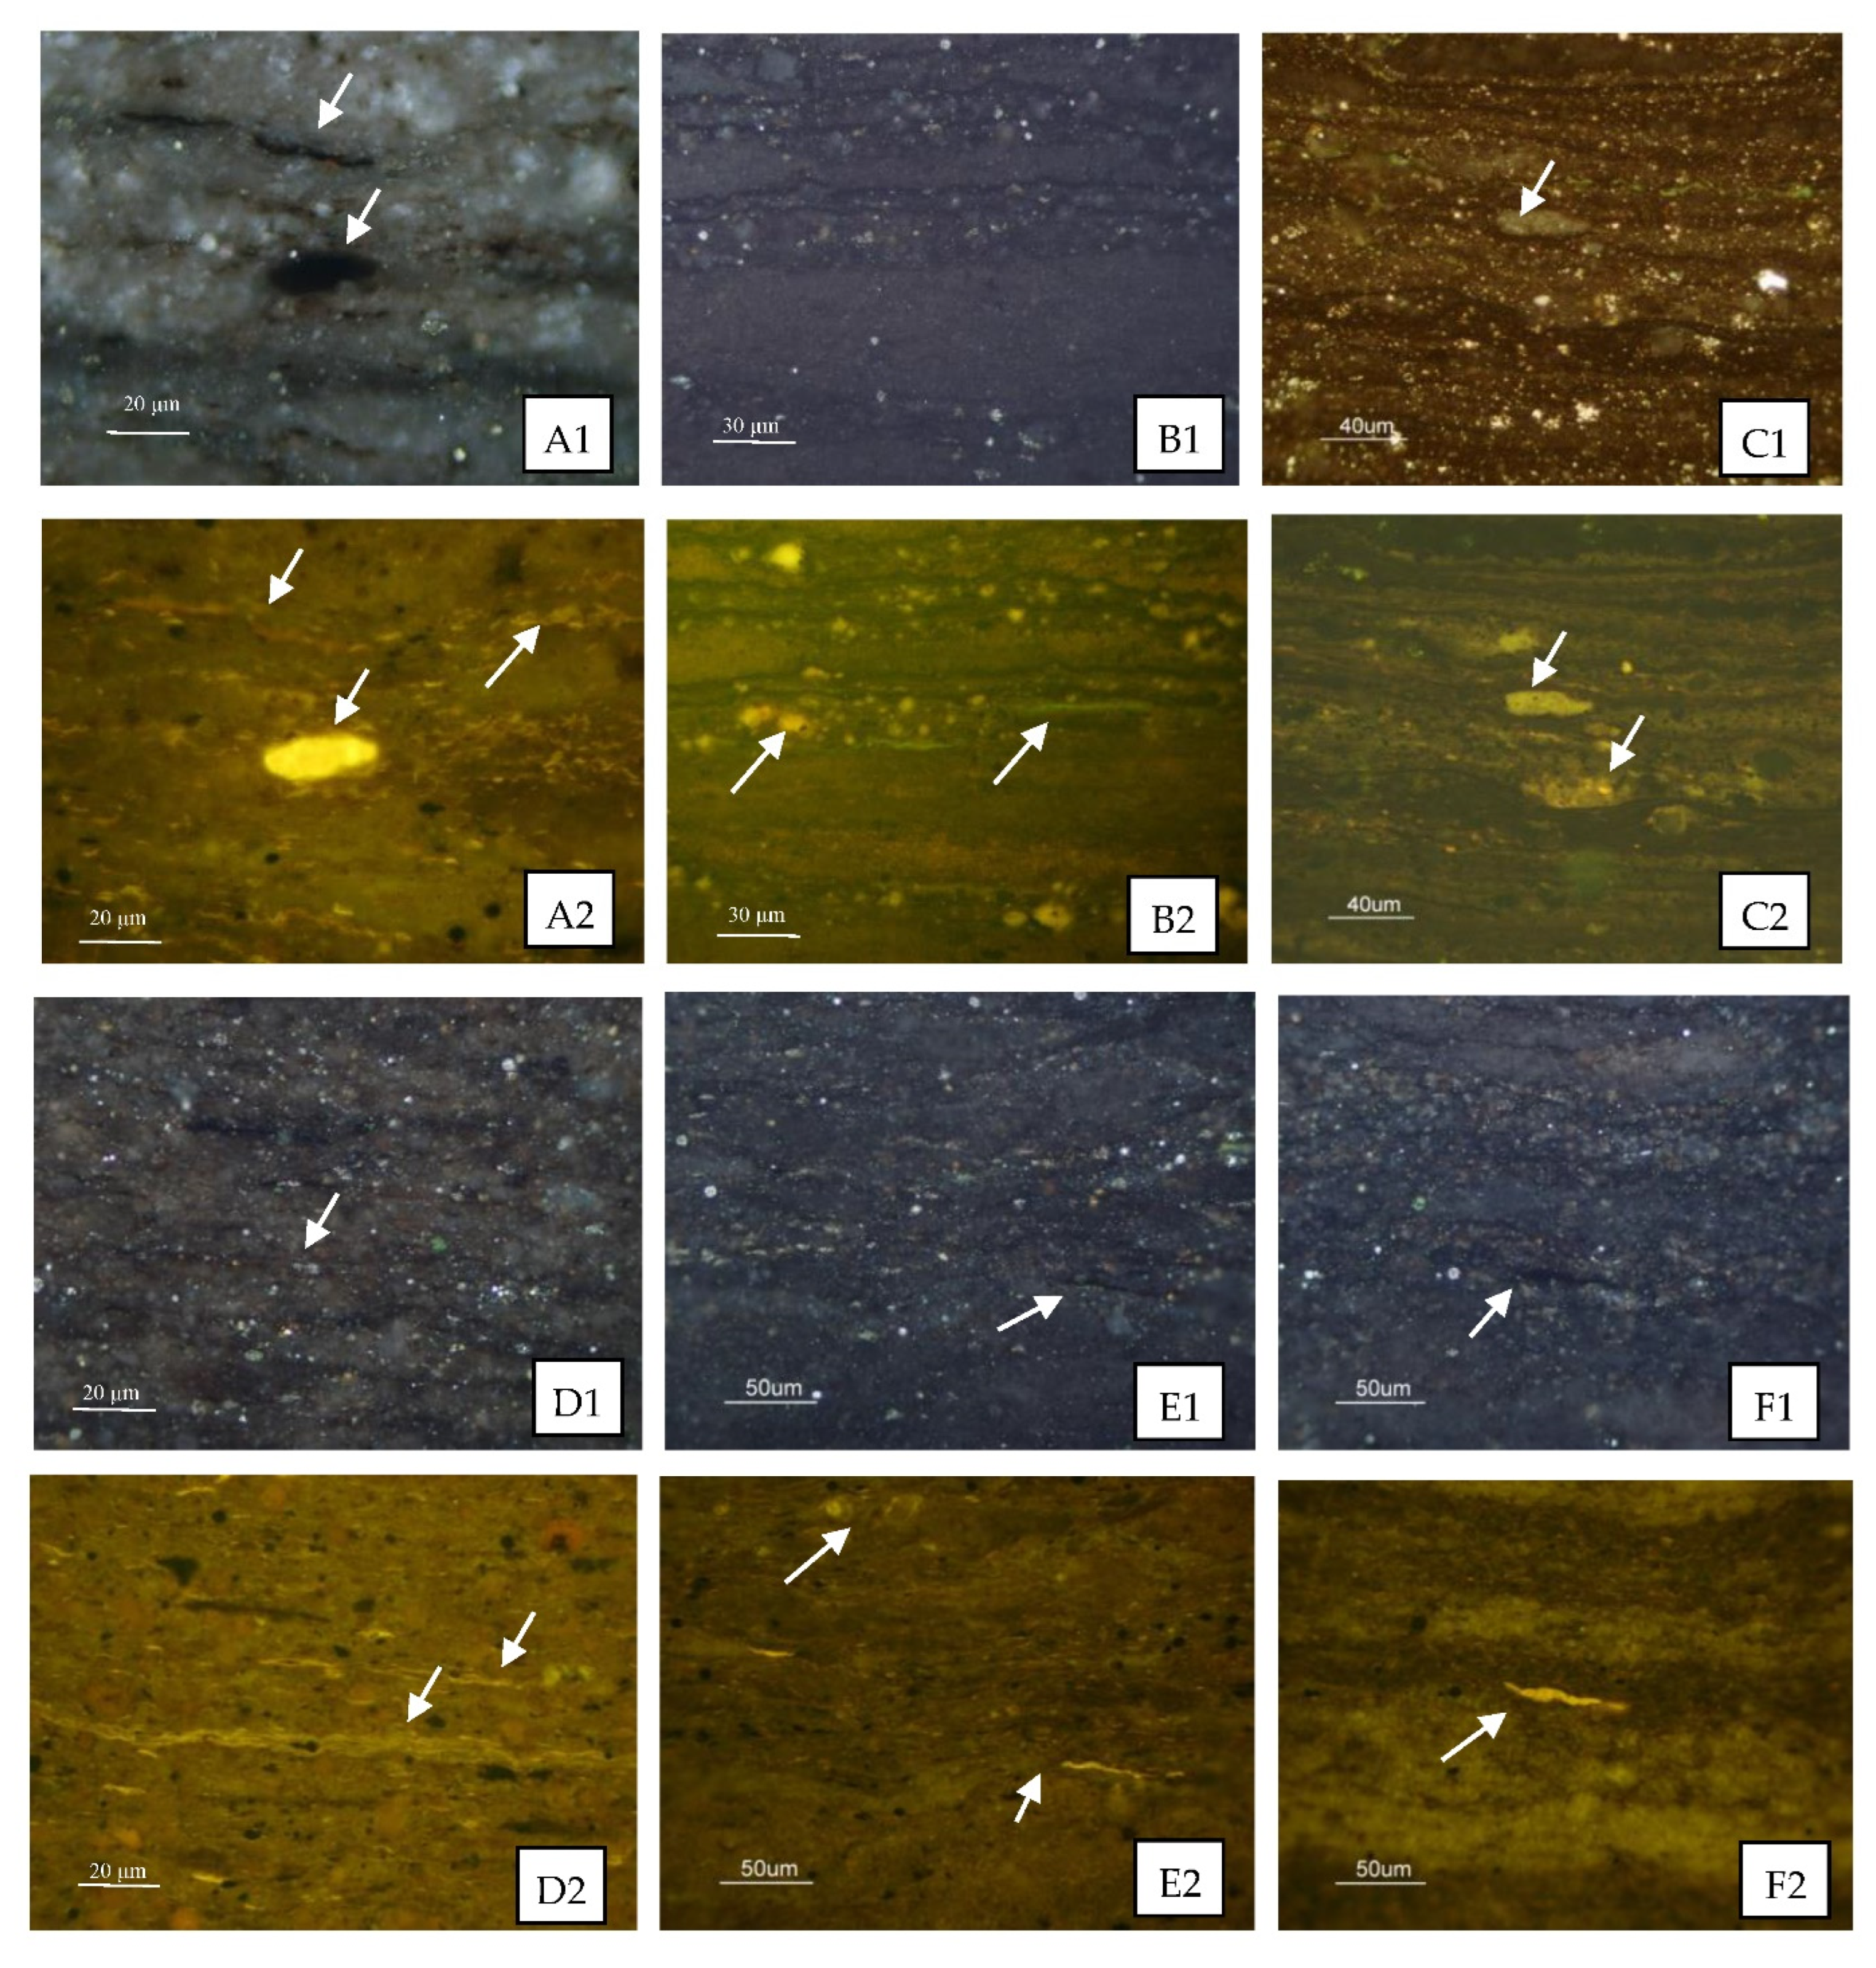
2.2.2. Organic Petrological Observation

Organic petrological observations were conducted using polished shale block samples. The applied instrument was a 3Y Leica DMR XP microscope system, using a 50× objective under air medium. The identification of macerals was mainly based on their morphology, occurrence, reflectivity and/or fluorescence color, internal structure, and other optical characteristics and followed the standard organic petrology methods [39].

2.2.3. Quantification of Soluble Organic Matter

The samples were extracted with a mixture of dichloromethane and methanol (93:7 in volume ratio) for 48 h to obtain the soluble organic matter from the shale samples. The extracted products were filtered, evaporated, and weighed to obtain the extracted organic matter (EOM). Furthermore, the separations of gross chemical composition were based on a conventional thin-layer chromatograph method [40], and the saturate, aromatic, resin, and asphaltene fractions were obtained and quantified.

2.2.4. Mineral Composition Analysis

The extracted powder shale samples were used for mineral composition analysis using a Bruker D8 advance X-ray diffractometer. The analysis conditions were as follows: a working voltage of 4 kV, a current of 30 mA, a scanning range of 3–85° (2θ), a slit width of 1 mm, and a scanning speed of 4°/min. The mineral composition was determined semi-quantitatively by Lorentz polarization according to the peak area integration [41].

2.2.5. Porosity and Pore Structure Analysis

The helium porosity of an extracted sample was determined by its bulk density coupled with its skeletal density [42]. The skeleton density was measured by a helium pycnometer (Quantachrome, Ultrapyc 1200e, Boynton Beach, FL, USA). The apparent density was measured by the sealing paraffin method, and the instrument was a high-precision hydrometer (DAHO-120M). More detailed procedures are given in the literature (e.g., [43]).
A Micromeritics ASAP2020 automatic specific surface area analyzer was used for low-pressure N2 and CO2 adsorption experiments of the extracted grain samples to obtain their pore structure parameters. The shale sample was dried at 110 °C for 12 h and then placed into the sample tube and degassed for 10 h under near vacuum conditions at a temperature of 383.15 K and a pressure <10 mm Hg. For the N2 adsorption experiment, the relative pressure (P/P0) was between 0.005 and 0.995, and the temperature was 77.4 K. For the CO2 adsorption experiment, the relative pressure (P/P0) was between 0.00001 and 0.032, and the temperature was 273.15 K. According to the obtained N2 and CO2 isothermal adsorption curves, the BET specific surface area and the pore volumes of non-micropores (>2 nm) and micropores (<2 nm) were calculated, following the method described by Cheng et al. [44].

3. Results and Discussion

3.1. Geochemical Characteristics of Samples

The TOC content of the 23 shale samples was between 1.20% and 9.38%, including 1.28–5.97% for the FY1 sample, 1.27–2.33% for the NY1 sample, and 1.20–9.38% for the LY1 sample (Table 1), roughly covering the TOC range of the shale samples in other literature (e.g., [21]). Thus, it is believed that the studied samples are representative of the section.
According to the plot of HI against Tmax from the Rock-Eval pyrolysis data, the kerogen types of the samples belonged to type I and type IIa (Figure 1). The Tmax value of a shale sample was used to characterize its maturity, as the Ro value was less than 1.35%. A comparison of the Tmax values of the samples from the three wells was made. For the LY1 sample with the greatest depth, its Tmax was higher than that of the FY1 and NY1 samples, indicating a greater maturity level. However, the NY1 sample had a greater depth than the FY1 sample but showed a smaller Tmax. The volatile organic matter and soluble organic matter in shales will reduce their Tmax values [45,46,47]. It can be seen from the correlation diagram that Tmax against EOM/TOC and S1/TOC of the samples from the two wells had negative correlations (Figure 2), which indicated that the greater EOM and/or S1 in the organic matter of the NY1 sample may have been the reason for its lower Tmax value.
Since the kerogen types of the samples were basically type I and type IIa, there should have been an obvious vitrinite reflectance suppression [48]. The vitrinite reflectance correction diagram proposed by Guo et al. [49] was adopted to determine the maturity level of the samples based on their burial depth, with Ro values of approximately 0.70–0.80% for the FY1 sample, 0.80–0.85% for the NY1 sample, and 0.85–1.0% for the LY1 sample.
There was a positive correlation between S1/TOC and burial depth (Figure 3a) and a negative correlation between S2/TOC and burial depth for the studied samples (Figure 3b). However, the correlation between (S1 + S2)/TOC and burial depth was complex (Figure 3c). For samples with a depth of <3300 m, their relationship was not clear, but for samples with a burial depth of >3300 m, their relationship was negative (Figure 3c). This showed that the thermal evolution of the samples entered the main stage of oil generation, with significant oil expulsion as the burial depth was greater than 3300 m. The result is consistent with that calculated by Yan et al. [50] using the kerogen swelling theory. According to their calculation, the hydrocarbon expulsion started at an EasyRo of 0.72% for the shales in the Dongying Sag, corresponding to a burial depth of approximately 3300 m [9].
The organic petrology characteristics of the samples from the three wells were quite similar. They generally lacked vitrinite, mainly with identified macerals of lamalginite and its debris, and a few telalginite; the mineral–bituminous groundmass had a yellowish brown or brownish yellow fluorescence (Figure 4), indicating that the organic matter had strong oil generation potential. There were also some differences between the samples from the three wells. Compared with the FY1 well sample (Figure 4A–C), the NY1 well sample (Figure 4D–F) contained more lamalginite and its debris, and its mineral–bituminous groundmass had a stronger fluorescence, which indicated the NY1 well samples had a higher hydrocarbon generation potential since the maturity levels of the samples from the two wells were similar. From the perspective of macerals and mineral–bituminous groundmass fluorescence characteristics, the LY1 well sample (Figure 4G–I) was closer to the NY1 well sample (Figure 4D–F) but had a weaker fluorescence intensity, which is related to its higher maturity. The three wells are located in different sub-sags of the Dongying Sag, and there are certain differences in their sedimentary environments [29] (Li et al., 2019), which may be the main reason for their differences in kerogen macerals.
The samples from the three wells all contained fluorescence occurring mainly in the bedding plane micro-fissures or mineral pores (e.g., Figure 4B–H). In particular, the LY1 samples exhibited green, fluorescent halos deduced by the excitation of blue light (Figure 4J), indicating that free liquid oil was present in the shale matrix.
The mineral compositions of the samples from the three wells were also similar and were mainly clay and carbonate minerals, quartz, and feldspar (Figure 5). The clay mineral was characterized by the illite–montmorillonite interlayers, with a total content of 23–64% and an average of 42%. The carbonate mineral was mainly calcite and a small amount of dolomite and had a content range of 11–61%, with an average of 34%. The quartz content ranged from 4 to 32%, with an average of 17%. The feldspar content ranged from 1% to 12%, with an average of 5%. In addition, most samples contained a small amount of pyrite, with a range of 0–2.6% and an average of 1.3%. There were no clear relationships of TOC with clay minerals, carbonate minerals, and quartz + feldspar (Figure 6); there was also no clear correlation between clay minerals and quartz + feldspar content (Figure 7a). However, the carbonate mineral had a clear negative correlation with either the clay mineral or the quartz + feldspar (Figure 7b,c). These patterns reflected by the studied samples are similar to the results from Li [51] based on a large amount of data from the Dongying Sag. Clay minerals, quartz, and feldspar in the studied samples are typical terrigenous deposits, while carbonate minerals can be formed in depositional and diagenetic stages. A study conducted by Hua and Zeng [52] showed that cryptocrystalline and microcrystalline carbonates in the Dongying Sag are products of algae-induced carbonate precipitation. Teng [53] indicated that most of the carbon sources of calcite are related to biogas generated by methane bacterial activities based on the carbon and oxygen isotopic characteristics of calcite in shale samples from the Dongying Sag.
The shale samples contained a certain amount of EOM. The EOM range was 0.32–2.03% for the FY1 well sample, 0.48–0.98% for the NY1 well sample, and 0.54–5.24% for the LY1 well sample, with averages of 1.28%, 0.70%, and 2.34%, respectively. There was no clear correlation between the EOM and burial depth (Figure 8a), but there was an obvious positive correlation between the EOM/TOC and burial depth (Figure 8b). The total light hydrocarbon (sum of the saturate and aromatic hydrocarbon) and heavy hydrocarbon (sum of the resins and asphaltenes) contents were 60–80% and 20–40%, respectively. The former was positively correlated with the burial depth (Figure 8c), and the latter was negatively correlated with the burial depth (Figure 8d). This shows that the maturity (indicated by the burial depth) of the samples not only has an important impact on their EOM contents, but also affects the properties of their retained oil. Under the condition of the same TOC content, a higher maturity level can increase both the EOM content and total hydrocarbon proportion. This is of great significance for the development of shale oil (see Section 3.4 for further discussion).

3.2. Controlling of Shale Compositions on Retained Oil

Although there were some differences in maturity for the samples from the three wells, the EOM and S1 showed significant positive correlations with the TOC content (Figure 9). This implies that the organic matter content of shales has significant control over the retained oil. Since the correlation between the EOM and TOC (with a correlation coefficient of 0.87) was significantly better than that between the EOM and S1 (with a correlation coefficient of 0.60), it is reasonable to use the EOM further to discuss the influence of minerals on oil retention in the studied shales. The related data are presented in Figure 10. Three samples from well LY1 were silty shale (actually a dominated, layered siltstone, interbedded with laminated shale) with a greater EOM content (see Table 1); their EOM deviated from the data of the other samples in Figure 10. Except for the three laminated samples, the EOM of the other samples had a certain positive correlation with the clay minerals and a negative correlation with the carbonate minerals (Figure 10a,b). This further confirms that the clay minerals have a certain retention effect on the retained oil in shale reservoirs, while the oil retention effect is very weak for the carbonate minerals. The results are consistent with the experimental data from other literature. For example, Li et al. [54] reported that the oil adsorption amount was 18 mg/g for clay minerals, 3 mg/g for quartz, and 1.8 mg/g for carbonate minerals, while Wang et al. [18] reported that the oil adsorption capacity of kerogen was still as high as 179 mg/g even in an aqueous state and Han et al. [55] believed that active kerogen in shales provides the most active adsorption site for retained oil. Therefore, kerogen adsorption would be the main mechanism for oil retention in the studied shales, followed by the adsorption of clay minerals.
The EOM also had a positive correlation with quartz + feldspar (Figure 10c) or quartz (Figure 10d). Although quartz and feldspar have a weak adsorption capacity for oil, as brittle minerals, they generally develop intergranular pores for the storage of retained oils [56,57].

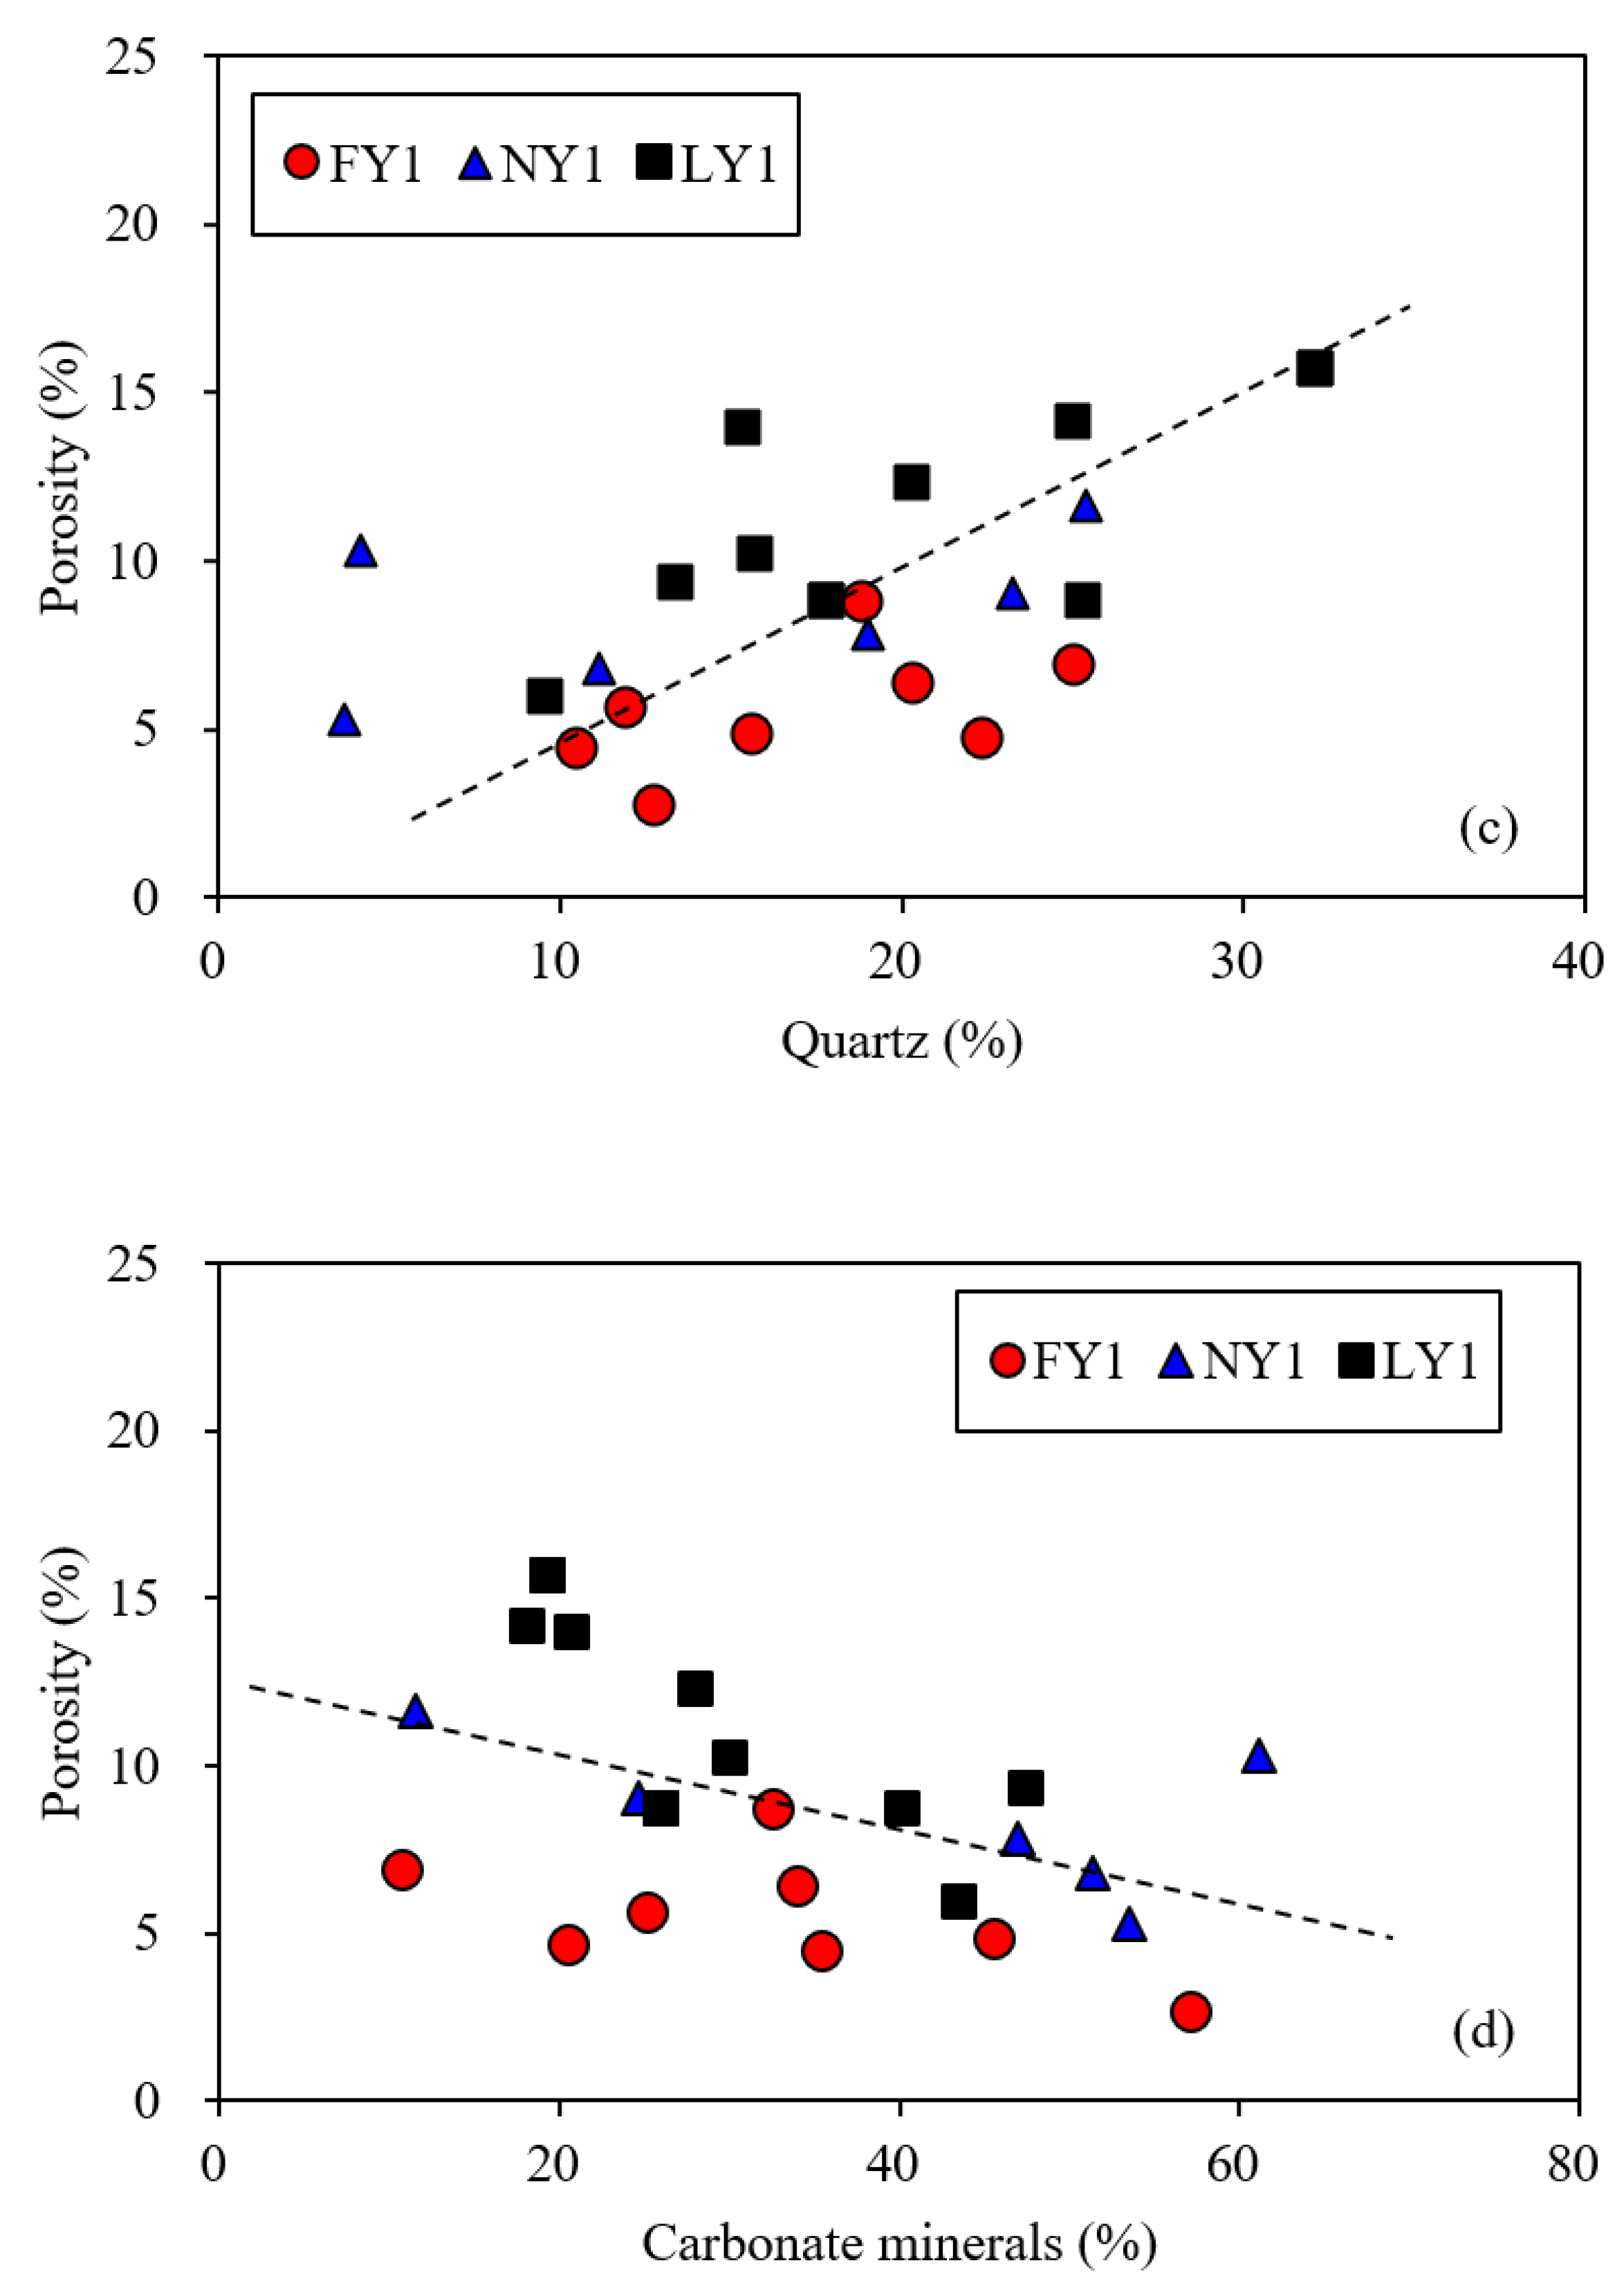
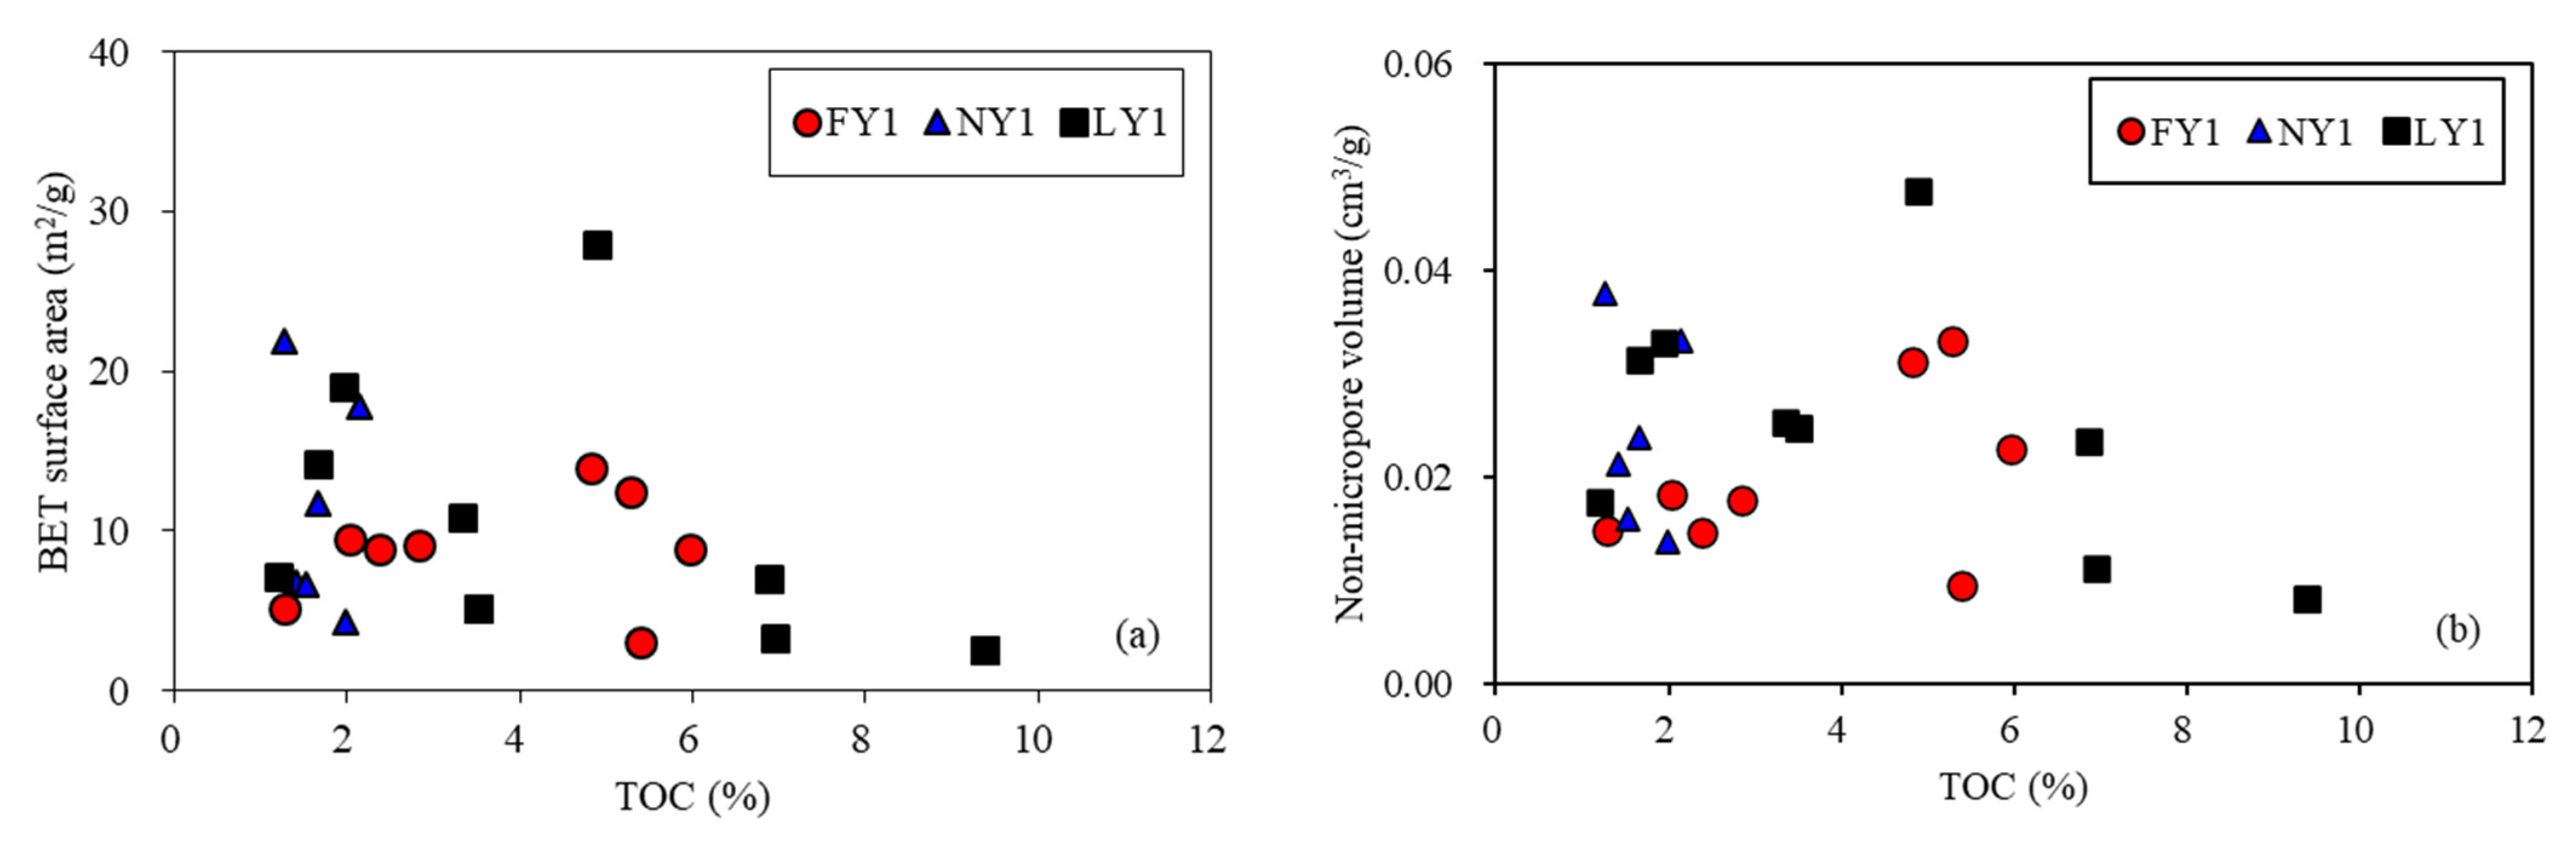
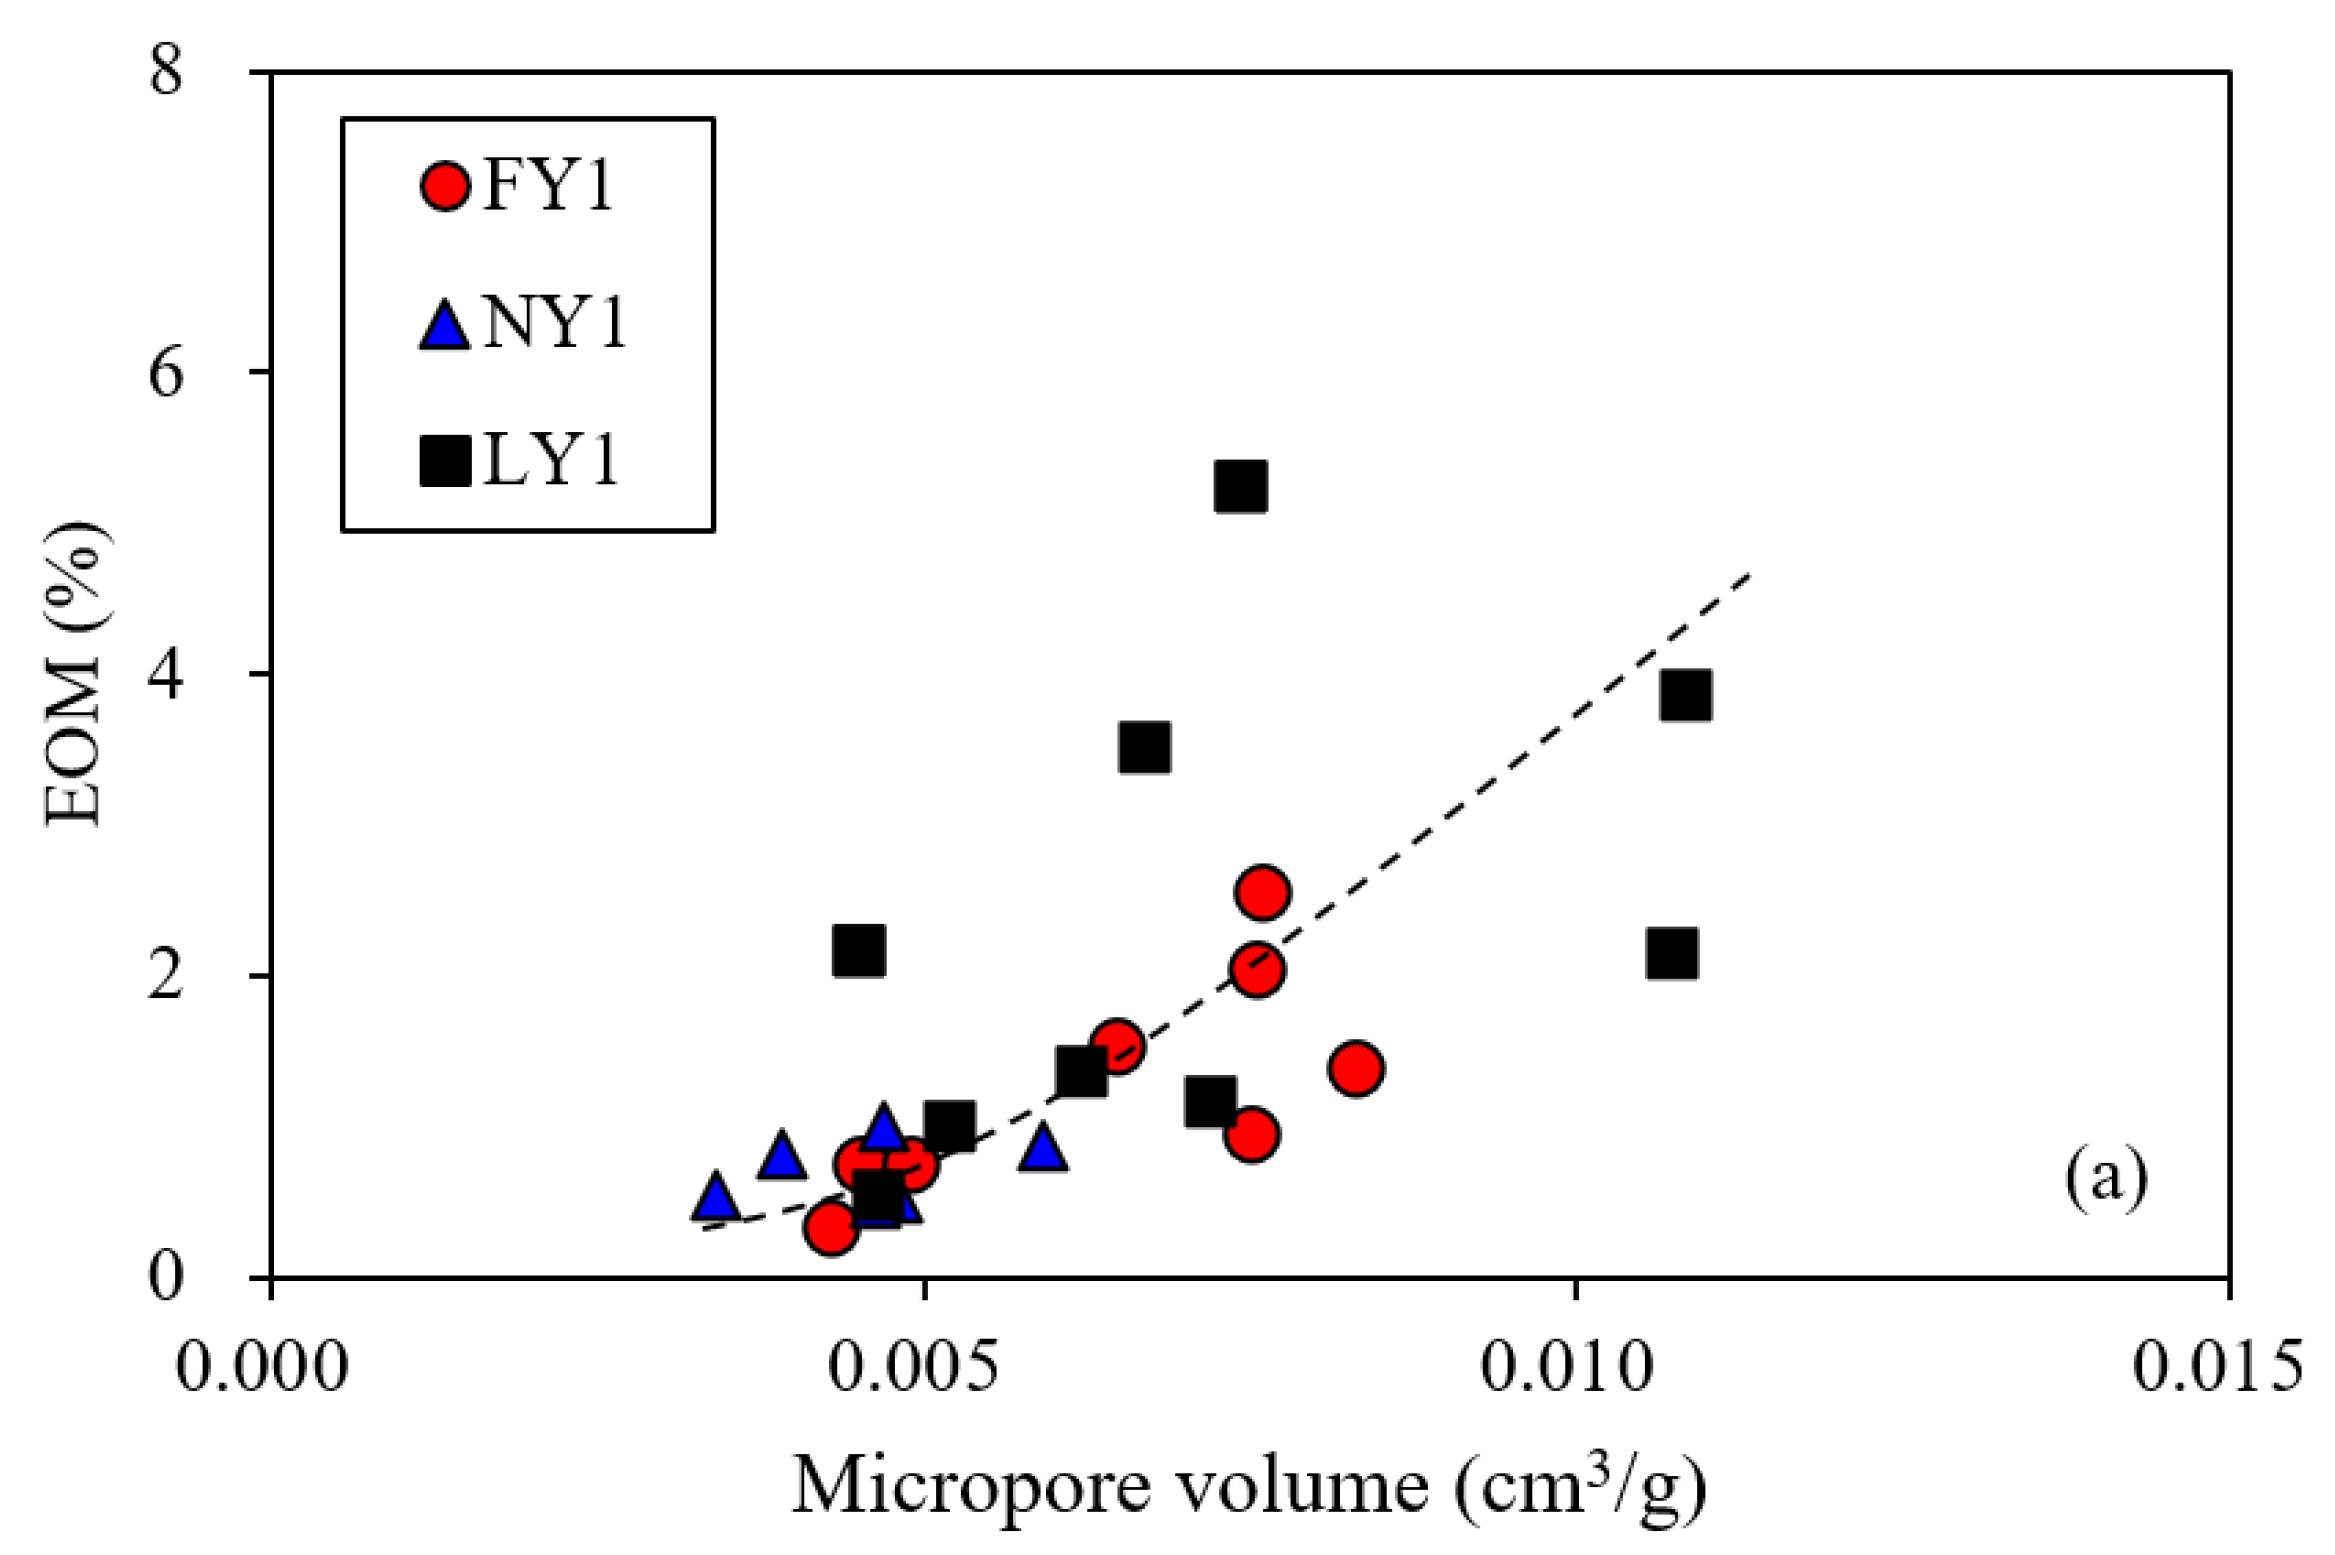
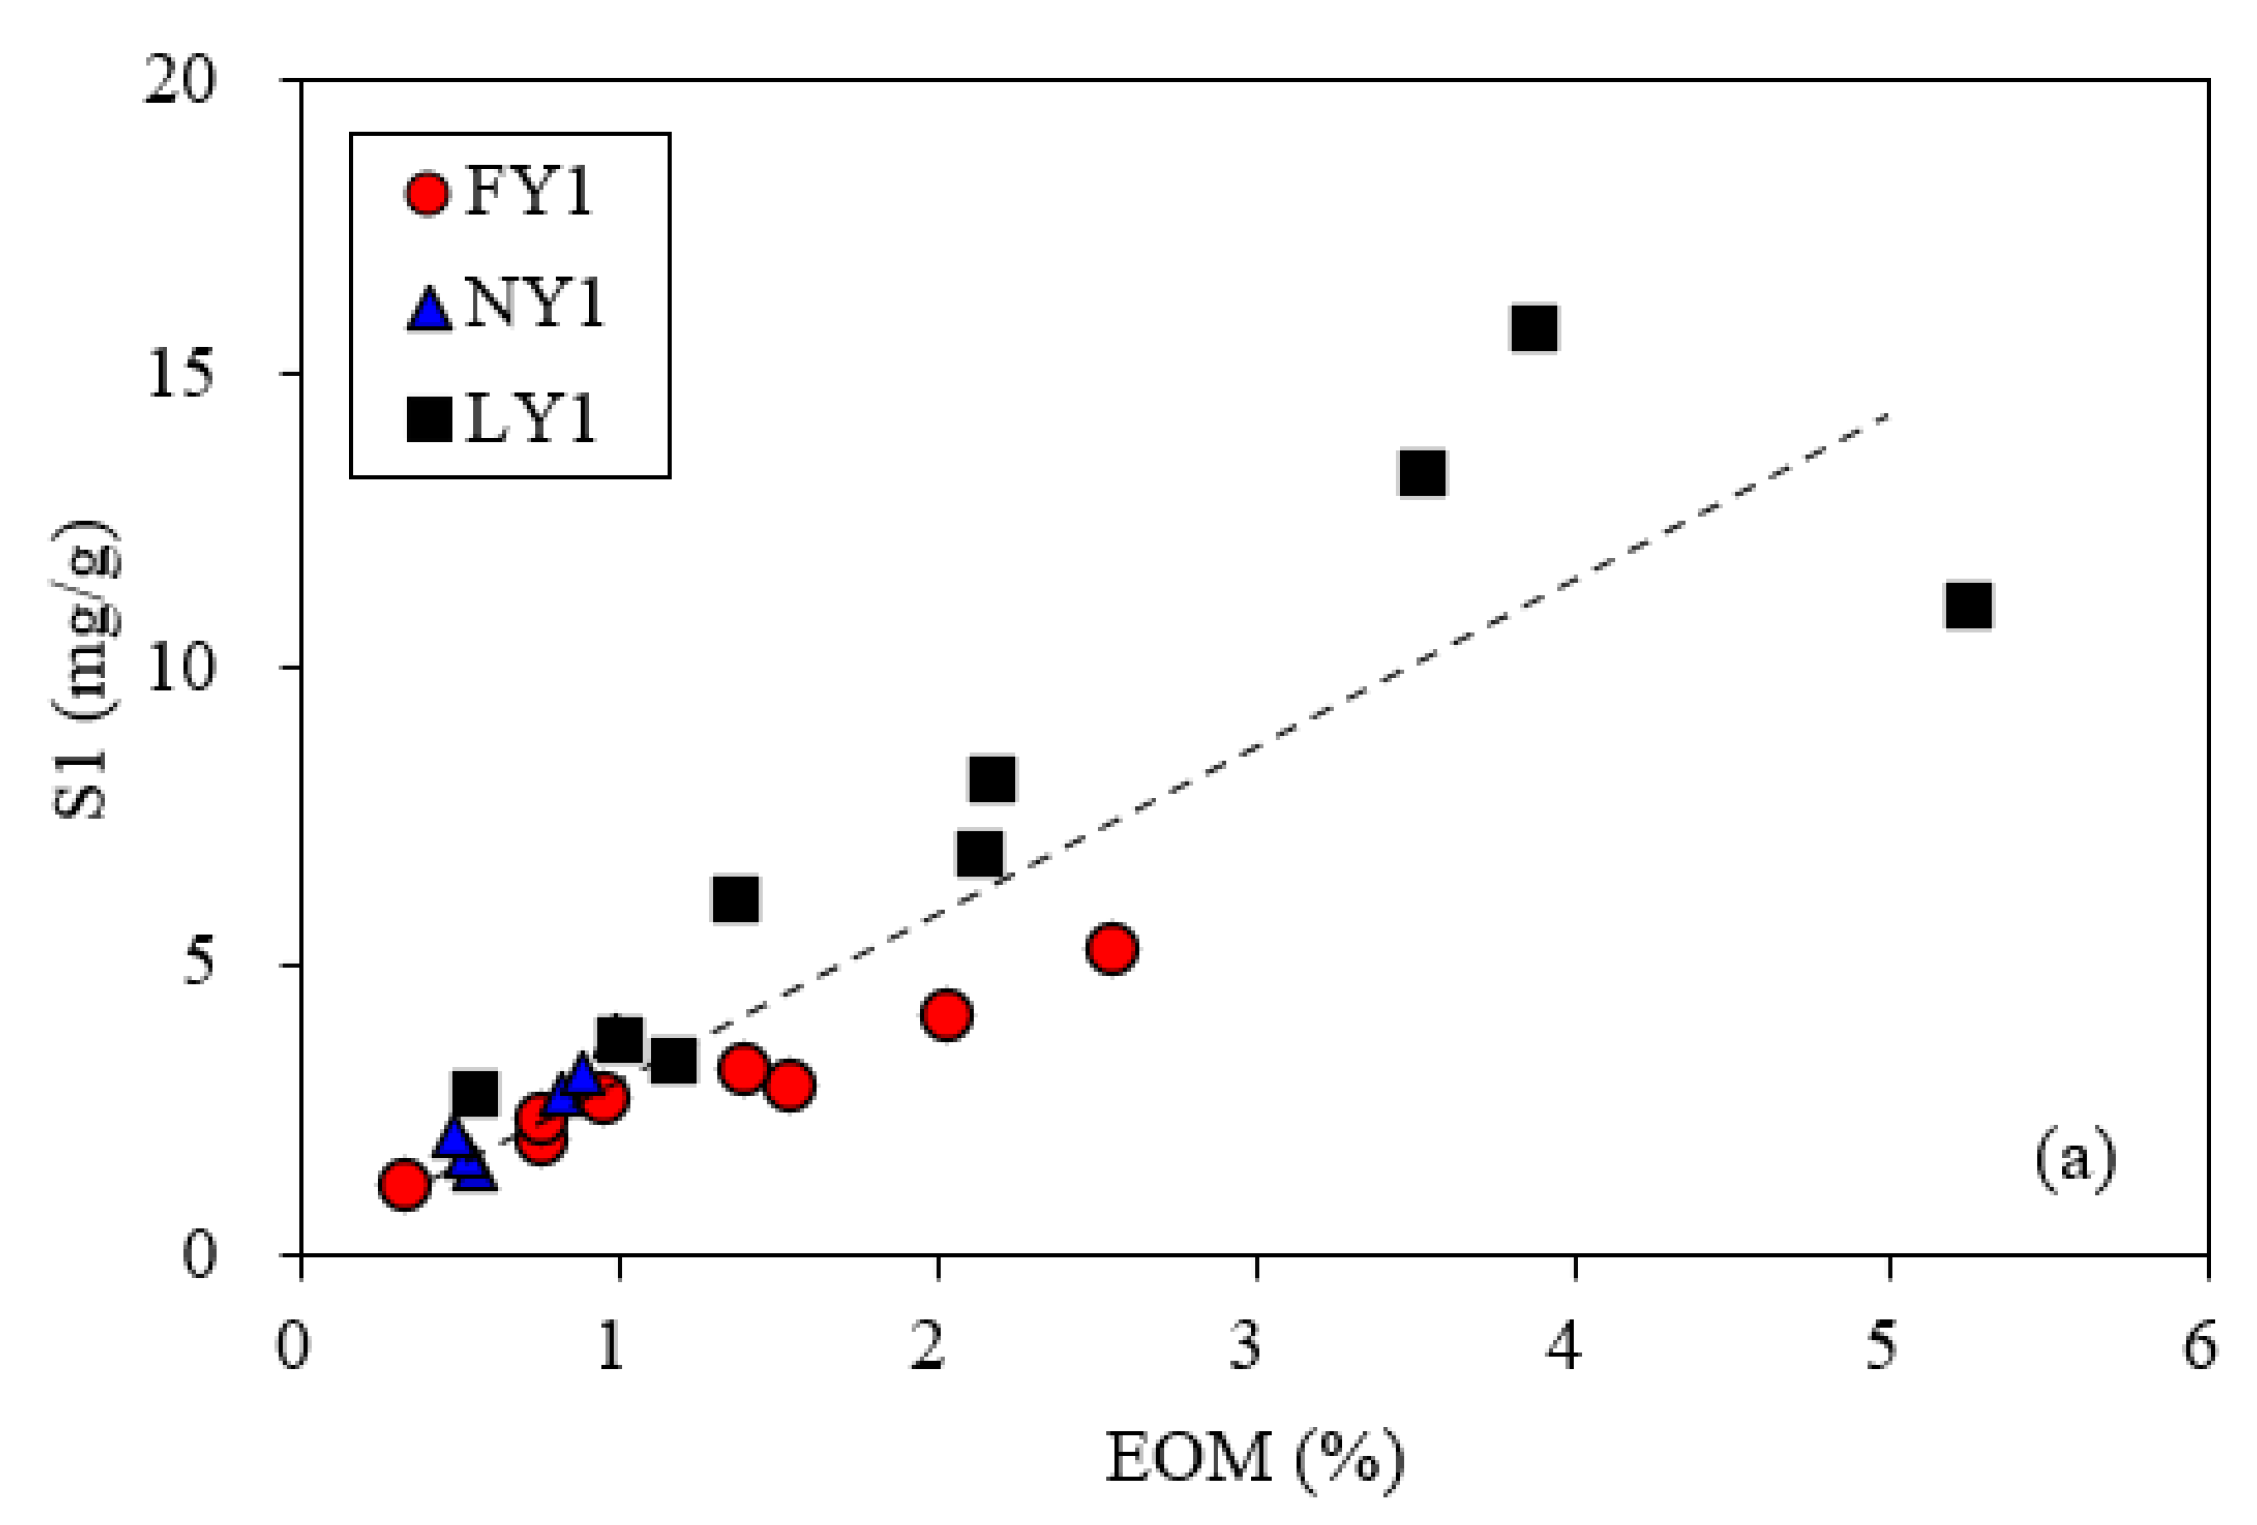
3.3. Pore Characteristics and Their Relationship with Retained Oil

For the studied samples, the porosity was 2–16% with an average of 8.48%, their BET specific surface area was 2.57–27.96 m2/g with an average of 9.81 m2/g, their non-micropore volume was 0.008–0.048 cm3/g with an average of 0.023 cm3/g, and their micropore volume was 0.0034–0.011 cm3/g with an average of 0.0062 cm3/g. The porosity had a positive relationship with the non-micropore volume (Figure 11a), while its correlation with the micropore volume was not obvious (Figure 11b). Thus, the non-micropores were well developed in the samples, while the micropores were barely developed; the porosities were mainly contributed by the non-micropore. The non-micropores accounted for an average of 51–88% of the total pore volume, with an average of 79%.
The porosity had no obvious correlation with the TOC (Figure 12a) but had a weak positive correlation with the clay minerals and quartz (Figure 12b,c) and a weak negative correlation with the carbonate minerals (Figure 12d). The TOC was not correlated with the BET specific surface areas and non-micropore volumes (Figure 13a,b) but showed a clear positive correlation with the micropore volumes (Figure 13c). The clay minerals had positive correlations with the BET specific surface areas and non-micropore volumes but presented a poor correlation with the micropore volumes (Figure 13d–f). Quartz had a weak positive correlation with the non-micropore volumes and a weak negative correlation with the micropore volumes (Figure 13g,h). These results further indicated that the non-micropores of the samples were mainly hosted by clay minerals and may also be related to quartz. Meanwhile, the BET surface areas were mainly contributed by clay minerals, and the micropore volumes mainly came from the organic matter. Although the above correlations existed, the correlation coefficients were low, indicating that the factors affecting the pore structure parameters of the samples are complex and not controlled by a single factor. According to the statistical results of different types of pores in shales from the Dongying Sag by Liu et al. [17], the pores related to clay minerals (interstratified pores and shrinkage pores) had a main contribution to the total porosity (35–69%), while the organic matter pores accounted for less than 10% of the total porosity.
Figure 14 and Figure 15 show the relationships of EOM with the porosity and pore structure parameters, respectively, for the studied samples. The correlation between the porosity and the EOM was not obvious (Figure 14a), but there was a clear positive correlation between the porosity and the EOM/TOC (Figure 14b). Liu et al. [17] investigated the reservoir characteristics of shales from the Dongying Sag and found a positive correlation between the porosity and the S1/TOC. Thus, the porosity has a constraint, although not crucial, on the retained oil for the studied samples. Combined with Figure 9, it can be considered that the EOM in the shales exists mainly in their kerogen in the form of swelling (adsorption and absorption states) following infilling of the inorganic pores.
There was a positive correlation between the EOM and the micropore volumes (Figure 15a), indicating that a portion of the micropores (should mainly be organic matter micropores) was exposed after the EOM in the shales was removed by solvent extraction. The correlations of the EOM with the non-micropore volumes and BET surface areas were not clear (Figure 15b,c), while there seemed to be a certain positive correlation between the EOM/TOC and the non-micropore volumes (Figure 15d); however, this correlation was significantly lower than that between the porosity and the EOM/TOC (Figure 14b). This further indicated that the non-micropores (mainly related to minerals) also contained some EOM. Wang et al. [18] found that oil in shales can exist in pores from several nanometers to more than 10 microns, with most of it in pores < 100 nm.

3.4. Implications for Shale Oil Exploration and Development

Although it is difficult to evaluate the loss of light hydrocarbons for the studied shale, the S1 and EOM of the shales can be used to indicate their retained oils, and there is an obviously positive correlation between the two parameters (Figure 16). Based on the data of the studied samples, the S1–TOC crossover diagram proposed by Jarvie [58] is exhibited in Figure 17. In this figure, it is generally believed that shales with S1 (mg/g) > TOC (%) or oil saturation index (OSI = S1/TOC) > 100 mg/g TOC have shale oil potentials [58]. For the FY1 samples with a burial depth range of 3172–3373 m, their S1 was less than their TOC. For the NY1 samples with a burial depth range of 3342–3482 m, their S1 was slightly greater than their TOC. For the LY1 samples with a burial depth range of 3600–3835 m, their S1 was much greater than their TOC (Figure 17a). Thus, the burial depth (i.e., maturity) significantly controls the exploitability of shale oil in the Dongying Sag. In addition, the influence of lithologies and sedimentary textures of the shales cannot be ignored, although a discussion was not extended here since there are quite a few papers related to this topic (e.g., [9,14,15,25,27,28,29,31,59]). Based on Figure 17a, the crossover effect of the three silty shale samples from the LY1 well with a lower depth was more obvious than that of the other shale samples with a deeper burial depth (i.e., a greater difference between S1 and TOC).
During the drilling process or persevered under room conditions, the S1 of shale samples was more significantly affected by surrounding environments compared with the EOM; thus, the EOM of shale samples was more accurate for evaluating their shale oil potentials. According to the correlation equation between the EOM and S1 (with a correlation coefficient of 0.92) of the studied samples in Figure 16a, S1 can be calculated by the EOM. The S1–TOC crossover diagram based on the calculated S1 (Figure 17b) is very similar to Figure 17a.
According to the linear correlation equation between S1/TOC and EOM/TOC in Figure 16b, when S1 = 100 mg/g TOC, the corresponding EOM is 320 mg/g TOC. If this EOM value is considered as an alternative oil saturation threshold for the studied shales, the variation in the EOM/TOC with burial depth is very similar to that of the S1/TOC with burial depth (Figure 18). Therefore, for a shale oil block, when the EOM data are available and the loss of S1 is high, the EOM/TOC can be applied to evaluate the shale oil potential.
The mobility and recovery efficiency of shale oils are closely correlated with shale permeability [60,61]. The permeability of shales is generally low and anisotropic and is affected by several factors, including the burial depth and/or maturity, organic and inorganic compositions, fluid properties and pressure, lithology and sedimentary textures, and pore structure and compressibility of shales [62,63,64]. Zhang et al. [23], from the perspective of formation energy, believed that oil in shales with a depth of >2800 m in the Dongying Sag is movable and shale strata with a depth of >3400 m are favorable targets for shale oil exploration and development. He et al. [28] used the original and loss contents of the light hydrocarbons as the shale oil fluidity index in the Dongying Sag and considered that the shale oil in the ES41 strata was more exploitable than that in the ES33 strata. Hu et al. [24] indicated that the permeability of shale samples with a lamination texture is nearly 20 times larger than the matrix permeability. Zhang et al. [31] proposed that organic-rich laminated shale reservoirs with a depth of >3200 m (or Ro > 0.70%) in the Dongying Sag can be regarded as sweet spots of shale oils. In addition, during the thermal evolution stages of hydrocarbon generation and expulsion, shale reservoirs generally contain certain amounts of pore water [62,65,66,67]. Because pore water and hydrocarbons concomitantly occupy the pore system of a shale reservoir, the pore water would reduce pore spaces, block the connectivity of the shale pore system, and change the interface between hydrocarbons and pore walls [68,69,70], thus significantly affecting the accumulation and exploration of shale oils. According to the results of this study, kerogen in shales in the Dongying Sag plays a key role in controlling oil retention. EOM mainly exists in kerogen in the form of swelling, and there is obviously retained oil in the pores of clay minerals, both of which are adverse for the development of shale oil. Although the exploitability of shale oil in the Dongying Sag is restricted by many factors based on comprehensive theoretical evaluation and development data, the burial depth (or maturity) of the shales is more decisive. According to our results, combined with previous data, the burial depth of a favorable shale oil reservoir should be >3500 m (or Ro > 0.90%) and the interlayer (siltstone, carbonate rock) in shales or silty shales can be considered sweet spots. In particular, shales with layered and/or laminated textures, as well as being rich in carbonate mineral contents, will have higher development potential.

4. Conclusions

This study collected 23 Eocene–Oligocene Shahejie shale samples from wells Fanye 1 (FY1), Niuye 1 (NY1), and Liye 1 (LY1) in the Dongying Sag, and the maturity, organic and inorganic composition, porosity, and pore structures of the shales and their influences on the retained oils were investigated. The following conclusions were obtained.
  • This set of shales has type I–IIa kerogen with plenty of lamalginite and its debris, and the maturity of these shales spans the main oil generation window with Ro values ranging from 0.70% to 1.0%. In addition, the non-micropores that are mainly developed by inorganic minerals are greater than the micropores that are largely contributed by organic matter.
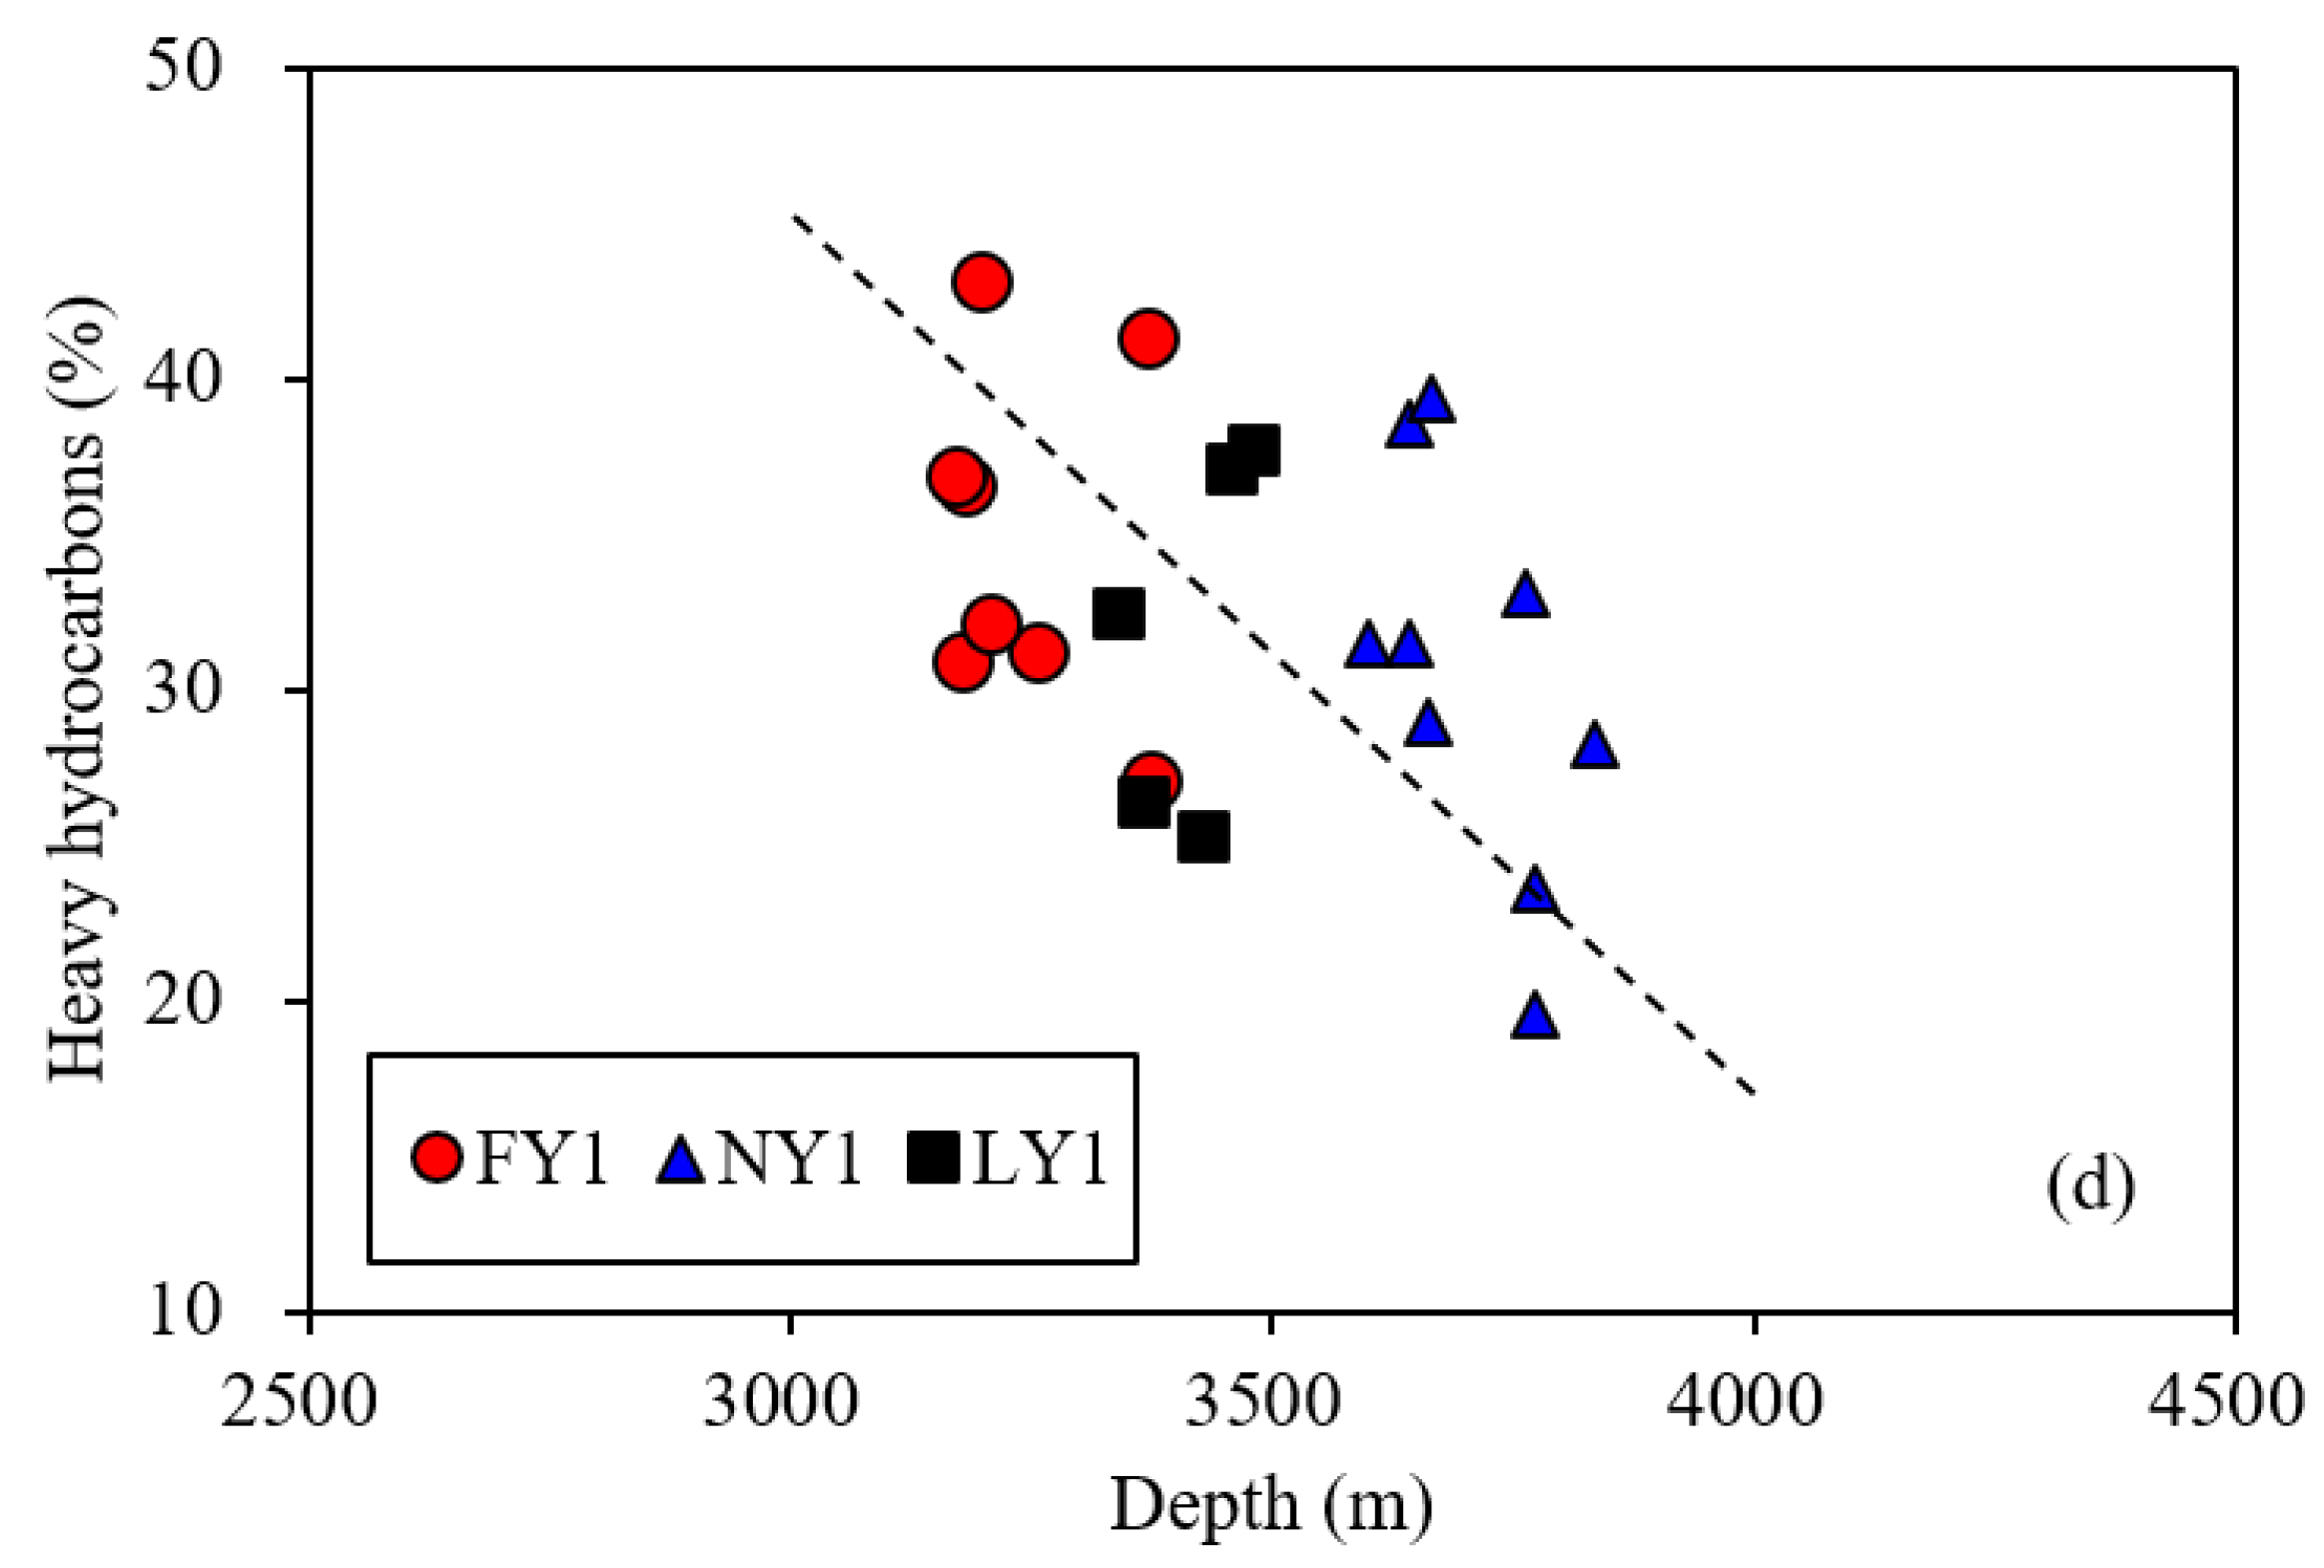
  • The retained oils are mostly stored in the organic matter micropores resulting from the volume swelling of kerogen. Moreover, the content and mobility of the retained oils in shales are mainly controlled by their burial depth.
  • In the Dongying Sag, shales with burial depths of greater than 3500 m (Ro > 0.90%) are predicted to have shale oil development potential, especially for shales with a siltstone or carbonate rock interlayer and carbonate-rich shales with laminated or layered textures.

Author Contributions

Data curation, Q.F.; Investigation, P.G.; Writing—review & editing, P.C. and X.X. All authors have read and agreed to the published version of the manuscript.

Funding

This research was funded by the National Natural Science Foundation of China, grant number U19B6003-03, U1810201, 42030804, 41402116; the Natural Science Foundation of Guangdong Province, grant number 2021A1515011381.

Institutional Review Board Statement

Not applicable.

Informed Consent Statement

Not applicable.

Data Availability Statement

Not applicable.

Acknowledgments

Great thanks are given to Wang Weiqing from the Research Institute of Petroleum Exploration and Development, Sinopec Shengli Oil Field Company, China, for providing samples and some basic data and to Wang Maolin for the analysis of some samples.

Conflicts of Interest

The authors declare no conflict of interest.

References

  1. Zhou, Q.F.; Jin, Z.J.; Yang, G.F.; Dong, N.; Shang, Z.C. Current situation and prospect of shale oil exploration and development in the United States. Oil Gas Geol. 2019, 40, 469–477. (In Chinese) [Google Scholar]
  2. EIA. Natural Gas Weekly Update [EB/OL]. Available online: https://www.eia.gov/naturalgas/weekly (accessed on 21 February 2019).
  3. EIA. Weekly Petroleum Status Report [EB/OL]. Available online: https://www.eia.gov/petroleum/supply/weekly (accessed on 21 February 2019).
  4. Jin, Z.J.; Bai, Z.R.; Gao, B. Has China ushered in the shale oil and gas revolution? Oil Gas Geol. 2019, 40, 451–458, (In Chinese with English Abstract). [Google Scholar]
  5. Zou, C.N.; Zhao, Q.; Cong, C.C.; Wang, H.Y.; Shi, Z.S.; Wu, J.; Pan, S.Q. Progress, potential and prospect of shale gas development in China. Nat. Gas Ind. 2021, 41, 1–14. (In Chinese) [Google Scholar]
  6. Zhao, W.Z.; Hu, S.Y.; Hou, L.H.; Yang, T.; Li, X.; Guo, B.C.; Yang, Z. Types of continental shale oil and its resource potential and boundary with tight oil in China. Pet. Explor. Dev. 2020, 47, 1–10. (In Chinese) [Google Scholar] [CrossRef]
  7. Zou, C.N.; Yang, Z.; Cui, J.W. Formation mechanism, geological characteristics, and development strategy of non–marine shale oil in China. Pet. Explor. Dev. 2013, 40, 14–26. (In Chinese) [Google Scholar] [CrossRef]
  8. Fu, X. Current status, challenges and prospects of shale oil exploration and development in China. Oil Drill. Prod. Technol. 2015, 37, 58–62. (In Chinese) [Google Scholar]
  9. Wang, M.; Guo, Z.Q.; Jiao, C.X.; Lu, S.F.; Li, J.B.; Xue, H.T.; Li, J.J.; Li, J.Q.; Chen, G.H. Exploration progress and geochemical features of lacustrine shale oils in China. J. Pet. Sci. Eng. 2019, 178, 975–986. [Google Scholar] [CrossRef]
  10. Zhao, W.Z.; Zhu, R.K.; Hu, S.Y.; Hou, L.H.; Wu, S.T. Reservoir formation differences between continental organic rich shale and mudstone and its significance in shale oil evaluation. Pet. Explor. Dev. 2020, 47, 1–11. (In Chinese) [Google Scholar] [CrossRef]
  11. Sheng, X.; Chen, X.; Zhang, X.W.; Jia, Y.Y.; Luo, X. Prospects and challenges of continental shale oil development in China. Pet. Geol. Exp. 2015, 37, 267–271. (In Chinese) [Google Scholar]
  12. Zhang, L.Y.; Li, Z.; Li, J.Y. Exploitable oil and gas resources in Paleogene shale in Dongying Sag. Nat. Gas Geosci. 2012, 23, 1–13. (In Chinese) [Google Scholar]
  13. Zhu, R.F.; Zhang, L.Y.; Li, Z.; Wang, R.; Zhang, S.C.; Zhang, L. Evaluation of shale oil resource potential in continental faulted basins—A case study of the lower sub–member of Es3 formation in Dongying Sag. Pet. Geol. Recovery Effic. 2019, 26, 129–136. (In Chinese) [Google Scholar]
  14. Chen, S.Y.; Liu, Y.; Zhang, S. Microstructural Characteristics of Dongying Depression. Sci. Technol. Eng. 2015, 15, 35–47. (In Chinese) [Google Scholar]
  15. Xie, X.M.; Li, M.W.; Littke, R.; Huang, Z.K.; Ma, X.X.; Jiang, Q.; Snowdon, L.R. Petrographic and geochemical characterization of microfacies in a lacustrine shale oil system in the Dongying Sag, Jiyang Depression, Bohai Bay Basin, eastern China. Int. J. Coal Geol. 2016, 165, 49–63. [Google Scholar] [CrossRef]
  16. Ning, F.X.; Wang, X.J.; Hao, X.F.; Yang, W.Q.; Ding, J.H. Lithofacies association characteristics of fine–grained sedimentary rocks in Dongying Sag. J. Southwest Pet. Univ. (Nat. Sci. Ed.) 2020, 42, 55–65. (In Chinese) [Google Scholar]
  17. Liu, H.M.; Zhang, S.; Bao, Y.S.; Fang, Z.W.; Yao, S.P.; Wang, Y. Geological characteristics and effectiveness of shale oil reservoir in Dongying Sag. Oil Gas Geol. 2019, 40, 512–524. (In Chinese) [Google Scholar]
  18. Wang, H.J.; Wu, W.; Chen, T.; Yu, J.; Pan, J.N. Pore structure and fractal analysis of shale oil reservoirs: A case study of the Paleogene Shahejie Formation in the Dongying Depression, Bohai Bay, China. J. Pet. Sci. Eng. 2019, 177, 711–718. [Google Scholar] [CrossRef]
  19. Zhang, P.F.; Lu, S.F.; Li, J.Q. Characterization of pore size distributions of shale oil reservoirs: A case study from Dongying Sag, Bohai Bay basin, China. Mar. Pet. Geol. 2019, 100, 297–308. [Google Scholar] [CrossRef]
  20. Zhang, S.; Liu, F.M.; Wang, M.; Liu, X.J.; Liu, H.L.; Bao, Y.S.; Wang, W.Q.; Li, R.Z.; Luo, X.; Fang, Z.W. Shale pore characteristics of Shahejie Formation: Implication for pore evolution of shale oil reservoirs in Dongying Sag, north China. Pet. Res. 2019, 4, 113–124. [Google Scholar] [CrossRef]
  21. Zhang, S.L.; Yan, J.P.; Hu, Q.H.; Wang, J.; Tian, T.H.; Chao, J.; Wang, M. Integrated NMR and FE–SEM methods for pore structure characterization of Shahejie shale from the Dongying Depression, Bohai Bay Basin. Mar. Pet. Geol. 2019, 100, 85–94. [Google Scholar] [CrossRef]
  22. Zhang, P.F.; Lu, S.F.; Li, J.Q.; Chang, X.C.; Li, J.J.; Li, W.B.; Chen, G.; Wang, S.; Feng, W.J. Broad ion beam–scanning electron microscopy pore microstructure and multifractal characterization of shale oil reservoir: A case sample from Dongying Sag, Bohai Bay Basin, China. Energy Explor. Exploit. 2020, 38, 613–628. [Google Scholar] [CrossRef] [Green Version]
  23. Zhang, L.Y.; Bao, Y.S.; Li, J.Y.; Li, Z.; Zhu, R.F.; Zhang, J.G. Mobility of lacustrine shale oil—A case study of Dongying Sag of Jiyang Depression in Bohai Bay Basin. Oil Explor. Dev. 2014, 41, 641–649. (In Chinese) [Google Scholar]
  24. Hu, Q.H.; Zhang, Y.X.; Meng, X.H.; Li, Z.; Xie, Z.H.; Li, M.W. Characterization of micro–nano pore networks in shale oil reservoirs of Paleogene Shahejie Formation in Dongying Sag of Bohai Bay Basin, East China. Pet. Explor. Dev. 2017, 44, 720–730. [Google Scholar] [CrossRef]
  25. Sun, H.Q. Exploration practice and cognitions of shale oil in Jiyang Depression. China Pet. Explor. 2017, 22, 1. (In Chinese) [Google Scholar]
  26. Wang, M.; Ma, R.; LIJ, B.; Lu, S.F.; Li, C.M.; Guo, Z.Q.; Li, Z. Occurrence mechanism of lacustrine shale oil in the Paleogene Shahejie Formation of Jiyang Depression, Bohai Bay Basin, China. Pet. Explor. Dev. 2019, 46, 833–846. [Google Scholar] [CrossRef]
  27. Zhang, S. Shale oil enrichment elements and geological dessert types in Jiyang Depression. Sci. Technol. Eng. 2021, 21, 504–511. (In Chinese) [Google Scholar]
  28. He, J.Y.; CaiIJ, G.; Lei, T.Z.; Zhang, S.P.; Zhang, C.X. The characteristics of soluble organic matter and shale oil dessert prediction. Pet. Geol. Recovery Effic. 2019, 26, 174–183. [Google Scholar]
  29. Li, M.W.; Chen, Z.H.; Ma, X.X.; Cao, T.T.; Qian, M.H.; Jiang, Q.G.; Tao, G.L.; Li, Z.N.; Song, G.Q. Shale oil resource potential and oil mobility characteristics of the Eocene-Oligocene Shahejie Formation, Jiyang Super-Depression, Bohai Bay Basin of China. Int. J. Coal Geol. 2019, 204, 130–143. [Google Scholar] [CrossRef]
  30. Song, M.S.; Liu, H.M.; Wang, Y.; Liu, Y.L. Enrichment rules and exploration practices of Paleogene shale oil in Jiyang Depression, Bohai Bay Basin, China. Pet. Explor. Dev. 2020, 47, 242–253. [Google Scholar] [CrossRef]
  31. Zhang, S.; Liu, H.M.; Liu, Y.L.; Wang, Y.S.; Wang, M.; Bao, Y.S.; Hu, Q.H.; Li, Z.; Zhang, S.P.; Yao, S.P.; et al. Main controls and geological sweet spot types in Paleogene shale oil rich areas of the Jiyang Depression, Bohai Bay basin, China. Mar. Pet. Geol. 2020, 111, 576–587. [Google Scholar] [CrossRef]
  32. Liu, H.M.; Zhang, S.; Song, G.Q.; Wang, X.J.; Teng, J.B.; Wang, M.; Bao, Y.S.; Yao, S.P.; Wang, W.Q.; Zhang, S.P.; et al. Effect of shale diagenesis on pores and storage capacity in the Paleogene Shahejie Formation, Dongying Depression, Bohai Bay Basin, east China. Mar. Pet. Geol. 2019, 103, 738–752. [Google Scholar] [CrossRef]
  33. Sun, J.; Xiao, X.M.; Cheng, P.; Tian, H. Formation and evolution of nanopores in shales and its impact on retained oil during oil generation and expulsion based on pyrolysis experiments. J. Pet. Sci. Eng. 2019, 176, 509–520. [Google Scholar] [CrossRef]
  34. Ning, F.X. Difference analysis on different types of shale oils in Jiyang depression. Pet. Geol. Recov. Effic. 2014, 21, 6–9. (In Chinese) [Google Scholar]
  35. Song, M.S. Shale oil exploration practice and current situation in Jiyang Depression. Pet. Geol. Recovery Effic. 2019, 26, 1–12. (In Chinese) [Google Scholar]
  36. Sun, H.Q.; Cai, X.Y.; Zhou, D.H.; Gao, B.; Zhao, P.R. Sinopec shale oil exploration practice and prospect. China Pet. Explor. 2019, 24, 569–575. (In Chinese) [Google Scholar]
  37. Liu, Y.L.; Zhang, S.; Liu, H.M.; Wang, W.Q.; Bao, Y.S.; Tang, D.; Liu, P.; Wang, Y.; Li, Z.; Wang, M.; et al. Basic characteristics and exploration prospect of organic–rich shales in steep slope zone of faulted basin—A case study of Jiyang Depression. J. China Univ. Min. Technol. 2021, 50, 1146–1156. (In Chinese) [Google Scholar]
  38. Behar, F.; Beaumont, V.; De Penteado, B. Rock-Eval 6 technology: Performances and developments. Oil Gas Sci. Technol. 2001, 56, 111–134. [Google Scholar] [CrossRef]
  39. Taylor, G.H.; Teichmüller, M.; Davis, A.; Diessel, C.F.K.; Littke, R.; Robert, P. Organic Petrology; Gebrüder Borntraeger: Berlin, Germany, 1998. [Google Scholar]
  40. Tang, X.; Zhang, J.C.; Jiang, Z.X.; Zhao, X.Z.; Liu, K.Y.; Zhang, R.F.; Xiong, J.Y.; Du, K.F.; Huang, Z.L.; Yu, J.D. Characteristics of solid residue, expelled and retained hydrocarbons of lacustrine marlstone based on semi-closed system hydrous pyrolysis: Implications for tight oil exploration. Fuel 2015, 162, 186–193. [Google Scholar] [CrossRef]
  41. Pecharsky, V.K.; Zavalij, P.Y. Fundamentals of Powerder Diffraction and Structural Characterization of Minerals; Kluwer Academic Publishers: New York, NY, USA, 2003; p. 713. [Google Scholar]
  42. Chalmers, G.R.L.; Bustin, R.M.; Power, I.M. Characterization of gas shale pore systems by porosimetry, pycnometry, surface area, and field emission scanning electron microscopy/transmission electron microscopy image analyses: Examples from the Barnett, Woodford, Haynesville, Marcellus, and Doigunits. AAPG Bull. 2012, 96, 1099–1119. [Google Scholar] [CrossRef]
  43. Pan, L.; Xiao, X.; Tian, H.; Zhou, Q.; Cheng, P. Geological models of gas in place of the Longmaxi shale in Southeast Chongqing, South China. Mar. Pet. Geol. 2016, 73, 433–444. [Google Scholar] [CrossRef]
  44. Cheng, P.; Tian, H.; Xiao, X.M.; Gai, H.F.; Li, T.F.; Wang, X. Water distribution in overmature organic–rich shales: Implications from water adsorption experiments. Energy Fuels 2017, 31, 13120–13132. [Google Scholar] [CrossRef]
  45. Wu, L.Y.; Gu, X.Z.; Sheng, Z.W.; Fan, C.L.; Cheng, K.M. Rapid Quantitative Evaluation of Pyrolysis of Oil Source Rocks; Science Press: Beijing, China, 1986; pp. 1–198. [Google Scholar]
  46. Snowdon, L.R. Rock-Eval Tmax suppression: Documentation and amelioration. AAPG Bull. 1995, 79, 1337–1348. [Google Scholar]
  47. Cao, Z.; Liu, G.; Kong, Y.; Wang, C.; Niu, Z.; Zhang, J.; Geng, C.; Shan, X.; Wei, Z. Lacustrine tight oil accumulation characteristics: Permian Lucaogou formation in Jimusaer Sag, Junggar Basin. Int. J. Coal Geol. 2016, 153, 37–51. [Google Scholar] [CrossRef]
  48. Lo, H.B. Correction criteria for the suppression of vitrinite reflectance in hydrocarbon-rich kerogen: Preliminary guidelines. Org. Geochem. 1993, 20, 653–670. [Google Scholar] [CrossRef]
  49. Guo, R.T.; Wang, J.B.; Gao, X.L.; Lu, H.Y.; Xiao, X.M. Application of laser probe technology to evaluate the maturity of source rocks—A case study of source rocks in Dongying sag. Prog. Nat. Sci. 2003, 13, 626–630. (In Chinese) [Google Scholar]
  50. Yan, Y.H.; Zou, Y.R.; Qu, Z.Y.; Cai, Y.L.; Wei, Z.F.; Peng, P.A. Experimental study on hydrocarbon retention and expulsion of source rocks in the fourth member of Shahejie Formation in the Dongying Sag. Geochemistry 2015, 44, 79–86. (In Chinese) [Google Scholar]
  51. Li, Z. Comparison of oil bearing and mobility of shale with different lithology in continental basin—A case study of the upper member of Forth section of Paleogene Shahejie Formation in Dongying Sag of Bohai Bay Basin. Pet. Exp. Geol. 2020, 42, 545–552. (In Chinese) [Google Scholar]
  52. Hua, B.; Zeng, J.Q. Carbonate genesis and geological significance of shale in Dongying Sag. Fault–Block Oil Gas Field 2019, 26, 453–458. (In Chinese) [Google Scholar]
  53. Teng, J.B. Origin and evidence of calcite in shale oil reservoir of Dongying Sag. Pet. Geol. Recovery Effic. 2020, 27, 18–26. (In Chinese) [Google Scholar]
  54. Li, Z.; Zou, Y.R.; Xu, X.Y.; Sun, J.N.; Li, M.W.; Peng, P.A. Adsorption of mudstone source rock for shale oil-Experiments, model and a case study. Org. Geochem. 2016, 92, 55–62. [Google Scholar] [CrossRef]
  55. Han, Y.J.; Mahlstedt, N.; Horsfield, B. The Barnett Shale: Compositional fractionation associated with intraformational petroleum migration, retention, and expulsion. AAPG Bull. 2015, 99, 2173–2202. [Google Scholar] [CrossRef] [Green Version]
  56. Liu, Y.; Lu, Z.Y.; Feng, M.S.; Wang, J.; Tian, T.H.; Chao, J. Microscopic pore characteristics of shale oil reservoir in the Shahejie Formation, Dongying Sag, Bohai Bay Basin. Acta Geol. Sin. 2017, 91, 629–644. (In Chinese) [Google Scholar]
  57. Zhang, S.; Liu, H.M.; Song, G.Q.; Wang, Y.S.; Chen, S.Y.; Zhang, S.P. Causes and control factors of shale oil reservoir space in the Dongying Sag. Acta Pet. Sin. 2016, 37, 495–508. (In Chinese) [Google Scholar]
  58. Jarvie, D.M. Shale resource systems for oil and gas: Part 2 Shale oil resource systems. In Shale Reservoirs-Giant Resources for the 21st Century: AAPG Memoir; Breye, J.A., Ed.; Worldwide Geochemistry, LLC: Humble, TX, USA, 2012; Volume 97, pp. 89–119. [Google Scholar]
  59. Fathy, D.; Wagreich, M.; Ntaflos, T.; Sami, M. Paleoclimatic variability in the southern Tethys, Egypt: Insights from the mineralogy and geochemistry of Upper Cretaceous lacustrine organic-rich deposits. Cretac. Res. 2021, 126, 104880. [Google Scholar] [CrossRef]
  60. Curtis, J.B. Fractured shale gas systems. AAPG Bull. 2002, 86, 1921–1938. [Google Scholar]
  61. Jarvie, D.M.; Hill, R.J.; Ruble, T.E.; Pollastro, R.M. Unconventional shale-gas systems: The Mississippian Barnett shale of north central Texas as one model for thermogenic shale-gas assessment. AAPG Bull. 2007, 91, 475–499. [Google Scholar] [CrossRef]
  62. Gensterblum, Y.; Ghanizadeh, A.; Cuss, R.J.; Amann-Hildenbrand, A.; Krooss, B.M.; Clarkson, C.R.; Harrington, J.F.; Zoback, M.D. Gas transport and storage capacity in shale gas reservoirs–A review. Part A: Transport processes. J. Unconv. Oil Gas Resour. 2015, 12, 87–122. [Google Scholar] [CrossRef]
  63. Yassin, M.R.; Dehghanpour, H.; Wood, J.; Lan, Q. A theory for relative permeability of unconventional rocks with dual-wettability pore network. SPE J. 2016, 21, 1970–1980. [Google Scholar] [CrossRef]
  64. Jia, B.; Xian, C.G. Permeability measurement of the fracture-matrix system with 3D embedded discrete fracture model. Pet. Sci. 2022; in press. [Google Scholar] [CrossRef]
  65. Gasparik, M.; Bertier, P.; Gensterblum, Y.; Ghanizadeh, A.; Krooss, B.M.; Littke, R. Geological controls on themethane storage capacity in organic-rich shales. Int. J. Coal Geol. 2014, 123, 34–51. [Google Scholar] [CrossRef]
  66. Cheng, P.; Xiao, X.M.; Wang, X.; Sun, J.; Wei, Q. Evolution of water content in organic-rich shales with increasing maturity and its controlling factors: Implications from a pyrolysis experiment on a water-saturated shale core sample. Mar. Petrol. Geol. 2019, 109, 291–303. [Google Scholar] [CrossRef]
  67. Cheng, P.; Xiao, X.M.; Tian, H.; Gai, H.F.; Zhou, Q.; Li, T.F.; Fan, Q.Z. Differences in the distribution and occurrence phases of pore water in various nanopores of marine-terrestrial transitional shales in the Yangquan area of the northeast Qinshui Basin, China. Mar. Pet. Geol. 2022, 137, 105510. [Google Scholar] [CrossRef]
  68. Bennion, D.B.; Thomas, F.B. Formation damage issues impacting the productivity of low permeability, low initial water saturation gas producing formations. J. Energy Resour. Technol. 2005, 127, 240–247. [Google Scholar] [CrossRef]
  69. Ambrose, R.J.; Hartman, R.C.; Campos, M.D.; Akkutlu, I.Y.; Sondergeld, C.H. New Pore-Scale Considerations for Shale Gas in Place Calculations; Society of Petroleum Engineers: Richardson, TX, USA, 2010; pp. 1–17. [Google Scholar]
  70. Cheng, P.; Xiao, X.M.; Tian, H.; Wang, X. Water content and equilibrium saturation and their influencing factors of the Lower Paleozoic overmature organicrich shales in the Upper Yangtze Region of Southern China. Energy Fuels 2018, 32, 11452–11466. [Google Scholar] [CrossRef]
Figure 1. Correlations of HI and Tmax for the studied samples, showing their kerogen types. Classification of kerogen types was modified from Wu et al. [45].
Energies 15 04270 g001
Figure 2. Relationships of Tmax with S1/TOC (a) and EOM/TOC (b) for the studied samples.
Energies 15 04270 g002
Figure 3. Relationships of burial depths with S1/TOC (a), S2/TOC (b), and (S1 + S2)/TOC (c) for the studied samples.
Energies 15 04270 g003
Figure 4. Representative micrographs of some studied samples. (A1,A2) Reflected light and fluorescence photos, respectively, for the same field of sample FY1-1, displaying telalginite with strong yellow fluorescence, lamalginite and its debris with yellow fluorescence, mineral–bituminous groundmass with brownish yellow fluorescence, and bitumen filling micro-fissures along the bedding plane with brown fluorescence. (B1,B2) Reflected light and fluorescence photos, respectively, for the same field of sample FY1-7, indicating fluorescence occurring along the bedding plane with yellow-green fluorescence. (C1,C2) Reflected light and fluorescence photos, respectively, for the same field of sample FY1-8, indicating fluorescence occurring in mineral-hosted pores with strong yellow fluorescence. (D1,D2) Reflected light and fluorescence photos, respectively, for the same field of sample NY1-2, showing lamalginite and its debris with yellow fluorescence, mineral–bituminous groundmass with brown-yellow fluorescence, and fluorescence occurring along the bedding plane with yellow fluorescence. (E1,E2) Reflected light and fluorescence photos, respectively, for the same field of sample NY1-6, indicating lamalginite with yellow fluorescence, and fluorescence occurring around the edge of pores with yellow fluorescence. (F1,F2) Reflected light and fluorescence photos, respectively, for the same field of sample NY1-5, indicating telalginite with yellow fluorescence. (G1,G2) Reflected light and fluorescence photos, respectively, for the same field of sample LY1-1, showing mineral–bituminous groundmass with dark brown fluorescence, a large amount of lamalginite debris with brown fluorescence, and fluorescence with brown-yellow fluorescence. (H1,H2) Reflected light and fluorescence photos, respectively, for the same field of sample LY1-9, indicating fluorescence occurring around the edge of pores with yellow fluorescence. (I) Fluorescence photo from sample LY1-7, indicating fluorescence occurring along the bedding plane with yellow fluorescence. (J) Fluorescence photo from sample LY1-8, indicating a large amount of lamalginite debris with brown fluorescence, and an oil halo with green fluorescence, which was formed on the sample surface under blue light excitation.
Energies 15 04270 g004aEnergies 15 04270 g004b
Figure 5. Variations of mineral compositions with burial depths for the studied samples. The mineral compositions of the three wells were basically similar, and they were mainly clay and carbonate minerals, quartz, and feldspar.
Energies 15 04270 g005
Figure 6. Plots showing relationships between TOC and quartz + feldspar (a), clay minerals (b) and carbonate minerals (c) of the studied samples.
Energies 15 04270 g006aEnergies 15 04270 g006b
Figure 7. Plots showing relationships between different minerals for the studied samples. Clay minerals showed no correlations with quartz + feldspar (a). Carbonate minerals showed negative correlations with quartz + feldspar (b) and clay minerals (c).
Energies 15 04270 g007aEnergies 15 04270 g007b
Figure 8. Plots showing relationships of burial depths with EOM contents (a), EOM/TOC (b), and light (c) and heavy (d) hydrocarbons for the studied samples.
Energies 15 04270 g008aEnergies 15 04270 g008b
Figure 9. Plots showing relationships of TOC with EOM (a) and S1 (b) for the studied samples.
Energies 15 04270 g009
Figure 10. Plots showing relationship of EOM with clay minerals (a), carbonate minerals (b), quartz and feldspar (c), and quartz (d) for the studied samples. The three LY1 silty shale samples were expected for the linear regressions (see Table 1).
Energies 15 04270 g010aEnergies 15 04270 g010b
Figure 11. Relationships of porosity with non-micropores (a) and micropores (b) for the studied samples.
Energies 15 04270 g011
Figure 12. Plots showing relationships of porosity with TOC (a) and different minerals (bd) for the studied samples.
Energies 15 04270 g012aEnergies 15 04270 g012b
Figure 13. Plots showing relationships of pore structure parameters with TOC (ac), clay minerals (dg) and quartze (g,h) for the studied samples.
Energies 15 04270 g013aEnergies 15 04270 g013b
Figure 14. Relationships of porosity with EOM (a) and EOM/TOC (b) for the studied samples.
Energies 15 04270 g014
Figure 15. Plots shows relationships of pore structure parameters with EOM (ac) and EOM/TOC (d) for the studied samples.
Energies 15 04270 g015aEnergies 15 04270 g015b
Figure 16. Relationship between EOM and S1 (a) and relationship between S1/TOC and EOM/TOC (b) based on the data of the studied samples.
Energies 15 04270 g016aEnergies 15 04270 g016b
Figure 17. Variations of S1 and TOC with depth for the studied shale samples: (a) measured S1; (b) calculated S1 based on EOM.
Energies 15 04270 g017
Figure 18. Variations of S1/TOC and EOM/TOC with depth for the studied samples.
Energies 15 04270 g018
Table 1. Geological and geochemical information of the studied samples.
Sample InformationTOC (%)S1 (mg/g)S2 (mg/g)Tmax (°C)HI (mg/gTOC)
WellNameFormationDepth (m)Lithology
FY1FY1-1ES333172Shale2.022.016.22449307
FY1-2ES333180Shale5.285.2418.89450358
FY1-3ES333183Shale4.822.925.76451534
FY1-4ES333200Shale5.973.1836.19451606
FY1-5ES333209Shale2.832.711.58452409
FY1-6ES413257Shale5.44.1321.11452391
FY1-7ES413373Shale1.281.212.33453182
FY1-8ES413376Shale2.382.393.97452167
NY1NY1-1ES333342Shale1.271.516.12445482
NY1-2ES333368Shale2.133.7612.56444589
NY1-3ES333398Shale1.992.789.52449478
NY1-4ES413429Shale1.421.78.42448595
NY1-5ES413459Shale1.522.095.69446373
NY1-6ES413482Shale1.663.136.08447366
LY1LY1-1ES333600Shale3.518.1114.06448400
LY1-2ES333642Silty shale *9.3811.0833.58451358
LY1-3ES333643Silty shale *6.9415.8320.61451297
LY1-4ES333660Silty shale *6.8713.3718.67452272
LY1-5ES333665Shale1.663.714.64450279
LY1-6ES413764Shale1.943.353.96451204
LY1-7ES413772Shale4.896.867.88452161
LY1-8ES413774Shale3.346.123.3145299
LY1-9ES413835Shale1.22.782.23452186
* A dominated layered siltstone, interbedded with laminated shale.
Publisher’s Note: MDPI stays neutral with regard to jurisdictional claims in published maps and institutional affiliations.

