Article

Characterization of the Lower Cretaceous Shale in Lishu Fault Depression, Southeastern Songliao Basin: Implications for Shale Gas Resources Potential

1
College of Natural Resources and Environment, South China Agricultural University, Guangzhou 510642, China
2
PowerChina Eco-Environmental Group Co., Ltd., Shenzhen 518102, China
3
School of Chemistry and Chemical Engineering, South China University of Technology, Guangzhou 510006, China
4
Guangdong Industry Intelligent Manufacturing Co., Ltd., Zhongshan 528400, China
5
State Key Laboratory of Organic Geochemistry, Guangzhou Institute of Geochemistry, Chinese Academy of Sciences, Guangzhou 510640, China
*
Author to whom correspondence should be addressed.
These authors contributed equally to this work.
Energies 2022, 15(14), 5156; https://doi.org/10.3390/en15145156
Submission received: 19 April 2022 / Revised: 15 June 2022 / Accepted: 4 July 2022 / Published: 15 July 2022
(This article belongs to the Special Issue New Challenges in Shale Gas and Oil)

Abstract

:
Large thickness of shales over 180.0 m was developed in the source rocks of the Shahezi and Yingcheng formations in the Lishu Fault Depression. Moreover, the high amount of gas content and the total hydrocarbon value of gas logging in several boreholes illustrate that there is a great potential of shale gas resources in this region. Therefore, an integrated characterization of shales from the lower Cretaceous Shahezi and Yingcheng formations was provided to evaluate shale gas resources potential. The measurement results illustrated that the organic-rich shale samples with kerogen type Ⅱ during high to over thermal maturity had a higher content of brittle minerals (>50%) and clay mineral dominated by illite. The shales had a total porosity of 3.11–4.70%, a permeability of 1.24 × 10⁻³–1.52 × 10⁻³ μm2, and possessed pore types including dissolution pores, inter-layer pores of clay minerals, micro-fractures, intra-granular pores, and organic pores, which were dominated by micropores and mesopores (0.5–1.7 nm, 2.2–34.3 nm) with a significant contribution from OM and clay minerals. According to the N2 adsorption isotherms, the pore volume was comprised primarily of mesopores with mean widths of 4.314–6.989 nm, while the surface area was comprised primarily of micropores with widths in ranges of 0.5–0.8 nm and 1.0–1.7 nm. Thus, the shales have a suitable porosity and permeability, indicating that fine storage capacity and favorable gas flow capacity occur in the Shahezi and Yingcheng formations, which exhibit a good reservoir quality and excellent exploration potential since the considerable thickness of shales could form a closed reservoir and served as cap rocks for in situ gas generation and accumulation. Especially, according to the measured CH4 excess adsorption amount and the calculated maximum absolute adsorption capacities of CH4 based on the Langmuir adsorption model, the estimated GIP values (1.388–3.307 m3/t) of the shales happened to be in a sampling depth under geological hydrostatic pressure and temperature conditions. This means that the shale storage capacity and high gas content from well site desorption completely met the standard of industrial exploitation when synthetically considering the GIP model. As a consequence, shales in the Shahezi and Yingcheng formations in the Lishu Fault Depression could be potential targets for shale gas exploration.

1. Introduction

The Songliao Basin is a petroliferous area in northeastern China, with Cretaceous formations being the main target strata of conventional oil and gas exploration [1,2,3,4]. In recent years, the Siwujia, Bawu, Pijia, Qinjiatun and Qikeshu oilfields have been continuously discovered in the Lishu Fault Depression, which has become one of the richest areas for oil and gas reserves in southeastern Songliao Basin [4]. Meanwhile, shale layers in the Shahezi and Yingcheng formations in the lower Cretaceous have shown favorable potential for shale gas generation and accumulation [5,6]. The borehole HS1 illustrated that three sets of shales with high gas logging occurred in the Shahezi Formation in the Lishu Fault Depression, and the total hydrocarbon value of gas logging approached 84%. Meanwhile, there was a daily oil yield over 7.67 m3 at a depth of 2711.0–2730.5 m in the Shahezi Formation during oil testing. The borehole SN163 had an abnormal feature of gas logging and obtained a low yield of gas flow in the shale layers in the Shahezi Formation. Abundant gas layers in shales interbedded with thin-layer siltstones and fine-grained sandstones have been identified in the Shahezi Formation and the first member of the Yingcheng Formation in several boreholes, namely, S2, L2, L5, SW30, and SW33X, in which a cumulative thickness of over 350 m occurred in these formations. Especially, the total hydrocarbon value of gas logging was 100% with a CH4 content of 89.4% in the shale layers at depth range of 3156–3167 m from the Yingcheng Formation in borehole S2, and the average gas content was 2.5 m3/t from well site desorption [7], which reached the evaluation standard of the core area according to the Chinese National Standard GB/T 31483–2015 [8]. The total hydrocarbon value of gas logging was 80% and is dominated by CH4 at a depth of 2824 m in the Yingcheng Formation of borehole L5. This indicates a great potential for shale gas resources in the Lishu Fault Depression.
Generally, shale gas in the subsurface occurs in three states: free gas in natural fractures and intergranular porosity, adsorbed gas on kerogen and clay particle surfaces, and dissolved gas in kerogen and bitumen [9,10]. The GIP (gas-in-place) content is the sum of these three states and represents the storage capacity of shale gas. The adsorbed gas content was the highest in the five American shale formations, which accounted for 20–85% of the GIP [9]. Therefore, the GIP content and adsorbed gas ratio are critical parameters affecting potential shale gas resources, the evaluation of recoverable reserves, and the optimization of production strategies [10,11,12]. Usually, the adsorbed gas volumes were estimated by adsorption and desorption isotherms [13,14,15], while free gas was obtained from logging interpretation [16,17]. Especially, when estimating the volume or density of adsorbed gas phase, such as CH4, one also needs to acquire the absolute adsorption isotherms at different temperatures and the estimated thermodynamic parameters [14,18,19]. Thus, it is necessary to carry out comprehensive measurement and experiments on the porosity and absorption behavior in order to finish a shale gas resources evaluation in the Lishu Fault Depression. These factors have not been quantitatively studied before in this area.
In this study, a comprehensive characterization of the shales of the source rocks in the Shahezi and Yingcheng formations in the Lishu Fault Depression is provided, including an investigation of the organic geochemical characteristics, mineralogical composition, pressure-dependent porosity, and low-pressure N2 and CH4 adsorption capacity. Especially, the CH4 adsorption measurement was performed at pressures ranging from 0 to 40 MPa and at three different temperatures (40 °C, 60 °C, and 80 °C). With these fitted parameters, the comprehensive adsorption behavior of CH4 and the pore characteristics of the shales at geological pressures and temperatures were obtained in this study. Finally, the CH4 adsorption capacity and GIP of shales at different buried depths were acquired by combining the geothermal gradient and the fluid pressure coefficient parameters. These works provide a good reference for shale gas potential evaluation and exploration in the Lishu Fault Depression.

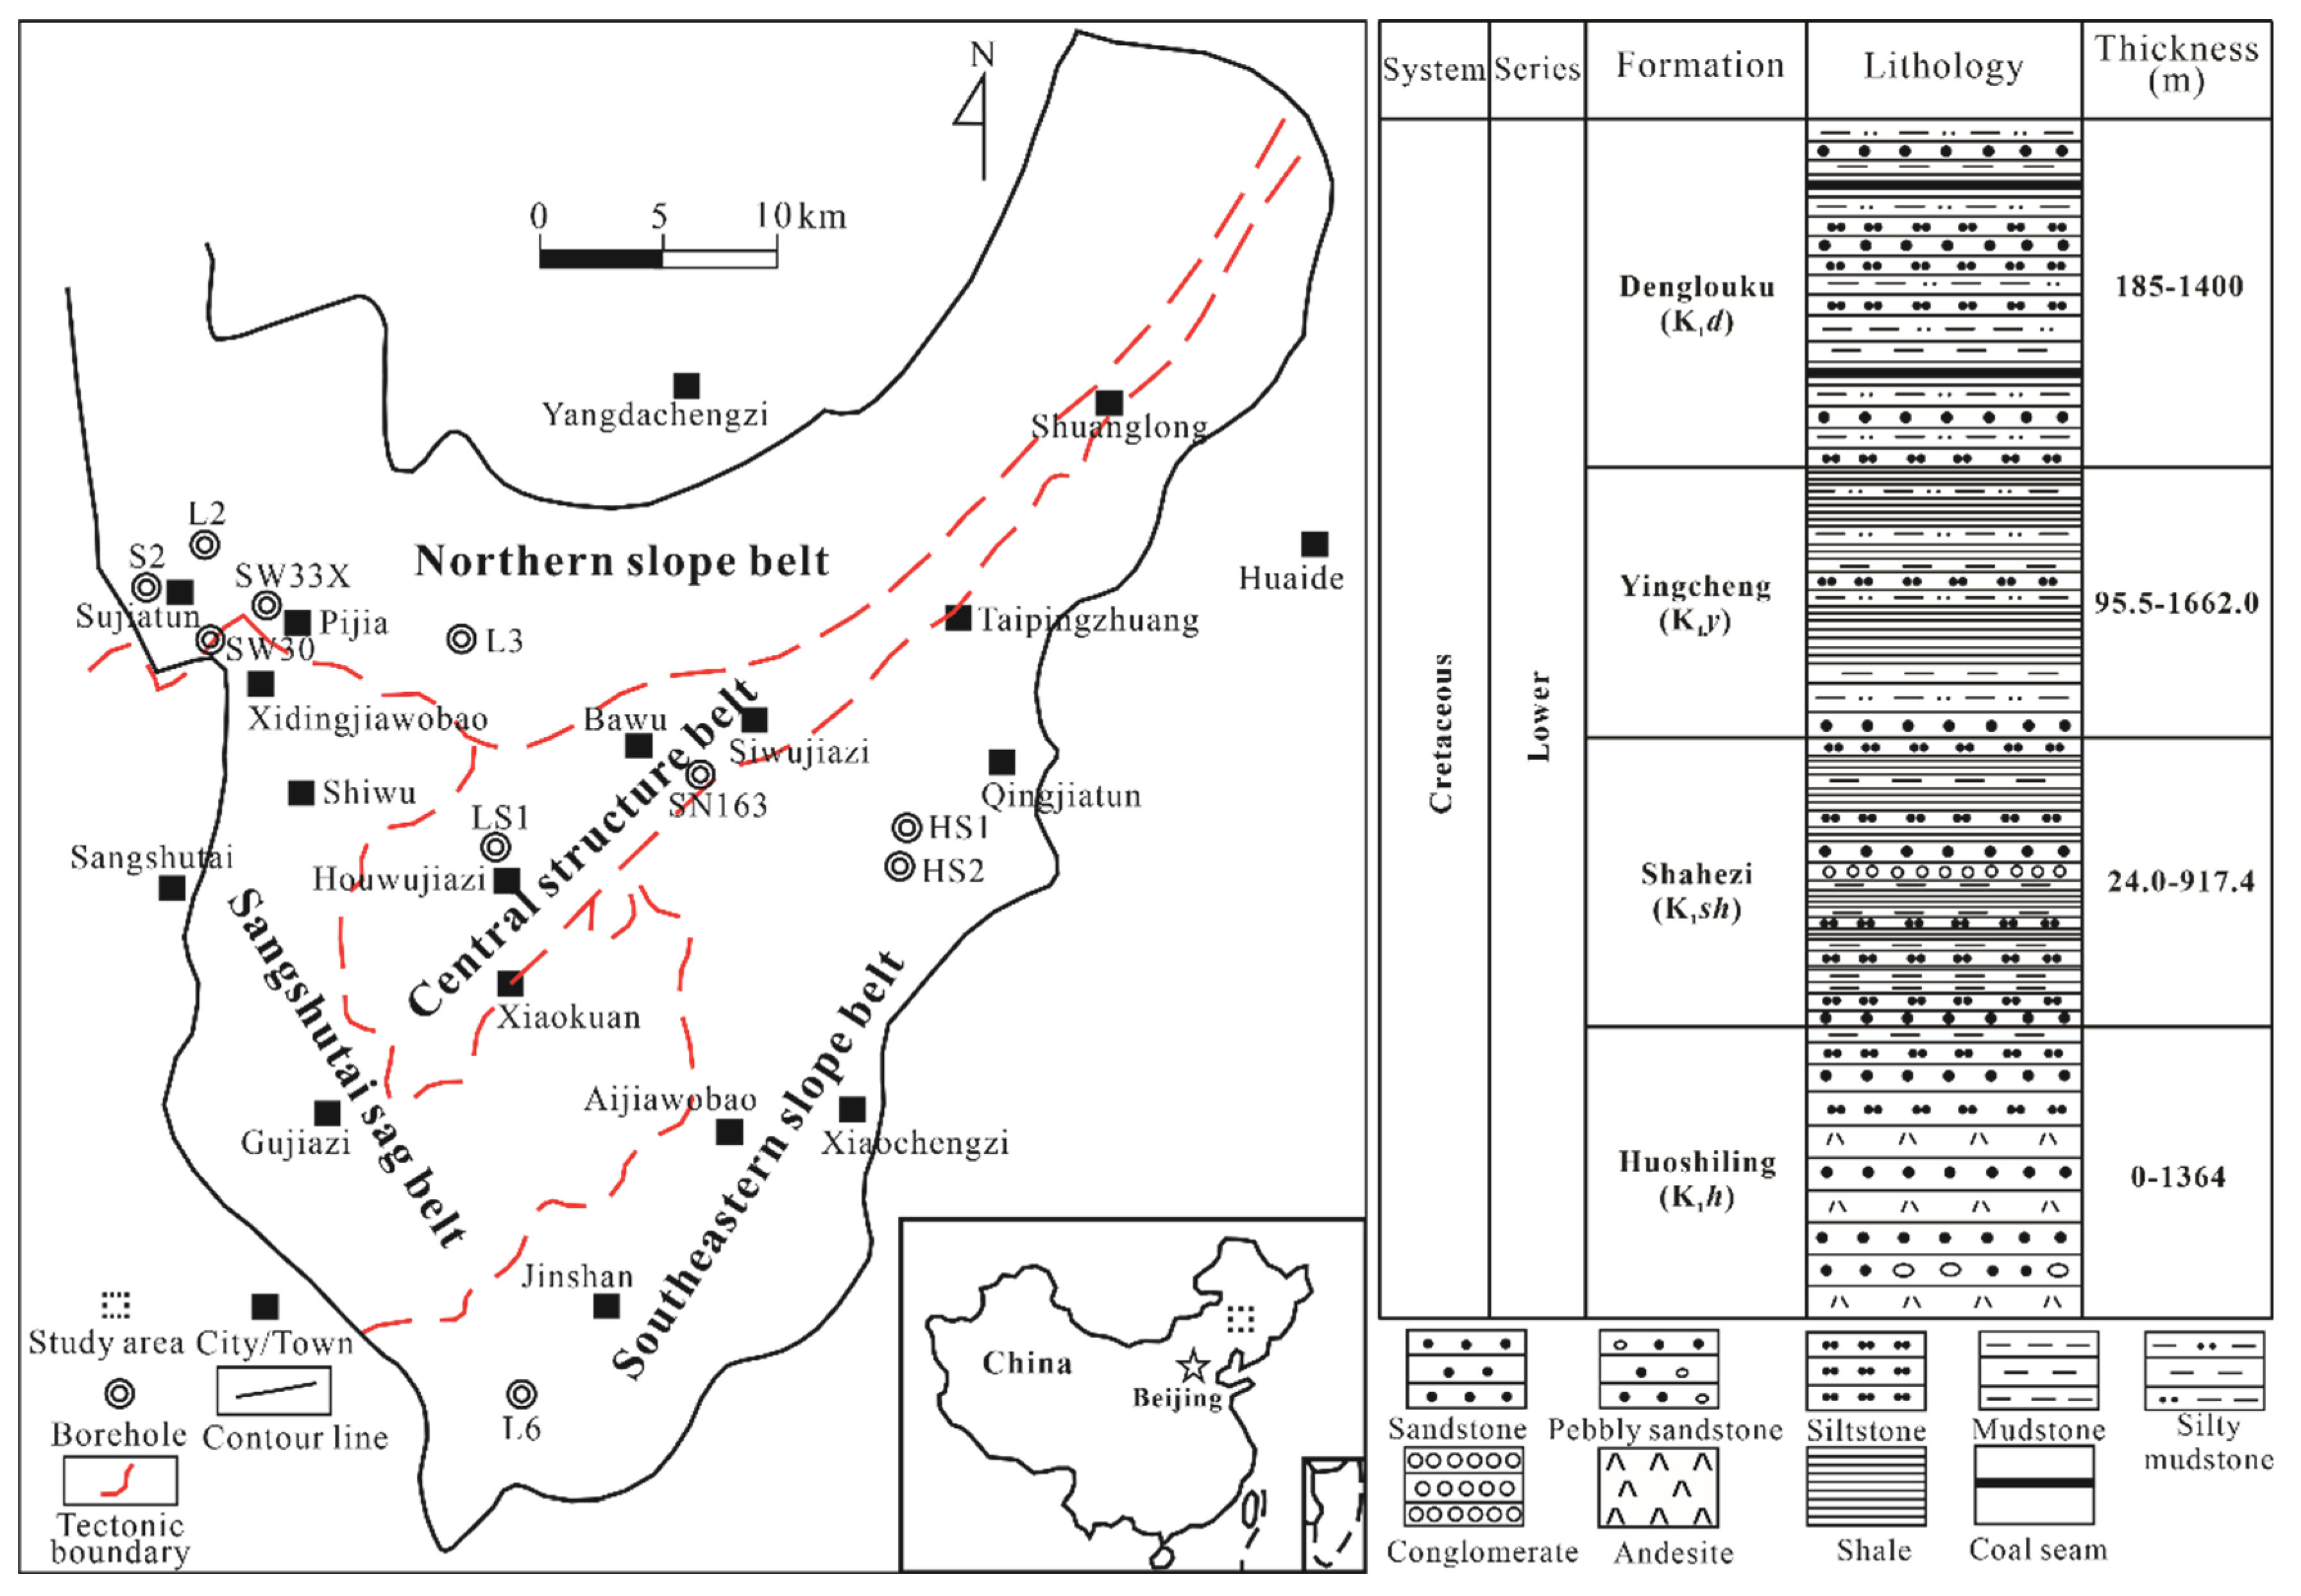
2. Geologic Settings

2.1. Strctural Belt and Stratigraphic Column

The Lishu Fault Depression is located in the southeastern uplifted area of Songliao Basin (Figure 1). It is a typical Mesozoic fault depression superimposed basin that developed on a Paleozoic basement of epimetamorphic rocks, with an area of 2346 km2. Structurally, it is also an independent half-graben terrigenous fault basin with faulting in the west and overlap in the east. Its deposition and subsidence center were situated in the midwest, and the deposition thickness showed to be thinning to the southeastern, eastern, and northeastern directions. The Lishu Fault Depression is divided into four structural belts (Figure 1), namely, the Sangshutai Sag belt, the central structural belt, the northern slope belt, and the southeastern slope belt [3,4].
The binary structure of the fault depression and depression was developed in period of Cretaceous in Lishu Fault Depression. The strata of the fault depression stage were developed on the Carboniferous–Permian basement, which included Huoshiling (K1h), Shahezi (K1sh), Yingcheng (K1y), and Denglouku (K1d) formations in the lower Cretaceous (Figure 1). The strata of the depression stage included Quantou Formation (K1q) in Lower Cretaceous, Qingshankou (K2qn), Yaojia (K2y) and Nenjiang (K2n) formations in the upper Cretaceous. The Quaternary was in unconformable contact with the underlying Nenjiang Formation. The Sifangtai (K2s) and Mingshui (K2m) formations in the upper Cretaceous and Tertiary were lost.
The depositional environment of the Huoshiling Formation is mainly volcanic and fan delta facies. A deeper water body existed in Sangshutai Sag that locally formed alluvial fan and subaqueous fan facies. The Shahezi Formation was developed in the maximum lacustrine flooding period, when the depositional environment was dominated by deep–semi-deep lake and gradually changed to be shore–shallow lake facies to the northern, eastern, and southern directions. The depositional environment in Sangshutai Sag was alluvial fan, fan delta, and near-shore subaqueous fan facies and widely distributed thicker shale layers. The depositional characteristics of the Shahezi Formation was inherited in the Yingcheng Formation, which is characterized by expanded deposition range and shallowed water column. The sedimentary assemblage of the Yingcheng Formation is deep–semi-deep lake, shore–shallow lake, fan delta, and underwater fan facies. The Shahezi and Yingcheng formations are all divided into four members. The depositional environment of the Denglouku Formation consists of alluvial plain and shallow lake facies, and the unified subsidence center was gradually formed. Thus, the favorable depositional environment of source rocks are shore–shallow lake and deep–semi-deep lake facies in the Shahezi and Yingcheng formations [3].

2.2. Stratigraphic Distribution and Lithology

The Huoshiling Formation is mostly comprised of volcanic rocks intercalated with grey-black sandstone, siltstone, and mudstone, with a total thickness range of 0 to 1364 m (Figure 1). The Shahezi Formation is dominated by black shale, mudstone, and siltstone and locally interbedded with grey sandstone and conglomerate, with a total thickness range of 24.0–917.4 m and an average thickness of 319.3. The cumulative thickness of shale in the Shahezi Formation is in the range of 16–600 m with an average thickness of 180.6 m, the percentage of shale thickness was 17.5–95.5% and averaged of 57.1%. The shale thickness was gradually decreased from the Sangshutai Sag towards the central structural belt. The shale thicknesses in Shuanglong and Qingjiatun town were 300 m and 200 m, respectively. The cumulative thickness of shale in the second member of the Shahezi Formation in borehole HS1 was 84 m and the maximum thickness of a single continuous mudstone layer was 54 m [3,4].
The main lithologies of the Yingcheng Formation were greyish-black shale and silty mudstone interbedded with thin layer fine-grained sandstone (Figure 1), with a total thickness of 95.5–1662.0 m and an average thickness of 511.7 m. The cumulative thickness of shale in the Yingcheng Formation was in a range of 50.0–891.8 m and an average thickness of 306.0 m, the percentage of shale thickness was 9.4–80.5% and an average percentage of 58.3%. The thicker shale areas were mainly distributed in Shiwu, Gujiazi, and Houwujiazi town, and the largest cumulative thickness of shale was about 1000 m in Gujiazi town. The shale thickness was gradually decreased in the directions to Taipingzhuang town and the southeastern margin of the Lishu Fault Depression with shale thicknesses of 300 m and 100 m. Another relatively thick shale was developed in Shuanglong town, with a shale thickness of 300 m. The cumulative thickness of shale was 184 m, and the maximum thickness of a single continuous mudstone layer was 77 m in the first member of the Yingcheng Formation in borehole S2. The main lithologies of the Denglouku Formation were greyish-green sandstone and silty mudstone interbedded with black mudstone and coal seams or coal lines, with a total thickness of 185 to 1400 m [3].

3. Samples and Experiments

3.1. Samples

The logging data of sixteen boreholes and seismic survey in Lishu Fault Depression were collected to investigate regional stratigraphic distribution and lithology. Meanwhile, two typical shale cores were collected from the second member of the Shahezi Formation (K1sh2) in borehole HS1 at the depth of 2551.53 m (HS1–1), and the first member of the Yingcheng Formation (K1yc1) in borehole S2 at the depth 3299.30 m (S2–1), respectively. The kerogen types of HS1–1 and S2–1 were type Ⅱ2 and type Ⅱ1, respectively [7,20].

3.2. Organic Geochemical, Petrological and Helium Porosity Analysis

The total organic carbon (TOC) measurement on 200 mesh (~0.075 mm) shale powder was performed using a Leco CS–230 C/S analyzer, following the Chinese National Standard GB/T 19145–2003 [21]. The vitrinite reflectance (Ro%) measurement was conducted on polished section using a 3Y–Leica DMR XP microphotometer according to ASTM D7708–14 [22]. The processes were described in detail as Xu et al. [23]. As petrographic composition was an important index, it was necessary to analyze the mineral composition of the shale. The X-ray diffraction (XRD) analysis on 200 mesh shale powder was performed using a Bruker D8 Advance X-ray diffractometer with Cu–Kα radiation at 40 kV and 30 mA current. Stepwise scanning measurement was performed at a rate of 4°/min in the range of 3° to 85° with a step interval of 0.02°, in accordance with Chinese Oil and Gas Industry Standard SY/T 5163–2018 [24]. Semi-quantitative measurement of mineral composition was obtained using XPower software. The total porosity measurement under overburden pressure of shale was conducted on a CoreLab PoroPDP-200 type instrument, and the gas employed was He, following Chinese Oil and Gas Industry Standard SY/T 6385–2016 [25]. The overburden pressure was gradually increased from 0 to 50 MPa in an increment of 10 MPa.

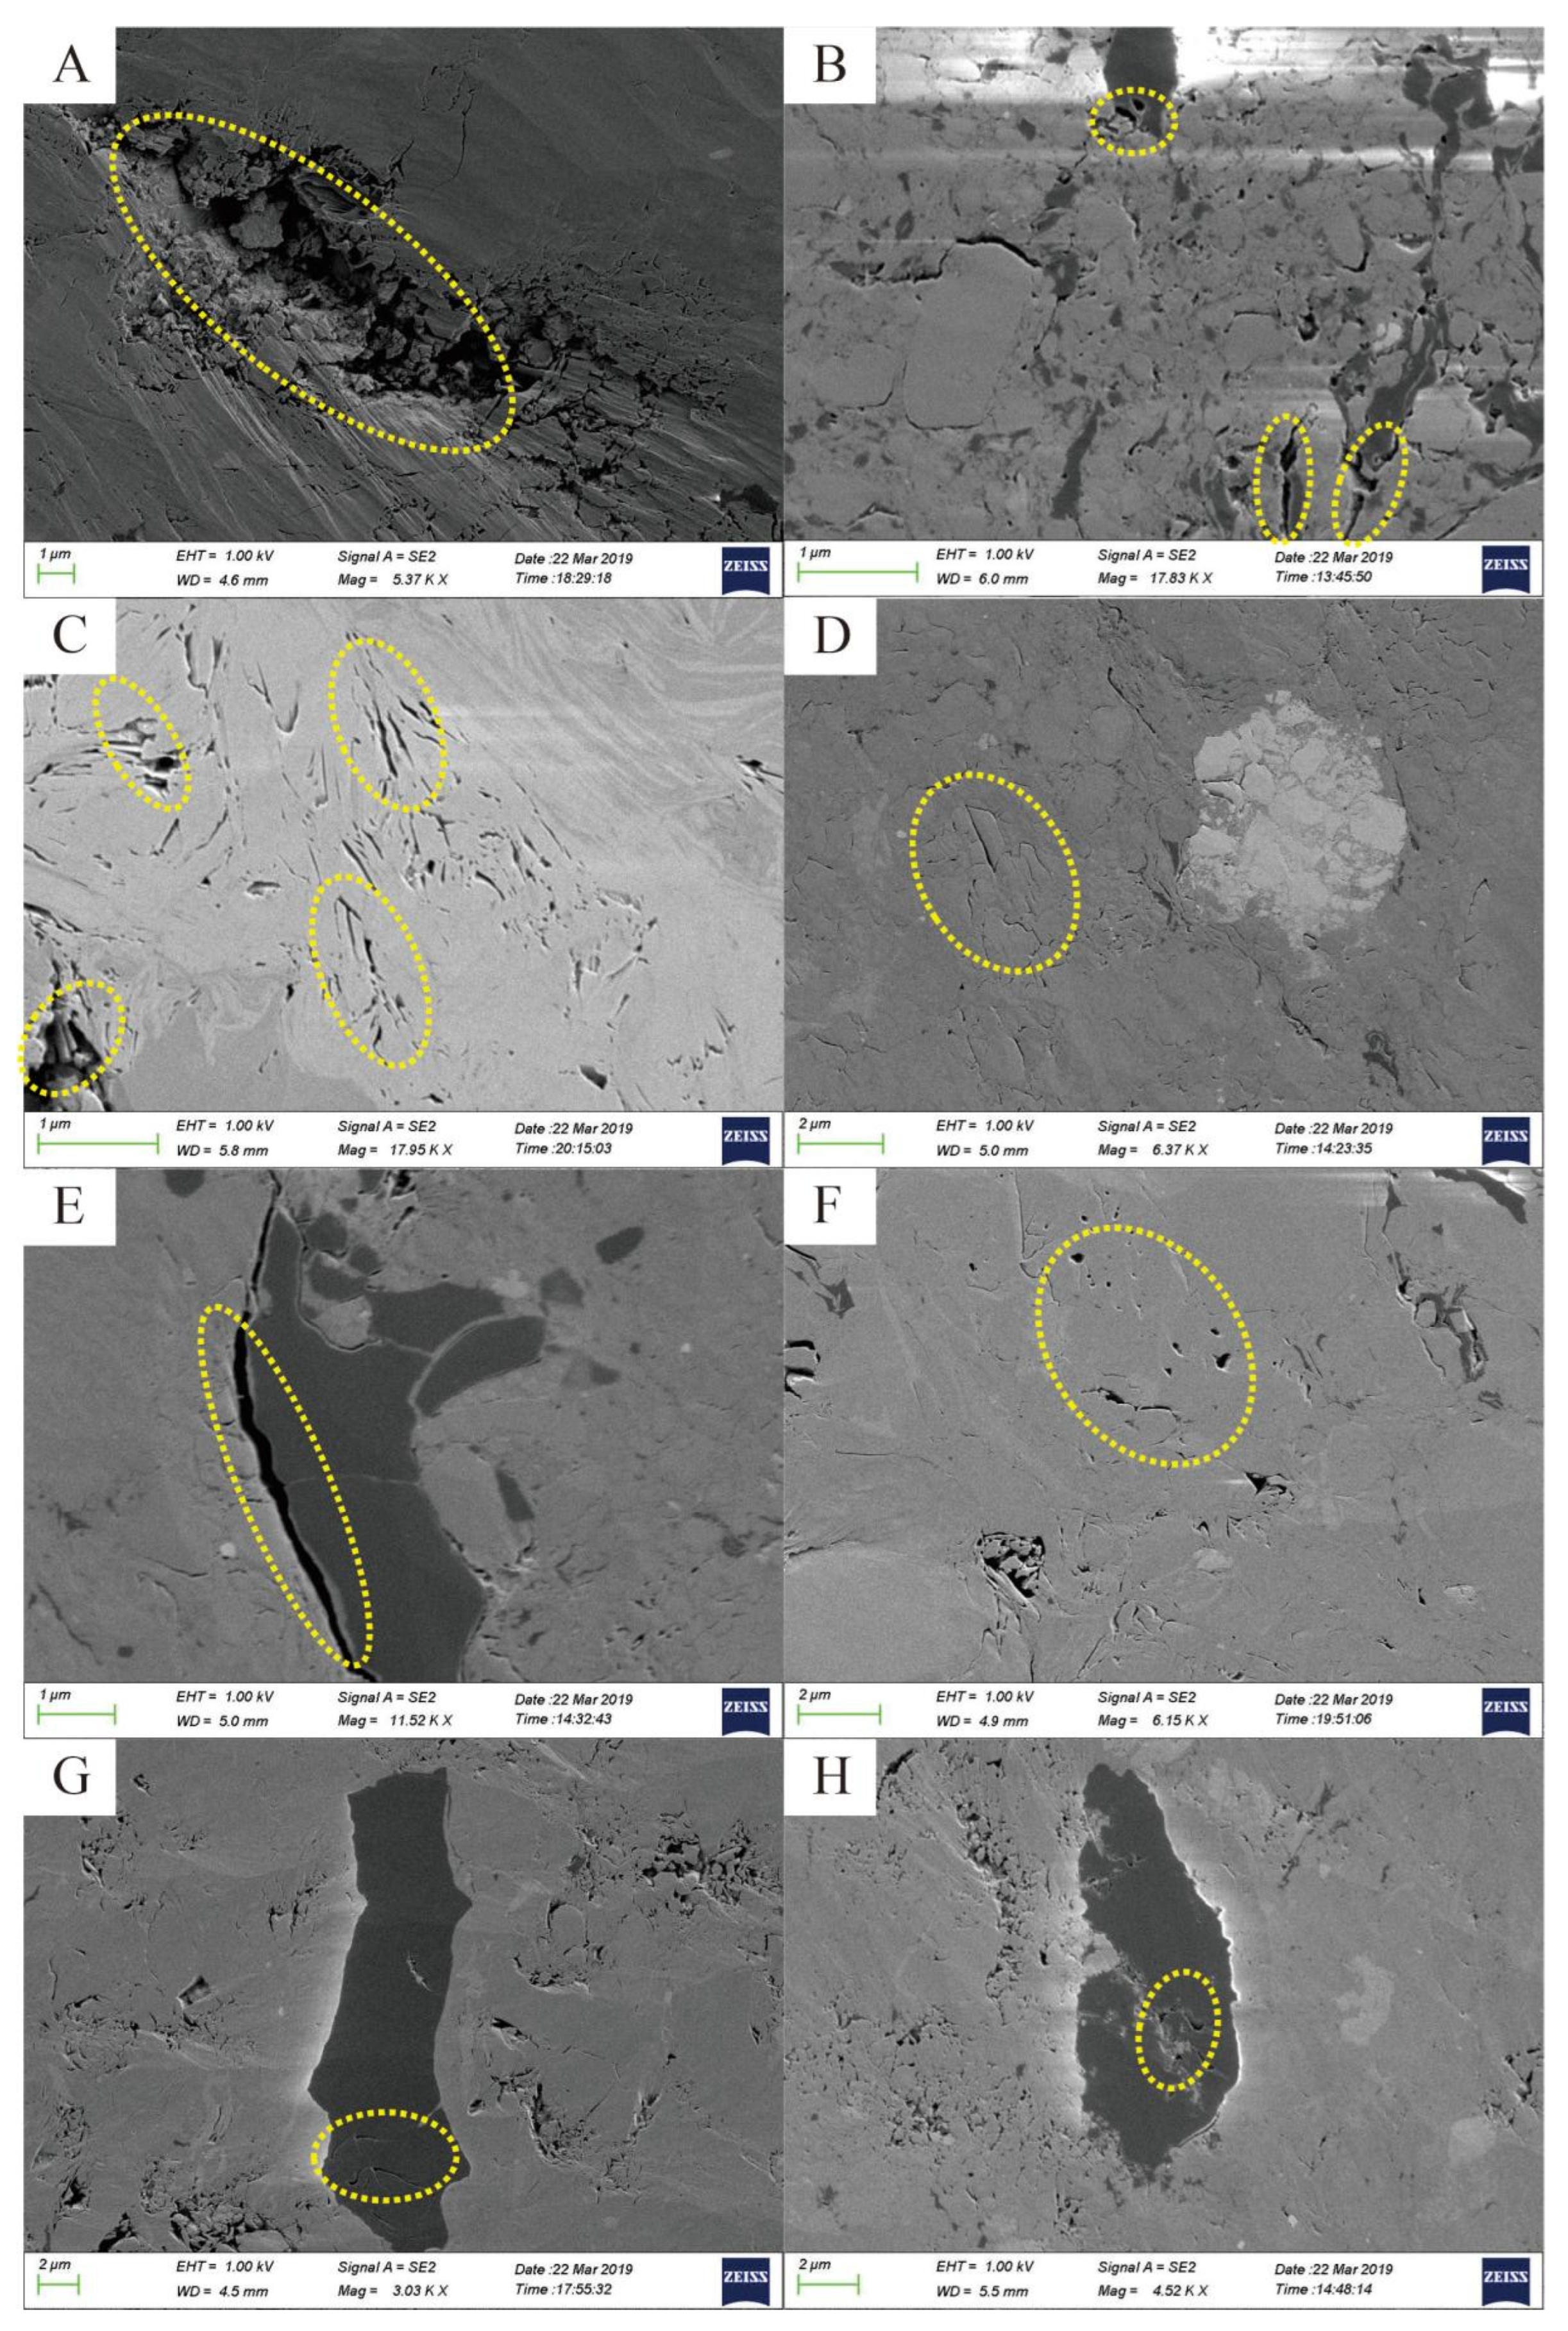
3.3. Field Emission Scanning Electron Microscopy (FE–SEM) Imaging Analysis

The shale core was cut into small cube (1–2 cm3) and polished by a broad argon ion beam (GATAN PECS II 685 Cross-section Polisher) to produce a flat surface without coating. Each polished shale was imaged using a Zeiss Merlin FE–SEM. These micrographs vividly illustrated nanopores in shale, which helped to identify the pore types, location, and connectivity [26]. Detailed information from the scanning, such as electron-accelerating voltage (EHT) and magnification (Mag) was shown in the micrographs.

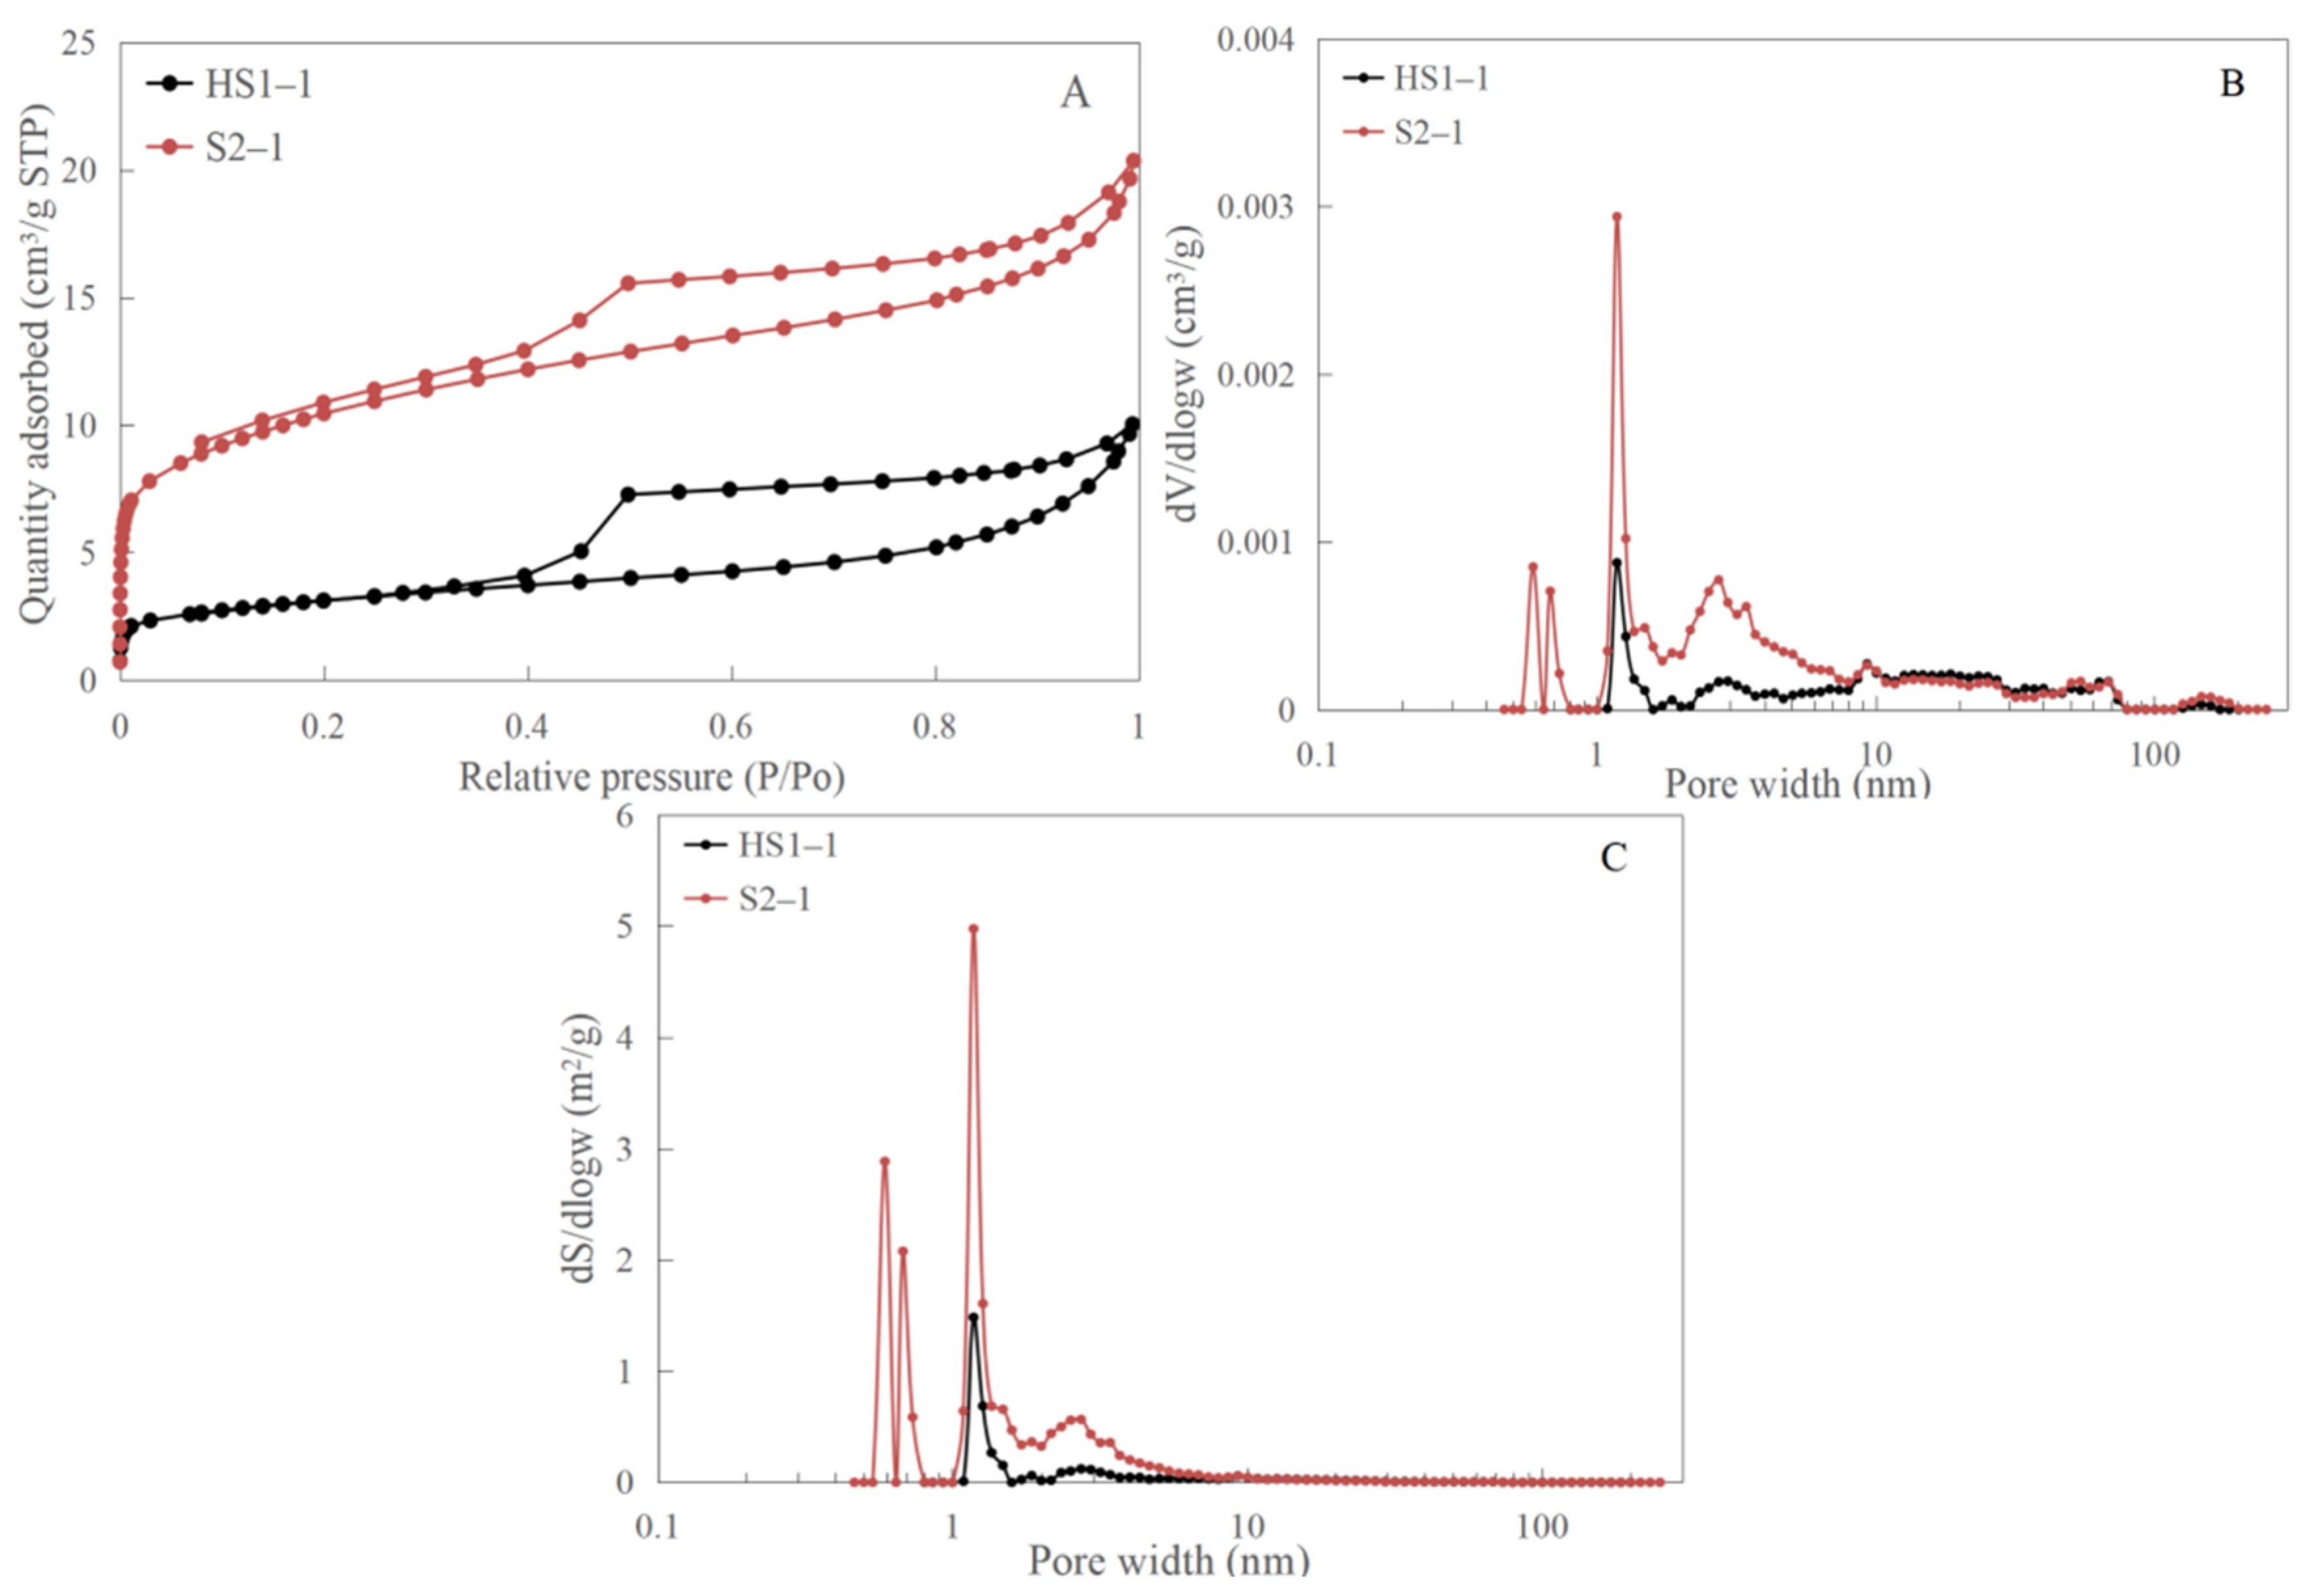
3.4. Low Pressure N2 Adsorption Measurement

The low-pressure N2 adsorption measurement on 60 mesh (~0.25 mm) shale powder was conducted on a Micromeritics ASAP 2020M apparatus following Chinese National Standard GB/T 21650.2–2008 [27]. Each shale powder weighing approximately 0.3 g was initially subjected to eliminate moisture and volatile gas at 110 °C in a vacuum for 12 h. Degassed shale powder was exposed to N2 at 77.15 K within the range of relative pressure from 0.0001 to 0.995, and obtained pore-structure parameters within the size range of 1 to 300 nm. The specific surface area (SSA) was calculated using the BET (Brunauer–Emmett–Teller) model [28], while mesopore and macropore volumes were calculated using BJH equation [29]. Pore-size distribution was analyzed using density functional theory (DFT) equation [30].

3.5. CH4 Adsorption Measurement

The CH4 adsorption isotherm of shale powder was obtained on a gravimetric adsorption analyzer (Rubotherm ISOSORP–HP III Static) equipped with a magnetic suspension balance (MSB) system. The test temperatures were set to 40 °C, 60 °C, and 80 °C and pore pressures ranged from 0.001 to 40 MPa. The resolutions of the system temperature and pressure were 0.01 °C and 0.001 MPa, respectively. The weight of shale powder was balanced with a high precision of 10 μg following a noncontact suspending coupling mechanism.
The gravimetric method can be summarized in four steps: (1) blank measurement (without sample) was firstly performed for each adsorption temperature to obtain the mass and volume of the container using Archimedes principle; (2) sample pretreatment, where about 5 g of shale powder with a particle size of <0.2 mm was placed in the container and degassed at 110 °C under vacuum condition for 24 h to remove adsorbed moisture and volatile gas; (3) buoyancy measurement, which was based on Archimedes principle to obtain the mass and volume of shale powder using He (99.999%, pressures up to 7 MPa) at 40 °C; and (4) adsorption measurement aimed to generate excess adsorption isotherms, where the procedure was set to 15 designated pressure points, and the equilibration time of each pressure point was set to 2 h. During the buoyancy and adsorption measurements, free-phase densities of CH4 and He at designed experimental temperature and pressure were obtained via NIST package using the Setzmann and Wagner equation [31]. The experimental uncertainties were calculated following the method reported by Keller and Staudt [32].

3.6. Calculation of Absolute CH4 Adsorption

The excess adsorption amount of CH4 ( n e x c ) was a function of the absolute adsorption amount of CH4 ( n a b s ), the adsorbed phase volume of CH4 ( V a d s ), and the free phase density of CH4 ( ρ g ), as shown in Equation (1):
n e x c = n a b s ( 1 ρ g ρ a d s ) = n a b s V a d s · ρ g
Here, ρ a d s is the adsorbed phase density of CH4. To calculate the absolute adsorption amount from the excess adsorption amount of CH4, the volume or density of adsorbed phase CH4 was required.
Absolute adsorption isotherms were usually described by the Langmuir model, which assumed monomolecular layer adsorption on a given surface [14,33], as shown in Equation (2):
n a b s = n o · P P L + P
Here, n o is the maximum absolute adsorption capacity at a designed temperature, P is the equilibrium pressure, and P L is the Langmuir pressure, which represents the pressure at which the amount of adsorbed CH4 equals half of the maximum adsorption capacity of CH4.
Substituting Equation (2) into Equation (1), Equation (3) was obtained as below:
n e x c = n o · P P L + P ( 1 ρ g ρ a d s )
Here, P and ρ g are independent variables, n e x c is a dependent variable, n o , P L and ρ a d s are controlled variables, which assume the adsorbed phase density of CH4 was constant during the measurements. The controlled variables were obtained by fitting Equation (3) to the excess adsorption isotherms with a least-square minimization procedure. If the constants of n o and P L were obtained independently, the absolute adsorption isotherms can be determined with Equation (2).

4. Results and Discussions

4.1. Organic Geochemistry and Mineral Compositions

According to the TOC (2.01% and 2.45%) and Ro (1.6% and 2.1%) values for HS1–1 and S2–1 (Table 1), the shales can be classified as superior good source rocks at stages of high to over mature. In the mineral constituents of HS1–1 and S2–1 include clay (44.3% and 44.8%), quartz (36.7% and 38.6), and feldspar (14.0% and 7.4%). The relative percentages of illite (72.0% and 68.3%) and chlorite (15.8% and 20.3%) indicate that illite dominates in the clay minerals. This implies that the smectite was transformed into illite/smectite (I/S) and illite [34], which could be attributed to the chemical compaction effects that occurred during the diagenesis process of the source rock. On one hand, the high clay content may reduce the effectiveness of hydraulic fracturing; on the other hand, the sufficient content of quartz may counteract the effect and maintain brittleness for fracturing [35]. Usually, high contents of TOC and quartz in shales both imply a high generation and reserve potential of CH4 within organic matter (OM), as well as being available for hydraulic fracturing [36].

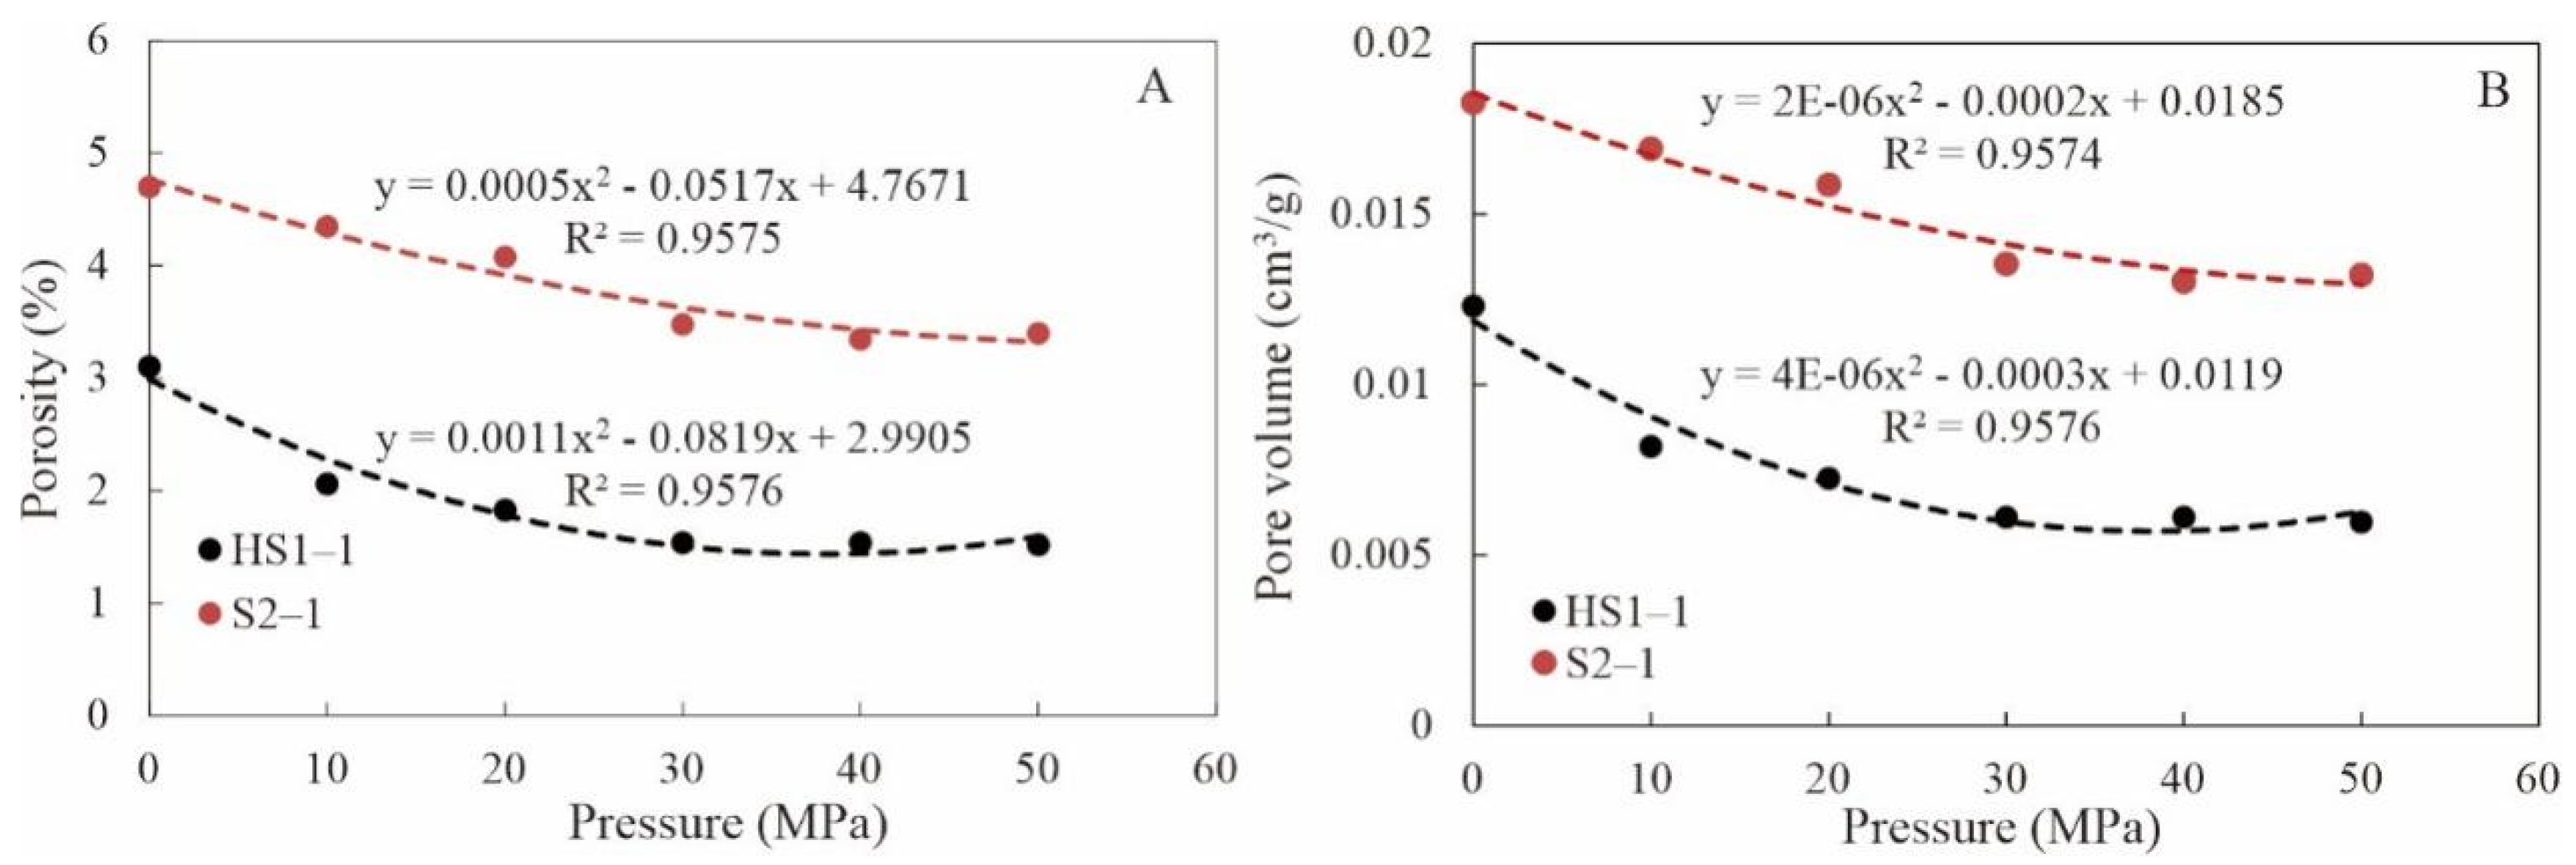
4.2. FE-SEM Micrographs, Pore Types, and Helium Porosity

According to the observed FE-SEM micrographs (Figure 2), laminated structures and reservoir spaces were clearly distributed in OM and minerals. The reservoir spaces included dissolution pores, inter-layer pores of clay minerals, microfractures, intra-granular pores and organic pores, which constitute a spatial array of the reservoir. The dissolution pores usually developed between the margins of quartz and feldspar (Figure 2A) or at the edges of the mineral matrix and OM (Figure 2B), with pore sizes ranging from 50 nm to several microns. The kerogen may produce various organic acids during the diagenesis process to dissolve quartz and feldspar, which was the main factor for the formation of dissolution pores. The inter-layer pores of clay minerals are usually developed in the process of smectite transformed into I/S and illite or produced by the distortion of clay layers during compaction (Figure 2C). The slit-shaped or wedge-shaped pores were obviously developed in lamellar and fibrous structures of illite with pore sizes of 50 to 200 nm. Mesopores and macropores play an important role in clay minerals [13,37,38].
The micro-fractures were usually developed between skeleton mineral particles (Figure 2D) or presented along the edges of OM and skeleton minerals (Figure 2E) with pore sizes of 100–500 nm, which were possibly created by the dissolution of skeleton mineral particles or by the effects of shrinking and decompression [37,39]. The micro-fractures can connect with nanopores in OM, clay minerals, and other grains, which benefit hydrocarbon migration and accumulation. The intra-granular pores were observed within mineral particles (Figure 2F) with pore sizes of <100 nm, which were possibly created by the dissolution of unstable minerals [37,40].
The organic pores, as a significant composition within the pore network [37,40,41], were developed during the maturation and expulsion of generated hydrocarbons [7,13]. Organic pores were in slit-shaped (Figure 2G) or sphere-shaped (Figure 2H) and dominated by micropores and mesopores, which also demonstrated that a significant proportion of the micropores were contained within OM [40]. The organic pores preferentially developed following the continuous organic framework to form a favorable shale gas reservoir space [41], and may be collectively associated with clay minerals and OM, which also distributed in micrographs (Figure 2B). Organic pores usually had better connectivity than intra–granular pores and formed an effective pore system for shale gas flows [26,42].
The total porosity (3.11% and 4.70%) of HS1–1 and S2–1 were slightly lower than those of American shales [13,37] and showed without overburden pressure (Figure 3A). However, with the increasing overburden pressure, the total porosity values were diminished with polynomial functions and then kept stable fluctuations under overburden pressure in the range of 40 to 50 MPa. The relatively high permeability of HS1–1 (1.24 × 10⁻³ μm2) and S2–1 (1.52 × 10⁻³ μm2) allowed for the rapid gas flow and easy recovery of shale gas. Ross and Bustin [13] demonstrated that the total porosities were larger in clay-rich shales than those in silica-rich shales; thus, the inter-layer pores of clay minerals and organic pores developed in clay-rich HS1–1 and S2–1 should be the primary spaces for shale gas storage.

4.3. N2 Adsorption

The low-pressure-adsorption isotherms (Figure 4A) of N2 conducted at 77.15 K were classified as type-IV isotherms, which were characterized by a type-H3 hysteresis loop [43]. Based on the shape of the hysteresis loop, slit-shaped pores may be observed in shales, which were demonstrated in FE-SEM micrographs. The adsorbed quantity of N2 at low P/Po (<0.01) indicated the presence of micropores, while the increased adsorbed quantity of N2 with increasing P/Po (~0.995) was attributed to mesopores and macropores [43]. According to the BET surface areas (SBET) of HS1–1 (10.558 m2/g) and S2–1 (35.139 m2/g) and the BJH total pore volume (VBJH) of HS1–1 (0.0145 cm3/g) and S2–1 (0.0266 cm3/g) (Table 2), which were higher than the DA micropore volume (VDA) values in HS1–1 (0.0053 cm3/g) and S2–1 (0.0144 cm3/g), the calculated pore volume percentage of mesopores (PMe) in HS1–1 (66.36%) and S2–1 (51.88%) were significantly higher than those of PMa and PMi (Table 2). This indicated that, as observed in the FE-SEM micrographs (Figure 2), most pore sizes in the shales of the Shahezi and Yingcheng formations were in the range of micropores to mesopores, which is also consistent with the pore width distribution reflected in low-pressure N2 adsorption isotherms (Figure 4). Compared to the mesopores and macropores, the same volume of micropores will provide more surface area and have larger adsorbed gas capacity [37], which were demonstrated by the values of SBET and PMi of S2–1. Previous studies have demonstrated that the origin and development of micropores were usually attributed to the thermal decomposition of kerogen and the generation of hydrocarbons [13,44]. The values of SBET and VBJH in this study were both correlated to clay contents (Table 1 and Table 2), where the much more developed pores included inter-layer pores, intra-granular pores, and organic pores between clay minerals, brittle minerals, and OM (Figure 2C,F,G). The values of PMa and PMe in S2–1 were lower than those in HS1–1, which were obviously influenced by the chlorite content because it had been considered to block nanopores and had a negative impact on shales [45].
The plot of dV/dlogw versus pore width (w) was frequently used to investigate the pore width distribution of nanopores and to assess the partial porosity of pores at any width (Figure 4B), which was preferable calculated by the DFT model [40,46]. The pore volumes of HS1–1 and S2–1 were mostly attributed to micropores (0.5–1.7 nm) and mesopores (2.2–34.3 nm), while there was little contribution from pores with widths larger than 50 nm, especially greater than 100 nm. Ross and Bustin [13] found that, compared with micropores, mesopores could provide more effective storage spaces for free gas and contribute more to the total pore volume in most organic-rich shales with TOC > 2%. The pore diameter (DBJH) of HS1–1 (6.989 nm) and S2–1 (4.314 nm) (Table 2) showed larger pores in HS1–1 than in S2–1. The plot of dS/dlogw versus pore width was usually used to illustrate the surface area contribution of pores at specific pore widths (Figure 4C) [40]. The width in HS1–1 and S2–1 indicated that the pores were mainly comprised of micropores (0.5–1.7 nm), corresponding to other shales in China [14,38,39,40]. Thus, the micropores contributed most of total surface area in this study (Figure 4C).

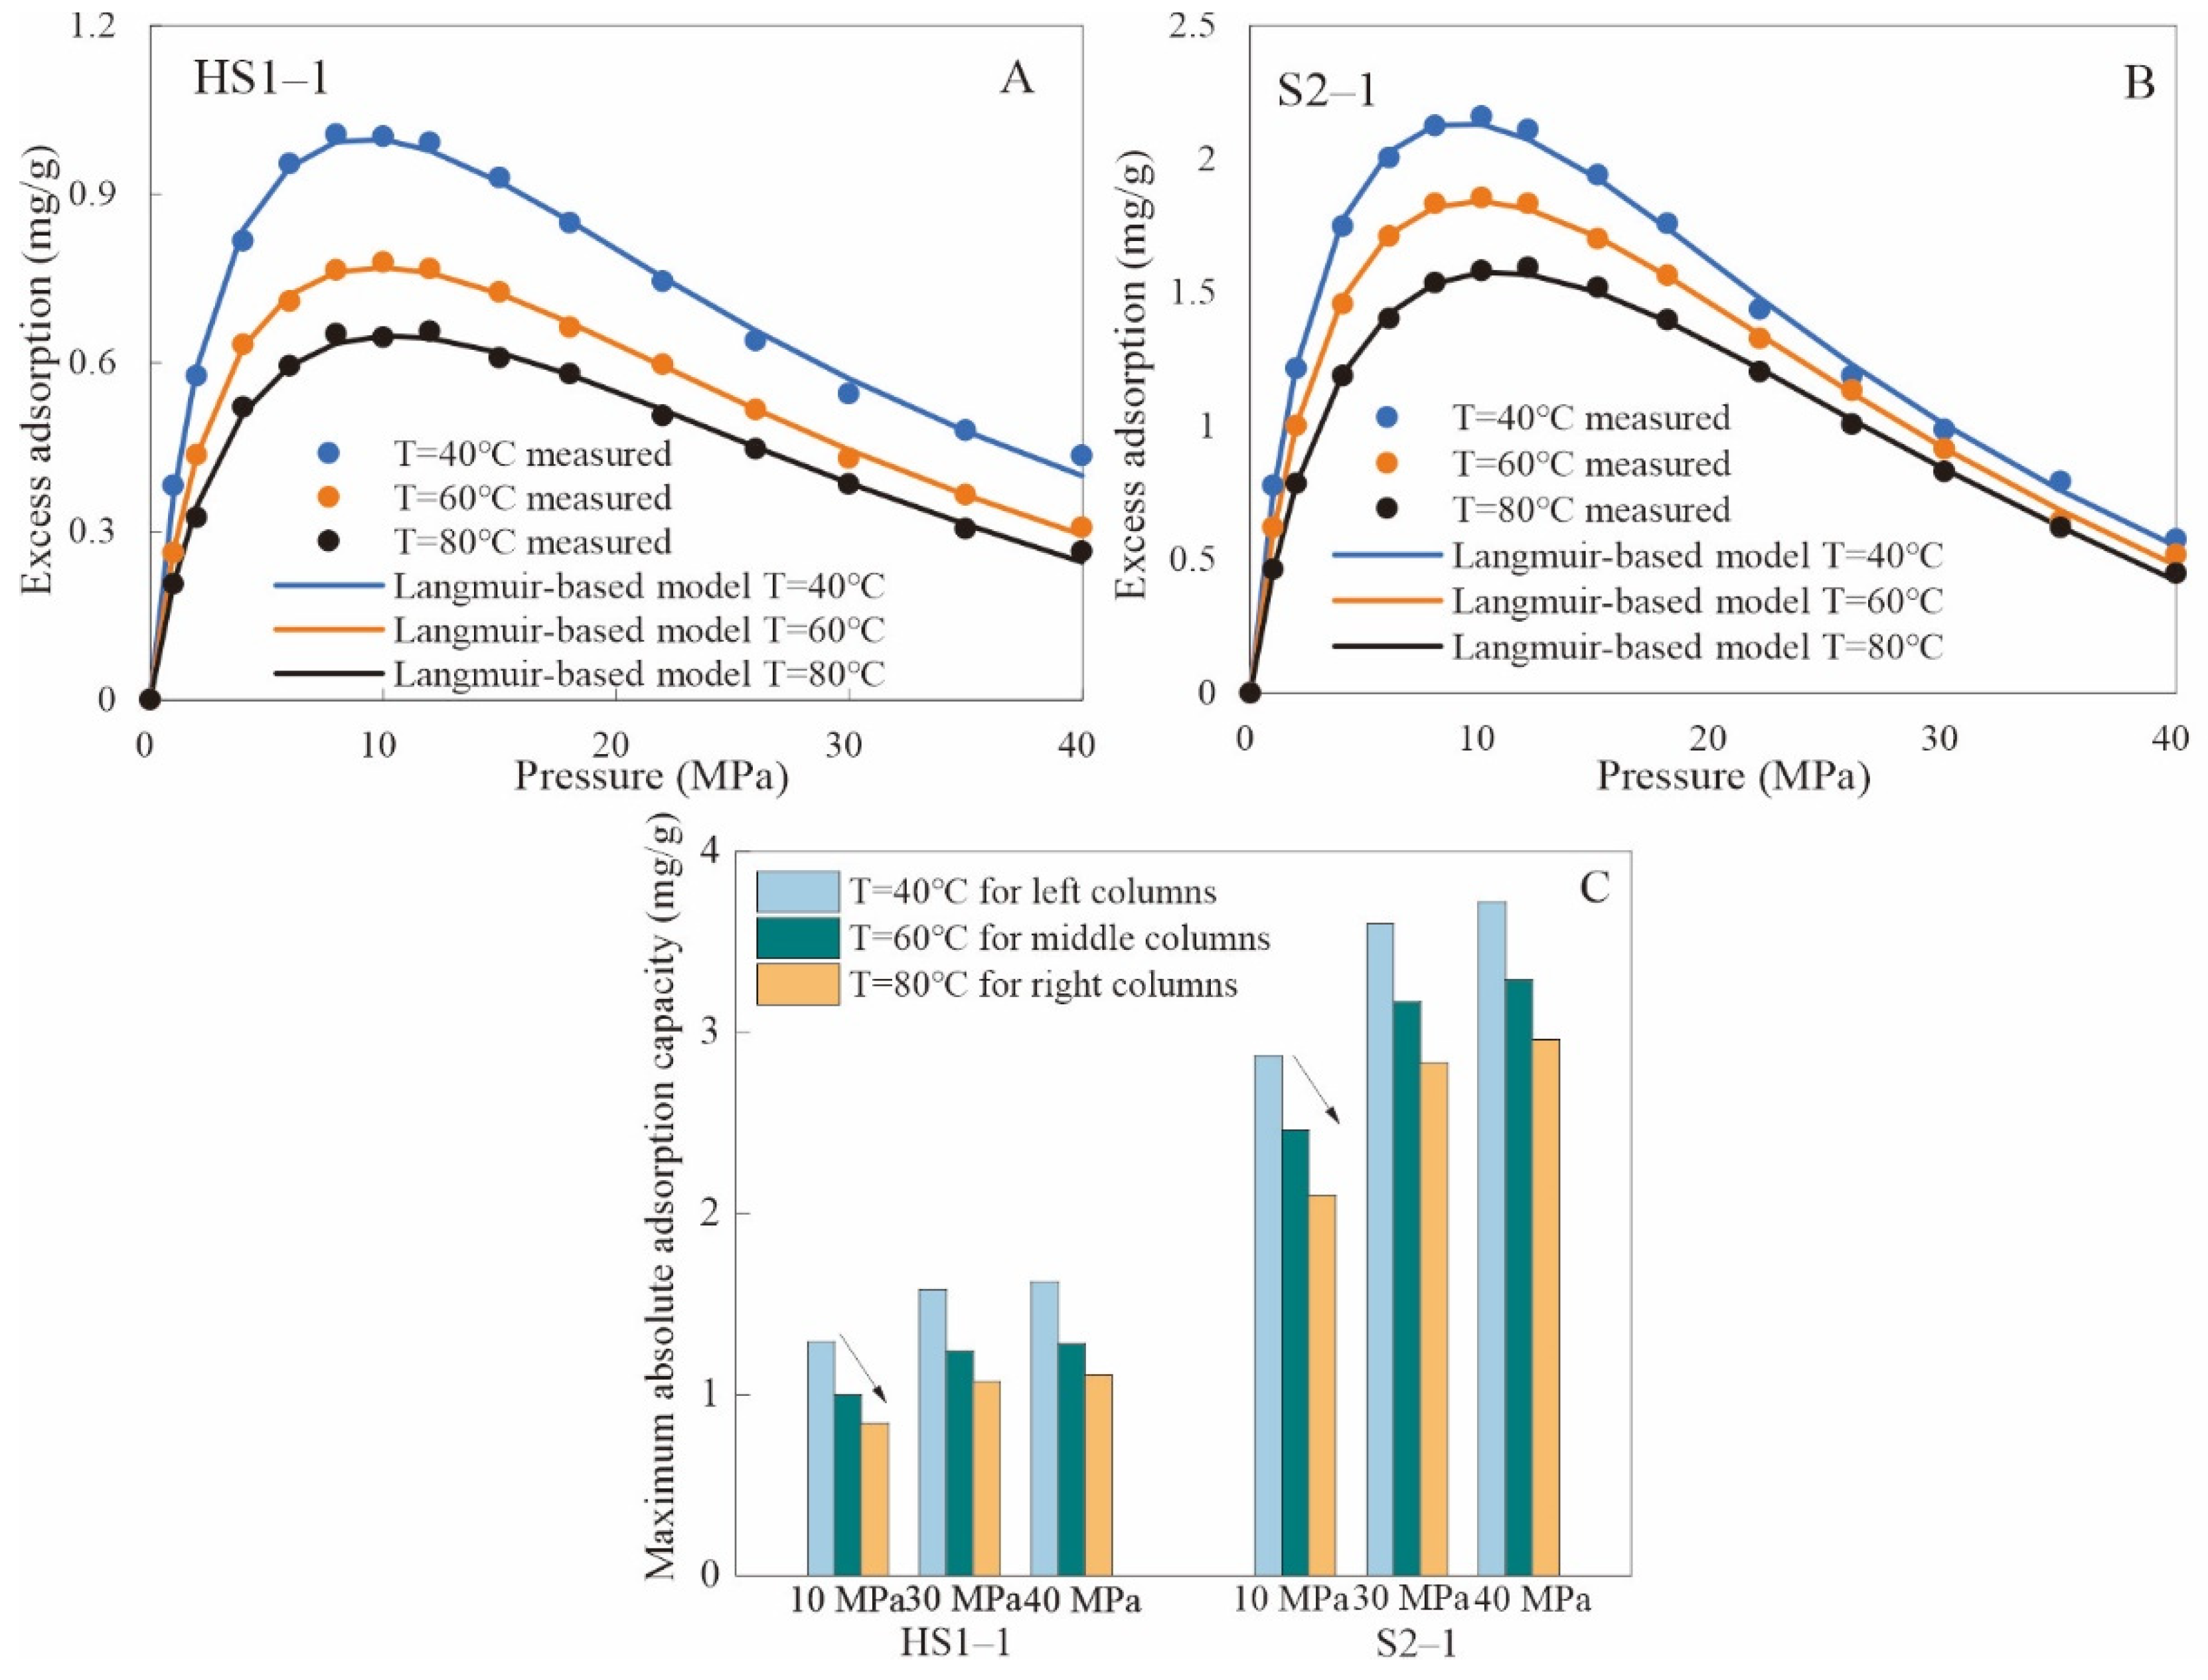
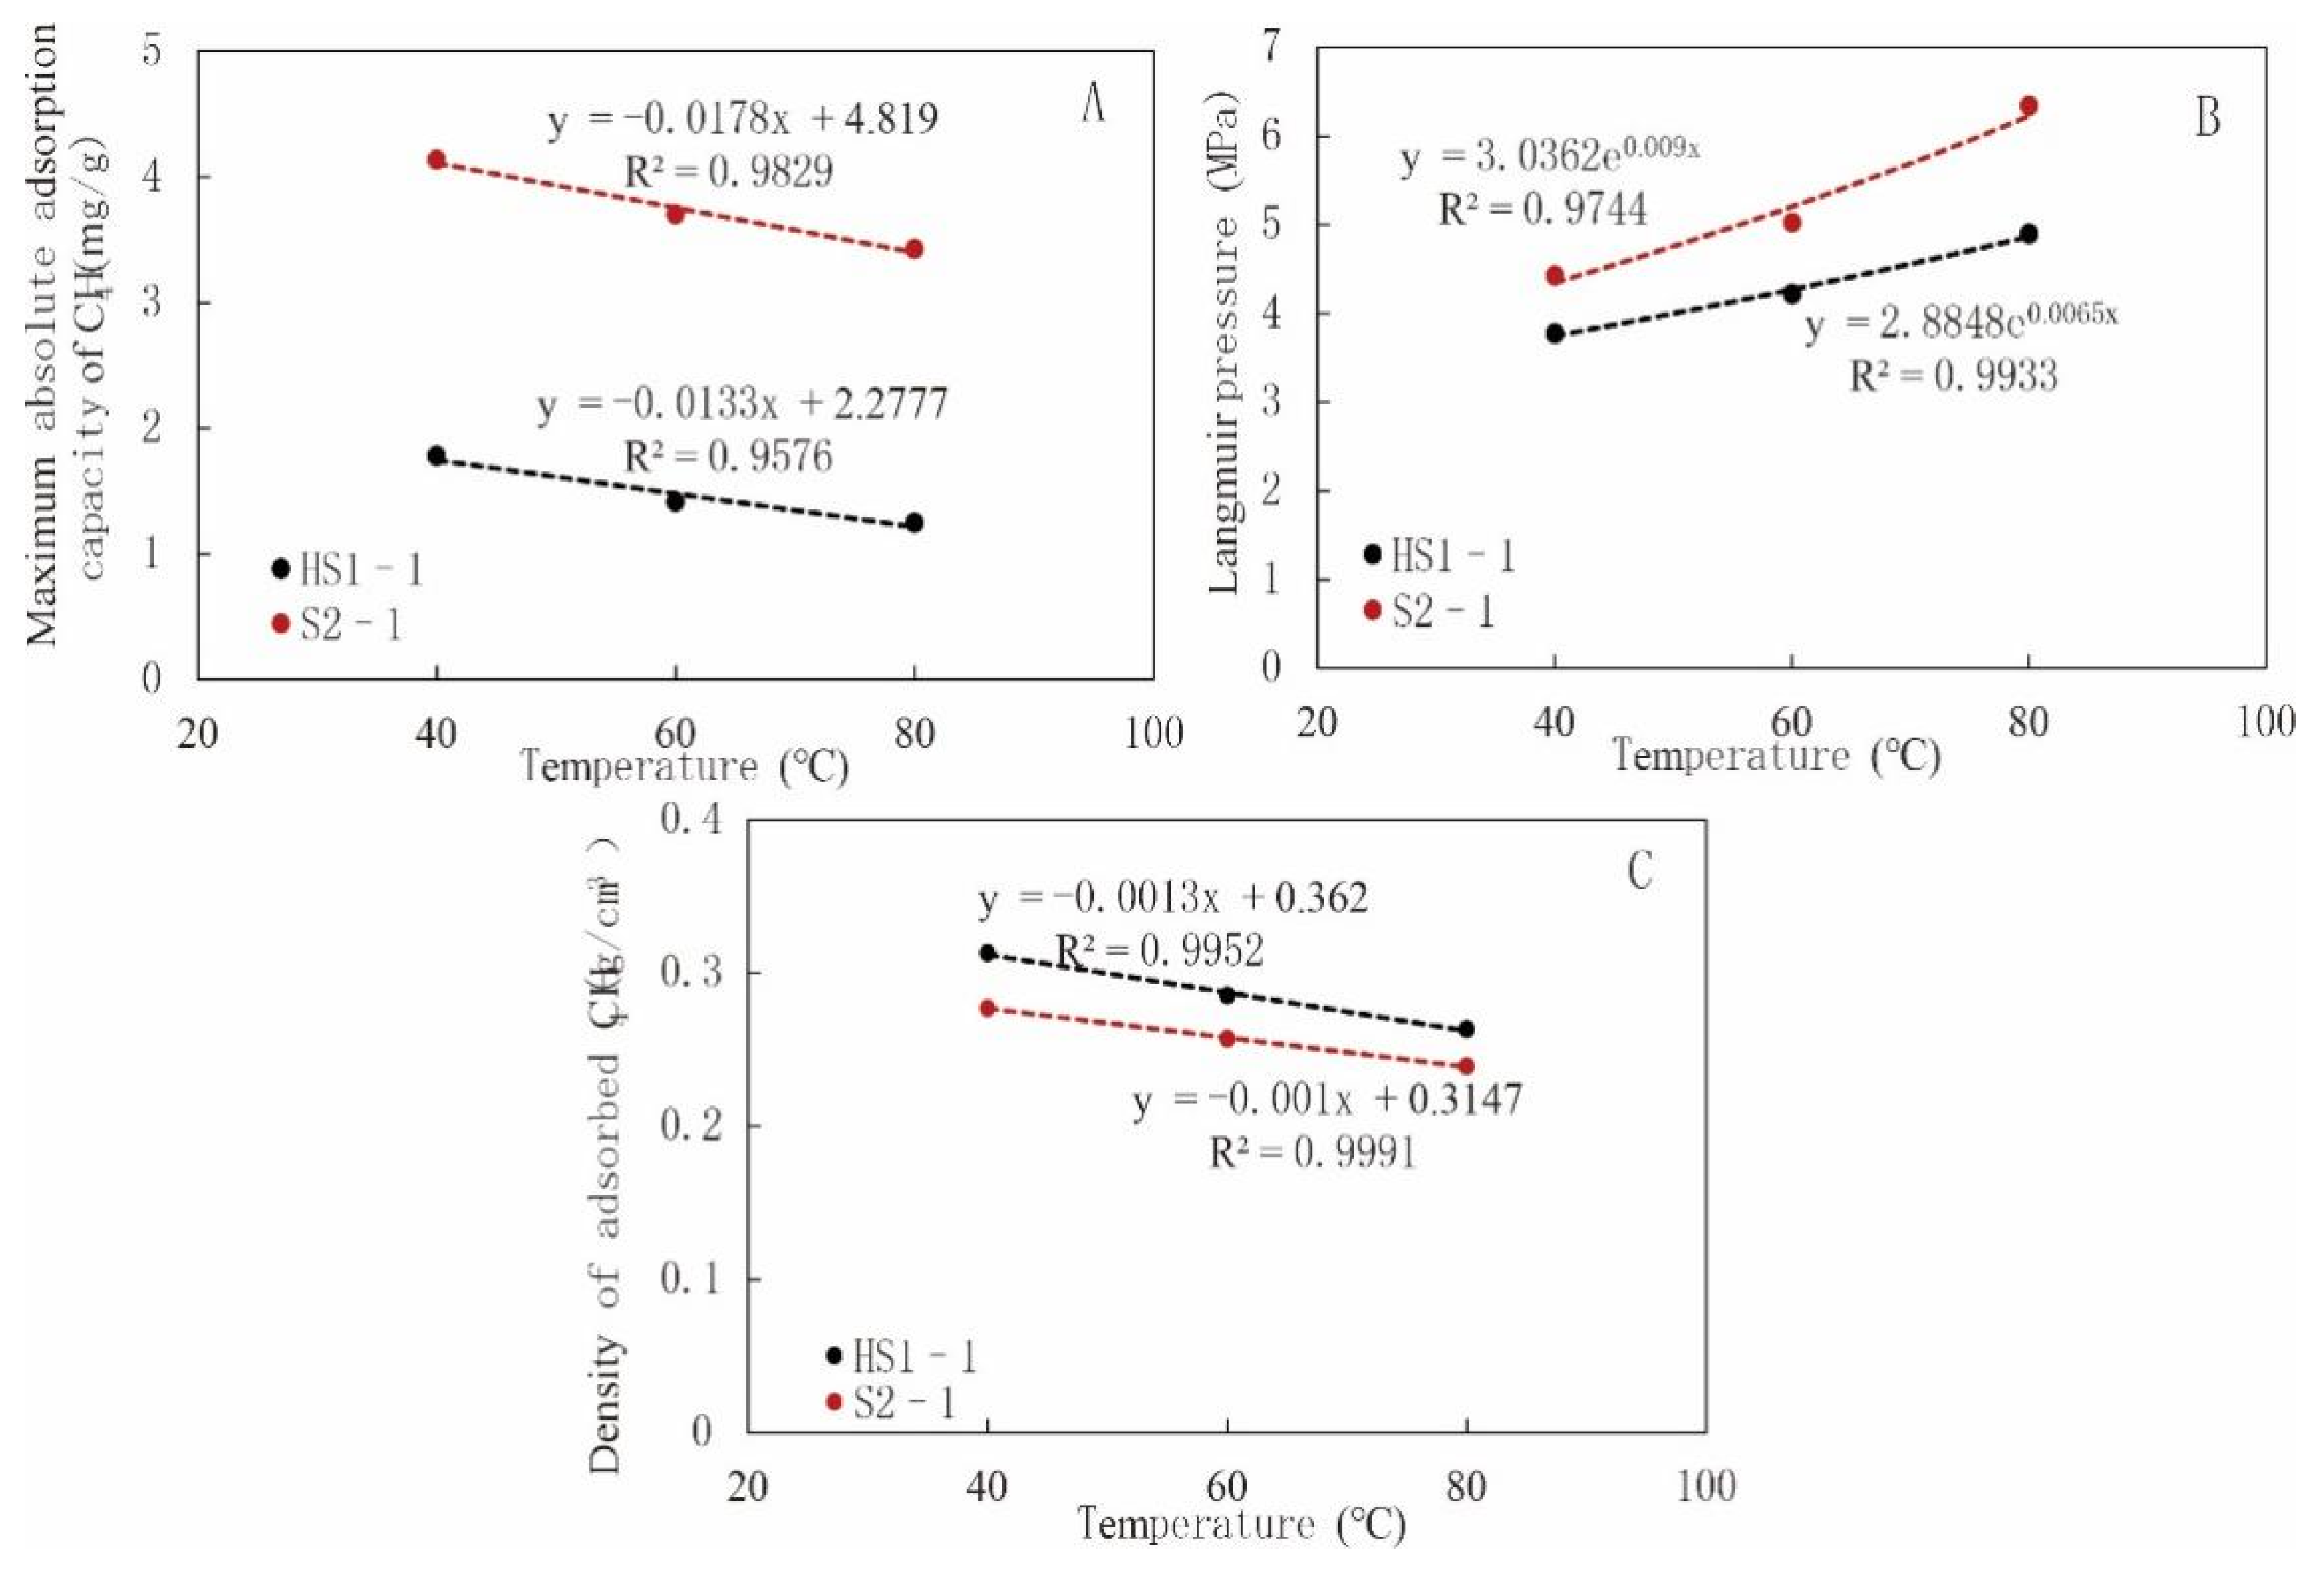
4.4. CH4 Excess Adsorption

The measured excess adsorbed amount of CH4 at different pressures and temperatures are listed in Table 3, and the Langmuir-based-model-fitted excess adsorption isotherms of CH4 are illustrated in Figure 5. The excess adsorbed amount of CH4 for HS1–1 and S2–1 increased at first with increasing pressure, reached a maximum value at pressures between 10 and 12 MPa, and then decreased (Figure 5A,B), in which the shapes were similar with previous studies [14,18]. Moreover, the excess adsorbed amounts at lower temperatures were larger than those at higher temperatures under certain pressure. According to Equation (1), the n e x c was approaching to zero when the pressure was high enough or the free phase density and adsorbed density of CH4 converged with the increasing pore pressure, which explained the isotherm trend well. The maximum n e x c also demonstrated a significant positive correlation between Langmuir pressure and temperature [18]. The excess adsorption isotherms decreased with a reducing decline rate in the pressure range of 12–40 MPa, which was contradictory to the Langmuir model (Equation (2)). The main reason for this phenomenon is attributed to the increase rate of ρ g being inconsistent with increasing pressure [31].
The fitted parameters of the Langmuir–based excess adsorption model (Equation (3)), which were based on measured excess adsorption amounts in the pressure range of 0–40 MPa, are listed in Table 4. Obviously, n o and ρ a d s were decreasing with increasing temperature and Langmuir pressure. The fitted n o for HS1–1 and S2–1 ranged from 1.25 to 4.14 mg/g at all temperatures, and ρ a d s ranged from 0.24 to 0.31 g/cm3. The fitting quality of the Langmuir-based model for HS1–1 and S2–1 were shown in their respective isotherm, which indicated a good correlation (Figure 5A,B). The maximum absolute adsorption capacities of CH4 fitted by the Langmuir-based excess adsorption model demonstrated that the fitted n o for HS1–1 and S2–1 at lower temperatures were generally larger than those at higher temperatures with a constant pressure (Figure 5C). However, the trend was opposite to increasing pressure at a constant temperature. The excess adsorption model could be used to predict the adsorption capacities of shales in this study [17,47,48].

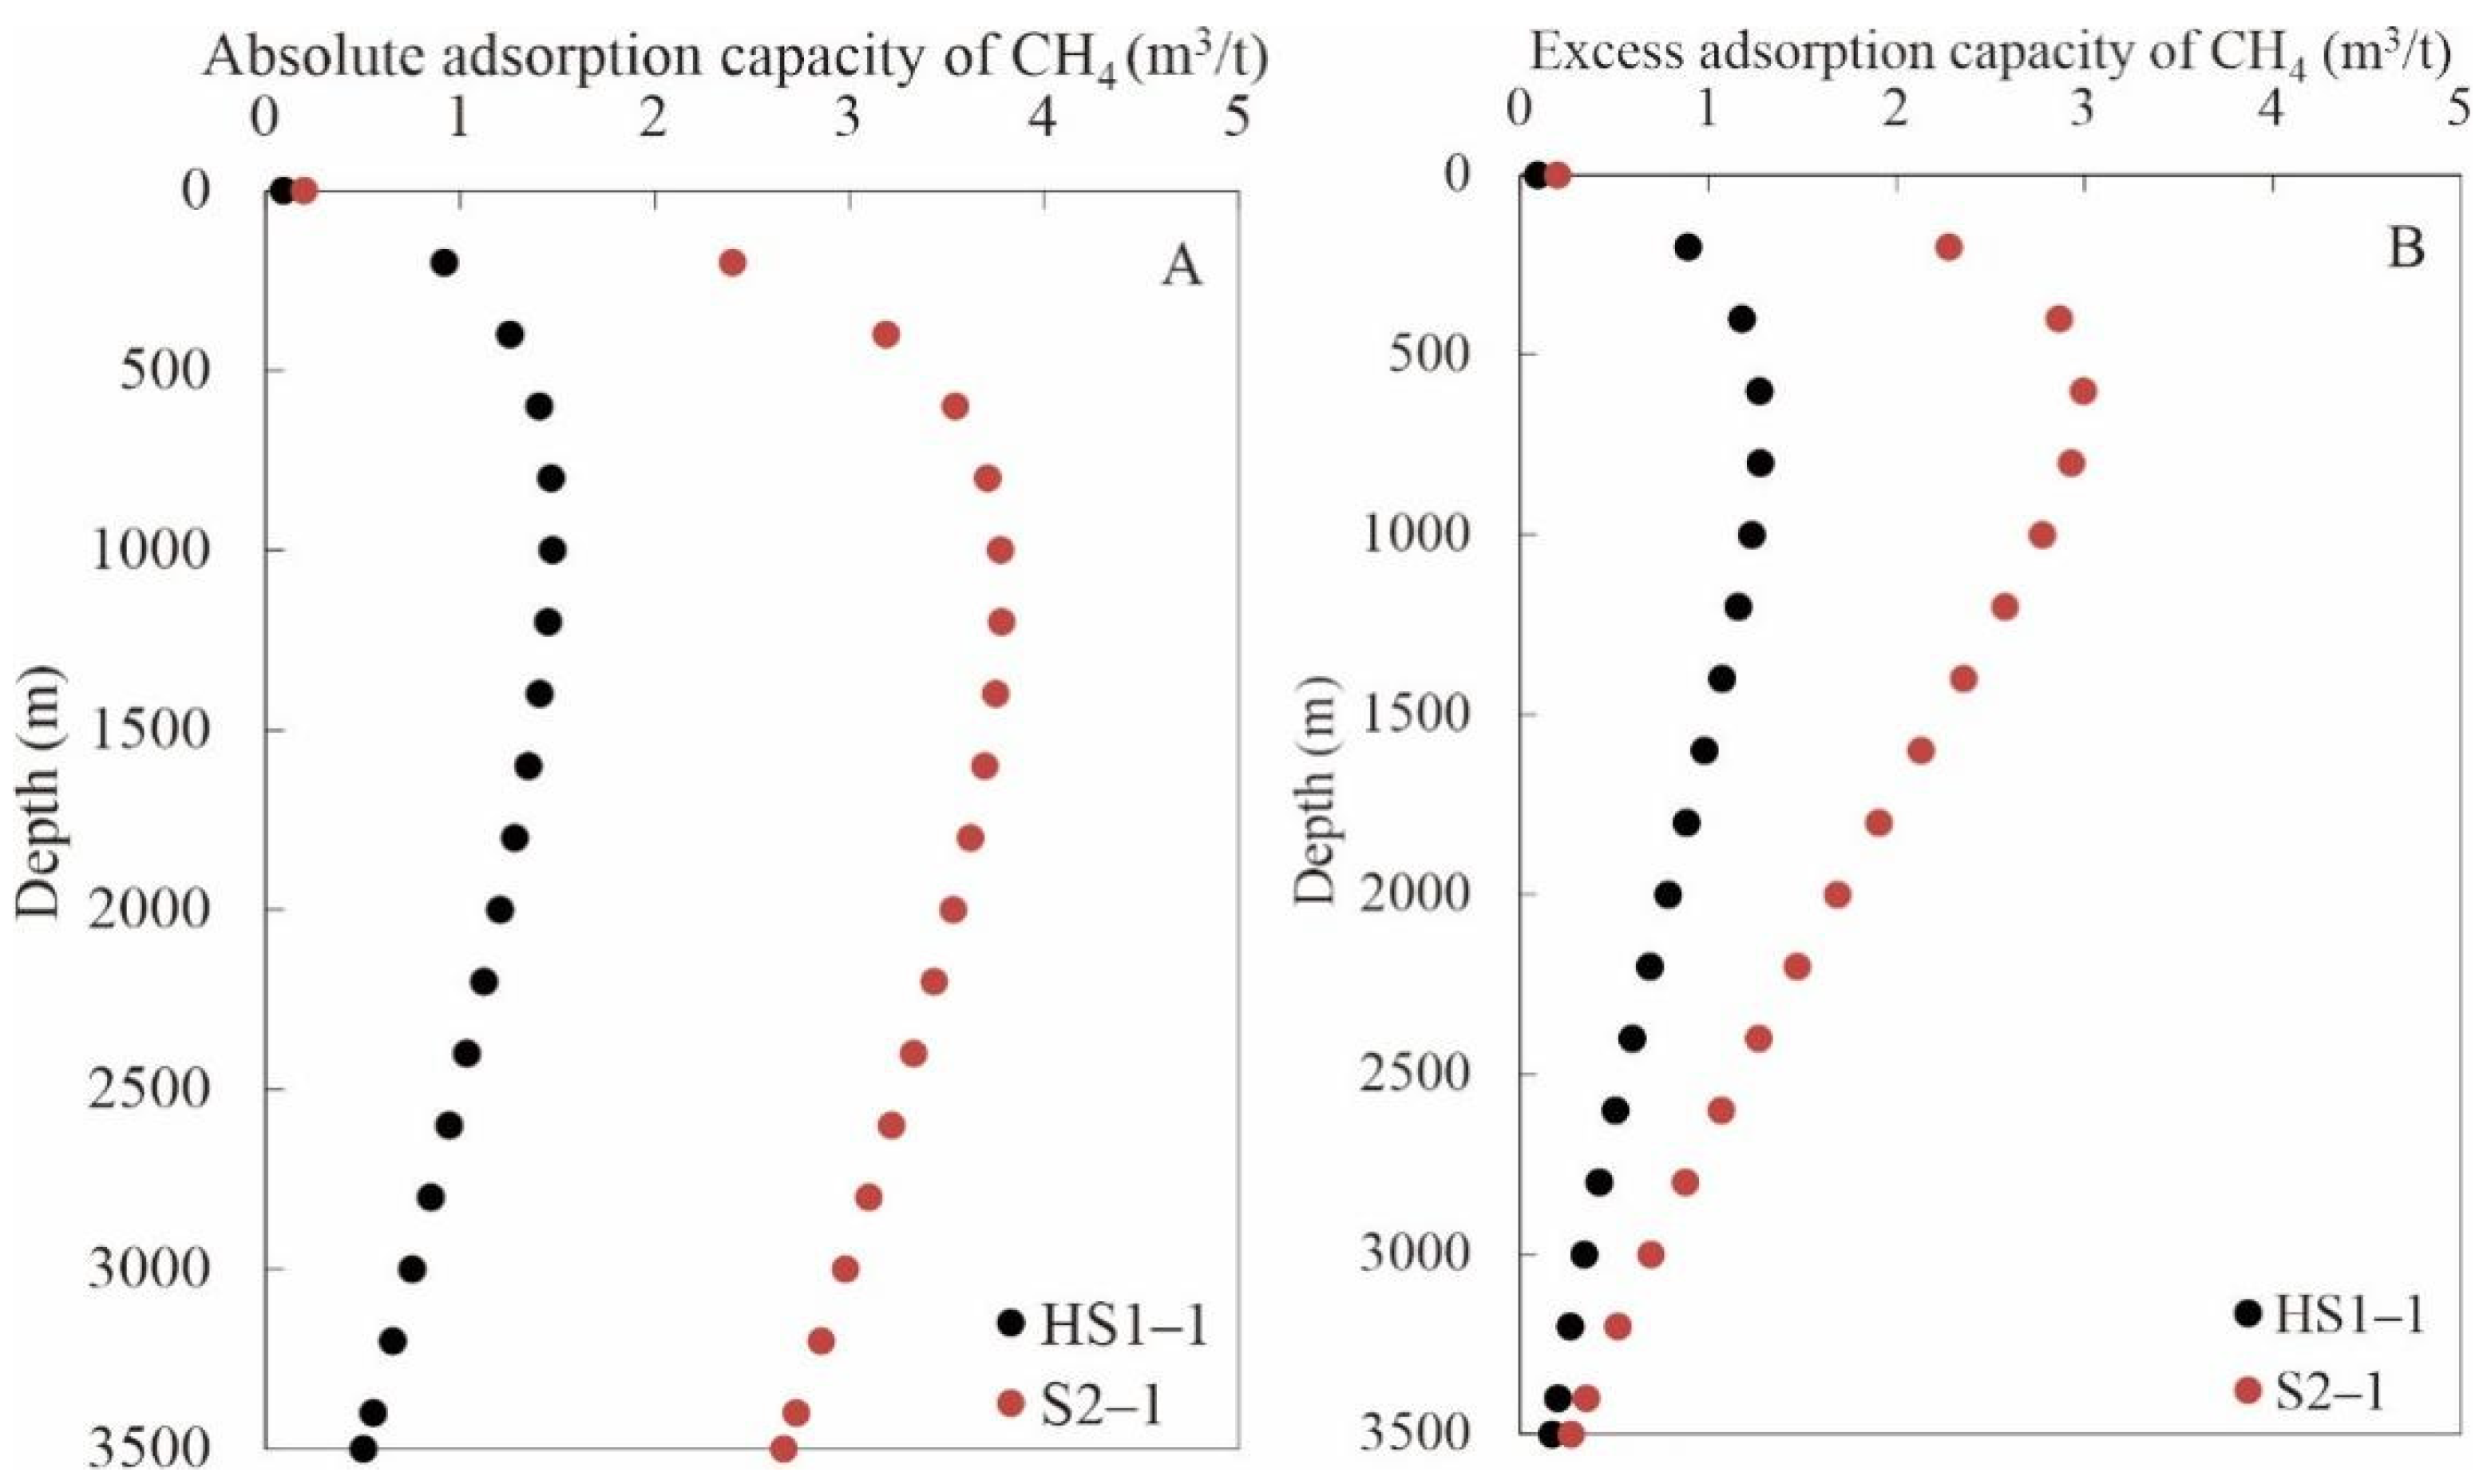
4.5. CH4 Adsorption Capacity Profiles with Depth

Based on Equations (2) and (3), the pressure- and temperature-dependent Langmuir-based absolute and excess adsorption models were created. The fitted values of the maximum absolute adsorption capacity of CH4 ( n o ), Langmuir pressure ( P L ), and density of adsorbed CH4 ( ρ a d s ) were all temperature-dependent (Figure 6) [14], which showed good correlations. The pressure coefficient of fluid formation in the Yingcheng and Shahezi formations was normal in the Lishu Fault Depression, with an average pressure coefficient of 1.04 MPa/100 m. The present average geothermal gradient was 3.5 °C/100 m. Therefore, the resulting absolute and excess adsorption CH4 capacity profiles versus depth are displayed in Figure 7. The maximum hydrostatic pressures and temperatures of the studied formations (K1sh2 and K1yc1), which had a depth of up to 3500 m, were within the experimental conditions. Thus, the CH4 adsorption capacity in this study was represented in the form of volume in STP condition.
In Figure 7, it can be seen that the absolute adsorption capacity and excess adsorption capacity of CH4 were all increasing at first with increasing depth and reached a maximum value, and then decreasing, in which the excess adsorption capacity decreased faster. This phenomenon resulted from the adsorption capacity of CH4 varying bi-directionally with temperature and pressure [14,15,18,19,31,47]. The deeper buried depth was favorable for CH4 adsorption, but the higher strata temperature had an opposite effect on the adsorption process. The maximum absolute adsorption capacities of CH4 for HS1–1 (1.48 m3/t) and S2–1 (3.78 m3/t) at depths of 1000 and 1200 m (Figure 7A) and the maximum excess adsorption capacities of CH4 for HS1–1 (1.27 m3/t) and S2–1 (2.99 m3/t) at depths of 800 and 600 m (Figure 7B) both indicated that shales in the Yingcheng Formation have a better adsorption capacity of CH4 than those in the Shahezi Formation.

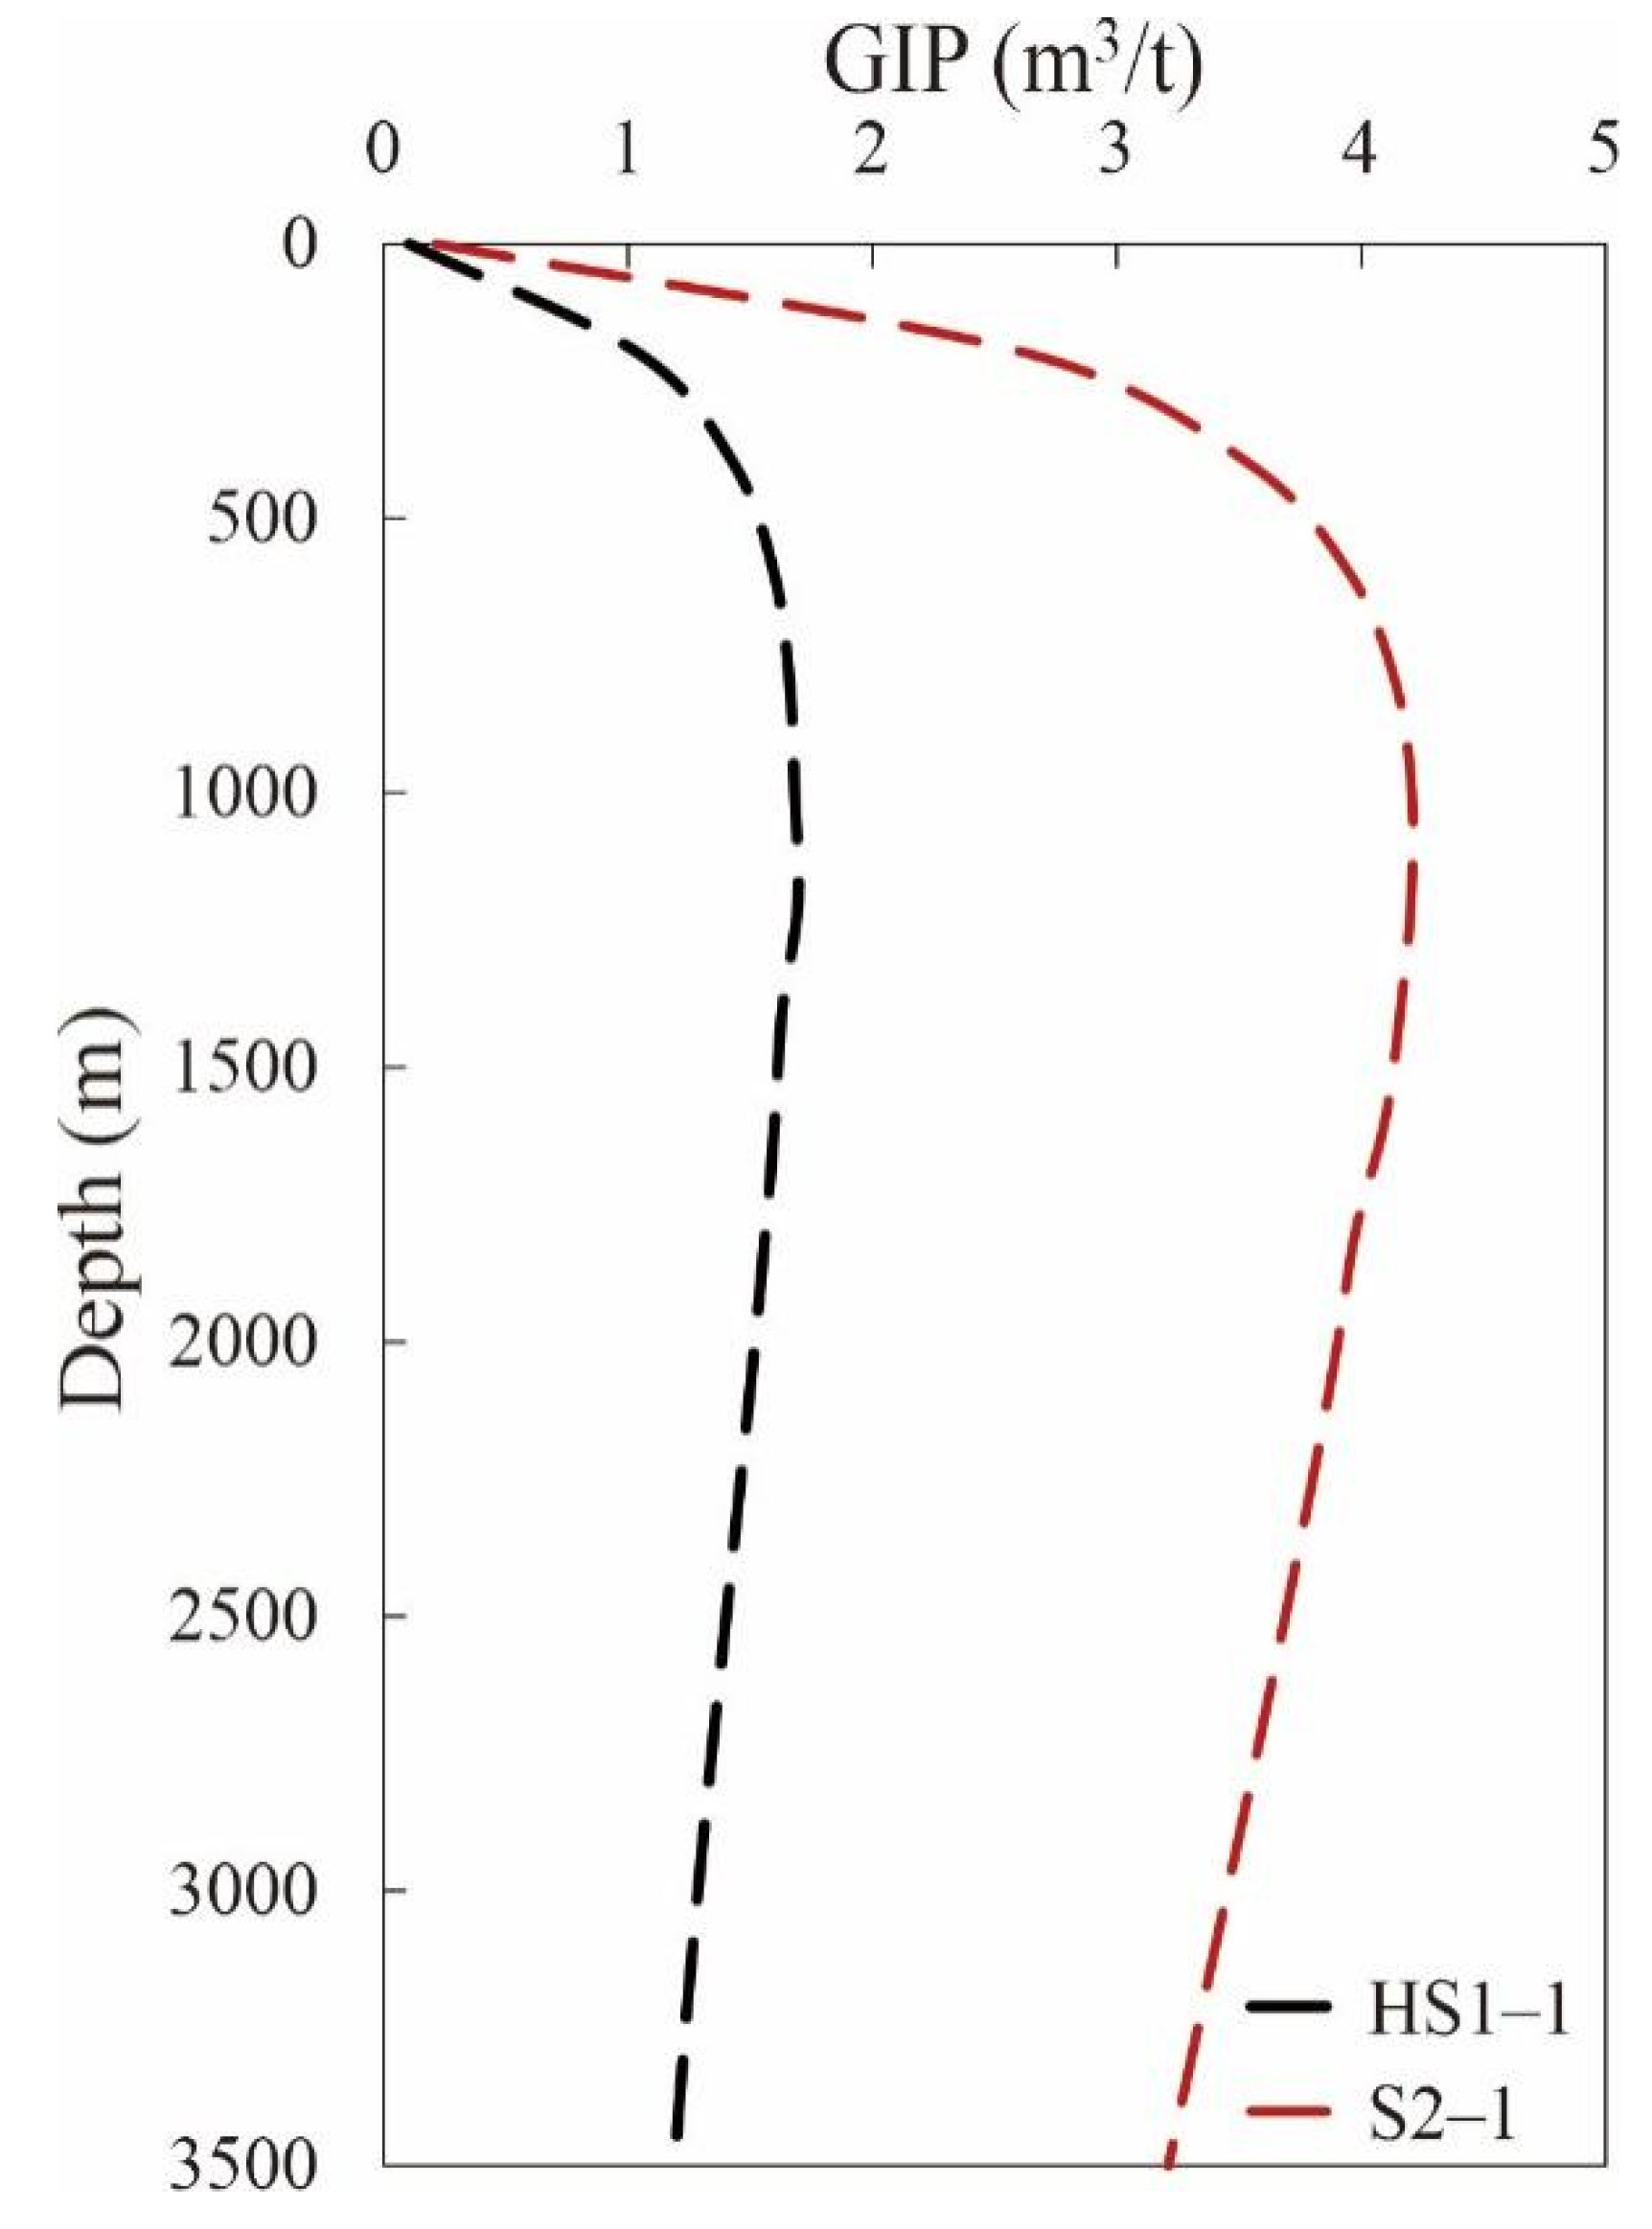
4.6. Evaluations of GIP: Implications for Shale Gas Resources

The GIP calculation referred to the maximum amount of gas stored in shale reservoirs [12,13], which was the sum of the free gas content and adsorbed gas content [14]. The adsorbed gas amount was obtained based on excess adsorption data, while the free gas amount was calculated from the pore volume and free gas density under geological temperature and pressure [12,14]. The modified and simple equation was developed by Tian et al. [14] to calculate GIP, as shown in Equation (4):
GIP = n f r e e + n e x c
The free gas densities of CH4 at different experimental temperatures and pressures were obtained from the NIST package [31]. The total porosity of the shale in geological conditions was measured from the porosity measurement under overburden pressure and the obtained pore volume variation under overburden pressure as illustrated in Figure 3B. The pore volumes of HS1–1 and S2–1 were 0.0123 and 0.0183 cm3/g without overburden pressure, respectively, and showed the same trend as porosity with increasing overburden pressure (Figure 3A,B). The fitting curve between the measured pore volume and the overburden pressure in the range of 0–40 MPa showed a good correlation, which was applied to calculate GIP. However, when the overburden pressure was greater than 40 MPa, the pore volume in GIP calculation was used with the value that measured in 40 MPa.
The average density of shales in the Shahezi and Yingcheng formations was 2.67 g/cm3. Based on free CH4 density obtained from the NIST package [31] and the above calculated excess CH4 adsorption amounts, the relationship between the buried depth and GIP was established and shown in Figure 8. It is worth noting that, here, the GIP calculation for the Shahezi and Yingcheng formations should be overestimated because the CH4 adsorption isotherms were actually conducted under dry conditions [12,13,14]. The estimated GIP values of HS1–1 (1.388 m3/t) and S2–1 (3.307 m3/t) at sampling depth indicated favorable shale gas resources potential, especially in shales of the Yingcheng Formation. The GIP profiles also showed a trend of increasing values with increasing depth at first, and then gradually diminishing in different decrease rate.
The free gas presented in micro-fractures and macropores was mainly controlled by porosity and gas saturation [49] and preserved in relatively closed systems [50]. The adsorbed gas in the micropores and mesopores was determined by geologically imposed pressure and temperature conditions [10,50]. The thick shale layers with high organic matter abundances (TOC > 2%), kerogen type Ⅱ, and over maturity (Ro > 2.0%) indicated that, in the whole situation, a good hydrocarbon generation basis is present in the Shahezi and Yingcheng formations, whilst the dominant micropores and mesopores in shales could provide abundant storage spaces for adsorbed gas, which probably serve as cap rocks to keep gas within organic-rich shales. The available micro–fractures (Figure 2D,E) and dissolution pores (Figure 2A,B) were prone to form interconnected cracks and provide favorable migration pathways [9] during the hydraulic fracturing process. On the other hand, the high brittle mineral content (>50%) was helpful to shale gas development and sustained productivity. In practice, the above viewpoint was proven by the shale gas production drilling results as follows: 30,000 m3/d at depth of 3158.6–3161.6 m from the first member of the Yingcheng Formation in borehole S2 during fracturing test [7] and 6036 m3/d at depth of 2823–2825 m in the Yingcheng Formation after fracturing in borehole L2. The great production of shale gas in these two drilling wells is consistent with the distribution and thickness of shales in the Yingcheng Formation in this area (Figure 9). In brief, shales from the Shahezi and Yingcheng formations in the Lishu Fault Depression should be regarded as a main target of shale gas reservoir evaluation.

5. Conclusions

A variety of measurements and experiments were conducted on typical shale samples in the Shahezi and Yingcheng formations in order to demonstrate the shale gas resource potential in the Lishu Fault Depression. The most significant outcomes were as follows:
(1) The shales in the source rocks of the Shahezi and Yingcheng formations had high abundance of organic matter, with TOC > 2.0%, and were in a high to over mature stage, with Ro values of 1.6–2.1%, which demonstrate that the organic-rich shales possessed superior hydrocarbon generation and tended to be gas-producing. The large thicknesses of these shales could serve as favorable regional cap rocks for the in situ generation and accumulation of shale gas.
(2) The FE-SEM micrograph observation illustrated that different pore types were developed in the shales, including dissolution pores, inter-layer pores of clay minerals, micro-fractures, intra-granular pores, and organic pores. The low-pressure N2 adsorption isotherms revealed that the pore size distribution of shales was mainly constituted by micropores (0.5–1.7 nm) and mesopores (2.2–34.3 nm), which were mainly contributed by OM and clay minerals. Especially, the pore volumes were mainly comprised of mesopores, with mean pore widths of 4.314 to 6.989 nm. Thus, high values of the total porosity (3.11–4.70%) and permeability (1.24 × 10⁻³–1.52 × 10⁻³ μm2) were developed in these shales, which was helpful to the flow, development and sustained productivity of shale gas.
(3) According to the measured CH4 excess adsorption amount and the calculated maximum absolute adsorption capacities of CH4 based on the Langmuir adsorption model, the estimated GIP values of HS1–1 (1.388 m3/t) and S2–1 (3.307 m3/t) were suitable for the geological hydrostatic pressure and temperature conditions at sampling depth. As a consequence, great potential and prospecting of shale gas resources are present in the Lishu Fault Depression, and the shales in the Shahezi and Yingcheng formations could be regarded as favorable targets for shale gas reservoirs.

Author Contributions

Conceptualization, Q.X. and H.X.; methodology, Q.X. and H.X.; software, H.X.; validation, Q.X., H.X. and S.Y.; formal analysis, H.X. and S.Y.; investigation, H.X.; resources, Q.X. and H.X.; data curation, H.X. and S.Y.; writing—original draft preparation, Q.X.; writing—review and editing, H.X.; visualization, H.X.; supervision, H.X.; project administration, H.X.; funding acquisition, Q.X. All authors have read and agreed to the published version of the manuscript.

Funding

This research was jointly funded by the National Natural Science Foundation of China, grant number 41572104, and the China Geological Survey Project, grant number 1212011220752.

Institutional Review Board Statement

Not applicable.

Informed Consent Statement

Not applicable.

Data Availability Statement

Not applicable.

Conflicts of Interest

The authors declare no conflict of interest.

Abbreviation

TOCTotal organic carbon content, %;
RoVitrinite reflectance, %;
nexcExcess adsorption amount, mg/g;
nabsAbsolute adsorption amount, mg/g;
VadsVolume of adsorbed gas phase, cm3/g;
ρadsDensity of adsorbed gas phase, mg/cm3;
ρgDensity of free gas phase, mg/cm3;
noMaximum absolute methane adsorption capacity, mg/g;
PPressure, MPa;
PLLangmuir pressure, MPa;
GIPGas-in-place, cm3/g rock under STP conditions;
nfreeFree gas storage capacity, cm3/g rock under STP conditions.

References

  1. Dong, T.; He, S.; Yin, S.Y.; Wang, D.X.; Hou, Y.G.; Guo, J.G. Geochemical characterization of source rocks and crude oils in the upper Cretaceous Qingshankou formation, Changling sag, southern Songliao Basin. Mar. Petrol. Geol. 2015, 64, 173–188. [Google Scholar] [CrossRef]
  2. Xu, J.J.; Liu, Z.J.; Bechtel, A.; Sachsenhofer, R.F.; Jia, J.J.; Meng, Q.T.; Sun, P.C. Organic matter accumulation in the upper cretaceous Qingshankou and Nenjiang formations, Songliao Basin (NE China): Implications from high–resolution geochemical analysis. Mar. Petrol. Geol. 2019, 102, 187–201. [Google Scholar] [CrossRef]
  3. Yang, X.; Wang, H.; Li, Z.; Guan, C.; Wang, X. Tectonic–sedimentary evolution of a continental rift basin: A case study of the Early Cretaceous Changling and Lishu Fault Depressions, southern Songliao Basin, China. Mar. Petrol. Geol. 2021, 128, 105068. [Google Scholar] [CrossRef]
  4. Zhang, M.; Li, H.B.; Wang, X. Geochemical characteristics and grouping of the crude oils in the Lishu Fault Depression, Songliao basin, NE China. J. Petrol. Sci. Eng. 2013, 110, 32–39. [Google Scholar] [CrossRef]
  5. Tang, Y.; Yang, R.; Zhu, J.; Yin, S.; Fan, T.; Dong, L.; Hou, Y. Analysis of continental shale gas accumulation conditions in a rifted basin: A case study of Lower Cretaceous shale in the southern Songliao Basin, northeastern China. Mar. Petrol. Geol. 2019, 101, 389–409. [Google Scholar] [CrossRef]
  6. Zhou, N.; Lu, S.; Zhang, P.; Wang, M.; Xiao, D.; Li, J.; Chen, G.; Wang, J.; Zhang, Y.; Lin, Z. Continental shale gas dynamic enrichment and evolution over geological time. Int. J. Coal Geol. 2021, 251, 103914. [Google Scholar] [CrossRef]
  7. Song, Z.; Li, Z.; Zhang, X.; Zhou, Z.; Yang, H. Characteristics of shale gas reservoirs and evaluation of their gas potential in Sujiatun area, Lishu Fault Depression, Songliao Basin. Petrol. Geol. Exp. 2015, 37, 606–613, (In Chinese with English Abstract). [Google Scholar] [CrossRef]
  8. GB/T 31483–2015; PRC National Standard: Geological Evaluation Methods for Shale Gas. China Quality and Standards Publishing & Media Co., Ltd.: Beijing, China, 2015. (In Chinese)
  9. Curtis, J.B. Fractured shale-gas systems. AAPG Bull. 2002, 86, 1921–1938. [Google Scholar] [CrossRef]
  10. Hao, F.; Zou, H. Cause of shale gas geochemical anomalies and mechanisms for gas enrichment and depletion in high-maturity shales. Mar. Petrol. Geol. 2013, 44, 1–12. [Google Scholar] [CrossRef]
  11. Li, W.; Li, J.; Lu, S.; Chen, G.; Pang, X.; Zhang, P.; He, T. Evaluation of gas-in-place content and gas-adsorbed ratio using carbon isotope fractionation model: A case study from Longmaxi shales in Sichuan Basin, China. Int. J. Coal Geol. 2022, 249, 103881. [Google Scholar] [CrossRef]
  12. Wei, S.; He, S.; Hu, M.; Yang, W.; Guo, X.; Iglauer, S.; Zhai, G. Supercritical high–pressure methane adsorption on the lower Cambrian Shuijingtuo shale in the Huangling anticline area, south China: Adsorption behavior, storage characteristics, and geological implications. Energy Fuels 2021, 35, 19973–19985. [Google Scholar] [CrossRef]
  13. Ross, D.J.K.; Bustin, R.M. The importance of shale composition and pore structure upon gas storage potential of shale gas reservoirs. Mar. Petrol. Geol. 2009, 26, 916–927. [Google Scholar] [CrossRef]
  14. Tian, H.; Li, T.; Zhang, T.; Xiao, X. Characterization of methane adsorption on overmature Lower Silurian–Upper Ordovician shales in Sichuan Basin, southwest China: Experimental results and geological implications. Int. J. Coal Geol. 2016, 156, 36–49. [Google Scholar] [CrossRef]
  15. Rani, S.; Padmanabhan, E.; Prusty, B.K. Review of gas adsorption in shales for enhanced methane recovery and CO2 storage. J. Petrol. Sci. Eng. 2019, 175, 634–643. [Google Scholar] [CrossRef]
  16. Lewis, R.; Ingraham, D.; Pearcy, M.; Williamson, J.; Sawyer, W.; Frantz, J. New Evaluation Techniques for Gas Shale Resezrvoirs. 2004. Available online: http://citeseerx.ist.psu.edu/viewdoc/download?doi=10.1.1.455.2453&rep=rep1&type=pdf (accessed on 18 April 2022).
  17. Tang, Y.; Li, L.; Jiang, S. A logging interpretation methodology of gas content in shale reservoirs and its application. Nat. Gas Ind. 2014, 34, 46–54, (In Chinese with English Abstract). [Google Scholar] [CrossRef]
  18. Tang, X.; Ripepi, N.; Stadie, N.P.; Yu, L.; Hall, M.R. A dual-site Langmuir equation for accurate estimation of high pressure deep shale gas resources. Fuel 2016, 185, 10–17. [Google Scholar] [CrossRef] [Green Version]
  19. Chen, L.; Liu, K.; Jiang, S.; Huang, H.; Tan, J.; Zuo, L. Effect of adsorbed phase density on the correction of methane excess adsorption to absolute adsorption in shale. Chem. Eng. J. 2021, 420, 127678. [Google Scholar] [CrossRef]
  20. Liu, F.; Cheng, R.; Xie, Q.; Hu, W.; Tang, J.; Li, Z.; Yang, X.; Xu, H.; Zhou, L. The potential evaluation of shale gas resources of Lishu Fault Depression in Songliao basin. J. Jilin Univ. Earth Sci. Ed. 2014, 44, 762–773, (In Chinese with English Abstract). [Google Scholar] [CrossRef]
  21. GB/T 19145–2003; PRC National Standard: Determination of Total Organic Carbon in Sedimentary Rock. China Quality and Standards Publishing & Media Co., Ltd.: Beijing, China, 2003. (In Chinese)
  22. ASTM D7708–14; Standard Test Method for Microscopical Determination of the Reflectance of Vitrinite Dispersed in Sedimentary Rocks. ASTM International: West Conshohocken, PA, USA, 2014. [CrossRef]
  23. Xu, H.; Xie, Q.; Wang, S.; Yu, S. Organic geochemical characteristics and gas prospectivity of Permian source rocks in western margin of Songliao Basin, northeastern China. J. Petrol. Sci. Eng. 2021, 205, 108863. [Google Scholar] [CrossRef]
  24. SY/T 5163–2018; PRC Oil and Gas Industry Standard: Analysis Method for Clay Minerals and Ordinary Non–Clay Minerals in Sedimentary Rocks by the X-ray Diffraction. China National Energy Administration: Beijing, China, 2018. (In Chinese)
  25. SY/T 6385–2016; PRC Oil and Gas Industry Standard: Porosity and Permeability Measurement under Overburden Pressure. China National Energy Administration: Beijing, China, 2016. (In Chinese)
  26. Loucks, R.G.; Reed, R.M.; Ruppel, S.C.; Hammes, U. Spectrum of pore types and networks in mudrocks and a descriptive classification for matrix–related mudrock pores. AAPG Bull. 2012, 96, 1071–1098. [Google Scholar] [CrossRef] [Green Version]
  27. GB/T 21650.2–2008; PRC National Standard: Pore Size Distribution and Porosity of Solid Materials by Mercury Porosimetry and Gas Adsorption–Part 2: Analysis of Mesopores and Macropores by Gas Adsorption. China Quality and Standards Publishing & Media Co., Ltd.: Beijing, China, 2008. (In Chinese)
  28. Brunauer, S.; Emmett, P.; Teller, E. Adsorption of gases in multimolecular layers. J. Am. Chem. Soc. 1938, 60, 309–319. [Google Scholar] [CrossRef]
  29. Barrett, E.P.; Joyner, L.G.; Halenda, P.P. The determination of pore volume and area distributions in porous substances. I. Computations from nitrogen isotherms. J. Am. Chem. Soc. 1951, 73, 373–380. [Google Scholar] [CrossRef]
  30. Geerlings, P.; De Proft, F.; Langenaeker, W. Conceptual density functional theory. Chem. Rev. 2003, 103, 1793–1874. [Google Scholar] [CrossRef] [PubMed]
  31. Setzmann, U.; Wagner, W. A new equation of state and tables of thermodynamic properties for methane covering the range from the melting line to 625 K at pressures up to 100 MPa. J. Phys. Chem. Ref. Data 1991, 20, 1061–1155. [Google Scholar] [CrossRef] [Green Version]
  32. Keller, J.U.; Staudt, R. Gas Adsorption Equilibria: Experimental Methods and Adsorptive Isotherms; Springer Science & Business Media, Inc.: New York, NY, USA, 2005. [Google Scholar]
  33. Langmuir, I. The adsorption of gases on plane surfaces of glass, mica and platinum. J. Am. Chem. Soc. 1918, 40, 1361–1403. [Google Scholar] [CrossRef] [Green Version]
  34. Thyberg, B.; Jahren, J. Quartz cementation in mudstones: Sheet-like quartz cement from clay mineral reactions during burial. Petrol. Geosci. 2011, 17, 53–63. [Google Scholar] [CrossRef]
  35. De Silva, P.N.K.; Simons, S.J.R.; Stevens, P.; Philip, L.M. A comparison of North American shale plays with emerging non-marine shale plays in Australia. Mar. Pet. Geol. 2015, 67, 16–29. [Google Scholar] [CrossRef] [Green Version]
  36. Chalmers, G.R.; Ross, D.J.; Bustin, R.M. Geological controls on matrix permeability of Devonian gas shales in the Horn River and Liard basins, northeastern British Columbia, Canada. Int. J. Coal Geol. 2012, 103, 120–131. [Google Scholar] [CrossRef]
  37. Chalmers, G.R.; Bustin, R.M.; Power, I.M. Characterization of gas shale pore systems by porosimetry, pycnometry, surface area, and field emission scanning electron microscopy/transmission electron microscopy image analyses: Examples from the Barnett, Woodford, Haynesville, Marcellus, and Doig units. AAPG Bull. 2012, 96, 1099–1119. [Google Scholar] [CrossRef]
  38. Wang, M.; Xue, H.T.; Tian, S.S.; Wilkins, R.W.T.; Wang, Z.W. Fractal characteristics of upper cretaceous lacustrine shale from the Songliao Basin, NE China. Mar. Petrol. Geol. 2015, 67, 144–153. [Google Scholar] [CrossRef]
  39. Tian, H.; Pan, L.; Zhang, T.; Xiao, X.; Meng, Z.; Huang, B. Pore characterization of organic-rich lower Cambrian shales in Qiannan depression of Guizhou province, Southwestern China. Mar. Petrol. Geol. 2015, 62, 28–43. [Google Scholar] [CrossRef]
  40. Wang, Y.; Zhu, Y.; Chen, S.; Li, W. Characteristics of the nanoscale pore structure in Northwestern Hunan shale gas reservoirs using field emission scanning electron microscopy, high-pressure mercury intrusion, and gas adsorption. Energy Fuels 2014, 28, 945–955. [Google Scholar] [CrossRef]
  41. Curtis, M.E.; Cardott, B.J.; Sondergeld, C.H.; Rai, C.S. Development of organic porosity in the Woodford Shale with increasing thermal maturity. Int. J. Coal Geol. 2012, 103, 26–31. [Google Scholar] [CrossRef]
  42. Ambrose, R.J.; Hartman, R.C.; Diaz-Campos, M.; Akkutlu, I.Y.; Sondergeld, C.H. New Pore–Scale Considerations for Shale Gas in Place Calculations; Society of Petroleum Engineers: Houston, TX, USA, 2010. [Google Scholar] [CrossRef]
  43. Sing, K.S.W.; Everett, D.H.; Haul, R.A.W.; Moscou, L.; Pierotti, R.A.; Rouquerol, J.; Siemieniewska, T. Reporting physisorption data for gas/solid systems with special reference to the determination of surface area and porosity. Pure Appl. Chem. 1985, 57, 603–619. [Google Scholar] [CrossRef]
  44. King, H.E., Jr.; Eberle, A.P.; Walters, C.C.; Kliewer, C.E.; Ertas, D.; Huynh, C. Pore architecture and connectivity in gas shale. Energy Fuels 2015, 29, 1375–1390. [Google Scholar] [CrossRef]
  45. Li, H.; Liu, D.; Peng, P.; Wang, Q. Tectonic impact on reservoir character of Chongqing and its neighbor area. Nat. Gas Geosci. 2015, 26, 1705–1711. [Google Scholar] [CrossRef]
  46. Do, D.D.; Do, H.D. Pore characterization of carbonaceous materials by DFT and GCMC simulations: A review. Adsorpt. Sci. Technol. 2003, 21, 389–423. [Google Scholar] [CrossRef]
  47. Yang, F.; Ning, Z.; Zhang, R.; Zhao, H.; Krooss, B.M. Investigations on the methane sorption capacity of marine shales from Sichuan Basin, China. Int. J. Coal Geol. 2015, 146, 104–117. [Google Scholar] [CrossRef]
  48. Liang, L.; Luo, D.; Liu, X.; Xiong, J. Experimental study on the wettability and adsorption characteristics of Longmaxi Formation shale in the Sichuan Basin, China. J. Nat. Gas Sci. Eng. 2016, 33, 1107–1118. [Google Scholar] [CrossRef]
  49. Pan, L.; Xiao, X.; Tian, H.; Zhou, Q.; Cheng, P. Geological models of gas in place of the Longmaxi shale in southeast Chongqing, south China. Mar. Petrol. Geol. 2016, 73, 433–444. [Google Scholar] [CrossRef]
  50. Hao, F.; Zou, H.; Lu, Y. Mechanisms of shale gas storage: Implications for shale gas exploration in China. AAPG Bull. 2013, 97, 1325–1346. [Google Scholar] [CrossRef]
Figure 1. Location map and stratigraphic column of the lower Cretaceous formations in the Lishu Fault Depression.
Energies 15 05156 g001
Figure 2. Selected FE-SEM micrographs for sample HS1-1, which were collected from the second member of the Shahezi Formation (K1sh2) in borehole HS1 at a depth of 2551.53 m: (A) dissolution pores between the margins of quartz and feldspar; (B) dissolution pores at the edges of mineral matrix and OM; (C) inter-layer pores related to clay minerals; (D) micro-fractures developed between skeleton mineral particles; (E) micro-fractures presented along the edges of OM and skeleton minerals; (F) intra-granular pores within mineral particles; (G) slit-shaped organic pores; (H) sphere-shaped organic pores.
Energies 15 05156 g002
Figure 3. Porosity (A) and pore volume variations (B) under the overburden pressure of 0–50 MPa.
Energies 15 05156 g003
Figure 4. Low-pressure N2 adsorption isotherms (A) and pore width distribution (B,C).
Energies 15 05156 g004
Figure 5. Measured adsorbed amount and Langmuir-model-fitted excess adsorption isotherms of CH4 (A,B), comparison of maximum absolute adsorption capacities of CH4 fitted by Langmuir-based excess adsorption model based on data of 10, 30, and 40 MPa (C).
Energies 15 05156 g005
Figure 6. The temperature dependence of maximum absolute adsorption capacity of CH4 (A), Langmuir pressure (B), and density of absorbed CH4 (C) fitted by the Langmuir-based excess adsorption model.
Energies 15 05156 g006
Figure 7. Profiles of absolute adsorption capacity of CH4 (A) and excess adsorption capacity of CH4 (B) with depth based on Langmuir adsorption models.
Energies 15 05156 g007
Figure 8. GIP profiles as a function of depth.
Energies 15 05156 g008
Figure 9. Contour map of shale thickness in the Yingcheng Formation.
Energies 15 05156 g009
Table 1. Basic geochemical parameters of the studied samples.
SampleRo (%)TOC (%)Mineral Composition (%)
QuartzFeldsparCalciteDolomitePyriteClayIlliteI/SChlorite
HS1–11.62.0136.714.01.21.02.844.331.95.47.0
S2–12.12.4538.67.43.82.33.144.830.65.19.1
Table 2. Pore structure parameters of the studied samples.
SampleSBET (m2/g)VBJH (cm3/g)VDA (cm3/g)DBJH (nm)PMi (%)PMe (%)PMa (%)
HS1–110.5580.01450.00536.98925.8966.367.75
S2–135.1390.02660.01444.31443.3951.884.73
SBET, the total specific surface area calculated by BET method; VBJH and DBJH, the total pore volume of mesopores and macropores and the mean pore diameter calculated by BJH method, respectively; VDA, the micropore volume calculated by DA method; PMi, PMe, and PMa, pore volume percentage of micropores, mesopores, and macropores, respectively.
Table 3. Measured excess adsorbed amounts of CH4 at different temperatures and pressures.
SampleTemperature (°C)Excess Adsorbed Amounts of CH4 (mg/g)
0 MPa1 MPa2 MPa4 MPa6 MPa8 MPa10 MPa12 MPa15 MPa18 MPa22 MPa26 MPa30 MPa35 MPa40 MPa
HS1–14000.380.580.820.951.011.000.990.930.850.740.640.540.480.43
6000.260.440.630.710.760.780.770.730.660.600.520.430.360.31
8000.210.320.520.590.650.640.660.610.580.510.450.380.300.26
S2–14000.781.211.752.012.122.162.111.941.761.441.190.990.790.58
6000.621.001.461.711.831.851.831.701.561.331.130.910.640.52
8000.460.781.191.401.541.581.591.521.401.201.010.830.620.45
Table 4. Fitted parameters of the Langmuir-based excess adsorption model.
Sample n o   ( mg / g ) P L   ( MPa ) ρ a d s   ( g / cm 3 )
406080406080406080
HS1–11.78 1.42 1.25 3.77 4.22 4.90 0.31 0.29 0.26
S2–14.14 3.70 3.43 4.43 5.02 6.34 0.28 0.26 0.24
Publisher’s Note: MDPI stays neutral with regard to jurisdictional claims in published maps and institutional affiliations.

