Article

The Use of a Fault Tree Analysis (FTA) in the Operator Reliability Assessment of the Critical Infrastructure on the Example of Water Supply System

by
Krzysztof Boryczko
*,
Dawid Szpak
,
Jakub Żywiec
and
Barbara Tchórzewska-Cieślak
Department of Water Supply and Sewerage Systems, Faculty of Civil, Environmental Engineering and Architecture, Rzeszow University of Technology, Al. Powstancow Warszawy 6, 35-959 Rzeszow, Poland
*
Author to whom correspondence should be addressed.
Energies 2022, 15(12), 4416; https://doi.org/10.3390/en15124416
Submission received: 12 May 2022 / Revised: 31 May 2022 / Accepted: 15 June 2022 / Published: 17 June 2022
(This article belongs to the Section F4: Critical Energy Infrastructure)

Abstract

:
Background: Specialist literature indicates a large share of the human factor among the causes of failure of technical systems at the level of 70 to 90%, which depends on the sector studied. The collective water supply system is an anthropotechnical system, i.e., it is a complex connection between man and the technical system resulting from the deliberate influence of man on the technical system. Methods: The work presents an assessment of operator reliability of a selected water treatment process based on the fault tree analysis (FTA). Elementary events are determined by the operator’s error probability. Results: A failure tree was prepared for the peak event of the filter station failure, resulting from an operator’s error during the filter washing procedure. The probability of a peak event occurring is 0.0580. Conclusions: The developed fault tree allows for the identification of elementary events leading to an emergency event. The operator fulfills its task of maintaining the continuity of water treatment.

1. Introduction

The collective water supply system (CWSS) is an example of an anthropotechnical system and belongs to the so-called critical infrastructure alongside other key systems for the functioning of society and the country, e.g., energy supply systems [1]. Water supply systems are massive consumers of energy, which is mainly used for water treatment and pumping processes. An efficiently operating energy infrastructure is crucial for the safety of water supply to the urban agglomeration and its inhabitants. Due to the fact that the CWSS consists of several subsystems, the operator’s operation has a significant impact on maintaining their cooperation and ensuring the reliability of CWSS [1,2,3]. The reliability of the operator’s work is the ability to perform the assigned tasks with a minimal risk of making a mistake under certain conditions, at any time. The operator’s reliability assessment is based on data from the observation and archiving of all kinds of errors, procedural flaws, and faults in decisions made. In the work of the operator, the following states can be distinguished [4]:
  • optimal state—the system works properly, the operator supervises the current signals, and makes routine regulation of the system operating parameters. The operator’s thought processes are algorithmic (training and operational practice);
  • state of minimum loads—occurs in the control process of highly automated systems using computer techniques;
  • state of maximum loads—work requires creative thinking, a sense of responsibility for mistakes, and postponement of reactions. Specialized training and knowledge of emergency scenarios are required.
Hazards are the result of a sudden change that results in the loss or damage of technical value. In the opinion of the operator, lack of time and lack or excess of information may cause an emergency situation:
  • lack of time—the operator makes hasty decisions;
  • lack of information—the operator is not fully prepared for work and he lacks knowledge about the system;
  • excess of information—the operator receives too many signals and he cannot choose the most important information.
There are the following types of errors [4]:
  • an active error with immediate effects, causing the immediate occurrence of an undesirable event;
  • failure to comply with safety procedures:
    overestimating the possibilities,
    underestimating the threat;
  • misinterpretation:
    omission of facts,
    lack of concentration,
    lack of understanding;
  • error with deferred effects, usually of a planning nature.
The data available in the literature show that the human factor plays a major role in over 90% of accidents in the nuclear industry, over 80% of accidents in the chemical and fuel industry, over 75% of marine accidents, over 70% of aviation accidents, and over 75% of accidents in CWSS [5,6,7,8,9]. That is why it is so important to take into account the influence of the human factor on the reliability of technical systems. So far, over 50 different methods of human reliability assessment (HRA) have been presented [4,10,11,12]. In order to classify them, a division into three generations has been proposed [13]:
  • the first generation of HRA covers the years 1970–1990 and includes methods that focus on the quantitative determination of the operator error probability, such as: Technique for Human Error Rate Prediction (THERP), Human Cognition Reliability (HCR), and Human Error Assessment and Reduction Technique (HEART);
  • the second generation of HRA covers the years 1990–2005 and includes methods that are to determine the impact on the level of the operator reliability of contextual factors describing the situation and human cognitive functions such as memory, attention, thinking, and perception, e.g., A Technique for Human Event Analysis (ATHEANA), Simplified Plant Analysis Risk Human Reliability Assessment (SPAR-H), and Cognitive Reliability and Error Analysis Methods (CREAM);
  • the third generation of HRA, which has been developing since 2005, focuses on the use of simulation methods to assess operator reliability, e.g., Nuclear Action Relia-bility Assesment (NARA), Controller Action Reliability Assessment (CARA), and Simulator for Human Error Probability Analysis (SHERPA).
So far, few attempts have been made to adapt these methods in the analysis of the reliability of CWSS, e.g., [13]. The human influence on the reliability of CWSS is often overlooked despite the fact that it is an anthropotechnical system. The publication [14] presents a tool that helps in making decisions for water system operators, which is aimed at reducing the number of operator errors. The publication [15] discusses the role of HRA in reducing human error and drinking water safety. An important criterion for assessing the reliability of the CWSS operator is also the financial aspect [15].
Currently, in world research, the FTA method is used in various fields of science, e.g., for the analysis of the system for controlling the altitude of satellites [16], for biomonitoring [17], and for various types of risk analyzes [18]. The most important research works describing the using of FTA method can be counted in the works of J.D. Andrews’a and T.R. Mossa [19] and the work of W.G. Schneeweiss’a [20]. Decision trees are also used in renewable energy [21] and in industry [22]. The method of fault tree analysis (FTA) is therefore primarily used in the risk and reliability analysis of complex technical systems. Linking the identified events in the FTA structure allows for a good overview of the process safety issues in the fields of: the role and importance of existing technical and organizational measures in the failure prevention tasks; the need for additional technical and organizational solutions that could slow down the development of the most likely failure scenarios; and the impact of technical and organizational changes on the risk level (from tactical and operational positions).
The fault tree analysis (FTA) allows for a graphical representation of cause-and-effect relationships, which is important for a preventive approach to reduce hazards in CWSS and is consistent with the provisions of the EU Directive 2020/2184 [23] which requires that the risk assessment should be carried out in three steps: the supply area for the water intake, then the water supply system, and finally the domestic water systems. The fault tree analysis enables the selection of undesirable event development scenarios. It illustrates the development of the situation from the initiating events to the peak event. The analyzed events are related to each other by means of logic gates. It is possible to determine the probability of individual undesirable events. Thanks to this, it is possible to determine the cause-and-effect relationships between an operator’s error and a given type of failure. To our knowledge, the FTA has not been used so far to assess the work of a CWSS operator. However, it was used in the assessment of the CWSS reliability in other aspects [24,25,26,27].
The aim of the work is to assess the operation of CWSS operator by using FTA tools. The results of the operator reliability assessment of the selected water treatment process are presented based on the probability of operator error.

2. Materials and Methods

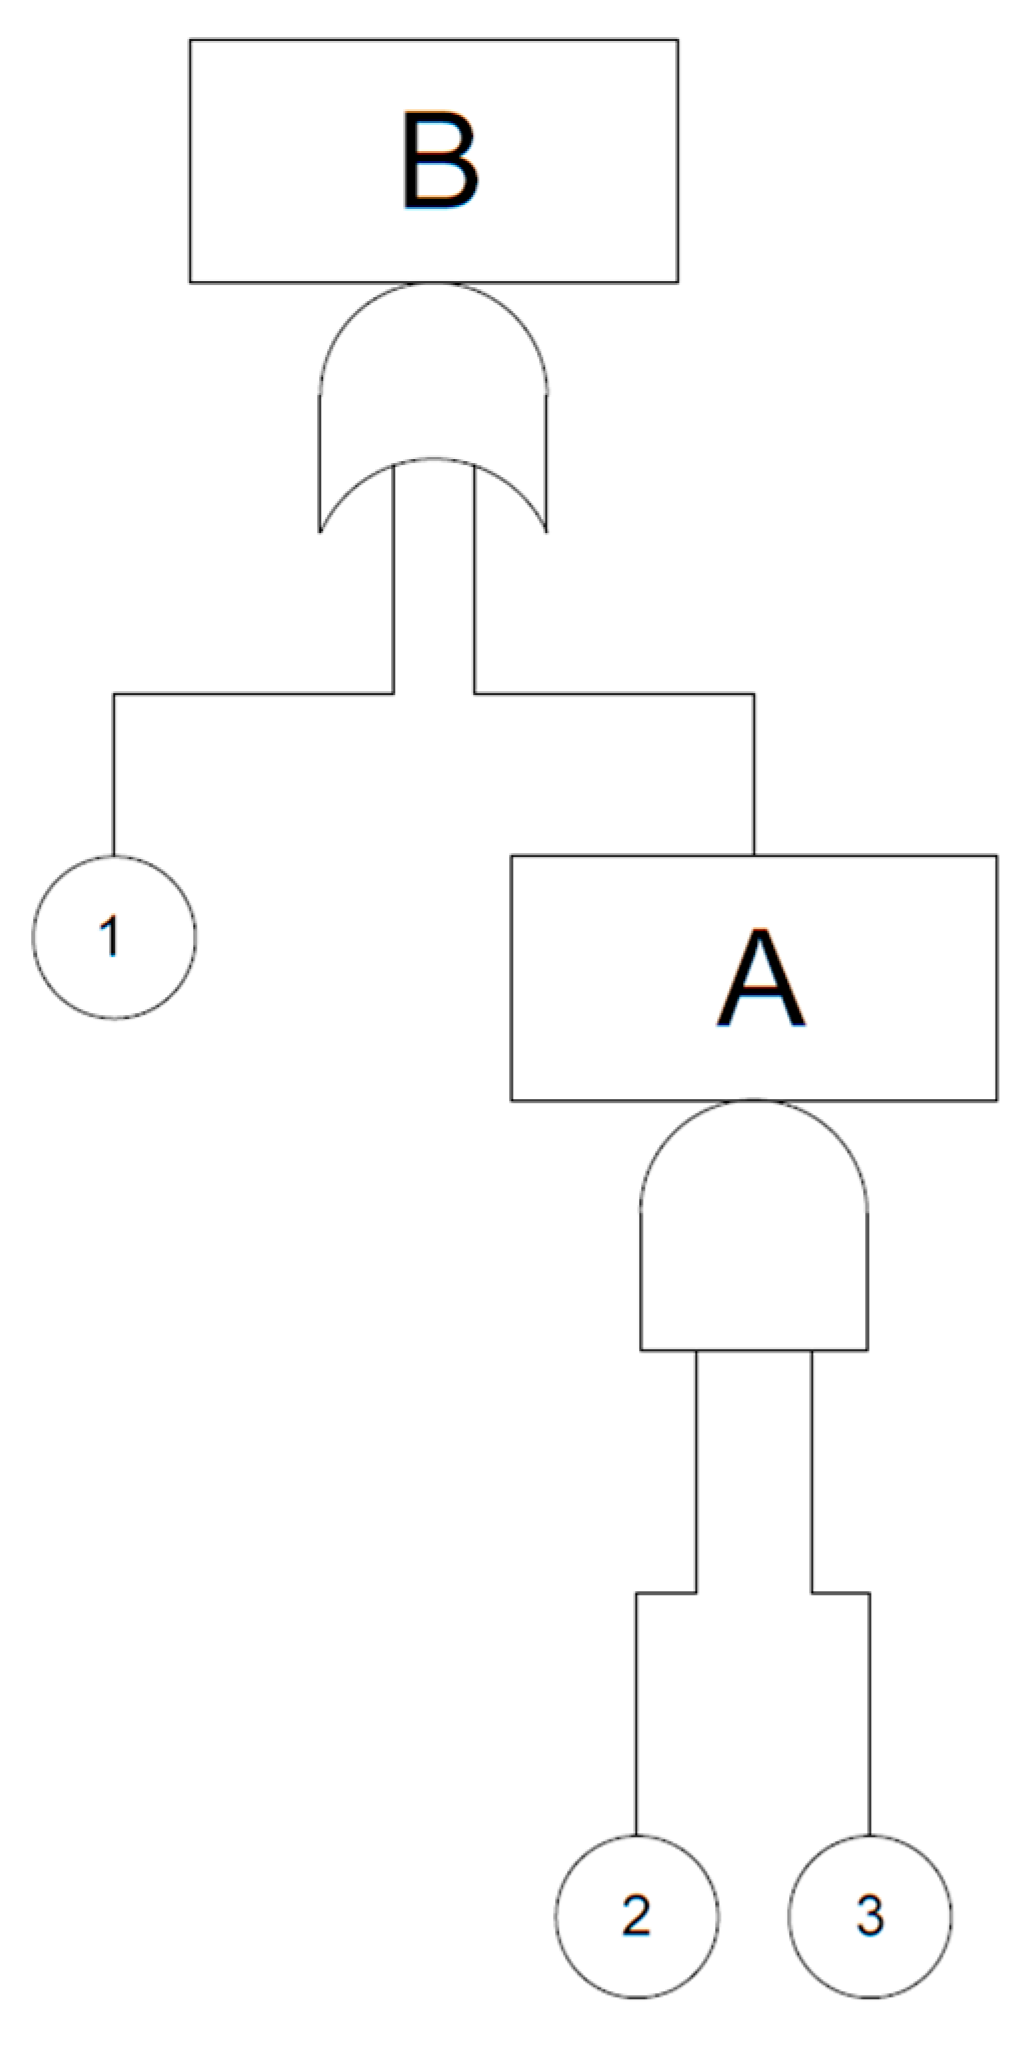
2.1. Failure Trees: Definitions and Schemes

FTA analysis deals with the identification of conditions and factors that cause, may cause, or contribute to the occurrence of a given peak event. Failure trees is a model that describes the relationship between failures of elementary parts of the system, operator errors, and the occurrence of an event related to failure of the system to perform the appropriate function.
The terms used in the FTA are as follows [28,29]:
  • exit—the result of an action or other entry; consequence of the cause. The output can be an event or a state. The output of the combination of appropriate input events represented by the gateway can be either an intermediate event or a peak event. The output can also be an input to an intermediate or peak event;
  • peak event—the result of the combination of all input events. This is the event under which FT is built. The peak event is often equated with the final event or peak exit. The peak event is defined at the start of the analysis and has the highest position in the hierarchy of events;
  • final event—the final result of the combination of all inputs, to intermediate and elementary events;
  • peak output—the output that is tested while building the FT;
  • gate—symbol representing the relationship between the output event and the corresponding inputs. The given gate symbol defines the required type of relationship between the input events that will trigger the output event;
  • cross-section—a group of events that (if all events occur) will cause the peak event to appear;
  • minimum cross-section—the minimum or the smallest set of events that must occur in order to cause a peak event. The non-occurrence of even one of the events in the set will result in the lack of a peak event;
  • event—the occurrence of a condition or action;
  • elementary event—an event or state that cannot be further developed down in the FT construct;
  • basic event—the event located at the bottom of the FT structure;
  • intermediate event—an event that is not a peak or base event. Most often it is the result of one or more basic events and/or another intermediate event;
  • undeveloped event—an event that has no input events, e.g., due to lack of detailed information or is expanded in another analysis, and is considered indivisible in the FTA;
  • single failure—an emergency event which, if it occurs, will result in a failure of the entire system or, irrespective of other events and their combinations, will result in an unfavorable peak event (output);
  • common causal event—various events in the system or in FT that have the same causes of occurrence;
  • common cause—the cause of multiple events;
  • repeated/duplicated event—an event which is an input to more than one previous event.
Table 1 shows the basic symbols used in the FTA method.
The stages of the procedure and all the information needed to use FTA are presented below:
  • description of the system and boundary conditions—it requires to define the so-called peak event that should be clearly and unambiguous, and to define elementary events leading to the peak event;
  • selection of the peak event—it can be one event or group of peak events that will be analyzed using the FTA method;
  • tree structure—it consists in identifying all necessary indirect events and their relationship, sufficient for a peak event to occur and determining their probability;
  • identification of minimum tree sections—the shortest patch from elementary events to the peak event;
  • qualitative analysis—it may be conducted using information on minimum cross-sections;
  • quantitative analysis—which lead to calculating the probability of a peak event.
Therefore, the application of the FTA method requires from the person conducting the analysis a broad qualitative and quantitative knowledge about the functioning of the system. The main limitations of the FTA are:
  • the need to know and identify all indirect events necessary and sufficient for the peak event to occur;
  • the need to know the probability of indirect and elementary events;
  • the need of using the logic gates that define the logical product of events and the logical sum of events; which requires simplifying complex dependencies to simple logic gates.

2.2. The Probability of the Peak Events

The disadvantage of the FTA methodology is the need to obtain the probabilities of elementary events. In the best case, the probability of the occurrence of events can be obtained on the basis of statistical analysis of system operational data. This requires keeping a register of fault reports and their repairs, determining the average repair time and the average time of failure-free operation. The way to obtain the probability of peak event on the basis of system operational data statistical analysis is presented below [31,32].
The OR gate applies to systems with independent events, where the probability of failure is determined from the dependence:
P ( U ) = 1 i = 1 n ( 1 P ( U i ) )
where:
  • P(U)—probability of failure,
  • P(Ui)—probability of failure of the i-th input event.
The following formula is also used to calculate the exit event:
λ = i = 1 λ i
where:
  • λ—failure intensity index, 1/d,
  • λi—failure intensity index of the i-th input event, 1/d.
Probability of failure of the input event:
P ( U i ) = λ i λ i + μ i
where:
  • µi—failure intensity index of the i-th input event, 1/d
Probability of failure of the peak event:
P ( U ) = λ λ + μ
Hence, from Formula (1) it can be obtained that:
P ( U ) = 1 i = 1 n μ i λ i + μ i
Comparing Equations (4) and (5) and using Equation (2), the following transformations were performed:
λ λ + μ = 1 i = 1 n μ i λ i + μ i λ λ + μ = 1 i = 1 n μ i i = 1 n ( λ i + μ i ) λ λ + μ = i = 1 n ( λ i + μ i ) i = 1 n μ i i = 1 n ( λ i + μ i ) λ i = 1 n ( λ i + μ i ) = ( λ + μ ) [ i = 1 n ( λ i + μ i ) i = 1 n μ i λ [ i = 1 n ( λ i + μ i ) ( i = 1 n ( λ i + μ i ) + i = 1 n μ i ) ] = μ [ i = 1 n ( λ i + μ i ) i = 1 n μ i ] μ = λ [ i = 1 n ( λ i + μ i ) i = 1 n ( λ i + μ i ) + i = 1 n μ i ] i = 1 n ( λ i + μ i ) i = 1 n μ i
A formula was obtained that allows the calculation of μ for the OR gate:
μ = i = 1 n λ i i = 1 n μ i i = 1 n ( λ i + μ i ) i = 1 n μ i
An output event from an AND gate occurs when all output events have occurred, so the failure probability for an AND gate is calculated from the formula:
P ( U ) = i = 1 n P ( U i )
In addition, for the AND gate, the equality holds:
μ = i = 1 n μ i
Comparing the dependencies (4) and (8) and using Formula (9), the following transformations were performed:
i = 1 n λ i λ i + μ i = μ + λ μ μ + λ i = 1 n λ i ( μ + λ ) = λ i = 1 n ( λ i + μ i ) i = 1 n λ i μ + i = 1 n λ i λ = λ i = 1 n ( λ i + μ i ) i = 1 n λ i μ = λ ( i = 1 n ( λ i + μ i ) i = 1 n λ i )
The formula for calculating λ for the AND gate was obtained:
λ = i = 1 n μ i i = 1 n λ i i = 1 n ( λ i + μ i ) i = 1 n λ i
In order to show the calculation method, the values of µ and λ for events A and B were determined, based on the above equations and the example fault tree shown in Figure 1. A tree consisting of three elementary events was considered, for which the values of µ and λ are presented in Table 2.
For gate “A” (AND):
μ A = i = 1 n μ i = μ 2 + μ 3 = 0.38 + 0.36 = 0.74   1 d
λ A = i = 1 n μ i i = 1 n λ i i = 1 n ( λ i + μ i ) i = 1 n λ i = ( μ 2 + μ 3 ) λ 2 · λ 3 ( λ 2 + μ 2 ) ( λ 3 + μ 3 ) λ 2 · λ 3   = ( 0.38 + 0.36 ) 0.0050 · 0.0022 ( 0.0050 + 0.38 ) ( 0.0022 + 0.36 ) 0.0050 · 0.0022 = 0.000058   1 d
For gate “B” (OR):
λ = i = 1 λ i = λ 1 + λ A = 0.0027 + 0.000058 = 0.002758   1 d
μ = i = 1 n λ i i = 1 n μ i i = 1 n ( λ i + μ i ) i = 1 n μ i = ( λ 1 + λ A ) · μ 1 · μ A ( λ 1 + μ 1 ) ( λ A + μ A ) μ 1 · μ A   = ( 0.0027 + 0.000058 ) · 0.24 · 0.74 ( 0.0027 + 0.24 ) ( 0.000058 + 0.74 ) 0.24 · 0.74 = 0.24   1 d
In the case when we have to estimate the probability of rare events, we can use subjective methods of probability assessments, i.e., obtaining knowledge from experts or system operators. While assessing the reliability of the CWSS operator, one of the main problems is the statistical description of human performance. Factors that affect the level of human reliability include health and psychophysical condition, fatigue, routine, and stress. Therefore, the CREAM method was used to analyze and estimate the probability of human error probability (which describes the input events).
In order to organize the methodological approach, it has been shown as a diagram in Figure 2.

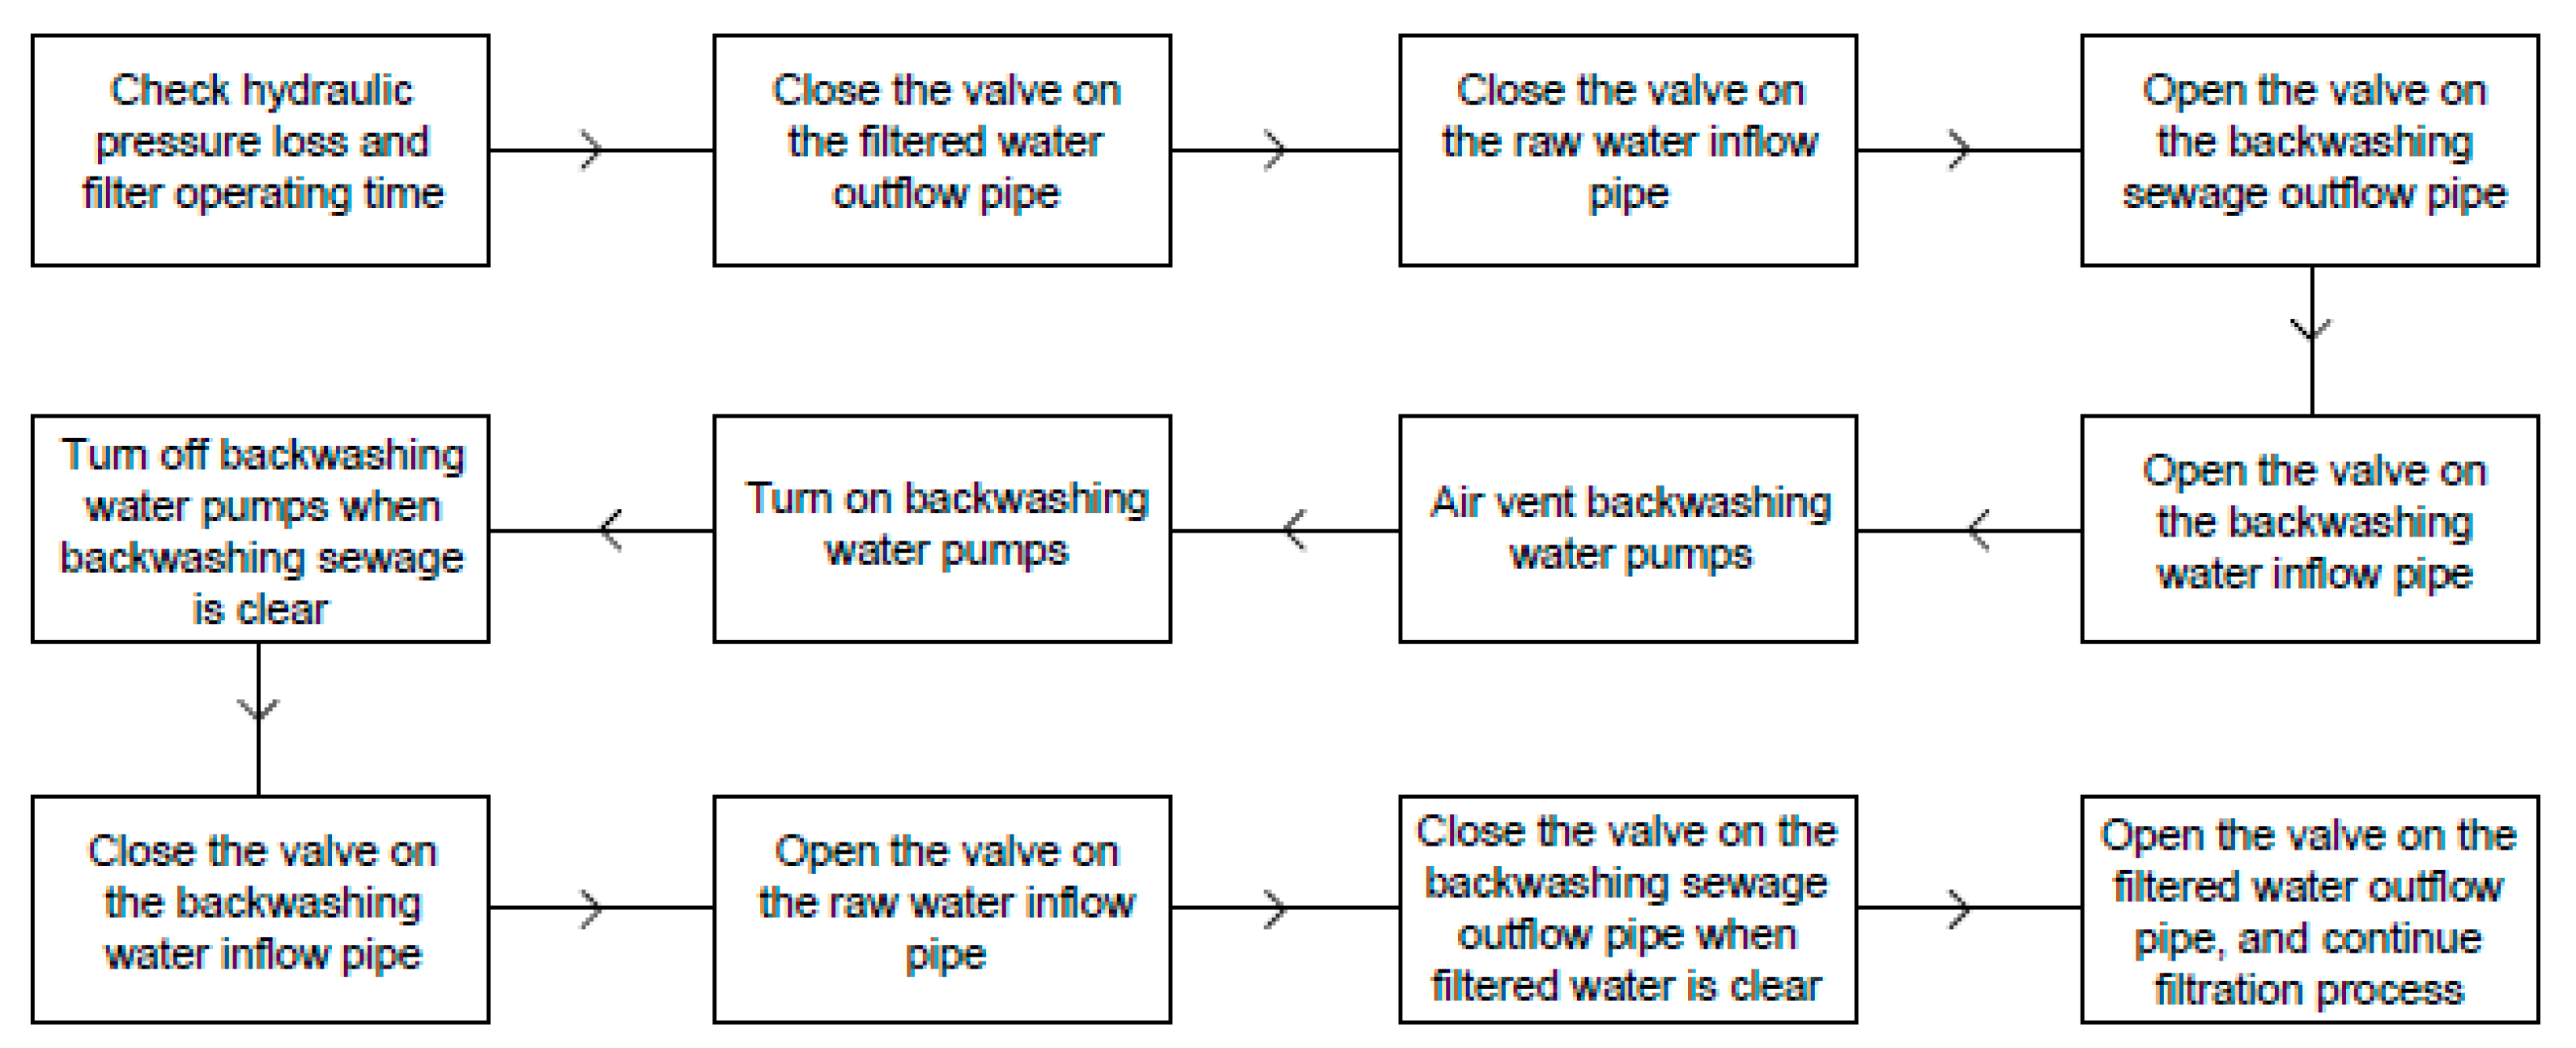
2.3. Description of the Research Object

The presented method of assessing the reliability of the CWSS operator was used in the application example, which included the process of rinsing post-hast filters at a water treatment plant. Water filtration is one of the basic technological processes of water treatment [33]. In this process, natural and post-coagulation suspensions are removed from the water as a result of water filtration through a porous material, e.g., sand, gravel, and anthracite bed. During operation, the filter filling becomes contaminated with the so-called clogging of the bed due to the retention of the removed particles. One of the most important operating procedures for filters is the rinsing process, aimed at restoring the filter bed to its original condition and reusing it. The operator responsible for controlling the filter’s operation, based on the readings of operating parameters, i.e., filter operation time and the amount of losses, water pressure on the filter, makes a decision about the necessity to rinse the filter. The flowchart of the rinsing procedure is shown in Figure 3. Due to the fact that the filtration process is one of the basic and key technological stages of water treatment, in the event of an operator making a mistake, the stable operation of the filter facilities is at risk, which may affect the operation of the entire water treatment plant. Incorrectly carried out rinsing procedure may result in limiting the production efficiency of the filter, the penetration of the removed contaminants to the earlier or subsequent stages of treatment, or damage to the filter bed [33].
The use of the FTA method allows for the identification of elementary events and the determination of the cause-and-effect relationships between them, leading to the occurrence of a peak event. The analysis covers both the qualitative and quantitative aspects.

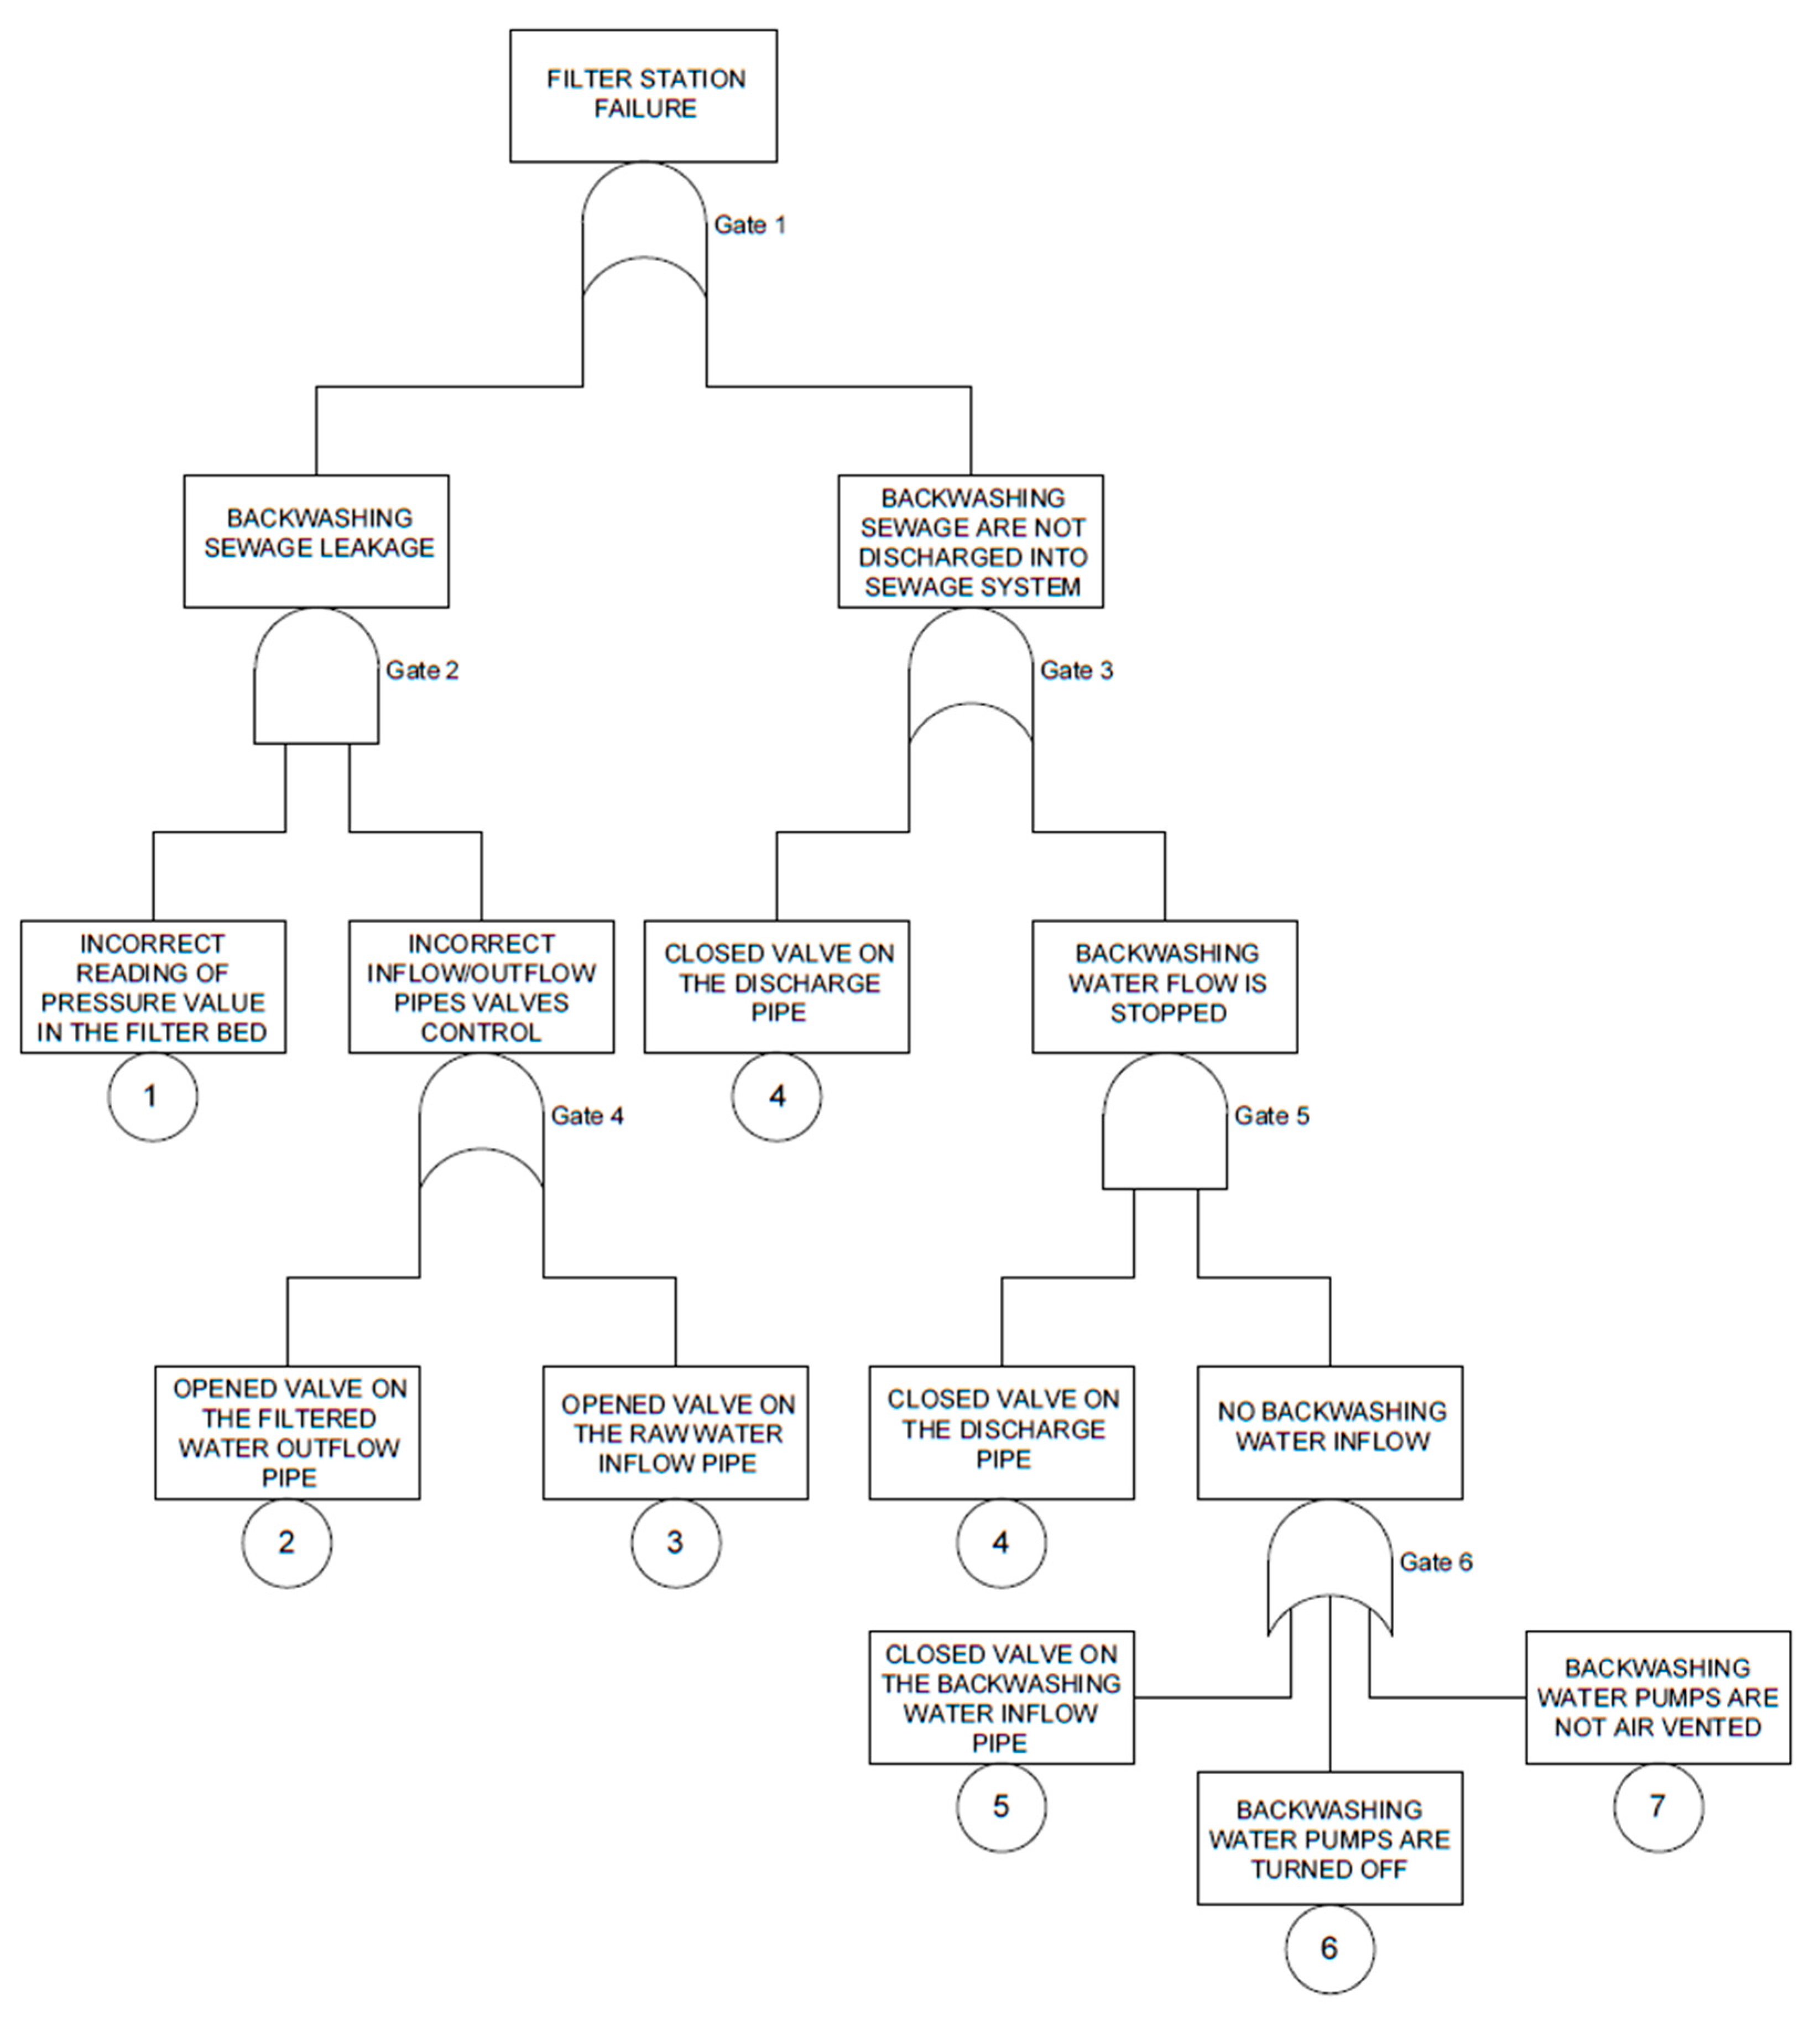
3. Results and Discussion

On the basis of Figure 4, a failure tree was prepared for the peak event of the filter station failure, resulting from an operator’s error during the filter washing procedure. In the analysis of operator reliability, there are great difficulties in precisely assessing the impact of the human factor on the level of system operation safety. Because of this, elementary events are determined by the human error probability, which was determined using the CREAM method [34] during own research on operator reliability in CWSS. These results were obtained on the basis of research on a group of operators for selected operator processes in CWSS, including filter operation control and pump operation control. The average values of the operator’s error probability were adopted for the calculations. These values are similar to the probability of operator error determined using the CREAM method presented for other industries, e.g., land transport, sea transport, or aviation presented in the works [8,35,36]. Table 3 shows the adopted values.
The calculation procedure for the FTA tree from Figure 4 is presented below, for the probability values of elementary events from Table 3:
PG6 = 1 − 1 − P5) (1 − P6) (1 − P7) = 1 − (1 − 0.0147) (1 − 0.0137) (1 − 0.0137) = 0.0415.
PG5 = P4∙PG6 = 0.0147∙0.0415 = 0.00061.
PG4 = 1 − (1 − P2) (1 − P3) = 1 − (1 − 0.0147) (1 − 0.0147) = 0.02918.
PG3 = 1 − (1 − P4) (1 − PG5) = 1 − (1 − 0.0147) (1 − 0.00061) = 0.0153.
PG2 = 1 − (1 − P1) (1 − PG4) = 1 − (1 − 0.0147) (1 − 0.002918) = 0.0434.
PG1 = 1 − (1 − PG2) (1 − PG3) = 1 − (1 − 0.0434) (1 − 0.0153) = 0.0580.
The probability of a peak event occurring is 0.0580. The obtained probability value means that the chance of filter station failure is about 6%. This value can be interpreted in a way that on average in 6 out of 100 cases of filter backwashing operation, filter station failure will occur as a result of incorrect operator actions. In the case of backwashing filters every 3 days, the value of 6% shows that about seven times a year the operator will make mistakes that may result in filter station failure.
The use of FTA makes it possible to determine the probability of a peak event and indirect events included in the tree, which is important information for the assessment of the impact of individual indirect events on the occurrence of a peak event. The dependencies between individual events are expressed by logic gates. The use of FTA allows for a better identification of the existing threats in CWSS and the reflection of cause-and-effect relationships between them. This is especially important for small and medium-sized CWSS, where knowledge about the functioning of the system is incomplete or uncertain, mainly due to financial and staff constraints. In general, there are three groups of factors that constitute the cause of undesirable events in CWSS: technical, human, and environmental factors. Most water companies are prepared to deal with the consequences of regular operational failures of water systems. The current problem is to determine the impact of human and environmental factors on the safety of the system. The use of FTA enables the cause-and-effect analysis of errors resulting from human activity leading to consumption of water of inadequate quality or a lack of water supply at the moment of failure and in the future as a result of escalation of undesirable events (domino effect). The research allowed for a detailed understanding of the cause-and-effect relationships between individual events in the selected CWSS process, i.e., the filter backwashing process. This is undoubtedly a new approach in the analysis of the reliability of the water supply and contributes to the development of knowledge in this field. Such a preventive approach to the existing threats meets the current standards regarding the safety of drinking water [23].
However, in this case, failure of the filter station does not have to automatically have negative consequences for water consumers. CWSS usually have protective barriers for water consumers which work in the first hours of a potential failure at the WTP:
  • water quality monitoring carried out at the intake and during treatment (at the WTP);
  • the possibility of closing the intake and using the water accumulated in water tanks at WTP and in network water tanks;
  • launching the water supply from alternative sources;
  • biomonitoring based on indicator organisms (mussels).
There can be considered implementing preventive actions to reduce the probability of operator error, e.g., periodic training of operators, increasing the ergonomics of the workstation, etc. The CWSS operator should be characterized by appropriate:
  • skill-reflexive performance of activities acquired as a result of practical experience (training) of activities on the basis of patterns of conduct;
  • rule—performing less obvious actions according to specific rules, developed for scenarios of the system operation;
  • knowledge—acting in situations where practical patterns or rules of conduct are not directly applicable; it becomes important to recognize a different situation, diagnose the system condition and make decisions.
As the result of the increase of using the IT techniques and automation of process in the functioning of technical systems, from the operator in addition to knowing the mechanisms of operational processes, knowledge and skills of efficient handling of IT supporting systems means is required. These means are computers equipped with external devices, enabling the operator to obtain information to perform the tasks and make execution decisions. Permanent and continuous improvement of operators’ skills in this area is required.
The study analyzes the probability of operator error of a water supply system in terms of the need to stop the water supply to the city (as a result of lack of technological possibilities of water treatment). According to the basic definition, risk is a function of the probability of an undesirable event and the related losses [4]. So, the calculated probability of the peak event cannot be associated directly with the risk, but after estimating the potential losses (such as health effects, interruptions or limitations in the water supply, and financial losses for water companies or water consumers), it can be the starting point in the analysis of the expected value of losses, which is interpreted as risk.

4. Conclusions

The paper presents calculation methods with the use of logical trees in order to extend the research methodology and practical applications in relation to the operator of the water supply system. For this purpose, the existing methodologies from other fields of knowledge were adapted and new considerations in this field were presented. Growing requirements of CWSS users are prompting water producers to minimize the probability of lack of water supply. Ensuring proper operation of CWSS requires a comprehensive approach, in which none of the elements of the system affecting the safety of water consumers is ignored. We think that this research is one of the first of such a detailed study on the reliability of an CWSS operator on the example of filters station operation, in which an attempt was made to assess both qualitatively and quantitatively. Automation of water treatment processes is more and more common, while the role of human operator is still very important.
The study showed that, based on the FTA, it is possible to indicate the greatest threats to the functioning of the water supply system operator and their effects. FTA allows for the identification of elementary events leading to an emergency event using the so-called “Think backwards”. The existing threats were identified in detail and the cause-and-effect relationships between them were reflected. The presented method was used in a practical way for the development of the fault tree for the operator actions during water filter backwashing procedure. The probability of initiating events was determined by the CREAM method during own research on operator reliability in CWSS.
Based on the analysis, it was found that the operator fulfills its task of maintaining the continuity of water treatment. This is evidenced by the obtained probability value at the level of 0.0580. This should be understood as a measure of predictability as to the occurrence of the “filter station failure” peak event. The advantage of the operator reliability assessment method with the use of logical trees is that they are carried out according to a defined scheme and based on unambiguous assumptions. This enables a quantitative comparison of the results obtained. This is the main distinguishing feature from intuitive, implicit, or qualitative assessments.

Author Contributions

Conceptualization, K.B., D.S., J.Ż. and B.T.-C.; methodology, K.B., D.S., J.Ż. and B.T.-C.; validation K.B., D.S., J.Ż. and B.T.-C.; formal analysis, K.B., D.S., J.Ż. and B.T.-C.; investigation, K.B., D.S., J.Ż. and B.T.-C.; writing—original draft preparation, K.B., D.S., J.Ż. and B.T.-C.; writing—review and editing, K.B. All authors have read and agreed to the published version of the manuscript.

Funding

This research received no external funding.

Data Availability Statement

Not applicable.

Acknowledgments

The authors thank the reviewers for their feedback, which helped to improve the manuscript quality.

Conflicts of Interest

The authors declare no conflict of interest.

References

  1. Tchórzewska-Cieślak, B.; Pietrucha-Urbanik, K.; Eid, M. Functional Safety Concept to Support Hazard Assessment and Risk Management in Water-Supply Systems. Energies 2021, 14, 947. [Google Scholar] [CrossRef]
  2. Boryczko, K.; Piegdoń, I.; Szpak, D.; Żywiec, J. Risk Assessment of Lack of Water Supply Using the Hydraulic Model of the Water Supply. Resources 2021, 10, 43. [Google Scholar] [CrossRef]
  3. Kordana, S.; Słyś, D. Decision Criteria for the Development of Stormwater Management Systems in Poland. Resources 2020, 9, 20. [Google Scholar] [CrossRef] [Green Version]
  4. Rak, J.; Tchórzewska-Cieślak, B. Metody Analizy i Oceny Ryzyka w Systemie Zaopatrzenia w Wodę; Oficyna Wydawnicza Politechniki Rzeszowskiej: Rzeszów, Poland, 2005. (In Polish) [Google Scholar]
  5. Wu, S.; Hrudey, S.; French, S.; Bedford, T.; Soane, E.; Pollard, S. A role for human reliability analysis (HRA) in preventing drinking water incidents and securing safe drinking water. Water Res. 2009, 43, 3227–3238. [Google Scholar] [CrossRef] [PubMed] [Green Version]
  6. Helmreich, R.L. On error management: Lessons from aviation. Br. Med. J. 2000, 320, 781–785. [Google Scholar] [CrossRef] [PubMed] [Green Version]
  7. Kariuki, S.G.; Lowe, K. Integrating human factors into process analysis. Reliab. Eng. Syst. Saf. 2007, 92, 1764–1773. [Google Scholar] [CrossRef]
  8. Ren, J.; Jenkinson, I.; Wang, J.; Xu, D.L.; Yang, J.B. A methodology to model causal relationships in offshore safety assessment focusing on human and organisational factors. J. Saf. Res. 2008, 39, 87–100. [Google Scholar] [CrossRef] [PubMed]
  9. Tanga, Y.; Wu, S.; Miao, X.; Pollard, S.J.T.; Hrudey, S. Resilience to evolving drinking water contamination risks: A human error prevention perspective. J. Clean. Prod. 2013, 57, 228–237. [Google Scholar] [CrossRef]
  10. Adhikari, S.; Bayley, C.; Bedford, T.; Busby, J.; Cliffe, A.; Devgun, G.; Eid, M.; French, S.; Keshvala, R.; Pollard, S.J.T.; et al. Human Reliability Analysis: A Review and Critique; Technical Report; University of Manchester: Manchester, UK, 2021. [Google Scholar]
  11. Havlikova, M.; Jirgl, M.; Bradac, Z. Human reliability in Man-Machine Systems. Procedia Eng. 2015, 100, 1207–1214. [Google Scholar] [CrossRef] [Green Version]
  12. Dsouza, N.; Lu, L. A Literature Review on Human Reliability Analysis Techniques Applied for Probabilistic Risk Assessment in the Nuclear Industry. In Proceedings of the AHFE 2016 International Conference on Human Factors in Energy: Oil, Gas, Nuclear and Electric Power Industries, Walt Disney World, FL, USA, 27–31 July 2016; Volume 495, pp. 41–56. [Google Scholar]
  13. Żywiec, J.; Tchórzewska-Cieślak, B. Use of the CREAM method for the assessment of operator reliability in the process of backwashing filters at a water treatment station. J. Konbin 2020, 50, 115–133. [Google Scholar] [CrossRef]
  14. Kozłowski, E.; Mazurkiewicz, D.; Kowalska, B.; Kowalski, D. Binary Linear Programming as a Decision-Making Aid for Water Intake Operators. In Proceedings of the Intelligent Systems Production, Engineering and Maintenance (ISPEM 2017), Wroclaw, Poland, 28–29 September 2017; Burduk, A., Mazurkiewicz, D., Eds.; Springer: Berlin/Heidelberg, Germany, 2018; pp. 199–208. [Google Scholar]
  15. Kowalik, P.; Rzemieniak, M. Binary Linear Programming as a Tool of Cost Optimization for a Water Supply Operator. Sustainability 2021, 13, 3470. [Google Scholar] [CrossRef]
  16. Barua, A.; Sinha, P.; Khorasani, K. On the fault diagnosis and failure analysis in the satellite attitude control subsystem. In Proceedings of theSpace OPS 2004 Conference, Montreal, QC, Canada, 17–21 May 2004; p. 266. [Google Scholar]
  17. Siontorou, C.G.; Batzias, F.A. Error identification/propagation/remediation in biomonitoring surveys—A knowledge-based approach towards standardization via fault tree analysis. Ecol. Indic. 2011, 11, 564–581. [Google Scholar] [CrossRef]
  18. Ferdous, R.; Khan, F.; Veitch, B.; Amyotte, P.R. Methodology for Computer Aided Fuzzy Fault Tree Analysis. Process Safety and Environmental Protection; Elsevier: Amsterdam, The Netherlands, 2009; Volume 87, pp. 217–226. [Google Scholar]
  19. Andrews, J.D.; Moss, T.R. Reliability and Risk Assessment; Longman Scientific & Technical: London, UK, 1993. [Google Scholar]
  20. Schneeweiss, W.G. The Fault Tree Method; LiLoLe-Verlag GmbH (Publ. Co., Ltd.): Hagen, Germany, 1999. [Google Scholar]
  21. Marquez, F.P.G.; Perez, J.M.P.; Marugan, A.P.; Papaelias, M. Identification of critical components of wind turbines using FTA over the time. Renew. Energy 2016, 87, 869–883. [Google Scholar] [CrossRef] [Green Version]
  22. Yazdi, M. Hybrid Probabilistic Risk Assessment Using Fuzzy FTA and Fuzzy AHP in a Process Industry. J. Fail. Anal. Preven. 2017, 17, 756–764. [Google Scholar] [CrossRef]
  23. Directive (EU) 2020/2184; The Quality of Water Intended For Human Consumption. The European Parliament: Strasbourg, France, 16 December 2020.
  24. Tchórzewska-Cieślak, B.; Pietrucha-Urbanik, K.; Papciak, D. An Approach to Estimating Water Quality Changes in Water Distribution Systems Using Fault Tree Analysis. Resources 2019, 8, 162. [Google Scholar] [CrossRef] [Green Version]
  25. Taheriyoun, M.; Moradinejad, S. Reliability analysis of a wastewater treatment plant using fault tree analysis and Monte Carlo simulation. Environ. Monit. Assess. 2015, 187, 4186. [Google Scholar] [CrossRef] [PubMed]
  26. Lindhe, A.; Rosen, S.; Norberg, T.; Bergstedt, O. Fault tree analysis for integrated and probabilistic risk analysis of drinking water systems. Water Res. 2009, 43, 1641–1653. [Google Scholar] [CrossRef] [PubMed]
  27. Kim, T.; Kim, K.; Hyung, J.; Koo, J. Integrated water suspension risk assessment using fault tree analysis and genetic algorithm in water supply systems. Desalination Water Treat. 2021, 227, 104–115. [Google Scholar] [CrossRef]
  28. Rausand, M.; Hoyland, A. System Reliability Theory—Models, Statistical Methods, and Applications; Wiley-Interscience: Hoboken, NJ, USA, 2004. [Google Scholar]
  29. Rosén, L.; Bergstedt, O.; Lindhe, A.; Pettersson, T.J.R.; Johansson, A.; Norberg, T. Comparing Raw Water Options to Reach Water Safety Targets Using an Integrated Fault Tree Model. In Water Safety Plans: Global Experiences and Future Trends; The International Water Association Conference: London, UK, 2008. [Google Scholar]
  30. BS EN 61025:2007; Fault Tree Analysis (FTA). British Standards Institution: London, UK, 2017.
  31. Tchórzewska-Cieślak, B.; Boryczko, K.; Eid, M. Failure scenarios in water supply system by means of fault tree analysis. In Advances in Safety, Reliability and Risk Management; Grall, A., Bérenguer, C., Soares, C.G., Eds.; Taylor & Francis Group: London, UK, 2012; pp. 2492–2499. [Google Scholar]
  32. Helmer, G.; Wong, J.; Slagell, M.; Honavar, V.; Miller, L.; Lutz, R. A Software Fault Tree Approach to Requirements Analysis of an Intrusion Detection System; Springer: London, UK, 2002. [Google Scholar]
  33. Świderska-Bróż, M.; Kowal, A.L. Oczyszczanie Wody; Wydawnictwo Naukowe PWN: Warsaw, Poland, 2007. (In Polish) [Google Scholar]
  34. Hollnagel, E. Cognitive Reliability and Error Analysis Method—CREAM; Elsevier: Amsterdam, The Netherlands, 1998. [Google Scholar]
  35. Jin, J.; Yuan, L. A Fuzzy and Bayesian Network CREAM Model for Human Error Probability Quantification of the ATO System. In Proceedings of the 4th International Conference on Electrical and Information Technologies for Rail Transportation (EITRT), Qingdao, China, 25–27 October 2020; Springer: Singapore; pp. 567–576. [Google Scholar]
  36. Guo, Y.; Sun, Y. Human Reliability Quantification in Flight through a Simplified CREAM Method. In Advances in Human Factors of Transportation; Springer: Cham, Switzerland, 2019; pp. 762–773. [Google Scholar]
Figure 1. Example of fault tree.
Energies 15 04416 g001
Figure 2. Scheme of the performed analysis.
Energies 15 04416 g002
Figure 3. Filter backwashing procedure diagram.
Energies 15 04416 g003
Figure 4. Fault tree for the operator actions during water filter backwashing procedure.
Energies 15 04416 g004
Table 1. Basic symbols used in the FTA method [30].
SymbolNameDescription
Energies 15 04416 i001An elementary eventThe lowest level event for which the exit probability or reliability information is known.
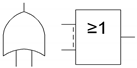
Energies 15 04416 i002Gate ORAn exit event occurs if any of the input events occur.
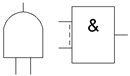
Energies 15 04416 i003Gate AND An exit event occurs if all of the input events occur.
Table 2. Assumed values of µ and λ for elementary events.
Elementary Eventλ [1/Day]µ [1/Day]
10.00270.24
20.00500.38
30.00220.36
Table 3. The probability of elementary events.
Elementary EventSituation DescriptionOperator Error Probability
1Filter controlIncorrect reading of pressure value in the filter bed0.0147
2Opened valve on the filtered water outflow pipe0.0147
3Opened valve on the raw water inflow pipe0.0147
4Closed valve on the sewage discharge pipe0.0147
5Closed valve on the backwashing water inflow pipe0.0147
6Pumps controlBackwashing water pumps are turned off0.0137
7Backwashing water pumps are not air vented0.0137
Publisher’s Note: MDPI stays neutral with regard to jurisdictional claims in published maps and institutional affiliations.

